L&B Realty Advisors, LLP Client Focused. Performance Driven. US Property Investment 5 Ws and 1 H
|
|
|
- Susan Tucker
- 5 years ago
- Views:
Transcription


1 L&B Realty Advisors, LLP Client Focused. Performance Driven US Property Investment 5 Ws and 1 H November 2017


2 Presenter Biography Eric R. Smith, Executive Vice President, Business Development Mr. Smith s focus is consultant relations, product development and new investors for L&B s fund and separate account strategies. Prior to his role in business development, Mr. Smith headed up the office and industrial asset management department and was responsible for the investment strategy and performance for $1.17 billion in office and $120 million in industrial assets. When Mr. Smith began his career at L&B, he served in the acquisitions department as an analyst and then as an associate director responsible for sourcing, analyzing, and closing property acquisitions for the east coast of the United States. While in that capacity, he closed $118 million in acquisitions and $160 million in office dispositions. Prior to joining L&B, Mr. Smith was a founding member and managing principal of Humphrey & Smith, L.L.C., a commercial real estate appraisal firm in Fort Walton Beach, Florida. Mr. Smith holds a Bachelor of Science degree in Business Administration from the University of Central Florida. 2
3 US Property Investment Keys to Success Invest for current and future long-term income and increasing cash dividend (Why) Employ disciplined and consistent acquisition strategy over time (When) Start now (Who) Acquire high-quality true core assets (What) In the best locations in major markets (Where) Structure Properly and Actively Asset Manage (How) = Good investment performance and increasing cash yield to pay future liabilities 3
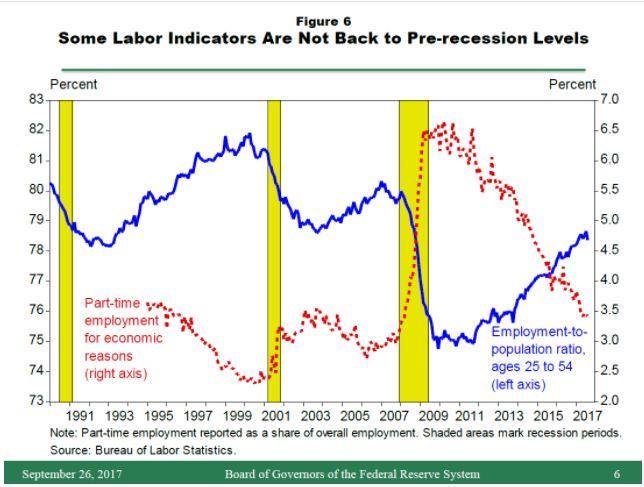
4 US Economy Stable Real GDP 2 to 2.6% growth (annual) Employment 1 to 1.5% growth (annual) 4.5% Unemployment Wages Growing 3.5% (annual) 4
5 US Economy Stable Consumer Confidence 95.1, is good Up 16% over Consumer Spending Growing, 69% of RDGP Interest Rates (10-yr) Currently stable at 2.3% Expect bp increase next 3 yrs Inflation 1.7%, expected trend to 2.0% by
6 $20.0 $18.0 $16.0 $14.0 $12.0 $10.0 $8.0 $6.0 $4.0 $2.0 $- U.S. Real GDP 2.3% 2.6% 2.0% Real GDP ($Billions) Real GDP Growth (%) 5.0% 4.0% 3.0% 2.0% 1.0% 0.0% -1.0% -2.0% -3.0% -4.0% Sources: L&B Realty Advisors, LLP: ULI Real Estate Consensus Forecast April
7 U.S. Real GDP 7
8 US Employment 155, , % 150, , % 145, % 140, , % 130, , % 4.5% 4.6% 4.0% 2.0% 120, % Sources: L&B Realty Advisors, LLP: ULI Real Estate Consensus Forecast April 2017 Total Employed (Thousands) Unemployment Rate 8
9 US Employment 9
10 Jan-02 May-02 Sep-02 Jan-03 May-03 Sep-03 Jan-04 May-04 Sep-04 Jan-05 May-05 Sep-05 Jan-06 May-06 Sep-06 Jan-07 May-07 Sep-07 Jan-08 May-08 Sep-08 Jan-09 May-09 Sep-09 Jan-10 May-10 Sep-10 Jan-11 May-11 Sep-11 Jan-12 May-12 Sep-12 Jan-13 May-13 Sep-13 Jan-14 May-14 Sep-14 Jan-15 May-15 Sep-15 Jan-16 May-16 Sep-16 Jan-17 May-17 Sep-17 Avg. Hourly Earnings YoY Change 5.5% US Wages Growing 5.0% 4.5% 4.0% 3.6% 3.5% 3.0% 2.5% 2.0% 1.5% 1.0% Sources: L&B Realty Advisors, LLP; Federal Reserve Bank of Atlanta 10
11 Jan-02 Jun-02 Nov-02 Apr-03 Sep-03 Feb-04 Jul-04 Dec-04 May-05 Oct-05 Mar-06 Aug-06 Jan-07 Jun-07 Nov-07 Apr-08 Sep-08 Feb-09 Jul-09 Dec-09 May-10 Oct-10 Mar-11 Aug-11 Jan-12 Jun-12 Nov-12 Apr-13 Sep-13 Feb-14 Jul-14 Dec-14 May-15 Oct-15 Mar-16 Aug-16 Jan-17 Jun-17 Index 1966 = US Consumer Confidence Source: University of Michigan Consumer Sentiment Index 11
12 US Consumer Spending 69.5% 69.0% 68.5% 68.0% 67.5% 67.0% 66.5% 66.0% 65.5% 65.0% 64.5% Personal Consumption Expenditures ($Billions) PCE as % of GDP Source: L&B Realty Advisors, LLP; Bureau of Economic Analysis $14,000 $12,000 $10,000 $8,000 $6,000 $4,000 $2,000 $0 12
13 US Retail Sales $7,000 $6,000 $5,000 $4,000 $3,000 $2,000 $1,000 $ Retail Sales (in $Billions) e-commerce Sales Retail Sales Growth 10.0% 8.0% 6.0% 4.0% 2.0% 0.0% -2.0% -4.0% -6.0% -8.0% Sources: L&B Realty Advisors, LLP, Moody s Economy.com 13

14 US Consumer Spending Source: 14
15 US Interest Rates $5,000 $4,500 $4,000 $3,500 $3,000 $2,500 $2,000 $1,500 $1,000 $500 $0 Federal Reserve Taper -$1.07 Trillion 24% reduction 2.8% 2.4% 3.2% 14% 12% 10% 8% 6% 4% 2% 0% Federal Reserve Assets ($ Billion) Sources: Federal Reserve Board ( ULI Real Estate Consensus Forecast April yr Constant Maturity Treasury 15
16 Jan-02 Jun-02 Nov-02 Apr-03 Sep-03 Feb-04 Jul-04 Dec-04 May-05 Oct-05 Mar-06 Aug-06 Jan-07 Jun-07 Nov-07 Apr-08 Sep-08 Feb-09 Jul-09 Dec-09 May-10 Oct-10 Mar-11 Aug-11 Jan-12 Jun-12 Nov-12 Apr-13 Sep-13 Feb-14 Jul-14 Dec-14 May-15 Oct-15 Mar-16 Aug-16 Jan-17 Jun-17 US Inflation (Core CPI) 3.5% 3.0% 2.5% 2.0% 1.5% 1.0% 1.7% 0.5% 0.0% Source: 16

17 US Inflation 17

18 US Inflation 18
19 WHY? Current and Future Income and cash yield 19
20 NCREIF (NPI) Indices vs 10-yr CMT 22% 20% 18% 16% 14% 12% 10% 8% 6% 4% -2% 0% 2% -4% -6% -8% -10% -12% -14% -16% -18% -20% -22% -24% 10-yr Constant Maturity Treasury NPI Income NPI Appreciation NPI Total Sources: L&B Realty Advisors, LLP; NCREIF 20
21 % 16% 14% 12% 10% 8% 6% 4% 2% 0% -2% -4% -6% -8% -10% -12% -14% -16% -18% -20% -22% -24% NCREIF (NPI) Appreciation vs 10-yr CMT 10-yr Constant Maturity Treasury NPI Appreciation Sources: L&B Realty Advisors, LLP; NCREIF 21
22 % NCREIF (NPI) Income vs 10-yr CMT 14% 12% 10% 8% 6% 4% 2% 0% Sources: L&B Realty Advisors, LLP; NCREIF 10-yr Constant Maturity Treasury NPI Income 22
23 WHEN? Capital Market Conditions favorable Stable equity Debt readily available Investment Timing 23
24 US Sale & JV Transactions >$25mm, in $Billions Year Office Apartment Retail Industrial Total YTD Sep-16 $81 $83 $32 $22 $135 YTD Sep-17 $72 $72 $22 $28 $121 % Change -11% -13% -31% 27% -10% Sources: L&B Realty Advisors, LLP; Real Capital Analytics 24
25 1Q83 1Q84 1Q85 1Q86 1Q87 1Q88 1Q89 1Q90 1Q91 1Q92 1Q93 1Q94 1Q95 1Q96 1Q97 1Q98 1Q99 1Q00 1Q01 1Q02 1Q03 1Q04 1Q05 1Q06 1Q07 1Q08 1Q09 1Q10 1Q11 1Q12 1Q13 1Q14 1Q15 1Q16 1Q17 NCREIF Transaction Volume & Cap Rates 12.0% 10.0% 8.0% 6.0% 4.0% 2.0% 0.0% $16,000 $14,000 $12,000 $10,000 $8,000 $6,000 $4,000 $2,000 $0 Source: NCREIF Aggregate Sale Price ($B) Transaction Cap Rate 25

26 Debt Financing 26

27 Debt Financing 27
28 Transactions by Buyer Type ($Billions) $600 $500 $400 $300 $200 $100 $ SOURCE: RCA Cross-Border Inst'l/Eq Fund Listed/REITs Private User/other 28
29 Manhattan DC Boston Los Angeles San Francisco Seattle Chicago Houston Dallas DC VA burbs Miami/Dade Honolulu Atlanta Austin San Jose Baltimore Orlando Phoenix Denver No NJ Minneapolis Long Island Columbus Charlotte Fort Myers Top U.S. CRE Markets for Foreign Capital as of Q ($ Million) $0 $500 $1,000 $1,500 $2,000 $2,500 $3,000 $3,500 $4,000 $4,500 $5,000 Source: Real Capital Analytics Canada Asia Mid-East Europe Rest of World 29
30 WHO? Start now 30


31 Select Global Bond Yields Japan Germany U.K. U.S. Australia 2 Years -0.15% -0.75% 0.44% 1.53% 1.93% 5 Years -0.09% -0.35% 0.78% 1.94% 2.30% 10 Years 0.05% 0.37% 1.33% 2.30% 2.75% 30 Years 0.87% 1.22% 1.89% 2.82% Source: Bloomberg (data as of Oct. 16, 2017) 31
32 NCREIF (NPI) vs 10-yr CMT 10-yr Traunch Avgs (81-91 to 06-16) % 10% 8% 6% 4% 2% 8.1% 5.0% 5.7% 2.8% 0% -2% -4% Sources: L&B Realty Advisors, LLP; NCREIF 10-yr Constant Maturity Treasury NPI Income NPI Appreciation 32
33 NCREIF (NPI) Income Return & Baa Spread Over 10-yr CMT (bps) Sources: L&B Realty Advisors, LLP; NCREIF, Moody s NPI Income BAA 33
34 Investment Performance NCREIF (NPI) 10 YR Components CRE Composite Office Industrial Warehouse Retail Multifamily Range Income 5.6% 5.5% 6.1% 5.9% 5.1% 100 bps Appreciation 0.8% 0.0% 0.9% 2.0% 1.1% Total 6.4% 5.5% 7.1% 8.0% 6.2% Income as % of Total Return 87% 99% 86% 74% 81% 20-YR Income 6.7% 6.7% 7.2% 6.9% 6.1% 110 bps Appreciation 2.8% 2.5% 2.8% 3.6% 3.3% Total 9.7% 9.3% 10.1% 10.7% 9.5% Income as % of Total Return 69% 72% 71% 65% 64% Since Inception Income 7.3% 7.2% 7.8% 7.3% 6.8% 100 bps Appreciation 1.9% 1.2% 1.8% 2.4% 2.0% Total 9.3% Sources: L&B Realty 8.5% Advisors, RCA 9.7% 9.8% 8.9% Income as % of Total Return 79% 85% 80% 74% 77% 34
35 WHAT? Strategy Core Core-plus Core assets with upside & leverage (preferably both) Build to Core Property Types (4 Food Groups): Office, Industrial, Retail, Multifamily 35
36 Office WHAT? Leasing velocity highest where the brains are Industrial Intersection of major population centers and ports Older less functional space in rising demand Retail High street, experiential and local grocery hold value Some existing retail will see highest and best use change Multifamily Preference for high rise and new product Peak rents plateau in highest rent markets Existing tenants still saving for downpayment on home, room to run 36
37 Office Vacancy rates in 17 of the 20 Metro areas listed have improved relative to their respective 10 year averages. Completions are now accelerating in 15 of the top 20 markets. Office influenced by: We work shared office concepts, open office concepts, lower space per employee, technology and digital communication. Data centers. Financial sector contraction continues. Banking and related sectors require fewer ATMs, branches and are now repurposing space. Increasing interest in CBD (central business district) office locations continues to occur in response to recruiting of millennials in the labor force and their attraction to 24/7 amenitized locations. 37
38 Industrial E-commerce growth is fueling persistent demand Fulfillment and distribution properties continue to be in great demand, outstripping new supply. Activity is moving back up the value chain as more traditional retail functions become integrated with warehouse activities. Last mile becoming more important, increasing demand for close-in distribution facilities. Import and export activity also increasing demand. Transportation becomes an even more important component in the distribution of goods. Secondary locations becoming very important. 38
39 Retail Amazon Affect Growth in online sales is accelerating from a low base (9% of total retail sales) at an increasing rate (16%) Amazon / Whole Foods WF located in cluster of best prime customers Amazon buys old malls For distribution centers Omnichannel Creating sales how customers want to buy Because of the growth in e-commerce, bricks and mortar retail suffers unwarranted negative headline risk. Retailers of specialty/designer/luxury merchandise appears to be holding up well. Class B&C malls with retail tenants oriented toward middle income consumers are having the greatest difficulty, and the highest and best use will likely change. Very little new construction is occurring. Repurposing space continues and may represent opportunity. This is good. 39
40 Multifamily Age demographics continue to be a perfect storm for multifamily. Millennials: Many more singles delaying marriage and child-bearing, but forming households. Seniors: age-restricted housing, assisted living, etc. have increased with increases in life expectancy. All = continued increase in demand for apartments. Locations for development. Emphasis on suburban development is reversing. Now more interest in in town and CBD development is occurring in response to increased demand. Currently vacancy rates are below 10-year averages in most MSAs. 40
41 WHERE? Major markets = margin of safety Keep to major Prime markets Demographic trends indicate further urbanization 41
42 WHERE? James Pickard s Urban Regions Map

43 WHERE? Virginia Tech Megapolitan Geography
44 WHERE, Is the future growth 44

45 WHERE? Office 45

46 WHERE? Industrial Source: 46
47 HOW? Simpler is better 47
48 FIRPTA Changes PATH Act (12/2015) exempts non-u.s. pensions from FIRPTA on sale of USRPIs or distributions from REITs. (U.S. taxation from ECI may still apply for pass-through investments) To qualify for the non-u.s. pension exception to FIRPTA, the following requirements must be satisfied: Non-U.S. Organization Employee Pension. Widely Held. Goverment Oversight. Tax Benefits IRS expected to provide guidance, but hasn t yet. 48
49 FIRPTA Changes Limitations on Specified Listed Entities In the event any person owns an interest in a qualifying shareholder and directly or indirectly holds more than 10% of the stock of the REIT, exemption may be partially disallowed REIT distributions (including capital gain dividends) or interest payments still subject to 30% U.S. withholding (which may be reduced by treaty) Examples of Entities that May Qualify: Based on legislative history, it appears that Congress specifically intended that Australian Listed Property Trusts and Dutch Belegginsintellings would meet the qualifying shareholder requirements, although other entities organized in other jurisdictions may qualify as well 49
50 Active Investment (Asset) Management Active vs Passive Asset Management Enduring competitive advantages / disadvantages Product, People, Capital & Marketing Incremental gains compound Operating Cost discipline Invest capital to enhance / competitive position Strategize toward next buyer, tactically execute 50
51 Takeaways New Normal Prolonged forecast period of low yields. Focus on durable long-term Income and cash yield Consistently apply disciplined acquisition strategy over time Start now. Acquire true Core assets Target the best locations in the Prime major markets Actively investment (asset) management 51
52 Thank you! L&B Realty Advisors, LLP N. Central Expressway Suite 1200 Dallas, TX Christian R. Metten Executive Vice President Eric R. Smith Executive Vice President Paul M. Noland Vice President
53 L&B Realty Advisors, LLP Client Focused. Performance Driven. There is a force that drives L&B it is the connection of our people, their careers and our clients Investing in real estate since 1965 cycle tested Over $14 billion assets acquired / managed since inception Headquartered in Dallas, TX 1984 SEC registered investment advisor Employee Owned 17 key professionals own equity 111 employees Experienced Key Professionals Average of 18 years at L&B; average of 26 years of real estate experience Strong experience across all property types and geographic regions Motivated and stable workforce; low turnover Real estate is our only business Diversified Client Roster with Long-Term Relationships Managing assets for current clients for over 30 years 53


54 Well Diversified Depth and Breadth Across the U.S. $8.4 Billion AUM as of 6/30/17 Geographic Regions Property Type Mountain 2% WN Central 1% EN Central 9% Northeast 14% Other, 2% Industrial, 10% Office, 25% Pacific 15% Multifamily, 25% Mideast 30% Southeast 12% Kauai Retail, 38% Maui Southwest 17% 54
CAPITAL MARKETS UPDATE. Suburban Office: Is this the Next Play?
 CAPITAL MARKETS UPDATE Suburban Office: Is this the Next Play? October 2016 Investment Thesis Background Suburban office product has lagged the property recovery cycle. Most of the lag is the result of
Emerging Trends in Real Estate Navigating at Altitude
 Emerging Trends in Real Estate 2018 Navigating at Altitude Emerging Trends in Real Estate 2018 Navigating at Altitude We are in a long cycle, not in boom/bust. The key to the next few years is to expand
Emerging Trends in Real Estate We are in a long cycle, not in boom/bust.
 Emerging Trends in Real Estate 2018 Navigating at Altitude We are in a long cycle, not in boom/bust. The key to the next few years is to expand horizons, market by market, property type by property type.
CRE Capital Markets Update Amid Renewed Financial Instability and Fear of a Global Recession
 CRE Capital Markets Update Amid Renewed Financial Instability and Fear of a Global Recession presented to: Center for Real Estate and Urban Economic Studies Jim Clayton, Ph.D. Vice President Research Cornerstone
TEXAS MULTIFAMILY FOLLOW THE MONEY. THE CAPITAL MARKETS PERSPECTIVE Jeanette I. Rice, Americas Head of Investment Research February 12, 2016
 TEXAS MULTIFAMILY FOLLOW THE MONEY THE CAPITAL MARKETS PERSPECTIVE Jeanette I. Rice, Americas Head of Investment Research February 12, 2016 MULTIFAMILY ON TOP OF THE MARKET 2 MONEY IS FOLLOWING MULTIFAMILY
CCRSI RELEASE OCTOBER 2014 (With data through August 2014)
") CCRSI RELEASE OCTOBER 2014 (With data through August 2014) COMMERCIAL PROPERTY PRICES SUSTAIN UPWARD CLIMB IN AUGUST IMPROVING LABOR MARKET CONDITIONS FUEL STRONG THIRD QUARTER NET ABSORPTION AND PRICE
CCRSI RELEASE OCTOBER 2014 (With data through August 2014) COMMERCIAL PROPERTY PRICES SUSTAIN UPWARD CLIMB IN AUGUST IMPROVING LABOR MARKET CONDITIONS FUEL STRONG THIRD QUARTER NET ABSORPTION AND PRICE
Metropolitan Area Statistics (4Q 2012)
") Metropolitan Area Statistics (4Q 2012) Apartment Completions 4Q 2011 4Q 2012 % Chg. Atlanta 490 288-41% Boston 678 995 47% Chicago 506 711 41% Cleveland 4 13 225% Columbus 255 322 26% Dallas-Ft. Worth
Metropolitan Area Statistics (4Q 2012) Apartment Completions 4Q 2011 4Q 2012 % Chg. Atlanta 490 288-41% Boston 678 995 47% Chicago 506 711 41% Cleveland 4 13 225% Columbus 255 322 26% Dallas-Ft. Worth
Metro Washington, DC State of the Market
 Metro Washington, DC State of the Market Q1 2016 U.S. office clock San Francisco Peninsula Silicon Valley Houston Dallas, San Francisco Austin Nashville Peaking phase Falling phase Denver, Minneapolis,
2015 REAL ESTATE ECONOMIC FORECAST The National Economy and What It Means For Real Estate
 2015 REAL ESTATE ECONOMIC FORECAST The National Economy and What It Means For Real Estate February 5, 2015 Jeanette I. Rice Kentucky Chapter National economy in great shape for 2015 Creating excellent
The U.S. and California Is The Recovery Here at Last? UCLA Anderson School of
 The U.S. and California Is The Recovery Here at Last? Jerry Nickelsburg Senior Economist UCLA Anderson Forecast State of the County January 20, 2010 SEPTEMBER 2008 In September 2008 Financial Markets Stopped
State of the U.S. Multifamily Market. Q Review and Forecast
 State of the U.S. Multifamily Market Q1 2015 Review and Forecast Agenda Economy Leasing Fundamentals Rent and NOI Trends Single-Family Market Capital Markets Economy page 3 GDP Growth Contributions To
Was it all for N 0 u g h t? The 00 Decade and the Year Ahead. Tony Pierson Cornerstone Real Estate Advisers LLC. Real Estate Conference
 Disclaimer This presentation is not intended to be and does not constitute investment advice. This is provided as an accommodation and shall not be relied upon as investment advice. This presentation includes
The Capital Investment Climate
 The Capital Investment Climate Panelists: Nicholas Pell, Managing Director, Head of Investments, Gramercy Property Trust Rusty Tamlyn, SIOR, Senior Managing Director, HFF John Thomas, Senior Managing Director,
Perspectives JAN Market Preview: Real Estate
 Perspectives JAN 2019 2019 Market Preview: Real Estate NAVIGATING THROUGH A LATE MARKET CYCLE The real estate sector managed to pull off another strong year in 2018, delivering a total return of 8.35%,
Real Estate Investment and Capital Market Perspectives An evolving and different recovery continues
 Real Estate Investment and Capital Market Perspectives An evolving and different recovery continues presented to: NCREIF Valuation Committee Jim Clayton, Ph.D. Vice President Research Cornerstone Real
U.S. Economic and Medical Office Market Overview and Outlook. November, 2014
 2014 U.S. Economic and Medical Office Market Overview and Outlook November, 2014 Economic & Demographic Overview U.S. GDP Growth and Health Care Spending Trends GDP Health Care Expenditures Annualized
State Of The U.S. Industrial Market: 2017 Q2
 State Of The U.S. Industrial Market: 2017 Q2 Copyright 2017 CoStar Realty Information, Inc. No reproduction or distribution without permission. The following information includes projections and analyses
The Economic Backdrop When will this cycle end?
 The Economic Backdrop When will this cycle end? How far are we into the current economic expansion? Current expansion in 8 th year; 4 th longest since 1960 Length of economic expansions (months) Apr-91-Feb-01
Multifamily Investing: Expectations, Realities, Assessment of Conventional Wisdoms
 REACH RESEARCH RESULTS Multifamily Investing: Expectations, Realities, Assessment of Conventional Wisdoms July 2016 James Halliwell, Managing Director Principal Real Estate Investors PROPERTY SALES VOLUME
multifamily market overview presented by: Kurt Shoemaker First Vice President
 multifamily market overview 2019 presented by: Kurt Shoemaker First Vice President g r e a t e r d a y t o n a p a r t m e n t a s s o c i a t i o n agenda 01 02 03 04 05 06 macro-level economic indicators
Perspectives on U.S. real estate investment
 Perspectives on U.S. real estate investment Looking ahead in 2017 Sean Coghlan Director, Investor Research April 7, 2017 The past year s headlines have been unsettling in impact, frequency and market reaction
Emerging Trends in Real Estate 2014
 Canada Emerging Trends in Real Estate 2014 Emerging Trends is the industry s most predictive forecast 35th annual outlook Based on over 1,000 interviews and surveys of industry leaders Sponsored by PwC
APARTMENT TRENDS. U.S. Economic and Multi-Family Outlook. Special Client Webcast May 31, 2006
 APARTMENT TRENDS U.S. Economic and Multi-Family Outlook Special Client Webcast May 31, 2006 U.S. Apartment Market Economic and Apartment Supply-Demand Overview and Outlook U.S. Economic Conditions Ideal
Is Suburban Real Estate A Value Proposition Today? Guest Speaker:
 Is Suburban Real Estate A Value Proposition Today? Guest Speaker: Mark Eppli Interim James H. Keyes Dean of Business Administration, Robert B. Bell, Sr., Chair in Real Estate, and Professor of Finance,
Office-Using Jobs and Net Migration Point to Continued Strength
 October 20, 2017 Office-Using Jobs and Net Migration Point to Continued Strength Key Takeaways Secondary Sunbelt office markets are priced to offer attractive, risk-adjusted returns relative to the Gateway²
ZipRealty, Inc. Supplemental Data Reclassification of Consolidated Statement of Operations
 Reclassification of Consolidated Statement of Operations Effective January 1, 2007, for income statement presentation purposes, we have reclassified sales support and marketing expenses from general and
We Really Want to Hear From You! Please Take a Few Minutes to Complete Today s Session Evaluation Accessible in the Conference App
 We Really Want to Hear From You! Please Take a Few Minutes to Complete Today s Session Evaluation Accessible in the Conference App Vikas Gupta SVP Acquisitions and Development Omega Healthcare Investors,
STRONG MARKET FUNDAMENTALS SUPPORT BROAD PRICE GAINS IN MAY
 CCRSI RELEASE JULY 2014 (With data through MAY 2014) STRONG MARKET FUNDAMENTALS SUPPORT BROAD PRICE GAINS IN MAY VALUE-WEIGHTED U.S. COMPOSITE PRICE INDEX APPROACHES PRERECESSION PEAK LEVELS This month's
CBRE CAP RATE SURVEY. A CBRE Publication. First Half Click to Enter
 CBRE CAP RATE SURVEY A CBRE Publication In This Issue: pg 2 pg 8 pg 17 pg 26 pg 36 pg 41 pg 44 Click to Enter United States The 10-year Treasury (UST) was measurably lower than 2% from April 2012 through
Capital Market Update. February 10, 2011 Marc Louargand, Ph.D., CRE, FRICS Principal SALTASH PARTNERS LLC investing in American ingenuity
 Capital Market Update February 10, 2011 Marc Louargand, Ph.D., CRE, FRICS Principal SALTASH PARTNERS LLC investing in American ingenuity A Brief Tour of the Capital Market What s happened in the past year?
CCRSI RELEASE JANUARY 2014 (With data through NOVEMBER 2013)
") CCRSI RELEASE JANUARY 2014 (With data through NOVEMBER 2013) COMMERCIAL REAL ESTATE PRICES POST STEADY GAINS IN NOVEMBER STRONG ABSORPTION ACROSS PROPERTY TYPES SUPPORT BROAD GAINS IN PRICING This month's
CCRSI RELEASE JANUARY 2014 (With data through NOVEMBER 2013) COMMERCIAL REAL ESTATE PRICES POST STEADY GAINS IN NOVEMBER STRONG ABSORPTION ACROSS PROPERTY TYPES SUPPORT BROAD GAINS IN PRICING This month's
COMMERCIAL. first look
 CCRSI RELEASE AUGUST 213 (With data through June 213) COMMERCIAL REAL ESTATE PRICES SEE MIDYEAR SURGE WITH STRONGEST QUARTER RLY INCREASE SINCE 211 RECOVERY BROADENS AS GENERAL COMMERCIAL SEGMENT EDGES
COMMERCIAL REAL ESTATE MARKET AND INDUSTRY OUTLOOK THE BIG PICTURE 2019 AND BEYOND
 COMMERCIAL REAL ESTATE MARKET AND INDUSTRY OUTLOOK THE BIG PICTURE 2019 AND BEYOND 10-Year Economic Lookback 2007 The Height of the Last Cycle 25.4 Million Increase in Population Since 2007 10.4 Million
Moody s/real Commercial Property Price Indices, December 2010
 DECEMBER 21, 2010 STRUCTURED FINANCE SPECIAL REPORT Moody s/real Commercial Property Price Indices, December 2010 Table of Contents: OVERVIEW 1 Notable Observations and Themes 3 NATIONAL ALL PROPERTY TYPE
U.S. ECONOMIC & PROPERTY MARKET PERSPECTIVE
 AEW RESEARCH U.S. ECONOMIC & PROPERTY MARKET PERSPECTIVE Q3 2018 1 Prepared by AEW Research, September 2018 This material is intended for information purposes only and does not constitute investment advice
Fisher Center-Real Estate & Economics Symposium. November 19 th, 2018
 Fisher Center-Real Estate & Economics Symposium November 19 th, 2018 SALES VOLUME AND PRIMARY MARKET CAP RATES 12-MONTHTOTALS Demand for product in major markets has driven cap rate compression, and forced
Econometric Advisors APARTMENT OVERVIEW AND OUTLOOK Q4 2017
 Econometric Advisors APARTMENT OVERVIEW AND OUTLOOK Q4 2017 THE U.S. ECONOMY WILL REMAIN ON FIRM FOOTING IN 2018 JOB GROWTH WILL MODERATE AS LABOR MARKET TIGHTENS FURTHER STRONG CONSUMPTION, HIGHER PRIVATE
U.S. and New England Economic Conditions and Outlook
 U.S. and New England Economic Conditions and Outlook Yolanda Kodrzycki Senior Economist and Policy Advisor charts prepared by Ana Patricia Muñoz presented to New England Board of Higher Education conference
Multifamily Outlook. United States Fall 2014
 Multifamily Outlook United States Fall 2014 Markets continue to perform at peak levels... with nearterm, pocketed softening on the horizon On the heels of seven quarters of peak-level investment sale volumes,
CAPITALIZATION RATES BY PROPERTY TYPE
 RATES BY PROPERTY TYPE MID-YEAR 2014 0 RATES BY ASSET TYPE MID-YEAR 2014 O V E R V I E W Capital continues to flow steadily into the U.S. real estate market, as both domestic and foreign investors increase
The Five Retail Trends to Watch in January 14, 2015
 The Five Retail Trends to Watch in 2015 January 14, 2015 U.S. ECONOMIC TRENDS Inflation Adjusted Crude Oil Prices Fall Below Long-Term Average Price per Barrel (Nov. 2014 Dollars) $160 $120 $80 $40 $0
COMMERCIAL PRICING SURGE
 CCRSI RELEASE MARCH 2013 (With data through JANUARY 2013) COMMERCIAL REAL ESTATE PRICING LEVELS OFF FOLLOWING YEAR-END SURGE IN JANUARY INCREASING LIQUIDITY AND DECLINING DISTRESSED IMPROVING INVESTOR
COMMERCIAL REAL ESTATE PRICING LEAPS FORWARD IN AUGUST BOOSTED BY STRONG NET ABSORPTION IN FIRST HALF OF YEAR
 CCRSI RELEASE OCTOBER 2012 (With data through AUGUST 2012) COMMERCIAL REAL ESTATE PRICING LEAPS FORWARD IN AUGUST BOOSTED BY STRONG NET ABSORPTION IN FIRST HALF OF YEAR CCRSI INDICES POST STRONGEST GAINS
U.S. Investment Outlook
 U.S. Investment Outlook Quarterly Investor Research update Q2 2015 U.S. Investment overview 37% 21% 15% 15% U.S. cities dominating global investment activity Top 20 Cities for Transactional Volumes H1
Dr. Mark G. Dotzour College Station, Texas Clear Sailing Ahead
 Dr. Mark G. Dotzour College Station, Texas mdotzour@gmail.com www.markdotzour.com Clear Sailing Ahead States With Most Employment Growth In the 21 st century 2,742,414 Texas 2,031,864 California 1,792,590
How to Invest in Real Estate in a Growth Economy
 Origin Capital Acquisition Strategy March 2015 How to Invest in Real Estate in a Growth Economy 1 Investment Focus 8 U.S. Growth Markets 2 Market Opportunity Target Markets Attractive Target Markets Target
2014 NDT Fund Conference REIT Overview
 2014 NDT Fund Conference REIT Overview Presented by: Michael J. Stavar VP - Marketing, Consultant, & Institutional Sales mstavar@chiltoncapital.com (713) 243-3203 Agenda Current Real Estate Fundamentals
CCRSI RELEASE APRIL 2014 (With data through FEBRUARY 2014)
") CCRSI RELEASE APRIL 2014 (With data through FEBRUARY 2014) PRICE MOMENTUM FOR COMMERCIAL REAL ESTATE CONTINUED TO BUILD IN FEBRUARY REFLECTING BROAD RECOVERY IN MARKET FUNDAMENTALS AND PRICING, EQUAL-WEIGHTED
CCRSI RELEASE APRIL 2014 (With data through FEBRUARY 2014) PRICE MOMENTUM FOR COMMERCIAL REAL ESTATE CONTINUED TO BUILD IN FEBRUARY REFLECTING BROAD RECOVERY IN MARKET FUNDAMENTALS AND PRICING, EQUAL-WEIGHTED
SOUTHERN NEVADA 2015 ECONOMIC OUTLOOK
 SOUTHERN NEVADA 2015 ECONOMIC OUTLOOK NAIOP Washington D.C. Legislative Retreat February 9-11, 2015 Prepared by: ECONOMIC OVERVIEW 2 Nevada job recovery from Great Recession after 90 months. Nevada Recession
NCREIF Summer Conference 2012!
 NCREIF Summer Conference 2012! July 12, 2012 Presented By: Where We Are Today July April Last Year At the Worst DOW 12,641 13,160 12,763 6,626 REIT Index $65.65 $60.90 $62.19 $21.44 10 YR T 1.51% 1.93%
The Economic Outlook for 2007
 The Economic Outlook for 7 Harvey Rosenblum Executive Vice President & Director of Research Federal Reserve Bank of Dallas Presented (with minor modifications) by: John V. Duca, Vice President and Senior
Emerging Trends in Real Estate 2012
 Emerging Trends in Real Estate 2012 Longest published annual real estate outlook 33rd consecutive year Most predictive industry forecast Based on surveys/interviews with 950 industry leaders Jointly published
State of the Office Market
 State of the Office Market Al Pontius Brian McAuliffe James Street Bill Rogalla Managing Director Marcus & Millichap Head of Transactions RREEF Co-Head, Dispositions Prudential Real Estate Investors Senior
COMMERCIAL REAL ESTATE PRICE RECOVERY ACCELERATES IN MAY
 CCRSI RELEASE JULY 2013 (With data through May 2013) COMMERCIAL REAL ESTATE PRICE RECOVERY ACCELERATES IN MAY STRONG ABSORPTION ACROSS ALLL SIZE AND QUALITY DIMENSIONS OF REAL ESTATEE SECTOR REFLECTED
GDP projections for major economies
 GDP projections for major economies 214-215 214 215 Australia 2.6% 2.7% Emerging markets 4.9% 5.2% Euro area 1.2% 1.5% Japan 1.4% 1.% United Kingdom 2.9% 2.5% United States 2.8% 3.% Source: IMF WEO. BRIC
Decline in Economic Activity Larger Than Advance GDP Estimate February 27, 2009
 Northern Trust Global Economic Research 5 South LaSalle Chicago, Illinois 663 northerntrust.com Asha G. Bangalore agb3@ntrs.com Decline in Economic Activity Larger Than Advance GDP Estimate February 27,
August provenperformance
 August 2011 provenperformance Forward Looking Statement Certain information set forth in this supplemental package contains forward-looking statements within the meaning of the federal securities laws.
MEGATREND 1: WAGE GROWTH IS FLAT, BUT DISCRETIONARY INCOME IS UP
 MEGATRENDS MegaTrends 1. Wage growth is flat, but discretionary income is up 2. The regional economy is recovering but not yet recovered 3. Consumer behavior is changing 4. Tenant behavior is changing
Economic and Real Estate Forecast 2014
 Economic and Real Estate Forecast 2014 Presented to: The IREM Forecast Breakfast Presented by: Mark J. Eppli Interim Keyes Dean and Bell Chair in Real Estate Marquette University January 9, 2014 Interest
Struggling to Escape the Fallout of the Great Recession MARISA Di NATALE, MANAGING DIRECTOR
 Struggling to Escape the Fallout of the Great Recession MARISA Di NATALE, MANAGING DIRECTOR FROM MOODY S ECONOMY.COM Broad-Based Slowing Across the Nation Total employment excluding federal government,
Inflation Education. September Spear Street, Suite 950 San Francisco, CA Phone:
 Inflation Education September 2014 150 Spear Street, Suite 950 San Francisco, CA 94105 Phone: 866-627-6984 DISCLAIMER The charts in this presentation are for illustrative purposes only. Individual clients
Global Real Estate Capital Markets
 Global Real Estate Capital Markets Real Estate Data as of 2Q 2017 Economic/Capital Markets Data as of September 2017 Jon H. Zehner Presentation to ULI Scotland Thursday 28 September 2017 LaSalle Investment
Office of the Chief Economist National Credit Union Administration. Economic Overview. California State Examiner School.
 Office of the Chief Economist National Credit Union Administration California State Examiner School May 30, 2017 Credit Union Performance Trends Recent Data About Credit Union Performance in California,
What Will The Montgomery County Economy Look Like in 2017
 Montgomery County Chamber of Commerce What Will The Montgomery County Economy Look Like in 217 Stephen S. Fuller, Ph.D. Dwight Schar Faculty Chair and University Professor Director, Center for Regional
The Mortgage and Housing Market Outlook
 The Mortgage and Housing Market Outlook National Economists Club Washington, DC March 27, 2008 Frank E. Nothaft Chief Economist Recession Risk, Housing Contraction Worsen 1-in-2 chance of recession in
U.S. Commercial Real Estate Valuation Trends
 The NAIC s Capital Markets Bureau monitors developments in the capital markets globally and analyzes their potential impact on the investment portfolios of U.S. insurance companies. A list of archived
COMPOSITE PRICE INDICES FOR COMMERCIAL REAL ESTATE SOARED IN 2015
 CCRSI RELEASE JANUARY 216 (With data through December 215) COMPOSITE PRICE INDICES FOR COMMERCIAL REAL ESTATE SOARED IN 215 DOUBLE-DIGIT PRICE GROWTH ACROSS ALL REGIONAL AND PROPERTY-TYPE INDICES IN 215
Commercial Real Estate Outlook June Must Own Property Names to Buy During Interest Rate Fears
 Jonathan Litt Founder & CEO Must Own Property Names to Buy During Interest Rate Fears REITs have sold off 9.5% since their peak in mid-may on fears of rising interest rates. Historically, sell-offs related
COMMERCIAL REAL ESTATE PRICES MIXED: GENERAL COMMERCIAL SECTOR GAINS MOMENTUM WHILE INVESTMENT GRADE SEES SEASONAL DIP
 APRIL 2012 CCRSI RELEASE (With data through February 2012) COMMERCIAL REAL ESTATE PRICES MIXED: GENERAL COMMERCIAL SECTOR GAINS MOMENTUM WHILE INVESTMENT GRADE SEES SEASONAL DIP SLOW BUT STABLE PRICING
Emerging Trends in Real Estate 2016
 Emerging Trends in Real Estate 2016 PwC ULI 12 Month Outlook on Trends 37 th Edition 1,800+ Real Estate leaders surveyed 75 Cities Profitability outlook 2010 17.7% 60.6% 21.6% Abysmal to Poor Fair Good
Consumer/Banking Outlook
 Consumer/Banking Outlook Federal Reserve Bank of Chicago Economic Outlook Symposium December 2006 Carl Tannenbaum Chief Economist Household Spending Year-Over-Year Percent Change in Nominal Total Retail
Emerging Trends in the U.S. and Colorado Economies
 Emerging Trends in the U.S. and Colorado Economies Sam Chapman Associate Economist Federal Reserve Bank of Kansas City Denver Branch The views expressed are those of the presenter and do not necessarily
CONTRARIAN REAL ESTATE INVESTING STRATEGIES FOR IDENTIFYING VALUE IN A MARKET THAT SEEMS FULLY PRICED AND FAIRLY CROWDED
 CONTRARIAN REAL ESTATE INVESTING STRATEGIES FOR IDENTIFYING VALUE IN A MARKET THAT SEEMS FULLY PRICED AND FAIRLY CROWDED ADAM DUCKER, MANAGING DIRECTOR TAYLOR MAMMEN, MANAGING DIRECTOR NREI WEBINAR MAY
Presented By: Doug Herzbrun Managing Director January 26, 2000
 NORTHWEST CONSTRUCTION CONSUMER COUNCIL Presented By: Doug Herzbrun Managing Director January 26, 2000 U.S. Real Estate Capital Markets Overview INVESTABLE UNIVERSE $1.1 TRILLION 3 INVESTABLE UNIVERSE
The Vision Series,
 The Vision Series, 212-213 The Washington Area Economy: Transitioning From Federal Dependency to a Global Business Base Stephen S. Fuller, Ph.D. Dwight Schar Faculty Chair and University Professor Director,
US Hotel Industry Overview. Chris Crenshaw
 US Hotel Industry Overview Chris Crenshaw ccrenshaw@str.com July 2014 (12 MMA): All Signs Point To A Sellers Market % Change Room Supply* 1.8 bn 0.8% Room Demand* 1.1 bn 3.4% Occupancy 63 % 2.6% A.D.R.*
U.S. ECONOMIC & PROPERTY MARKET PERSPECTIVE
 AEW RESEARCH U.S. ECONOMIC & PROPERTY MARKET PERSPECTIVE Q2 2018 AEW RESEARCH U.S. ECONOMIC & PROPERTY MARKET PERSPECTIVE Q 2 2018 1 Prepared by AEW Research, June 2018 This material is intended for information
US CAPITAL MARKETS REPORT
 US CAPITAL MARKETS REPORT Capitalization Rates By Property Type Fall 2016 US Capital Markets Report Capitalization Rates By Asset Type OVERVIEW Year-to-date investment sales volume lagged on a year-over-year
Investing in a Volatile Market
 Investing in a Volatile Market RCLCO Institutional Advisory Services March 2016 Robert Charles Lesser & Co. Real Estate Advisors rclco.com Price Index, All Equity REITs % REIT Markets are Recently Volatile:
NIC Fall Conference Investing in Seniors Housing and Care Properties. #NICFall17
 2017 NIC Fall Conference Investing in Seniors Housing and Care Properties #NICFall17 We Really Want to Hear From You! Please Take a Few Minutes to Complete Today s Session Evaluation Accessible in the
COMMERCIAL PROPERTY PRICES SHOW LITTLE MOVEMENT IN OCTOBER AMID ECONOMIC UNCERTAINTY
 CCRSI RELEASE DECEMBER 2012 (With data through October 2012) COMMERCIAL PROPERTY PRICES SHOW LITTLE MOVEMENT IN OCTOBER AMID ECONOMIC UNCERTAINTY ADVANCES IN INVESTMENT GRADE INDEX FUELED BY SEASONAL SURGE
U.S. Property Markets Shake Off Slowdown and Power On
 U.S. Research Report CAPITAL FLOWS 2017 Midyear Update U.S. Property Markets Shake Off Slowdown and Power On Andrew J Nelson, Chief Economist USA The slowdown in U.S. commercial property markets that began
Emerging Trends in Real Estate Navigating at Altitude
 Emerging Trends in Real Estate 2018 Navigating at Altitude We are in a long cycle, not in boom/ bust. The key to the next few years is to expand horizons, market by market, property type by property type.
AMERICAN FINANCE TRUST. 2 nd Quarter 2017 Investor Presentation
 AMERICAN FINANCE TRUST 2 nd Quarter 2017 Investor Presentation Overview Strong Portfolio: 516 properties, comprised of 19.2 million rentable square feet, which were 95.8% leased (1) Leverage: 39.6% Total
Avison Young U.S. National Industrial Capital Markets
 Avison Young U.S. National Industrial Capital Markets Mid-Year 017 Spotlight - Foreign Investment in U.S. Capital Markets June 017 Erik Foster Principal, Practice Leader U.S. Industrial Capital Markets
Sovran Self Storage, Inc. Company Presentation February 28, 2016
 Sovran Self Storage, Inc. Company Presentation February 28, 2016 Safe Harbor Statement This presentation may contain forward looking statements as defined in Section 27A of the Securities Act of 1933,
Outlook for the Texas Economy. Luis Bernardo Torres Ruiz, Ph.D. August 26, 2016
 Outlook for the Texas Economy Luis Bernardo Torres Ruiz, Ph.D. August 26, 2016 Research Economist Texas Society of Architects Contents 1. U.S. Economic Outlook 2. Texas Economic Outlook 3. Challenges and
US Real Estate Summary
 US Real Estate Summary Edition 3, 218 Consumer and business optimism is high in the US. 2 Commercial real estate 5 Property types 6 Viewpoint UBS Asset Management US Real Estate Summary September 218 Commercial
WA S H I N G TO N / BALT I M O R E
 D E L T A A S S O C I A T E S WA S H I N G TO N / BALT I M O R E R E A L E S T A T E M A R K E T O V E R V I E W MULTIFAMILY MARKET OVERVIEW 0 9. 2 9. 2 0 1 5 B y W i l l i a m R i c h, C R E P r e s i
Is U.S. Real Estate Over-Priced?
 Is U.S. Real Estate Over-Priced? If U.S. commercial real estate prices are at a peak, should savvy investors be selling their holdings? J A CQUES N. GORDON WILLIAM J. MAHER FRESH EXAMPLES OF high prices
December 2014 FINANCIAL MARKET REVIEW
 December 2014 FINANCIAL MARKET REVIEW Buena Vista Investment Management LLC 241 Third Street South Wisconsin Rapids, WI 54494 715-422-0700 http://buenavistainv.com December 2014 Why Portfolios Remain Diversified
What Lies Ahead? Georgia State University. Wednesday, May 14, 2008
 U.S. Lodging Horizon 2008 What Lies Ahead? Economic Forecasting Center Georgia State University Wednesday, May 14, 2008 Mark.Woodworth@pkfc.com com Presentation Outline I. The Economy II. Current Horizon:
DUKE REALTY Investor Presentation October 2008
 1 DUKE REALTY Investor Presentation October 2008 Forward-Looking Statement When used in this presentation, the word believes, expects, estimates and similar expressions are intended to identify forward-looking
U.S. ECONOMIC & PROPERTY MARKET PERSPECTIVE
 AEW RESEARCH U.S. ECONOMIC & PROPERTY MARKET PERSPECTIVE Q4 2018 AEW RESEARCH U.S. ECONOMIC & PROPERTY MARKET PERSPECTIVE Q 4 2018 1 Prepared by AEW Research, March 2019 This material is intended for information
SAME/ACEC June Conference. The Outlook for the U.S. and Washington Area Economies In 2013 and Beyond
 6/24/23 SAME/ACEC June Conference The Outlook for the U.S. and Washington Area Economies In 23 and Beyond Stephen S. Fuller, Ph.D. Dwight Schar Faculty Chair and University Professor Director, Center for
CYCLE FORECAST Real Estate Market Cycles Third Quarter 2017 Estimates November 2016
 CYCLE FORECAST Real Estate Market Cycles Third Quarter 0 Estimates November 0 It is expected that 0 should have a growth trajectory higher than the past six years. Economists revised their forecasts to
Highlands Spin-Off & Student Housing Transaction Webcast. January 18, 2016
 Highlands Spin-Off & Student Housing Transaction Webcast January 18, 2016 Disclaimer Forward-Looking Statements in this presentation, which are not historical facts, are forward-looking statements within
Captain CREDIT Crunch
 Captain CREDIT Crunch April 9, 2008 Presented by: Patrick Devereaux Senior Director The Times They Are A-Changin Post Credit Crunch Investment Market Fundamentals Of Commercial Real Estate Remain Strong
afl-cio Building Investment Trust Quarterly Report 1Q13
 afl-cio Building Investment Trust Quarterly Report On the cover: Dock Street Apartments, currently under construction in Minneapolis, MN. Right: Wolf Point, to be built in Chicago, IL. Contents Fund Overview...
STATE OF THE REAL ESTATE MARKET FALL Robert J. Strachota MAI, MCBA, CRE, FIBA 35 th Annual Real Estate Institute November 2, 2017 CLE
 STATE OF THE REAL ESTATE MARKET FALL 2017 Robert J. Strachota MAI, MCBA, CRE, FIBA 35 th Annual Real Estate Institute November 2, 2017 CLE 1 Ladies and gentlemen, you are the jury for the state of the