HONEY CATEGORY OVERVIEW
|
|
|
- Eugenia Stanley
- 6 years ago
- Views:
Transcription

1 HONEY CATEGORY OVERVIEW
2 HONEY IS A $ MILLION CATEGORY AT RETAIL Dollar growth is steady with slight deceleration trend, Unit growth also experiencing deceleration. DOLLARS (in Millions) UNITS (in Millions) 15.5% $ % 6.7% 9.0% $ $ $ % $ % % 1.7% % % Cal 2012 Cal 2013 Cal 2014 Cal Cal 2012 Cal 2013 Cal 2014 Cal Source: Nielsen Scantrak - Answers on Demand Core, xaoc+convenience (Calendar 2012, Calendar 2013, Calendar 2014, Calendar 2015, 52 Weeks Ending 12/03/2016) 2
3 130.7MM POUNDS OF HONEY SOLD IN 2016 With the exception of 2014, the number of Pounds sold also consistent POUNDS (in Millions) % 0.0% % Source: Nielsen Scantrak - Answers on Demand Core, xaoc+convenience (Calendar 2012, Calendar 2013, Calendar 2014, Calendar 2015, 52 Weeks Ending 12/03/2016) 3

4 PRIVATE LABEL LOSING SHARE, UNDER-PERFORMING Branded Wins Big, Adding $27.5MM To Category in 2016, compared with $7.5MM from Private Label Private Label is Leading Growth Deceleration Private Label Re-Establishing Pricing Discount To Branded $ % Change Vs Year Ago Price Label Discount Gap % % % % Calendar 2012 Calendar 2013 Calendar 2014 Calendar % Honey Private Label $ Share Unit Share % 46.43% % % PRIVATE LABEL BRANDED PRIVATE LABEL BRANDED Source: Nielsen Scantrak - Answers on Demand Core xaoc+ Conv 4

5 ORGANIC CONTINUES TO DRIVE GROWTH Plateau in Organic Growth Acceleration Organic Honey Maintained it s High Rate of Growth, Compared to Consistent Slowing of Growth for the Overall Category. Organic Honey Continues to Steal Share 24.25% 21.50% 32.27% 32.00% % 17.58% 15.50% 13.30% 6.70% 9.00% 6.20% Total Honey Organic Non- Organic 91.20% Organic Honey Brought In $52MM in 2016, Adding $12MM from 2015, and growing $32.3MM from % of New $ to the Category was from Organic Honey sales in Source: Nielsen Scantrak - Answers on Demand Core 5
 *Note: Households expressed in (000) PURCHASE FREQUENCY 1.9 TRIPS [ 0.0 TRIPS ] 70.")
6 57,000 NEW HOUSEHOLDS BUY THE CATEGORY More Households Are Purchasing Honey More Frequently, While Spending Per Household is Flat in 2016 CONSUMER PURCHASING BEHAVIOR PENETRATION 30.5% [ +1.3% ] 35,472 HHs* [ +57 HHs* ] BUYING RATE $12.7 [ +$0.00 ] 39.3% 2+ Repeat Buyers [+.02%) *Note: Households expressed in (000) PURCHASE FREQUENCY 1.9 TRIPS [ 0.0 TRIPS ] 70.2 ELAPSED DAYS Between Trips for Repeat Buyers [-3.6 Days) PURCHASE SIZE $6.6 [ +$0.0 ] 1.1UNITS [ 0.0 UNITS ] Source: Nielsen Homescan 6
7 CONSUMERS BUYING MORE OF THEIR HONEY AT GROCERY IN 2016, REVERSING 2015 TREND Grocery Regaining Share % Dollar in A/O Channels 5 % Dollar in Dollar Stores % Dollar in Warehouse Club % Dollar in Target % Dollar in Walmart % Dollar in Supers % Dollar in Mass Merch W/o Supers % Dollar in Mass Merch w/ Supers % Dollar in Drug % Dollar in Convenience % Dollar in A/O Grocery % Dollar in $2MM+ Grocery %Dollar in $2MM+ Grocery W/ Supers % Dollar in Total Grocery % Dollar in Total Grocery W/ Supers Source: Nielsen Homescan Consumer Facts 52 Weeks Ending 10/1/2016, 52 Weeks Ending 9/26/ % -0.3% -0.2% +1.1% +0.4% Warehouse/Club Mass Merch W/ Supers Walmart Total Grocery Total Drug 7
8 PACIFIC AND SOUTH ATLANTIC COASTS FUELING HONEY GROWTH, MIDWEST LAGGING Los Angeles, The 2 nd Largest Honey Market, Continues to Lead Market Growth Largest $ Honey Markets 2016 ($MM) Fastest Growth Markets 2016 (% $ Growth) New York food Los Angeles food Philadelphia food Boston food San Francisco food Miami food Washington DC food Atlanta food Chicago food Denver food Houston food Detroit food Phoenix food Dallas/Ft. Worth food Tampa food Los Angeles food Raleigh Durham food New Orleans Mobile food Louisville food New York food Orlando food Charlotte food Miami food Hartford New Haven food Memphis food Fastest Growth Markets 2015 (% $ Growth) Los Angeles food Charlotte food Nashville food Des Moines food Louisville food Raleigh Durham food San Francisco food San Diego food Sacramento food St Louis food Slowest Growth 2016 (% $ Growth) West Texas food Milwaukee food Little Rock food Cleveland food St Louis food Chicago food Albany food Minneapolis food Indianapolis food Birmingham food Denver food 8
9 9
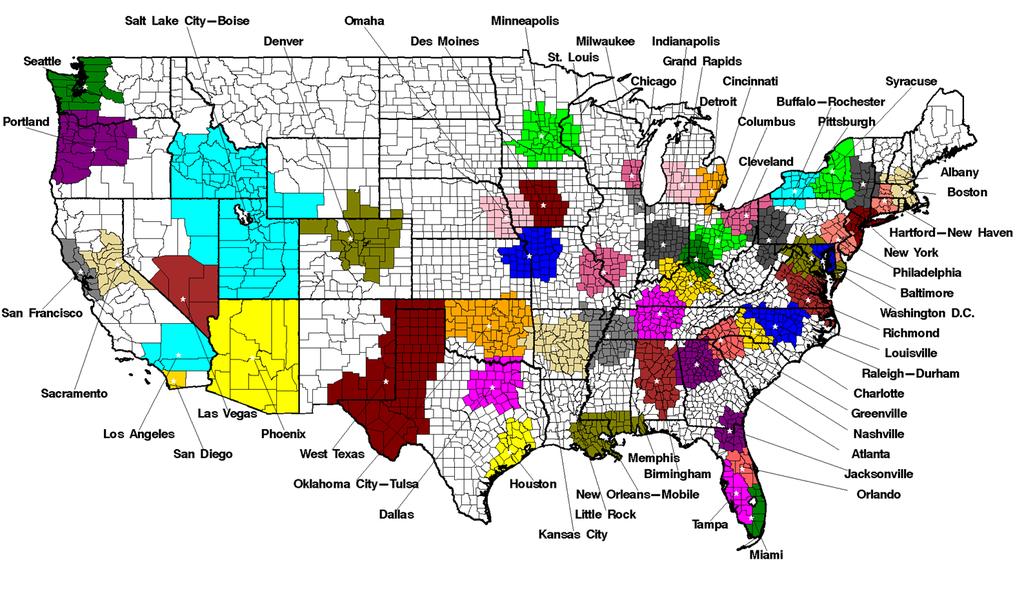
10 HONEY DEVELOPMENT Based on a CDI/BDI Methodology, using Honey Category Vs. Grocery Department Louisville Pittsburgh Columbus Syracuse Los Angeles Memphis Nashville Salt Lake/ Boise Denver Milwaukee Minneapolis Hartford-New Haven Chicago Atlanta Houston Miami New York San Francisco 10

11 HONEY DEVELOPMENT Based on a CDI/BDI Methodology, using Sweetener Category Vs. Honey Memphis Little Rock Birmingham Greenville Charlotte New Orleans/Mobile Raleigh-Durham Pittsburgh Nashville Jacksonville Louisville Milwaukee Buffalo-Rochester Cincinnati Syracuse Albany Grand Rapids Omaha Minneapolis Atlanta Oklahoma City Dallas-Ft Worth Las Vegas Kansas City Orlando Nashville New York Los Angeles Denver San Francisco Salt Lake City-Boise San Diego Miami Oahu Houston 11
![West Region Outperforming Category [+6.5% $ Vol Growth] Midwest Region Flat [+0.8% $ Vol Growth] Latest 52 Weeks- W/E 12/03/2016 REGIONS HONEY $ $ % Chg YA South Region food 124,307,957 5.](/docs-images/78/78248184/images/12-2.jpg "2 West Region food 95,061,758 6.5 Northeast Region food 76,305,529 5.4 Midwest Region food 63,165,024 0.8 Pacific Division Continues to Drive Category (+8.5% $ Vol Growth) West North Central (+0.")
12 West Region Outperforming Category [+6.5% $ Vol Growth] Midwest Region Flat [+0.8% $ Vol Growth] Latest 52 Weeks- W/E 12/03/2016 REGIONS HONEY $ $ % Chg YA South Region food 124,307, West Region food 95,061, Northeast Region food 76,305, Midwest Region food 63,165, Pacific Division Continues to Drive Category (+8.5% $ Vol Growth) West North Central (+0.0% Growth) and East North Central Lagging (+1.2% Growth) Latest 52 Weeks- W/E 12/03/2016 DIVISIONS HONEY $ $ % Chg YA South Atlantic Division food 72,968, Pacific Division food 65,222, Middle Atlantic Division food 53,851, East North Central Division food 43,451, West South Central Division food 35,753, Mountain Division food 29,839, New England Division food 22,453, West North Central Division food 19,713, East South Central Division food 15,586,


13 PRICE GROWTH FLATTENING SLIGHTLY Avg Unit Price Any Promo Unit Price No Promo Unit Price Total U.S. xaoc Unit Pricing $ $ $ $0.04 $.27 /Oz $.30 /Oz $.30 /Oz $.33 /Oz The Average Unit Price increased by 1.45% over the past 52 weeks, While Price Per Ounce only increased by 0.67% $0.272 $0.246 $0.217 Average Price Per Oz $0.283 $0.258 $0.228 $0.305 $0.307 $0.307 $0.276 $0.279 $0.281 $0.255 $0.256 $ xaoc FOOD DRUG Grocery Drug Convenience 5.50+$ $ $0.00 $.31 /Oz $.25 /Oz $.40 /Oz 13
14 PROMOTION INCREASED EXCEPT FOR DISPLAY 24.6% [+2.1%] of All Grocery $ Sales on Promo (28.6% of all Units [+2.7%]) 6.7% [-.2%] of All Grocery $ from Display (8.9% of all Units[-.1%]) Promotional activity increased by $18.9MM over the past year 19.2% [+2.2%] of all Grocery $ Sold on TPR (21.7% of all Units[+2.9%]) Source: Nielsen AOD 2.1% [+.7%] of all Grocery $ Sold on Feature Ad (2.9% of All Units [+.8%]) Perception of receiving a deal Increased by 1.1% over the past year 14
15 XAOC HONEY PROMO PROVIDED LIFT % of $ % of Units INCR. % $ Lift Any Promo 20.9% 22.7% $27.3MM 28.7% Display w/o Feat 6.3% 6.5% $4.2MM 13% Feat w/o Display 2.9% 3.2% $7.1MM 72.8% Feature & Display Temporary Price Reduction Source: Nielsen AOD Base and Incremental Facts.6% 11.1%.6% 12.4% $1.55MM $14.4MM 85.3% 28.2% 15
16 GLASS JARS & BOTTLES OUTPERFORMING 12 oz Most Popular Size $ Share Unit Share Jars Drive Growth while Bear, Jug, and Tub underperform 6% 9% 11% 15% 12 OUNCE 16 OUNCE 24 OUNCE 32 OUNCE 40 OUNCE 80 OUNCE Other 16% 24% 19% 2.4% 4.5% 6.9% 18.0% 12 OUNCE 13.1% $ % Chg YA Units % Chg YA HONEY OUNCE OUNCE OUNCE OUNCE OUNCE OUNCE OUNCE OUNCE OUNCE 24 OUNCE 32 OUNCE 40 OUNCE 80 OUNCE Other 20.1% Glass Continues to Outperform, Commands Higher Price 35.1% Latest 52 Wks - W/E 12/03/16 Description Units % Chg Avg Unit $ $ % Chg YA Units YA Price HONEY 588,826, ,239, BOTTLE 290,900, ,910, JAR 138,766, ,718, BEAR 115,704, ,771, JUG 32,810, ,182, TUB 4,605, , BAG 2,384, , CAN 1,584, , BEEHIVE 701, , ENVELOPE IN BOX 403, , BOX 283, , TRAY 210, , CANISTER 209, , Latest 52 Wks - W/E 12/03/16 Description Units % Chg Avg Unit $ $ % Chg YA Units YA Price HONEY 588,826, ,239, PLASTIC 446,946, ,321, GLASS 139,563, ,690, METAL 1,728, , CARDBOARD 584, , COATED PAPER 2,098 2,
17 LIQUID HONEY CONTINUES DOMINANCE THROUGH STEADY GROWTH 554,608, ,826, ,863, ,730,271 Liquid 421,958, Other Forms $19,246, $588,826, Liquid All Other $611, $366, $527, $818, $6,584, $2,084, $3,926, $4,325, SOFT SPREAD SPREAD COMB LIQUID CAPPED WITH COMB CRYSTAL LIQUID WITH COMB GRANULE All Other Soft Spread -10.8% Spread +6.8% Crystal % % $ Growth CY 2016 Liquid +6.5% Comb -14.9% Liq Comb Capped +68.2% 17

18 HONEY 11 TH FASTEST GROCERY DEPARTMENT GROWER IN 2016 Outperformed the Grocery Department by $ Growth (+1.2%). 10 th in Unit Growth [94 Categories in Grocery Department] Nielsen xaoc+ Conv 52 Weeks ending 12/03/2016 AOD 72nd in Promo Activity [% $ Any Promo] 31st In Unit Price Growth 60 th in Market Size ($) 18
19 HEALTH AND WELLNESS CLAIMS GMO Free, Natural, and Organic Claims Outperform. Description Latest 52 Weeks- W/E 12/03/2016 $ $ % Chg YA Units Units % Chg YA HONEY 588,286, ,239, GMO FREE CLAIM 10,175, ,386, PRESERVATIVE FREE CLAIM 4,985, ,125, ORGANIC CLAIM 51,998, ,805, LOW OR REDUCED CALORIE CLAIM 12, , NATURAL CLAIM 68,628, ,524, NO ARTIFICIAL FLAVOR OR COLOR CLAIM 3,437, , NO ARTIFICIAL PRESERVATIVES CLAIM 1,419, (10.4) 329, (21.0) FORTIFIED CLAIM 4, (12.0) (13.7) SUGAR FREE CLAIM 1,349, (25.0) 503, (27.1) 19
20 HONEY DEMOGRAPHICS Growth in Consumption for Lower Income Families. Large, Higher income families continue to over index in Honey consumption. AGGREGATE INCOME % $ in % HH in - Product Product 2016 Product 2015 [01] - Under $20, [02] - $20,000 - $29, [03] - $30,000 - $39, [04] - $40,000 - $49, [05] - $50,000 - $69, Honey Makes Gains with Lower Income Families making between $20,000-$40,000 Annually [06] - $70,000 - $99, [07] - $100, HOUSEHOLD SIZE % $ in % HH in - Product Product 2016 Product 2015 [01] - Single Member [02] - Two Members [03] Members [04] - 5 or more Members Household Size Remains Consistent; The Larger the family, the more likely to purchase honey. 20
21 HONEY DEMOGRAPHICS Younger Households are consuming more Honey from ages Declines in Households with Head of Household aged 55+. AGE OF FEMALE HH % $ in % HH in - Product Product 2016 Product 2015 [01] - Under [02] [03] [04] [05] [06] [07] [08] [09] While Women aged See a large uptick, we see decreases in Female HH between the ages of AGE OF MALE HH % $ in % HH in - Product Product 2016 Product 2015 [01] - Under [02] [03] [04] [05] [06] [07] [08] [09] Older men (55+) are seeing decreases in honey consumption that follow the trend with older women. Men ages saw the largest increases in consumption. 21
22 HONEY DEMOGRAPHICS Households With Kids Consume More Honey than those Without Children. Older bustling Families and Senior Couples still have the highest rate of consumption. AGE OF CHILDREN % $ in % HH in - Product Product 2016 Product 2015 [01] - Under 6 Only [02] Only [03] Only [04] - Under 6 & [05] - Under 6 & There were significant jumps in consumption seen with Households with Kids under 6 and [06] & [07] - Under 6, 6-12 & [08] - No Children FAMILY BEHAVIORSTAGE % $ in % HH in - Product Product 2016 Product 2015 [01] - Start-up Families [02] - Small Scale Families [03] - Younger Bustling Families [04] - Older Bustling Families [05] - Young Transitionals [06] - Independent Singles [07] - Senior Singles [08] - Established Couples [09] - Empty Nest Couples [10] - Senior Couples Young Transitionals and Small Scale Families saw a notable increase in Honey Consumption from Senior Singles and Empty Nest Couples also saw decreases in consumption. 22
23 HONEY DEMOGRAPHICS Households in Affluent Suburban Spreads, as well as Asian and African American Households have the highest probability of purchasing honey. LIVING STATUS % $ in % HH in - Product Product 2016 Product 2015 Living Status remained fairly stable across the past year. [01] - Struggling Urban Cores [02] - Cosmopolitan Centers [03] - Affluent Suburban Spreads [04] - Plain Rural Living [05] - Modest Working Towns [06] - Comfortable Country However, Affluent Suburban Spreads took over as the most likely to consume honey, while households in Plain Rural Living scenarios remain less likely than average to purchase honey. ETHNICITY % $ in % HH in - Product Product 2016 Product 2015 [01] - Caucasian [02] - African American [03] - Asian [04] - Other Hispanic HISPANIC % $ in % HH in - Product Product 2016 Product 2015 [01] - Yes [02] - No Caucasians continue to lag behind every other Ethnicity in Honey Consumption, as Households of Asian descent remain the most likely to consume Honey. African American s also seeing increases in likelihood to purchase from this category. 23
24 HONEY DEMOGRAPHICS Military Women see a huge burst in consumption, making them the most likely to purchase honey of any other profession. Female HH Profession % $ in % HH in - Product Product 2016 Product 2015 [01] - Professional [02] - Prop, Managers, Officials [03] - Clerical [04] - Sales [05] - Craftsman / Foreman (Skilled) There was a dramatic decrease of consumption seen with Female Head of Households in the Farming Industry in [06] - Operative (Semi-Skilled) [07] - Service Workers & Private HH Workers [08] - Farm Owners, Managers, Foremen & Laborers [09] - Laborers [10] - Military [11] - Students Employed < 30 Hours [12] - Retired & Unemployed There also was a large increase in purchasing habits for Women in the Military purchasing honey, along with female Craftsman. 24
25 HONEY DEMOGRAPHICS Male Students are the most likely male profession to purchase honey, while Farm workers are the least. Male HH Profession % $ in % HH in - Product Product 2016 Product 2015 [01] - Professional [02] - Prop, Managers, Officials [03] - Clerical [04] - Sales [05] - Craftsman / Foreman (Skilled) [06] - Operative (Semi-Skilled) [07] - Service Workers & Private HH Workers [08] - Farm Owners, Managers, Foremen & Laborers [09] - Laborers [10] - Military [11] - Students Employed < 30 Hours [12] - Retired & Unemployed Households with a Male Head of Household whom are students saw a significant increase in consumption. Farm workers and laborers saw the lowest consumption. 25
26 HONEY DEMOGRAPHICS Less educated Households consume more Honey in Female HH Education % $ in % HH in - Product Product 2016 Product 2015 [01] - Grade School [02] - Some High School [03] - Graduated High School Households with less educated Female Head of Household s saw a Sizeable increase in consumption in 2016 [04] - Some College [05] - Graduated College [06] - Post College Grad [07] - No Female Head of Household Consumption Increases as Education Increases Male HH Education % $ in % HH in - Product Product 2016 Product 2015 [01] - Grade School [02] - Some High School [03] - Graduated High School [04] - Some College [05] - Graduated College [06] - Post College Grad [07] - No Male Head of Household In Line with above, Less Educated Male Head of Households also saw rather dramatic increased consumption 26


27
Office. Office. IRR Viewpoint 2015
 IRR Viewpoint 05 Above: Designed in 95 in the Art Deco style by architect Timothy Pflueger as the Pacific Telephone and Telegraph Building, 40 New Montgomery Street, San Francisco, CA has been the subject
CBRE CAP RATE SURVEY. A CBRE Publication. First Half Click to Enter
 CBRE CAP RATE SURVEY A CBRE Publication In This Issue: pg 2 pg 8 pg 17 pg 26 pg 36 pg 41 pg 44 Click to Enter United States The 10-year Treasury (UST) was measurably lower than 2% from April 2012 through
Economic Risks and Their Meaning for the Southwest STEVE COCHRANE, MANAGING DIRECTOR
 Economic Risks and Their Meaning for the Southwest STEVE COCHRANE, MANAGING DIRECTOR The Europeans Are All-in Composition of the European Central Bank s balance sheet, bil 5,000 Other assets Emergency
MetroMonitor Tracking Economic Recession and Recovery in America s 100 Largest Metropolitan Areas
 MetroMonitor Tracking Economic Recession and Recovery in America s 100 Largest Metropolitan Areas Howard Wial and Richard Shearer June 2011 (Updated on June 24, 2011) With job growth slowing and housing
Data Brief. Trends in Employer-Sponsored Health Insurance Premiums and Employee Contributions in Major Metropolitan Areas,
 December 2012 Data Brief Trends in Employer-Sponsored Health Insurance Premiums and Employee Contributions in Major Metropolitan Areas, 2003 2011 The mission of The Commonwealth Fund is to promote a high
Safe Harbor Caution Concerning Forward-Looking Statements Non-GAAP Financial Measures Important Information For Investors And Shareholders
 February 13, 2014 Safe Harbor Caution Concerning Forward-Looking Statements Certain statements in this communication regarding the proposed acquisition of Time Warner Cable Inc. ( Time Warner Cable ) by
State of the U.S. Multifamily Market. Q Review and Forecast
 State of the U.S. Multifamily Market Q1 2015 Review and Forecast Agenda Economy Leasing Fundamentals Rent and NOI Trends Single-Family Market Capital Markets Economy page 3 GDP Growth Contributions To
Media Kit. Products and demographics
 2012 Media Kit Products and demographics The whole family... Washington Business Journal The weekly newspaper is the source for local business news, in-depth industry coverage, insights and information.
AEI Center on Housing Markets and Finance Announces Ten Best and Worst Metro Areas to Be a First Time Homebuyer
 AEI Center on Housing Markets and Finance Announces Ten Best and Worst Metro Areas to Be a First Time Homebuyer Edward Pinto and Tobias Peter November 28th, 2018 New AEI study ranks 50 metros by home price
2014 U.S. Census (2015) Median African-American Household Income Rank, Memphis Included. Household Median Income Ranking, African American Population
 Median African-American Household Income Rank, Memphis Included. Household Median Income Ranking, African American Population") 2015 2015 Rankings Report Prepared by Elena Delavega, PhD, MSW Department of Social Work Benjamin L. Hooks Institute for Social Change University of Memphis 2014 U.S. Census (2015) - Rank, Memphis Included
2015 2015 Rankings Report Prepared by Elena Delavega, PhD, MSW Department of Social Work Benjamin L. Hooks Institute for Social Change University of Memphis 2014 U.S. Census (2015) - Rank, Memphis Included
HIGH AND WIDE: INCOME INEQUALITY GAP IN THE DISTRICT ONE OF BIGGEST IN THE U.S. By Wes Rivers
 An Affiliate of the Center on Budget and Policy Priorities 820 First Street NE, Suite 510 Washington, DC 20002 (202) 408-1080 Fax (202) 325-8839 www.dcfpi.org March 13, 2014 HIGH AND WIDE: INCOME INEQUALITY
ERRATA. To: Recipients of MG-388-RC, Estimating Terrorism Risk, RAND Corporation Publications Department. Date: December 2005
 ERRATA To: Recipients of MG-388-RC, Estimating Terrorism Risk, 25 From: RAND Corporation Publications Department Date: December 25 Re: Corrected pages (pp. 23 24, Table 4.1,, Density, Density- Weighted,
Hotel Valuation and Transaction Trends For the U.S. Lodging Industry
 Hotel Valuation and Transaction Trends For the U.S. Lodging Industry Stephen Rushmore, CHA, MAI, FRICS President and Founder HVS International 372 Willis Avenue Mineola, NY 11501 516-248-8828 ext. 204
Deutsche Bank Global Industrials and Basic Materials Conference June 14, 2012
 Deutsche Bank Global Industrials and Basic Materials Conference June 14, 2012 1 Statement Of Forward-looking Information Certain information included in this presentation is forward-looking within the
CALL REPORT MEMBER BANK BOARD OF GOVERNORS OF THE FEDERAL RESERVE SYSTEM WASHINGTON
 MEMBER BANK CALL REPORT BOARD OF GOVERNORS OF THE FEDERAL RESERVE SYSTEM WASHINGTON Assets and Liabilities: TABLE OF CONTENTS Of All Member Banks June 0, 98, April iz, 98, and June 0, 97 Of All Member
The Five Retail Trends to Watch in January 14, 2015
 The Five Retail Trends to Watch in 2015 January 14, 2015 U.S. ECONOMIC TRENDS Inflation Adjusted Crude Oil Prices Fall Below Long-Term Average Price per Barrel (Nov. 2014 Dollars) $160 $120 $80 $40 $0
Employee Benefits Alert
 Employee Benefits Alert September 2005 Issue No. 48 Health Saving Accounts: Comparability Rules The IRS and Treasury recently published proposed regulations concerning the comparability rules for employer
TRUCKERS APPLICATION
 DEEP SOUTH TRUCKERS APPLICATION PROPOSAL FORM - PRIMARY COVERAGE/COMMERCIAL TRUCKMEN REQUIRED FOR 10 OR MORE POWER UNITS THAT ARE ICC REGULATED **IMPORTANT - PLEASE NOTE** ALL ITEMS MUST BE COMPLETED IN
Employee Benefits Alert
 Employee Benefits Alert Issue 110 June 2007 The Massachusetts Health Care Reform Act: What s an Employer to Do? The Massachusetts Health Care Reform Act became law in April 2006; the July 1, 2007 effective
D E E P S O U T H O F T E N N E S S E E
 5 410 MARYLAND WAY, SUITE 41 0, B RENTWOOD, TN 3 7027 P H O N E : 6 1 5. 8 3 2. 8 9 0 0 o r 8 8 8. 8 3 2. 8 9 0 0 F A X : 6 1 5. 8 3 2. 5 4 3 4 o r 8 8 8. 8 3 2. 8 9 0 1 TRUCKERS APPLICATION PROPOSAL FORM
Struggling to Escape the Fallout of the Great Recession MARISA Di NATALE, MANAGING DIRECTOR
 Struggling to Escape the Fallout of the Great Recession MARISA Di NATALE, MANAGING DIRECTOR FROM MOODY S ECONOMY.COM Broad-Based Slowing Across the Nation Total employment excluding federal government,
Econometric Advisors APARTMENT OVERVIEW AND OUTLOOK Q4 2017
 Econometric Advisors APARTMENT OVERVIEW AND OUTLOOK Q4 2017 THE U.S. ECONOMY WILL REMAIN ON FIRM FOOTING IN 2018 JOB GROWTH WILL MODERATE AS LABOR MARKET TIGHTENS FURTHER STRONG CONSUMPTION, HIGHER PRIVATE
Emerging Trends in Real Estate Sustaining Momentum but Taking Nothing for Granted
 Emerging Trends in Real Estate 2015 Sustaining Momentum but Taking Nothing for Granted DALLAS November 6, 2014 36th annual outlook 1,400+ interviews and surveys of industry leaders Rewind: 2014 Emerging
Employee Benefits Alert
 Legal & Research Group Benefits Alert Issue No. 24 October 2004 Benefits Brokerage & Consulting Services Rx Purchasing Coalition HR Consulting Data Analysis Benefits Administration Retirement Services
2019 Outlook. January
 2019 Outlook January 2019 0 Performance in the multifamily market remained healthy during 2018 and is expected to continue into 2019, but with more modest growth in comparison to recent years. The multifamily
Affordable Coverage: Short-Term Health Insurance and the ACA
 Affordable Coverage: Short-Term Health Insurance and the ACA JULY 2018 2 Short-Term Health Plan s Cost 80 Percent Less than Obamacare Plans, ehealth Analysis Finds Short-term health insurance premiums
50-State Property Tax Comparison Study: For Taxes Paid in Executive Summary
 50-State Property Tax Comparison Study: For Taxes Paid in 2017 Executive Summary By Lincoln Institute of Land Policy and Minnesota Center for Fiscal Excellence April 2018 As the largest source of revenue
HISTORICAL ANALYSIS of CENSUS TRANSPORTATION DATA
 HISTORICAL ANALYSIS of CENSUS TRANSPORTATION DATA PREPARED BY: MARCH 2013 T13-01 ii REPORT DOCUMENTATION TITLE Historical Analysis of Census Transportation Data AUTHOR Robert B. Case, PE, PTOE ABSTRACT
MY PLAN IS GETTING A REBATE FROM THE INSURER WHAT DO I DO WITH IT?
 HUMAN CAPITAL PRACTICE ALERT: HEALTH CARE REFORM BILL August 2012 www.willis.com MY PLAN IS GETTING A REBATE FROM THE INSURER WHAT DO I DO WITH IT? EXECUTIVE SUMMARY All insured employer group medical
2017 SUBSCRIBER STUDY
 2017 SUBSCRIBER STUDY business is our middle name business is our middle name BUSINESS IS OUR MIDDLE NAME Atl anta Business Chronicle TODAY signature events print digital BUSINESS IS OUR MIDDLE NAME In
US CAPITAL MARKETS REPORT
 US CAPITAL MARKETS REPORT Capitalization Rates By Property Type Fall 2016 US Capital Markets Report Capitalization Rates By Asset Type OVERVIEW Year-to-date investment sales volume lagged on a year-over-year
CYCLE FORECAST Real Estate Market Cycles Third Quarter 2017 Estimates November 2016
 CYCLE FORECAST Real Estate Market Cycles Third Quarter 0 Estimates November 0 It is expected that 0 should have a growth trajectory higher than the past six years. Economists revised their forecasts to
Reverse Market Insight, Inc PCH, Suite D4, Dana Point, CA (682) HECM Lenders (FHA Approved Only) Competition Growth 10.
 HECM Lenders (FHA Approved Only) Competition Growth 10.") Reverse Market Insight, Inc. 34232 PCH, Suite D4, Dana Point, CA (682) 651-5632 HECM s (FHA Approved Only) Industry Overview HECMs Endorsed through July Next Release Date: Week 1 of September Endorsement
Reverse Market Insight, Inc. 34232 PCH, Suite D4, Dana Point, CA (682) 651-5632 HECM s (FHA Approved Only) Industry Overview HECMs Endorsed through July Next Release Date: Week 1 of September Endorsement
CAPITALIZATION RATES BY PROPERTY TYPE
 RATES BY PROPERTY TYPE MID-YEAR 2014 0 RATES BY ASSET TYPE MID-YEAR 2014 O V E R V I E W Capital continues to flow steadily into the U.S. real estate market, as both domestic and foreign investors increase
INDUSTRIAL REPORT VIEWPOINT 2017 / COMMERCIAL REAL ESTATE TRENDS. By: Hugh F. Kelly, PhD, CRE. irr.com. An Integra Realty Resources Publication
 INDUSTRIAL REPORT VIEWPOINT 2017 / COMMERCIAL REAL ESTATE TRENDS By: Hugh F. Kelly, PhD, CRE Growing Consumption Fuels the Industrial Sector IRR research indicates that more than half of U.S. industrial
State Of The U.S. Industrial Market: 2017 Q2
 State Of The U.S. Industrial Market: 2017 Q2 Copyright 2017 CoStar Realty Information, Inc. No reproduction or distribution without permission. The following information includes projections and analyses
Reverse Market Insight, Inc PCH, Suite D4, Dana Point, CA (682) HECM Lenders (FHA Approved Only) Competition Growth 43.
 HECM Lenders (FHA Approved Only) Competition Growth 43.") Reverse Market Insight, Inc. 34232 PCH, Suite D4, Dana Point, CA (682) 651-5632 HECM (FHA Approved Only) Industry Overview HECMs Endorsed through February Next Release Date: Week 1 of April Endorsement
Reverse Market Insight, Inc. 34232 PCH, Suite D4, Dana Point, CA (682) 651-5632 HECM (FHA Approved Only) Industry Overview HECMs Endorsed through February Next Release Date: Week 1 of April Endorsement
Emerging Trends in Real Estate 2012
 Emerging Trends in Real Estate 2012 Longest published annual real estate outlook 33rd consecutive year Most predictive industry forecast Based on surveys/interviews with 950 industry leaders Jointly published
Reverse Market Insight, Inc Acero, Suite 140, Mission Viejo, CA (682) HECM Lenders (FHA Approved Only) Competition Growth -6.
 HECM Lenders (FHA Approved Only) Competition Growth -6.") Reverse Market Insight, Inc. 25910 Acero, Suite 140, Mission Viejo, CA (682) 651-5632 HECM (FHA Approved Only) Industry Overview HECMs Endorsed through June Next Release Date: Week 1 of August Endorsement
Reverse Market Insight, Inc. 25910 Acero, Suite 140, Mission Viejo, CA (682) 651-5632 HECM (FHA Approved Only) Industry Overview HECMs Endorsed through June Next Release Date: Week 1 of August Endorsement
Reverse Market Insight, Inc PCH, Suite D4, Dana Point, CA (682) HECM Lenders (FHA Approved Only) Competition Growth -20.
 HECM Lenders (FHA Approved Only) Competition Growth -20.") Reverse Market Insight, Inc. 34232 PCH, Suite D4, Dana Point, CA (682) 651-5632 HECM s (FHA Approved Only) Industry Overview HECMs Endorsed through April Next Release Date: Week 1 of June Endorsement Growth
Reverse Market Insight, Inc. 34232 PCH, Suite D4, Dana Point, CA (682) 651-5632 HECM s (FHA Approved Only) Industry Overview HECMs Endorsed through April Next Release Date: Week 1 of June Endorsement Growth
Reverse Market Insight, Inc PCH, Suite D4, Dana Point, CA (682) HECM Lenders (FHA Approved Only) Competition Growth -8.
 HECM Lenders (FHA Approved Only) Competition Growth -8.") Reverse Market Insight, Inc. 34232 PCH, Suite D4, Dana Point, CA (682) 651-5632 HECM s (FHA Approved Only) Industry Overview HECMs Endorsed through November Next Release Date: Week 1 of January Endorsement
Reverse Market Insight, Inc. 34232 PCH, Suite D4, Dana Point, CA (682) 651-5632 HECM s (FHA Approved Only) Industry Overview HECMs Endorsed through November Next Release Date: Week 1 of January Endorsement
Employee Benefits Alert
 Employee Benefits Alert Issue No. 21 Legal & Research Group September 2004 Benefits Brokerage & Consulting Services Rx Purchasing Coalition HR Consulting Data Analysis Benefits Administration Retirement
Reverse Market Insight, Inc PCH, Suite D4, Dana Point, CA (682) HECM Lenders (FHA Approved Only) Competition Growth -6.
 HECM Lenders (FHA Approved Only) Competition Growth -6.") Reverse Market Insight, Inc. 34232 PCH, Suite D4, Dana Point, CA (682) 651-5632 HECM s (FHA Approved Only) Industry Overview HECMs Endorsed through March Next Release Date: Week 1 of May Endorsement Growth
Reverse Market Insight, Inc. 34232 PCH, Suite D4, Dana Point, CA (682) 651-5632 HECM s (FHA Approved Only) Industry Overview HECMs Endorsed through March Next Release Date: Week 1 of May Endorsement Growth
Reverse Market Insight, Inc Acero, Suite 140, Mission Viejo, CA (682) HECM Lenders (FHA Approved Only) Competition Growth -4.
 HECM Lenders (FHA Approved Only) Competition Growth -4.") Reverse Market Insight, Inc. 25910 Acero, Suite 140, Mission Viejo, CA (682) 651-5632 HECM (FHA Approved Only) Industry Overview HECMs Endorsed through December Next Release Date: Week 1 of February Endorsement
Reverse Market Insight, Inc. 25910 Acero, Suite 140, Mission Viejo, CA (682) 651-5632 HECM (FHA Approved Only) Industry Overview HECMs Endorsed through December Next Release Date: Week 1 of February Endorsement
Capital Market Update. February 10, 2011 Marc Louargand, Ph.D., CRE, FRICS Principal SALTASH PARTNERS LLC investing in American ingenuity
 Capital Market Update February 10, 2011 Marc Louargand, Ph.D., CRE, FRICS Principal SALTASH PARTNERS LLC investing in American ingenuity A Brief Tour of the Capital Market What s happened in the past year?
Reverse Market Insight, Inc Acero, Suite 140, Mission Viejo, CA (682) HECM Lenders (FHA Approved Only) Competition Growth -10.
 HECM Lenders (FHA Approved Only) Competition Growth -10.") Reverse Market Insight, Inc. 25910 Acero, Suite 140, Mission Viejo, CA (682) 651-5632 HECM (FHA Approved Only) Industry Overview HECMs Endorsed through August Next Release Date: Week 1 of October Endorsement
Reverse Market Insight, Inc. 25910 Acero, Suite 140, Mission Viejo, CA (682) 651-5632 HECM (FHA Approved Only) Industry Overview HECMs Endorsed through August Next Release Date: Week 1 of October Endorsement
INTRODUCTION AND SUMMARY
 1 INTRODUCTION AND SUMMARY Rising house prices and incomes, an aging housing stock, and a pickup in household growth are all contributing to today s strong home improvement market. Demand is robust in
Reverse Market Insight, Inc Acero, Suite 140, Mission Viejo, CA (682) HECM Lenders (FHA Approved Only) Competition Growth 1.
 HECM Lenders (FHA Approved Only) Competition Growth 1.") Reverse Market Insight, Inc. 25910 Acero, Suite 140, Mission Viejo, CA (682) 651-5632 HECM s (FHA Approved Only) Industry Overview HECMs Endorsed through February Next Release Date: Week 1 of April Endorsement
Reverse Market Insight, Inc. 25910 Acero, Suite 140, Mission Viejo, CA (682) 651-5632 HECM s (FHA Approved Only) Industry Overview HECMs Endorsed through February Next Release Date: Week 1 of April Endorsement
Cycle Monitor Real Estate Market Cycles Fourth Quarter 2017 Analysis
 Black Creek Research Cycle Monitor Real Estate Market Cycles Fourth Quarter 0 Analysis Real Estate Physical Market Cycle Analysis of Property Types in Metropolitan Statistical Areas (MSAs). Many economists
Macroeconomic Overview: The Sunbelt Continues To Shine. Michael Cohen Director of Advisory Services Property & Portfolio Research ULI SOUTH CAROLINA
 Macroeconomic Overview: The Sunbelt Continues To Shine Michael Cohen Director of Advisory Services Property & Portfolio Research Macro Trends A THREE-SPEED WORLD AND A RECESSION IN THE EUROZONE 4% Real
Cycle Monitor Real Estate Market Cycles First Quarter 2018 Analysis
 Black Creek Research Cycle Monitor Real Estate Market Cycles First Quarter 20 Analysis Real estate physical market cycle analysis of five property types in Metropolitan Statistical Areas (MSAs). Equilibrium
FOR IMMEDIATE RELEASE Contact: Ann Marie Gorden/Robert Nihen
 cutting through complexity News FOR IMMEDIATE RELEASE Contact: Ann Marie Gorden/Robert Nihen June 24, 2014 KPMG LLP 201-505-6288/201-307-8296 agorden@kpmg.com / rnihen@kpmg.com CINCINNATI, CLEVELAND, ATLANTA
RETAIL SECTOR CONTINUES TO IMPROVE, DESPITE DROP IN CONSUMER CONFIDENCE
 RETAIL MARKET REPORT: 3Q RETAIL SECTOR CONTINUES TO IMPROVE, DESPITE DROP IN CONSUMER CONFIDENCE KEY INDICATORS: Key retail market indicators continue to send mixed signals. Monthly retail sales (ex: motor
THE LOOMING CHALLENGE OF U.S. COMPETITIVENESS: IMPLICATIONS FOR PHILADELPHIA
 THE LOOMING CHALLENGE OF U.S. COMPETITIVENESS: IMPLICATIONS FOR PHILADELPHIA Michael E. Porter (and Jan W. Rivkin) Harvard Business School Innovation Leadership Speaker Series Fox School of Business March
CYCLE FORECAST Real Estate Market Cycles First Quarter 2018 Estimates May 2017
 CYCLE FORECAST Real Estate Market Cycles First Quarter 20 Estimates May 20 So far, 20 continues along at a slow Gross Domestic Product (GDP) growth rate near 2% and employment continues to hover above
U.S. ECONOMIC & PROPERTY MARKET PERSPECTIVE
 AEW RESEARCH U.S. ECONOMIC & PROPERTY MARKET PERSPECTIVE Q4 2018 AEW RESEARCH U.S. ECONOMIC & PROPERTY MARKET PERSPECTIVE Q 4 2018 1 Prepared by AEW Research, March 2019 This material is intended for information
equity advisory services
 CAPABILITIES equity advisory services YOUR SINGLE POINT OF CONTACT FOR THE ENTIRE CAPITAL STACK Better relationships. Better results. EQUITY VOLUME BY PROPERTY TYPE Our close relationships with debt providers
RETAIL CONTINUES TO STRUGGLE AS IMPROVEMENTS ARE NOT YET SUSTAINED
 RETAIL MARKET REPORT: 2Q RETAIL CONTINUES TO STRUGGLE AS IMPROVEMENTS ARE NOT YET SUSTAINED KEY INDICATORS: Key retail market indicators continue to send mixed signals. Monthly retail sales (excluding
MEN S MAGAZINE NETWORK
 MEN S MAGAZINE NETWORK Car and Driver, MotorTrend, Popular Mechanics 2015 MEDIA KIT PLN Publishers Local Networks, LLC 576 Post Road Darien, CT 06820 Tel: 203.656.1000 Fax: 203.656.1007 info@publisherslocalnetworks.com
Reverse Market Insight, Inc Acero, Suite 140, Mission Viejo, CA (682) HECM Lenders (FHA Approved Only) Competition Growth -6.
 HECM Lenders (FHA Approved Only) Competition Growth -6.") Reverse Market Insight, Inc. 25910 Acero, Suite 140, Mission Viejo, CA (682) 651-5632 HECM s (FHA Approved Only) Industry Overview HECMs Endorsed through March Next Release Date: Week 1 of May Endorsement
Reverse Market Insight, Inc. 25910 Acero, Suite 140, Mission Viejo, CA (682) 651-5632 HECM s (FHA Approved Only) Industry Overview HECMs Endorsed through March Next Release Date: Week 1 of May Endorsement
Metro Washington, DC State of the Market
 Metro Washington, DC State of the Market Q1 2016 U.S. office clock San Francisco Peninsula Silicon Valley Houston Dallas, San Francisco Austin Nashville Peaking phase Falling phase Denver, Minneapolis,
Reverse Market Insight, Inc Acero, Suite 140, Mission Viejo, CA (682) HECM Lenders (FHA Approved Only) Competition Growth -6.
 HECM Lenders (FHA Approved Only) Competition Growth -6.") Reverse Market Insight, Inc. 25910 Acero, Suite 140, Mission Viejo, CA (682) 651-5632 HECM (FHA Approved Only) Industry Overview HECMs Endorsed through January Next Release Date: Week 1 of March Endorsement
Reverse Market Insight, Inc. 25910 Acero, Suite 140, Mission Viejo, CA (682) 651-5632 HECM (FHA Approved Only) Industry Overview HECMs Endorsed through January Next Release Date: Week 1 of March Endorsement
equity advisory services
 CAPABILITIES equity advisory services YOUR SINGLE POINT OF CONTACT FOR THE ENTIRE CAPITAL STACK Better relationships. Better results. EQUITY VOLUME BY PROPERTY TYPE Our close relationships with debt providers
ehealth Inventory Report of Major Medical Health Plans Available Off of Government Exchanges
 ehealth Inventory Report of Major Medical Health Available Off of Government Exchanges February 2014 Introduction Beginning January 1, 2014, all new major medical health insurance plans were required to
Employee Benefits Alert
 Legal & Research Group Employee Benefits Alert Issue No. 40 June 2005 Legislative & Compliance Benefits Brokerage & HR Consulting Services Rx Purchasing Coalition Data Analysis Benefits Administration
The Economic Backdrop When will this cycle end?
 The Economic Backdrop When will this cycle end? How far are we into the current economic expansion? Current expansion in 8 th year; 4 th longest since 1960 Length of economic expansions (months) Apr-91-Feb-01
Reverse Market Insight, Inc Acero, Suite 140, Mission Viejo, CA (682) HECM Lenders (FHA Approved Only) Competition Growth 10.
 HECM Lenders (FHA Approved Only) Competition Growth 10.") Reverse Market Insight, Inc. 25910 Acero, Suite 140, Mission Viejo, CA (682) 651-5632 HECM (FHA Approved Only) Industry Overview HECMs Endorsed through January Next Release Date: Week 1 of March Endorsement
Reverse Market Insight, Inc. 25910 Acero, Suite 140, Mission Viejo, CA (682) 651-5632 HECM (FHA Approved Only) Industry Overview HECMs Endorsed through January Next Release Date: Week 1 of March Endorsement
ADESA Rewards. Frequently Asked Questions
 ADESA Rewards Frequently Asked Questions 1. What is ADESA Rewards? ADESA Rewards provides eligible participants (see question #2 below) the opportunity to earn ADESA reward points when they make purchases
US Hotel Industry Overview. Chris Crenshaw
 US Hotel Industry Overview Chris Crenshaw ccrenshaw@str.com July 2014 (12 MMA): All Signs Point To A Sellers Market % Change Room Supply* 1.8 bn 0.8% Room Demand* 1.1 bn 3.4% Occupancy 63 % 2.6% A.D.R.*
The Brookings Institution Metropolitan Policy Program Bruce Katz, Director
 The Brookings Institution Metropolitan Policy Program Bruce Katz, Director Diagnosing Cities: Lessons from America Delivering Sustainable Communities Summit February 1st, 2005 Diagnosing Cities Lessons
GWIPP WORKING PAPER SERIES. Have central cities come back? Kimberly Furdell Edward W. (Ned) Hill Harold Wolman
 Hill Harold Wolman") GWIPP WORKING PAPER SERIES Have central cities come back? Kimberly Furdell Edward W. (Ned) Hill Harold Wolman Working Paper Number 5 http://www.gwu.edu/~gwipp/papers/wp005 March 2004 George Washington
GWIPP WORKING PAPER SERIES Have central cities come back? Kimberly Furdell Edward W. (Ned) Hill Harold Wolman Working Paper Number 5 http://www.gwu.edu/~gwipp/papers/wp005 March 2004 George Washington
The Brookings Institution Center on Urban and Metropolitan Policy Bruce Katz, Director
 The Brookings Institution Center on Urban and Metropolitan Policy Bruce Katz, Director The New Art of Governing Presentation at the Fannie Mae Foundation Annual Housing Conference October 17th, 2003 The
Strong conclusion to 2015, some caution ahead in 2016
 MARKETVIEW U.S. Office, Q4 215 Strong conclusion to 215, some caution ahead in 216 Vacancy Rate 13.1% Lease Rate $29.7 PSF Net Absorption 19.4 MSF Completions 12.1 MSF *Arrows indicate change from previous
Joseph L. Carter Executive Vice President November 2014
 Joseph L. Carter Executive Vice President November 2014 Trends In Banking The problems created by the financial down turn are in the rearview mirror. The national economy remains sluggish and loan growth
Relationships. Results. COMPANY OVERVIEW COMMERCIAL REAL ESTATE DEBT, EQUITY & SERVICING
 Relationships. COMPANY OVERVIEW Results. COMMERCIAL REAL ESTATE DEBT, EQUITY & SERVICING COMMERCIAL REAL ESTATE DEBT, EQUITY & SERVICING Relationships. Results. For more than 50 years, NorthMarq Capital
U.S. ECONOMIC & PROPERTY MARKET PERSPECTIVE
 AEW RESEARCH U.S. ECONOMIC & PROPERTY MARKET PERSPECTIVE Q2 2018 AEW RESEARCH U.S. ECONOMIC & PROPERTY MARKET PERSPECTIVE Q 2 2018 1 Prepared by AEW Research, June 2018 This material is intended for information
CAPITAL MARKETS UPDATE. Suburban Office: Is this the Next Play?
 CAPITAL MARKETS UPDATE Suburban Office: Is this the Next Play? October 2016 Investment Thesis Background Suburban office product has lagged the property recovery cycle. Most of the lag is the result of
MISSOURI COMMERCIAL AUTO FLEET INSURANCE APPLICATION Entire application must be completed and signed.
 MISSOURI COMMERCIAL AUTO FLEET INSURANCE APPLICATION Entire application must be completed and signed. GENERAL INFORMATION Individual Corporation Partnership LLC Other Name Yrs. in Trucking Industry Yrs.
multifamily market overview presented by: Kurt Shoemaker First Vice President
 multifamily market overview 2019 presented by: Kurt Shoemaker First Vice President g r e a t e r d a y t o n a p a r t m e n t a s s o c i a t i o n agenda 01 02 03 04 05 06 macro-level economic indicators
MAINE COMMERCIAL AUTO FLEET INSURANCE APPLICATION Entire application must be completed and signed.
 MAINE COMMERCIAL AUTO FLEET INSURANCE APPLICATION Entire application must be completed and signed. GENERAL INFORMATION Individual Corporation Partnership LLC Other Name Yrs. in Trucking Industry Yrs. Under
The Future of Transit in a Fiscally Constrained Political Environment (Draft) By Wendell Cox Principal, Demographia St.
 By Wendell Cox Principal, Demographia St.") The Future of Transit in a Fiscally Constrained Political Environment (Draft) By Wendell Cox Principal, Demographia St. Louis, MO-IL Paper Prepared for the Florida State University Transit Symposium May
The Future of Transit in a Fiscally Constrained Political Environment (Draft) By Wendell Cox Principal, Demographia St. Louis, MO-IL Paper Prepared for the Florida State University Transit Symposium May
MetroMonitor Tracking Economic Recession and Recovery in America s 100 Largest Metropolitan Areas
 MetroMonitor Tracking Economic Recession and Recovery in America s 100 Largest Metropolitan Areas Howard Wial and Richard Shearer September 2011 The most recent national economic data show a stalled economic
Office-Using Jobs and Net Migration Point to Continued Strength
 October 20, 2017 Office-Using Jobs and Net Migration Point to Continued Strength Key Takeaways Secondary Sunbelt office markets are priced to offer attractive, risk-adjusted returns relative to the Gateway²
ZipRealty, Inc. Supplemental Data Reclassification of Consolidated Statement of Operations
 Reclassification of Consolidated Statement of Operations Effective January 1, 2007, for income statement presentation purposes, we have reclassified sales support and marketing expenses from general and
N o t i c e . - October 8, Cancel Date: into the CCDM. Subject: Small Business/Self-Employed
 Department Internal Office of of the Revenue Chief Counsel Treasury Service N o t i c e +, N(30)000-349. - October 8, 2000 Division Counsel, Subject: Small Business/Self-Employed Upon Incorporation Cancel
Regional Snapshot: The Cost of Living in Metro Atlanta
 Regional Snapshot: The Cost of Living in Metro Atlanta Photo by rawpixel.com on Unsplash Atlanta Regional Commission, February 2018 For more information, contact: cdegiulio@atlantaregional.org In Summary
Relationships. Results. COMPANY OVERVIEW COMMERCIAL REAL ESTATE DEBT, EQUITY & SERVICING
 Relationships. COMPANY OVERVIEW Results. COMMERCIAL REAL ESTATE DEBT, EQUITY & SERVICING C O M M E R C I A L R E A L E S TAT E D E B T, E Q U I T Y & S E R V I C I N G Relationships. Results. For more
Captain CREDIT Crunch
 Captain CREDIT Crunch April 9, 2008 Presented by: Patrick Devereaux Senior Director The Times They Are A-Changin Post Credit Crunch Investment Market Fundamentals Of Commercial Real Estate Remain Strong
RELIABILITY. RELATIONSHIPS. RESULTS.
 RELIABILITY. RELATIONSHIPS. RESULTS. DONE DEALS 2013 BEYOND NUMBERS. BEYOND BORDERS. BEYOND EXPECTATIONS. At PNC Business Credit, we have a longterm track record of reliability, with more than 600 done
GYPSUM COMPANY. Forty-seventh Annual Report Fiscal Year Ended December 31, 1948
 GYPSUM COMPANY Forty-seventh Annual Report Fiscal Year Ended December 31, 1948 United States Gypsum Company (AN ILLINOIS CORPORATION) S is Forty-seventh Annual Report Fiscal Year Ended December 31, 1948
State of the Office Market
 State of the Office Market Al Pontius Brian McAuliffe James Street Bill Rogalla Managing Director Marcus & Millichap Head of Transactions RREEF Co-Head, Dispositions Prudential Real Estate Investors Senior
UC Berkeley Fisher Center Working Papers
 UC Berkeley Fisher Center Working Papers Title Homeownership in Crisis: Where are We Now? Permalink https://escholarship.org/uc/item/31q9h8m0 Authors Rosen, Kenneth T. Bank, David Eckstein, Adam et al.
Recapitalizing Your HUD Properties: What s New, What s Next?
 Recapitalizing Your HUD Properties: What s New, What s Next? 1 #Connections2015 Greg Chin California Housing Partnership Corporation greg@chpc.net Kathleen Mertz Christian Church Homes kmertz@cchnc.org
COMMERCIAL. first look
 CCRSI RELEASE AUGUST 213 (With data through June 213) COMMERCIAL REAL ESTATE PRICES SEE MIDYEAR SURGE WITH STRONGEST QUARTER RLY INCREASE SINCE 211 RECOVERY BROADENS AS GENERAL COMMERCIAL SEGMENT EDGES
City Economic and Fiscal Resilience: How can we measure it? How can we improve it? #LiveAtUrban
 City Economic and Fiscal Resilience: How can we measure it? How can we improve it? #LiveAtUrban City Economic and Fiscal Resilience: How can we measure it? How can we improve it? #LiveAtUrban The Fiscal
TRUCK FLEET APPLICATION 10+ Power Units Entire application must be completed and signed.
 GENERAL INFORMATION TRUCK FLEET APPLICATION 10+ Power Units Entire application must be completed and signed. Individual Corporation Partnership LLC Other Name Yrs. Applicant has been Operating Under Business
WEST VIRGINIA TRUCK APPLICATION 1-10 Power Units
 WEST VIRGINIA TRUCK APPLICATION 1-10 Power Units Entire Application Must Be Completed and Signed Submission Number: Proposed Effective Dates: FROM: TO: GENERAL INFORMATION Individual Corporation Partnership
2007 Outlook for Southern California Housing
 Outlook for Southern Housing Presentation at the RERCSC Quarterly Luncheon Meeting, Cal Poly University, Pomona, March, U.S. Expansion Continues Outlook for Southern Housing Real Estate Research Council
City Income Inequality
 CSLF REPORT #1 JUNE 17, 2014 City Income Inequality Lakshmi Pandey David L. Sjoquist Laura Wheeler 2 Introduction A recent report from the Brookings Institution (Berube 2014) explored the income inequality
Roundtable on Income Equality, Social Inclusion and Mobility OECD Paris
 National Issues in the USA in Economic Development, Mobility and Income Inequality Roundtable on Income Equality, Social Inclusion and Mobility OECD Paris April 4,5 2016 Intent of this Paper This paper