AEI Center on Housing Markets and Finance Announces Ten Best and Worst Metro Areas to Be a First Time Homebuyer
|
|
|
- Moris Gibbs
- 5 years ago
- Views:
Transcription
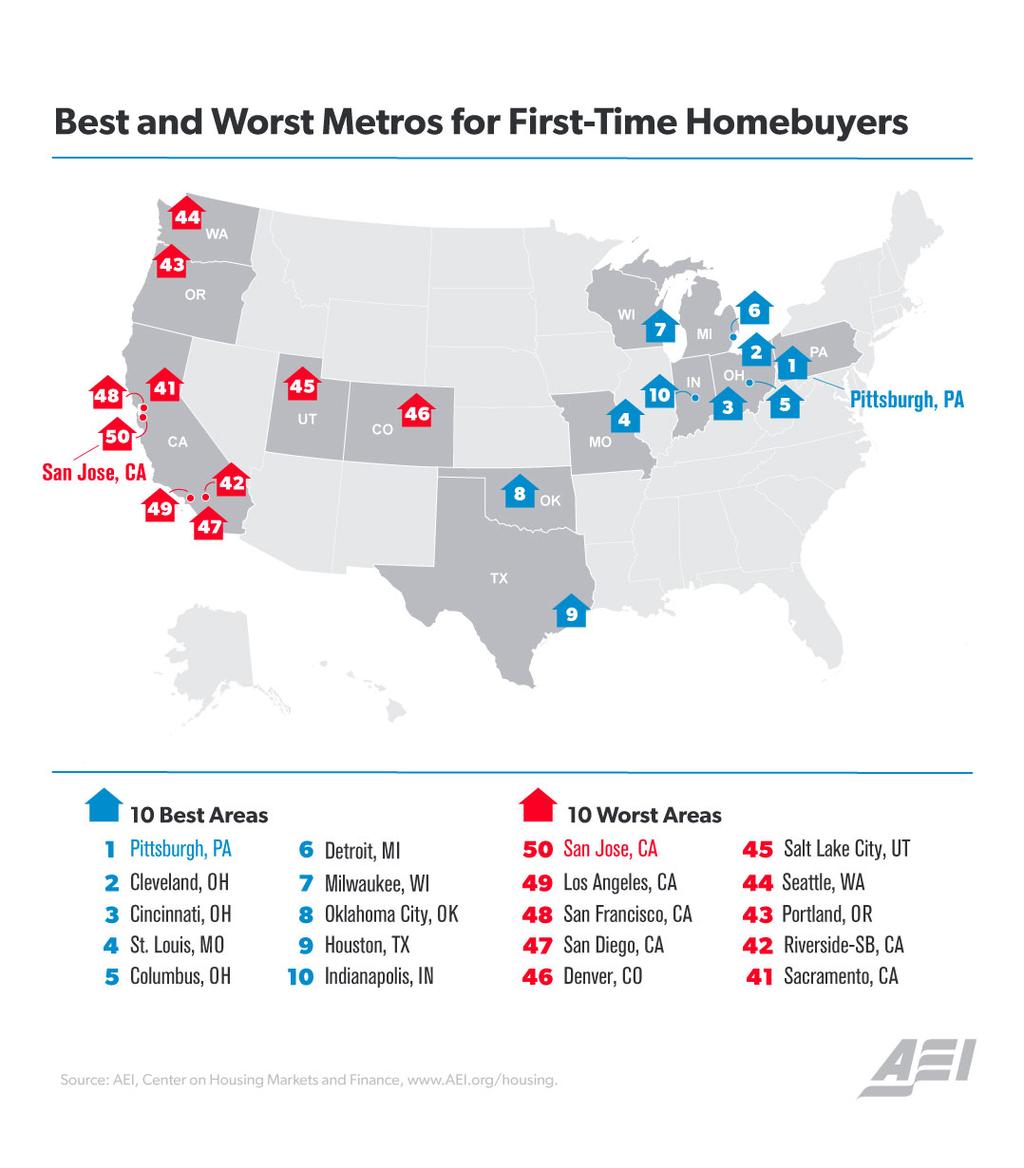
1 AEI Center on Housing Markets and Finance Announces Ten Best and Worst Metro Areas to Be a First Time Homebuyer Edward Pinto and Tobias Peter November 28th, 2018 New AEI study ranks 50 metros by home price to ratio for first time buyers, with Pittsburgh being the most and San Jose being the least affordable. When AEI set out to rank 50 large metros by home price to ratio for first time buyers, it came as no surprise that it is easier in some areas of the country to become a first time buyer (FTB) than others. Using actual home prices and borrower s for 2017 FTB government guaranteed loan transactions, AEI calculated the home price to ratio for the 50 largest metro areas. 1 Across the 50 metros, this ratio was 3.3, that is the FTB spent 3.3 times household to purchase a house. The ten most affordable had a ratio of 2.6 while the ten least affordable had a ratio of 4.3. Of the ten most affordable, seven were in the Midwest, two in the South, and one in the Northeast. Of the ten least affordable, all were in the West. Other key metrics examined include: averages for square feet of living area and price per square foot of living area. The most affordable metro was Pittsburgh with a 2.3 ratio of home cost compared to. The least affordable metro was San Jose with a 5.0 ratio more than 2 times the ratio for Pittsburgh. In San Jose, FTBs purchased a home at a cost of $650,000, 4 ½ times the cost of $143,000 in Pittsburgh. AEI s new merged property and mortgage financing dataset consisting of million first-time buyer loan transactions now makes it possible to rank of the best and worst metropolitan areas in terms of ease in becoming a first time buyer. To make these calculations, we calculated the price to ratios, along with the square footage of living area and the price per square foot of living area for homes purchased by FTBs. We show results for the 50 largest metros in the country. 2 1 An estimated 90 percent of all FTB loan purchase transactions are guaranteed by a federal agency (FHA, VA, or the Rural Housing Service) or an enterprise (Fannie Mae or Freddie Mac). 2 Results for the Atlanta metro are currently unavailable. 1
2 Pittsburgh, PA Cleveland, OH Cincinnati, OH St. Louis, MO Columbus, OH Detroit, MI Milwaukee, WI Oklahoma City, OK Houston, TX Indianapolis, IN Kansas City, MO San Antonio, TX Memphis, TN Grand Rapids, MI Louisville, KY Chicago, IL Dallas, TX Philadelphia, PA Charlotte, NC Tampa, FL Jacksonville, FL Austin, TX Raleigh, NC Minneapolis, MN Virginia Beach, VA Charleston, SC Richmond, VA Orlando, FL North Port, FL Baltimore, MD Boise City, ID Phoenix, AZ Miami, FL Providence, RI New York, NY Nashville, TN Las Vegas, NV Washington, DC Colorado Springs, CO Boston, MA Sacramento, CA Riverside-SB, CA Portland, OR Seattle, WA Salt Lake City, UT Denver, CO San Diego, CA San Francisco, CA Los Angeles, CA San Jose, CA Median First-time Buyer House Price to Annual Income Ratio: 50 Largest Metros most affordable metros 50 largest metro average 10 least affordable metros Note: Calculated as the of each first-time buyer's house price to annual gross ratio. Atlanta metro is not available. Source: AEI Center on Housing Markets and Finance,
3 Key findings Both house prices and s are higher in the ten least affordable metros compared to the 10 most affordable metros. Incomes were 51 percent higher in the 10 least affordable than in the 10 most affordable ($92,000 versus $61,000). But higher home prices more than cancelled out this extra. The priced home in the 10 least affordable metros was more than two-and-a-half times that in the 10 most affordable ($409,000 versus $159,000). 3 When it comes to ease of buying your first home, it s not how much you make, but where you buy. While FTBs in both Houston and Portland had similar s, buyers in Portland paid 52 percent more than in Houston. On a price per square foot basis the FTBs in Portland paid twice as much as the FTBs in Houston ($207/sq. ft. versus. $100 sq. ft.). First time buyer homes are similar in size across locations. Just because it is more expensive doesn t mean the home is any bigger. The finished square footages of FTB homes were similar for the 10 least affordable and for the 10 most affordable (1363 sq. ft. versus 1428 sq. ft.). Affordability has remained relatively constant in the most affordable metros, but it has worsened in the least affordable ones. The FTB affordability ratio in the ten most affordable metros increased from 2.5 in 2013 to 2.6 in This small increase is the result of a modest increase in the price of homes purchased (+7 percent over 5 years) combined with a modest increase in (+4 percent over 5 years). While the FTB affordability ratio in the ten least affordable metros had a larger increase (from 4.0 in 2013 to 4.3 in 2017), the ratio would have increased even more if the substantial increase in the price of homes purchased (+24 percent over 5 years) had not been largely offset by a substantial increase in s (+16 percent over 5 years). FTBs in Denver lost the most ground, as its FTB affordability ratio increased from 3.5 in 2013 to 4.1 in This is due to the fact that Denver had very strong home price gains (+48 percent over 5 years) which greatly outstripped the increase in (+20 percent over 5 years). 3 Land values largely drive the differences in affordability. The price of land reflects the demand and supply forces across cities as well as within cities. Land is much more expensive in the least affordable metros. While construction costs across metros vary, these differences pale in comparison to the differences in land cost across metros. According to BuildZoom data, average land cost for all homes is nearly 8 times more expensive in the ten least affordable metros than for nine of the most affordable (Milwaukee data was missing), while the average improvement cost was only 25 percent more expensive in the ten least affordable metros than for nine of the most affordable (again Milwaukee data was missing). The relative restrictiveness of land use regulation in the 10 most and 10 least affordable metros also helps explain differences in land values and affordability. In its 2018 Housing Affordability Survey, Demographia ranked metro areas as having less or more restrictive land use regulation. Seven of the ten most affordable metros had a ranking and all seven were ranked less restrictive. Eight of the ten least affordable metros had a ranking and all eight were ranked more restrictive. 14th Annual Demographia International Housing Affordability Survey: 92 Major Markets, 2017: 3rd Quarter 3
4 Key first-time buyer (FTB) indicators: largest 50 metros, ranked by FTB affordability* (1 = most affordable, 50 = least affordable) price to ratio price living area (in ft 2 ) price/living area (in $) price to ratio price (in $1,000) living area (in ft 2 ) price/livin g area (in $) Rank Metro 1 Pittsburgh, PA , , Cleveland, OH , , Cincinnati, OH , , St. Louis, MO , , Columbus, OH , , Detroit, MI , , Milwaukee, WI , , Oklahoma City, OK , , Houston, TX , , Indianapolis, IN , , Kansas City, MO , , San Antonio, TX , , Memphis, TN , , Grand Rapids, MI , , Louisville, KY , , Chicago, IL , , Dallas, TX , , Philadelphia, PA , , Charlotte, NC , , Tampa, FL , , Jacksonville, FL , , Austin, TX , , Raleigh, NC , , Minneapolis, MN , , Virginia Beach, VA , ,
5 price to ratio price living area (in ft 2 ) price/living area (in $) price to ratio price living area (in ft 2 ) price/living area (in $) Rank Metro 26 Charleston, SC , , Richmond, VA , , Orlando, FL , , North Port, FL , , Baltimore, MD , , Boise City, ID , , Phoenix, AZ , , Miami, FL , , Providence, RI , , New York, NY , , Nashville, TN , , Las Vegas, NV , , Washington, DC , , Colorado Springs, CO , , Boston, MA , , Sacramento, CA , , Riverside-SB, CA , , Portland, OR , , Seattle, WA , , Salt Lake City, UT , , Denver, CO , , San Diego, CA , , San Francisco, CA , , Los Angeles, CA , , San Jose, CA , , largest metro average , , * Affordability is defined as the ratio of each first-time buyer's house price to annual gross household. 5
6 6
7 Methodology: Our main data source are public records data for the largest 74 CBSAs. The data span from 2012:Q4 to 2018:Q2 and were provided by First American Data Tree. We select the largest 50 metros based on Home Mortgage Disclosure Act database (HMDA) 2017 purchase loan counts. 4 This study only uses FTB transactions guaranteed by FHA, Fannie, Freddie, the VA, and Rural Housing Services, since the FTB variable is only available for agency guaranteed loans and is missing on private portfolio loans. It is estimated that 90 percent of all financed FTB homes are guaranteed by a federal agency, helping make this a very robust analysis. We start by anonymizing public records data by stripping out personal identifiers such as the buyers names. We then eliminate cash sales, other financed transactions, or transactions with a missing sale amount, borrower and other key variables. After removing duplicate observations, we only keep arms-length purchase transactions of 1-4 unit properties. Next we match our data to HMDA. This match is performed using common variables such as origination year, loan purpose, census tract, loan amount (rounded to nearest 1,000), loan type, or lender name in both datasets. The match rate is 69 percent. All matches are unique one-to-one matches. This step adds all the HMDA variables including the borrower s gross annual rounded to the nearest 1,000 or the type of purchaser of the loan (Fannie, Freddie, etc.) to our dataset. We then match the anonymized public records dataset to the National Mortgage Risk Index (NMRI) data and Fannie Mae s Single Family Loan Performance Data and Freddie Mac s Single Family Loan-Level Dataset (GSE data). 5 The matching variables are a combination of: loan purpose, loan type, loan amount (exact where available or rounded to nearest 1,000), geography (state, 3-digit zip code when using the GSE data, and 5-digit zip code in case of FHA), note rate (in the case of FHA), loan-to-value ratio (LTV), origination date (a range of +/- 1 month), lender name, type of purchaser (Fannie or Freddie), or occupancy. The match rate is 66 percent, with all matches being unique one-to-one matches. This step adds a first-time buyer variable, as well as borrower risk characteristics such as credit score or debt-to ratio, which then allows us to risk rate individual loans as well as to create risk metrics for first-time buyer loans. 6 Finally, we weight the data by county, origination quarter, and guarantor type using loan counts from the National Housing Market Indicators (NHMI). 7 4 The Atlanta CBSA is missing in our public records data. We fill up the largest 50 CBSAs by including North Port- Sarasota-Bradenton, which is the next largest CBSA in our data. 5 We enhance the NMRI dataset by matching it to the FHA Single Family Snapshot Dataset, which adds 5-digit zip code for FHA loans. For more details on the FHA Snapshot data, see here. 6 For more, see the NMRI methodology here. 7 For more info, see the NHMI methodology here. Since the NHMI data do not break out conventional loans into GSE and private at the county level, we estimate the GSE share of conventional loans by quarter and county using 7
8 House Price Indices (HPI) We measure house price trends using new AEI HPIs. The data come from the public records data described above and are limited to non-duplicative, institutionally-financed arms-length transactions of 1-4 unit properties and manufactured homes. We use a quasi-repeat sales index methodology to generate HPIs which are indexed to 0 in 2012:Q4, the first quarter the data are available. A standard repeat sales index relies on a pair of sale transactions of the same home between which a constant-quality house price appreciation is measures. In our case, we use the December 2017 AVM as the second transaction. The AVM represent the home s value at a given point in time. We assess the accuracy of the December 2017 AVMs by comparing AVM values to reported sale prices for properties that sold in that month. Due to data reporting and collection lags, sales in December 2017 are not known until a subsequent month. Hence, the December 2017 AVM value is calculated independently of the actual December 2017 sale price. For the roughly 124,000 homes in our final cleaned dataset that sold in December 2017, we find that the ratio of the home s sales price to its December 2017 AVM value falls within a narrow range that is centered around 1 with equal proportion of outliers to either side. On average, the sale price was equal to 101 percent of the AVM, and 66 percent of the sale prices fell within +/- 10 percent of the AVM. These results also hold with limited variation for the individual counties. We conclude that the AVM is on average accurate, which allows us to use it as if it were a sales transaction. Unlike a true repeat sales index, which is limited to a small subset of homes that transacted at least twice, our quasi-repeat sales methodology allows us to use virtually every sale transaction in our HPIs. The only exclusions are outliers, which we define as the top and bottom 1 percent of sales in each month based on the ratio of price over AVM. We weight the data by county, origination quarter, and loan type using loan counts from the National Housing Market Indicators (NHMI). We also compute a HPI for a lower price segment where FTBs primarily purchase a home. We designate a homes with a purchase price below the 80 th FHA price percentile in a given county and quarter as a starter home. This is confirmed by the data, which indicate that around twothirds of government guaranteed loan transactions in that price range were made to FTBs. HMDA data. We gross up the county total of loans acquired by the Fannie or Freddie by 15% to account for the end-of year reporting lag, then we divide that number by the total conventional total for the GSE share. We assume that the GSE share is constant by quarter. 8
HIGH AND WIDE: INCOME INEQUALITY GAP IN THE DISTRICT ONE OF BIGGEST IN THE U.S. By Wes Rivers
 An Affiliate of the Center on Budget and Policy Priorities 820 First Street NE, Suite 510 Washington, DC 20002 (202) 408-1080 Fax (202) 325-8839 www.dcfpi.org March 13, 2014 HIGH AND WIDE: INCOME INEQUALITY
50-State Property Tax Comparison Study: For Taxes Paid in Executive Summary
 50-State Property Tax Comparison Study: For Taxes Paid in 2017 Executive Summary By Lincoln Institute of Land Policy and Minnesota Center for Fiscal Excellence April 2018 As the largest source of revenue
Office. Office. IRR Viewpoint 2015
 IRR Viewpoint 05 Above: Designed in 95 in the Art Deco style by architect Timothy Pflueger as the Pacific Telephone and Telegraph Building, 40 New Montgomery Street, San Francisco, CA has been the subject
ERRATA. To: Recipients of MG-388-RC, Estimating Terrorism Risk, RAND Corporation Publications Department. Date: December 2005
 ERRATA To: Recipients of MG-388-RC, Estimating Terrorism Risk, 25 From: RAND Corporation Publications Department Date: December 25 Re: Corrected pages (pp. 23 24, Table 4.1,, Density, Density- Weighted,
Data Brief. Trends in Employer-Sponsored Health Insurance Premiums and Employee Contributions in Major Metropolitan Areas,
 December 2012 Data Brief Trends in Employer-Sponsored Health Insurance Premiums and Employee Contributions in Major Metropolitan Areas, 2003 2011 The mission of The Commonwealth Fund is to promote a high
MetroMonitor Tracking Economic Recession and Recovery in America s 100 Largest Metropolitan Areas
 MetroMonitor Tracking Economic Recession and Recovery in America s 100 Largest Metropolitan Areas Howard Wial and Richard Shearer June 2011 (Updated on June 24, 2011) With job growth slowing and housing
FOR IMMEDIATE RELEASE Contact: Ann Marie Gorden/Robert Nihen
 cutting through complexity News FOR IMMEDIATE RELEASE Contact: Ann Marie Gorden/Robert Nihen June 24, 2014 KPMG LLP 201-505-6288/201-307-8296 agorden@kpmg.com / rnihen@kpmg.com CINCINNATI, CLEVELAND, ATLANTA
The 2017 Housing & Economic Outlook
 The 2017 Housing & Economic Outlook Frank E. Nothaft, CoreLogic SVP & Chief Economist @DrFrankNothaft @CoreLogicEcon The views, opinions, forecasts and estimates herein are those of the CoreLogic Office
Regional Snapshot: The Cost of Living in Metro Atlanta
 Regional Snapshot: The Cost of Living in Metro Atlanta Photo by rawpixel.com on Unsplash Atlanta Regional Commission, February 2018 For more information, contact: cdegiulio@atlantaregional.org In Summary
Employee Benefits Alert
 Employee Benefits Alert Issue 110 June 2007 The Massachusetts Health Care Reform Act: What s an Employer to Do? The Massachusetts Health Care Reform Act became law in April 2006; the July 1, 2007 effective
Employee Benefits Alert
 Employee Benefits Alert September 2005 Issue No. 48 Health Saving Accounts: Comparability Rules The IRS and Treasury recently published proposed regulations concerning the comparability rules for employer
Relationships. Results. COMPANY OVERVIEW COMMERCIAL REAL ESTATE DEBT, EQUITY & SERVICING
 Relationships. COMPANY OVERVIEW Results. COMMERCIAL REAL ESTATE DEBT, EQUITY & SERVICING COMMERCIAL REAL ESTATE DEBT, EQUITY & SERVICING Relationships. Results. For more than 50 years, NorthMarq Capital
Macroeconomic View of the Housing Market. Frank Nothaft CoreLogic Chief Economist December 12 th 2018
 Macroeconomic View of the Housing Market Frank Nothaft CoreLogic Chief Economist December 12 th 2018 2019 Economic and Housing Outlook Economic growth continues, recession risk rises, interest rates increase
INDUSTRIAL REPORT VIEWPOINT 2017 / COMMERCIAL REAL ESTATE TRENDS. By: Hugh F. Kelly, PhD, CRE. irr.com. An Integra Realty Resources Publication
 INDUSTRIAL REPORT VIEWPOINT 2017 / COMMERCIAL REAL ESTATE TRENDS By: Hugh F. Kelly, PhD, CRE Growing Consumption Fuels the Industrial Sector IRR research indicates that more than half of U.S. industrial
MY PLAN IS GETTING A REBATE FROM THE INSURER WHAT DO I DO WITH IT?
 HUMAN CAPITAL PRACTICE ALERT: HEALTH CARE REFORM BILL August 2012 www.willis.com MY PLAN IS GETTING A REBATE FROM THE INSURER WHAT DO I DO WITH IT? EXECUTIVE SUMMARY All insured employer group medical
ehealth Inventory Report of Major Medical Health Plans Available Off of Government Exchanges
 ehealth Inventory Report of Major Medical Health Available Off of Government Exchanges February 2014 Introduction Beginning January 1, 2014, all new major medical health insurance plans were required to
Relationships. Results. COMPANY OVERVIEW COMMERCIAL REAL ESTATE DEBT, EQUITY & SERVICING
 Relationships. COMPANY OVERVIEW Results. COMMERCIAL REAL ESTATE DEBT, EQUITY & SERVICING C O M M E R C I A L R E A L E S TAT E D E B T, E Q U I T Y & S E R V I C I N G Relationships. Results. For more
Struggling to Escape the Fallout of the Great Recession MARISA Di NATALE, MANAGING DIRECTOR
 Struggling to Escape the Fallout of the Great Recession MARISA Di NATALE, MANAGING DIRECTOR FROM MOODY S ECONOMY.COM Broad-Based Slowing Across the Nation Total employment excluding federal government,
Employee Benefits Alert
 Employee Benefits Alert Issue No. 21 Legal & Research Group September 2004 Benefits Brokerage & Consulting Services Rx Purchasing Coalition HR Consulting Data Analysis Benefits Administration Retirement
equity advisory services
 CAPABILITIES equity advisory services YOUR SINGLE POINT OF CONTACT FOR THE ENTIRE CAPITAL STACK Better relationships. Better results. EQUITY VOLUME BY PROPERTY TYPE Our close relationships with debt providers
2014 U.S. Census (2015) Median African-American Household Income Rank, Memphis Included. Household Median Income Ranking, African American Population
 Median African-American Household Income Rank, Memphis Included. Household Median Income Ranking, African American Population") 2015 2015 Rankings Report Prepared by Elena Delavega, PhD, MSW Department of Social Work Benjamin L. Hooks Institute for Social Change University of Memphis 2014 U.S. Census (2015) - Rank, Memphis Included
2015 2015 Rankings Report Prepared by Elena Delavega, PhD, MSW Department of Social Work Benjamin L. Hooks Institute for Social Change University of Memphis 2014 U.S. Census (2015) - Rank, Memphis Included
Employee Benefits Alert
 Legal & Research Group Benefits Alert Issue No. 24 October 2004 Benefits Brokerage & Consulting Services Rx Purchasing Coalition HR Consulting Data Analysis Benefits Administration Retirement Services
equity advisory services
 CAPABILITIES equity advisory services YOUR SINGLE POINT OF CONTACT FOR THE ENTIRE CAPITAL STACK Better relationships. Better results. EQUITY VOLUME BY PROPERTY TYPE Our close relationships with debt providers
Trends in Total and Out-of- Pocket Spending in Metro Areas:
 Trends in Total and Out-of- Pocket Spending in Metro Areas: 2012-2015 It is well-documented that health care prices vary widely by geography. 1 These variations can also lead to differences in health care
State of the U.S. Multifamily Market. Q Review and Forecast
 State of the U.S. Multifamily Market Q1 2015 Review and Forecast Agenda Economy Leasing Fundamentals Rent and NOI Trends Single-Family Market Capital Markets Economy page 3 GDP Growth Contributions To
Traditional Regional Economic Indicators
 Cleveland State University EngagedScholarship@CSU Urban Publications Maxine Goodman Levin College of Urban Affairs 2-1-2005 Traditional Regional Economic Indicators Robert Sadowski How does access to this
FINANCIAL STATE OF THE CITIES
 FINANCIAL STATE OF THE CITIES An Annual Report by Truth in Accounting www.statedatalab.org January 2019 1 Table of Contents Executive Summary 4 Introduction and Background 5 Summary of Findings 6 Sunshine
Mattress Firm s Pending Acquisition of Sleepy s November 30, 2015
 Mattress Firm s Pending Acquisition of Sleepy s November 0, 2015 Forward Looking Statements and Non-GAAP Information This presentation contains forward-looking statements within the meaning of federal
Employee Benefits Alert
 Legal & Research Group Employee Benefits Alert Issue No. 40 June 2005 Legislative & Compliance Benefits Brokerage & HR Consulting Services Rx Purchasing Coalition Data Analysis Benefits Administration
CAPITALIZATION RATES BY PROPERTY TYPE
 RATES BY PROPERTY TYPE MID-YEAR 2014 0 RATES BY ASSET TYPE MID-YEAR 2014 O V E R V I E W Capital continues to flow steadily into the U.S. real estate market, as both domestic and foreign investors increase
2018 NORTH AMERICAN CONSTRUCTION FORECAST REPORT
 2018 NORTH AMERICAN CONSTRUCTION FORECAST REPORT Published October 2017 Oldcastle Business Intelligence TABLE OF CONTENTS Executive Summary... 2 U.S. Economic Overview... 3 U.S. Construction Forecast...
U.S. Investment Outlook
 U.S. Investment Outlook Quarterly Investor Research update Q2 2015 U.S. Investment overview 37% 21% 15% 15% U.S. cities dominating global investment activity Top 20 Cities for Transactional Volumes H1
FILED: NEW YORK COUNTY CLERK 12/22/ :58 AM INDEX NO /2013 NYSCEF DOC. NO. 95 RECEIVED NYSCEF: 12/22/2017
 Buckingham Badler Assoc., Inc. 286 Richmond Valley Road Staten Island, NY 10309 09/20/2011 Attention: Celeste Regarding: Allerand LLC 500 Greenwich Street #401 New York, NY 10013 Quote Number: XX582725
2019 Outlook. January
 2019 Outlook January 2019 0 Performance in the multifamily market remained healthy during 2018 and is expected to continue into 2019, but with more modest growth in comparison to recent years. The multifamily
Tax Rates and Tax Burdens in the District of Columbia - A Nationwide Comparison
 Government of the District of Columbia Natwar M. Gandhi Chief Financial Officer Tax Rates and Tax Burdens in the District of Columbia - A Nationwide Comparison 2010 Issued September 2011 Tax Rates and
Public Transit: The Funding Crisis and A Need for Action
 Attachment 1 Public Transit: The Funding Crisis and A Need for Action #141603 November 25, 2008 1 Southeastern Wisconsin Needs a Good Public Transit System To meet the travel needs work, education, healthcare,
Medicare Secondary Payer Rules Tighter Enforcement?
 Executive Signal Issue 5 October 2007 Medicare Secondary Payer Rules Tighter Enforcement? Earlier this year the White House web site featured an article outlining President Bush s proposed budget for 2008.
Affordable Coverage: Short-Term Health Insurance and the ACA
 Affordable Coverage: Short-Term Health Insurance and the ACA JULY 2018 2 Short-Term Health Plan s Cost 80 Percent Less than Obamacare Plans, ehealth Analysis Finds Short-term health insurance premiums
US Hotel Industry Overview. Chris Crenshaw
 US Hotel Industry Overview Chris Crenshaw ccrenshaw@str.com July 2014 (12 MMA): All Signs Point To A Sellers Market % Change Room Supply* 1.8 bn 0.8% Room Demand* 1.1 bn 3.4% Occupancy 63 % 2.6% A.D.R.*
Housing Recovery is Underway, But Not for Everyone
 Housing Recovery is Underway, But Not for Everyone Eric Belsky August 2013 Dallas, TX Housing Markets Have Corrected In Significant Ways Both price and quantity reductions have occurred Even after price
Economic Risks and Their Meaning for the Southwest STEVE COCHRANE, MANAGING DIRECTOR
 Economic Risks and Their Meaning for the Southwest STEVE COCHRANE, MANAGING DIRECTOR The Europeans Are All-in Composition of the European Central Bank s balance sheet, bil 5,000 Other assets Emergency
TRUCKERS APPLICATION
 DEEP SOUTH TRUCKERS APPLICATION PROPOSAL FORM - PRIMARY COVERAGE/COMMERCIAL TRUCKMEN REQUIRED FOR 10 OR MORE POWER UNITS THAT ARE ICC REGULATED **IMPORTANT - PLEASE NOTE** ALL ITEMS MUST BE COMPLETED IN
Equity LifeStyle Properties
 Equity LifeStyle Properties Colony Cove Ellenton, FL OUR STORY One of the nation s largest real estate networks with 383 properties containing over 142,000 sites in 32 states and British Columbia Unique
D E E P S O U T H O F T E N N E S S E E
 5 410 MARYLAND WAY, SUITE 41 0, B RENTWOOD, TN 3 7027 P H O N E : 6 1 5. 8 3 2. 8 9 0 0 o r 8 8 8. 8 3 2. 8 9 0 0 F A X : 6 1 5. 8 3 2. 5 4 3 4 o r 8 8 8. 8 3 2. 8 9 0 1 TRUCKERS APPLICATION PROPOSAL FORM
US CAPITAL MARKETS REPORT
 US CAPITAL MARKETS REPORT Capitalization Rates By Property Type Fall 2016 US Capital Markets Report Capitalization Rates By Asset Type OVERVIEW Year-to-date investment sales volume lagged on a year-over-year
CBRE CAP RATE SURVEY. A CBRE Publication. First Half Click to Enter
 CBRE CAP RATE SURVEY A CBRE Publication In This Issue: pg 2 pg 8 pg 17 pg 26 pg 36 pg 41 pg 44 Click to Enter United States The 10-year Treasury (UST) was measurably lower than 2% from April 2012 through
Reverse Market Insight, Inc Acero, Suite 140, Mission Viejo, CA (682) HECM Lenders (FHA Approved Only) Competition Growth -6.
 HECM Lenders (FHA Approved Only) Competition Growth -6.") Reverse Market Insight, Inc. 25910 Acero, Suite 140, Mission Viejo, CA (682) 651-5632 HECM (FHA Approved Only) Industry Overview HECMs Endorsed through June Next Release Date: Week 1 of August Endorsement
Reverse Market Insight, Inc. 25910 Acero, Suite 140, Mission Viejo, CA (682) 651-5632 HECM (FHA Approved Only) Industry Overview HECMs Endorsed through June Next Release Date: Week 1 of August Endorsement
American Jobs Act - Preventing Teacher Layoffs Estimated Jobs Impact by State
 American Jobs Act - Preventing Teacher Layoffs Estimated Jobs Impact by Funds Allocated Estimate of Jobs Supported for 1 School Year Alabama $ 451,477,775 7,000 Alaska $ 70,483,533 900 Arizona $ 625,502,087
2007 Outlook for Southern California Housing
 Outlook for Southern Housing Presentation at the RERCSC Quarterly Luncheon Meeting, Cal Poly University, Pomona, March, U.S. Expansion Continues Outlook for Southern Housing Real Estate Research Council
Capital Markets UpdateTM MULTIFAMILY EDITION SPECIAL FEATURE: SENIOR HOUSING OUTLOOK SECOND QUARTER 2014
 Capital Markets UpdateTM MULTIFAMILY EDITION SPECIAL FEATURE: SENIOR HOUSING OUTLOOK SECOND QUARTER 2014 a Berkshire Hathaway and Leucadia National Company MARKET ACTIVITY SECOND QUARTER 2014 MULTIFAMILY
Employee Benefits Alert
 Employee Benefits Alert December 2005 Issue No. 54 UnumProvident Settlement to Affect All California Disability Insurers Executive Summary A recent settlement of a case filed by the California Department
NAREIT Investor Conference Summary of Public Storage/Shurgard Merger
 THE MOST RECOGNIZED BRANDS IN SELF-STORAGE NAREIT Investor Conference Summary of Public Storage/Shurgard Merger June 6-8, 2006 page 1 Disclosures Forward-Looking Statements This presentation contains forward-looking
Making Home Affordable Program Servicer Performance Report Through December 2009
 EXHIBIT 6 Overview of Administration Housing Stability Initiatives Initiatives to Support Access to Affordable Mortgage Credit and Housing Initiatives to Prevent Avoidable Foreclosures and Stabilize Neighborhoods
The 2017 Economic Outlook Summit
 The 2017 Economic Outlook Summit Southeast Fairfax Development Corporation Mount Vernon-Lee Chamber of Commerce Frank Nothaft, CoreLogic SVP & Chief Economist April 6, 2017 2017 Market: Less Affordability
Reverse Market Insight, Inc Acero, Suite 140, Mission Viejo, CA (682) HECM Lenders (FHA Approved Only) Competition Growth -4.
 HECM Lenders (FHA Approved Only) Competition Growth -4.") Reverse Market Insight, Inc. 25910 Acero, Suite 140, Mission Viejo, CA (682) 651-5632 HECM (FHA Approved Only) Industry Overview HECMs Endorsed through December Next Release Date: Week 1 of February Endorsement
Reverse Market Insight, Inc. 25910 Acero, Suite 140, Mission Viejo, CA (682) 651-5632 HECM (FHA Approved Only) Industry Overview HECMs Endorsed through December Next Release Date: Week 1 of February Endorsement
Reverse Market Insight, Inc Acero, Suite 140, Mission Viejo, CA (682) HECM Lenders (FHA Approved Only) Competition Growth -6.
 HECM Lenders (FHA Approved Only) Competition Growth -6.") Reverse Market Insight, Inc. 25910 Acero, Suite 140, Mission Viejo, CA (682) 651-5632 HECM (FHA Approved Only) Industry Overview HECMs Endorsed through January Next Release Date: Week 1 of March Endorsement
Reverse Market Insight, Inc. 25910 Acero, Suite 140, Mission Viejo, CA (682) 651-5632 HECM (FHA Approved Only) Industry Overview HECMs Endorsed through January Next Release Date: Week 1 of March Endorsement
CoreLogic Equity Report
 CoreLogic Equity Report REPORT NATIONAL OVERVIEW Equity Distribution Improves as Price Gains Extend from 2012 into 2013 850,000 Residential Properties Returned to Positive Equity During the First Quarter
The Fiscal Year of Memphis Light, Gas and Water has not changed. The fiscal year end remains December 31.
 Electric System Subordinate Revenue Refunding Bonds Series 2008 - Section 4(a)(iii) Electric System Subordinate Revenue Refunding Bonds Series 2010 - Section 4(a)(iii) Electric System Revenue Bonds Series
PORTFOLIO REVENUE EXPENSES PERFORMANCE WATCHLIST
 July 2018 ASSET MANAGEMENT Low-Income Housing Tax Credit Portfolio Trends Analysis Enterprise s Low-Income Housing Tax Credit (LIHTC) Portfolio Trends Analysis provides important information to our management
Reverse Market Insight, Inc Acero, Suite 140, Mission Viejo, CA (682) HECM Lenders (FHA Approved Only) Competition Growth -10.
 HECM Lenders (FHA Approved Only) Competition Growth -10.") Reverse Market Insight, Inc. 25910 Acero, Suite 140, Mission Viejo, CA (682) 651-5632 HECM (FHA Approved Only) Industry Overview HECMs Endorsed through August Next Release Date: Week 1 of October Endorsement
Reverse Market Insight, Inc. 25910 Acero, Suite 140, Mission Viejo, CA (682) 651-5632 HECM (FHA Approved Only) Industry Overview HECMs Endorsed through August Next Release Date: Week 1 of October Endorsement
Reverse Market Insight, Inc Acero, Suite 140, Mission Viejo, CA (682) HECM Lenders (FHA Approved Only) Competition Growth -6.
 HECM Lenders (FHA Approved Only) Competition Growth -6.") Reverse Market Insight, Inc. 25910 Acero, Suite 140, Mission Viejo, CA (682) 651-5632 HECM s (FHA Approved Only) Industry Overview HECMs Endorsed through March Next Release Date: Week 1 of May Endorsement
Reverse Market Insight, Inc. 25910 Acero, Suite 140, Mission Viejo, CA (682) 651-5632 HECM s (FHA Approved Only) Industry Overview HECMs Endorsed through March Next Release Date: Week 1 of May Endorsement
County of Sonoma Agenda Item Summary Report
 Revision No. 20151201-1 County of Sonoma Agenda Item Summary Report Agenda Item Number: 31h (This Section for use by Clerk of the Board Only.) Clerk of the Board 575 Administration Drive Santa Rosa, CA
Reverse Market Insight, Inc PCH, Suite D4, Dana Point, CA (682) HECM Lenders (FHA Approved Only) Competition Growth 43.
 HECM Lenders (FHA Approved Only) Competition Growth 43.") Reverse Market Insight, Inc. 34232 PCH, Suite D4, Dana Point, CA (682) 651-5632 HECM (FHA Approved Only) Industry Overview HECMs Endorsed through February Next Release Date: Week 1 of April Endorsement
Reverse Market Insight, Inc. 34232 PCH, Suite D4, Dana Point, CA (682) 651-5632 HECM (FHA Approved Only) Industry Overview HECMs Endorsed through February Next Release Date: Week 1 of April Endorsement
ROBERTA WYN, STEPHANIE TELEKI, AND E. RICHARD BROWN
 Differences in Access to Health Care Among The Moderate- and Low-Income Population Across Urban Areas ROBERTA WYN, STEPHANIE TELEKI, AND E. RICHARD BROWN Urban areas in the United States vary widely in
Paycheck to Paycheck:
 New Century Housing Volume 2, Issue 2 Center for Housing Policy/National Housing Conference May 2003 Paycheck to Paycheck: Wages and the Cost of Housing in America Paycheck to Paycheck: Wages and the Cost
ZipRealty, Inc. Supplemental Data Reclassification of Consolidated Statement of Operations
 Reclassification of Consolidated Statement of Operations Effective January 1, 2007, for income statement presentation purposes, we have reclassified sales support and marketing expenses from general and
Reverse Market Insight, Inc Acero, Suite 140, Mission Viejo, CA (682) HECM Lenders (FHA Approved Only) Competition Growth 1.
 HECM Lenders (FHA Approved Only) Competition Growth 1.") Reverse Market Insight, Inc. 25910 Acero, Suite 140, Mission Viejo, CA (682) 651-5632 HECM s (FHA Approved Only) Industry Overview HECMs Endorsed through February Next Release Date: Week 1 of April Endorsement
Reverse Market Insight, Inc. 25910 Acero, Suite 140, Mission Viejo, CA (682) 651-5632 HECM s (FHA Approved Only) Industry Overview HECMs Endorsed through February Next Release Date: Week 1 of April Endorsement
Safe Harbor Caution Concerning Forward-Looking Statements Non-GAAP Financial Measures Important Information For Investors And Shareholders
 February 13, 2014 Safe Harbor Caution Concerning Forward-Looking Statements Certain statements in this communication regarding the proposed acquisition of Time Warner Cable Inc. ( Time Warner Cable ) by
The Consequences of Mortgage Credit Expansion. What is the Nature of the Mortgage Default Crisis?
 The Consequences of Mortgage Credit Expansion Atif Mian Amir Sufi University Chicago GSB October 2008 What is the Nature of the Mortgage Default Crisis? 1 Mortgage Defaults, 2005 to 2007 Prime versus Subprime
Managing Your Money: "Housing and Public Policy the Bubble, Present, and Future
 Managing Your Money: "Housing and Public Policy the Bubble, Present, and Future PLATO (Participatory Learning and Teaching Organization) J. Michael Collins UW Madison Center for Financial Security Overview
The Economic Backdrop When will this cycle end?
 The Economic Backdrop When will this cycle end? How far are we into the current economic expansion? Current expansion in 8 th year; 4 th longest since 1960 Length of economic expansions (months) Apr-91-Feb-01
State National Insurance Company Inc.
 State National Insurance Company Inc. COMMERCIAL INSURANCE APPLICATION GENERAL INFORMATION Name: Federal ID or S.S. No.: U.S. DOT No.: Dates Coverage Desired: FROM: TO: Years in Trucking Industry: Years
State Of The U.S. Industrial Market: 2017 Q2
 State Of The U.S. Industrial Market: 2017 Q2 Copyright 2017 CoStar Realty Information, Inc. No reproduction or distribution without permission. The following information includes projections and analyses
CYCLE FORECAST Real Estate Market Cycles First Quarter 2018 Estimates May 2017
 CYCLE FORECAST Real Estate Market Cycles First Quarter 20 Estimates May 20 So far, 20 continues along at a slow Gross Domestic Product (GDP) growth rate near 2% and employment continues to hover above
Reverse Market Insight, Inc Acero, Suite 140, Mission Viejo, CA (682) HECM Lenders (FHA Approved Only) Competition Growth 10.
 HECM Lenders (FHA Approved Only) Competition Growth 10.") Reverse Market Insight, Inc. 25910 Acero, Suite 140, Mission Viejo, CA (682) 651-5632 HECM (FHA Approved Only) Industry Overview HECMs Endorsed through January Next Release Date: Week 1 of March Endorsement
Reverse Market Insight, Inc. 25910 Acero, Suite 140, Mission Viejo, CA (682) 651-5632 HECM (FHA Approved Only) Industry Overview HECMs Endorsed through January Next Release Date: Week 1 of March Endorsement
Reverse Market Insight, Inc PCH, Suite D4, Dana Point, CA (682) HECM Lenders (FHA Approved Only) Competition Growth 10.
 HECM Lenders (FHA Approved Only) Competition Growth 10.") Reverse Market Insight, Inc. 34232 PCH, Suite D4, Dana Point, CA (682) 651-5632 HECM s (FHA Approved Only) Industry Overview HECMs Endorsed through July Next Release Date: Week 1 of September Endorsement
Reverse Market Insight, Inc. 34232 PCH, Suite D4, Dana Point, CA (682) 651-5632 HECM s (FHA Approved Only) Industry Overview HECMs Endorsed through July Next Release Date: Week 1 of September Endorsement
Reverse Market Insight, Inc PCH, Suite D4, Dana Point, CA (682) HECM Lenders (FHA Approved Only) Competition Growth -8.
 HECM Lenders (FHA Approved Only) Competition Growth -8.") Reverse Market Insight, Inc. 34232 PCH, Suite D4, Dana Point, CA (682) 651-5632 HECM s (FHA Approved Only) Industry Overview HECMs Endorsed through November Next Release Date: Week 1 of January Endorsement
Reverse Market Insight, Inc. 34232 PCH, Suite D4, Dana Point, CA (682) 651-5632 HECM s (FHA Approved Only) Industry Overview HECMs Endorsed through November Next Release Date: Week 1 of January Endorsement
Capital Market Update. February 10, 2011 Marc Louargand, Ph.D., CRE, FRICS Principal SALTASH PARTNERS LLC investing in American ingenuity
 Capital Market Update February 10, 2011 Marc Louargand, Ph.D., CRE, FRICS Principal SALTASH PARTNERS LLC investing in American ingenuity A Brief Tour of the Capital Market What s happened in the past year?
Barriers to Accessing Homeownership
 HOUSING FINANCE POLICY CENTER Barriers to Accessing Homeownership Down Payment, Credit, and Affordability September 2018 Laurie Goodman, Alanna McCargo, Edward Golding, Bing Bai, and Sarah Strochak AB
Reverse Market Insight, Inc PCH, Suite D4, Dana Point, CA (682) HECM Lenders (FHA Approved Only) Competition Growth -6.
 HECM Lenders (FHA Approved Only) Competition Growth -6.") Reverse Market Insight, Inc. 34232 PCH, Suite D4, Dana Point, CA (682) 651-5632 HECM s (FHA Approved Only) Industry Overview HECMs Endorsed through March Next Release Date: Week 1 of May Endorsement Growth
Reverse Market Insight, Inc. 34232 PCH, Suite D4, Dana Point, CA (682) 651-5632 HECM s (FHA Approved Only) Industry Overview HECMs Endorsed through March Next Release Date: Week 1 of May Endorsement Growth
How State Policies Impact Local Property Taxes. Adam H. Langley
 How State Policies Impact Local Property Taxes Adam H. Langley 1 Pennsylvania Tax Swap Property Tax Independence Act (SB 67) Eliminate school property tax, except for debt service Income tax: 3.07% to
The Housing Market and the Macroeconomy. Karl E. Case. University of North Carolina February 18, 2010
 The Housing Market and the Macroeconomy Karl E. Case University of North Carolina February 18, 2010 Briefly describe some of the connections between the housing market and the Macroeconomy Discuss how
Media Kit. Products and demographics
 2012 Media Kit Products and demographics The whole family... Washington Business Journal The weekly newspaper is the source for local business news, in-depth industry coverage, insights and information.
GWIPP WORKING PAPER SERIES. Have central cities come back? Kimberly Furdell Edward W. (Ned) Hill Harold Wolman
 Hill Harold Wolman") GWIPP WORKING PAPER SERIES Have central cities come back? Kimberly Furdell Edward W. (Ned) Hill Harold Wolman Working Paper Number 5 http://www.gwu.edu/~gwipp/papers/wp005 March 2004 George Washington
GWIPP WORKING PAPER SERIES Have central cities come back? Kimberly Furdell Edward W. (Ned) Hill Harold Wolman Working Paper Number 5 http://www.gwu.edu/~gwipp/papers/wp005 March 2004 George Washington
Reverse Market Insight, Inc PCH, Suite D4, Dana Point, CA (682) HECM Lenders (FHA Approved Only) Competition Growth -20.
 HECM Lenders (FHA Approved Only) Competition Growth -20.") Reverse Market Insight, Inc. 34232 PCH, Suite D4, Dana Point, CA (682) 651-5632 HECM s (FHA Approved Only) Industry Overview HECMs Endorsed through April Next Release Date: Week 1 of June Endorsement Growth
Reverse Market Insight, Inc. 34232 PCH, Suite D4, Dana Point, CA (682) 651-5632 HECM s (FHA Approved Only) Industry Overview HECMs Endorsed through April Next Release Date: Week 1 of June Endorsement Growth
The Economic and Revenue Outlook
 The Economic and Revenue Outlook Presented by Mark McMullen, Economy.com FTA Annual Outlook Conference Slide 1 The Economy is Performing Well 5 Real GDP 3 Core CPI 1 % change year ago Sources: BEA, BLS
ALERT: HEALTH CARE REFORM BILL
 HUMAN CAPITAL PRACTICE ALERT: HEALTH CARE REFORM BILL July 2010 Vol. 3, No. 12 REGULATIONS ON GRANDFATHERED PLANS www.willis.com As the dust settled following enactment of the health care reform law last
THE LOOMING CHALLENGE OF U.S. COMPETITIVENESS: IMPLICATIONS FOR PHILADELPHIA
 THE LOOMING CHALLENGE OF U.S. COMPETITIVENESS: IMPLICATIONS FOR PHILADELPHIA Michael E. Porter (and Jan W. Rivkin) Harvard Business School Innovation Leadership Speaker Series Fox School of Business March
WHAT S IN A (BRAND) NAME? A Comparison Of Minimum Wage Effects on Franchise and Non-Franchise Businesses
 NAME? A Comparison Of Minimum Wage Effects on Franchise and Non-Franchise Businesses") Dr. Lloyd Corder CorCom, Inc. Carnegie Mellon University January 2016 WHAT S IN A (BRAND) NAME? A Comparison Of Minimum Wage Effects on Franchise and Non-Franchise Businesses What s in a (Brand) Name?
Dr. Lloyd Corder CorCom, Inc. Carnegie Mellon University January 2016 WHAT S IN A (BRAND) NAME? A Comparison Of Minimum Wage Effects on Franchise and Non-Franchise Businesses What s in a (Brand) Name?
Structured Finance. U.S. RMBS Sustainable Home Price Report. First-Quarter 2017 Update Special Report RMBS / U.S.A.
 U.S. RMBS Sustainable Home Price Report First-Quarter 2017 Update Special Report RMBS / U.S.A. U.S. Prices Grow at a Sustainable Pace: National inflation-adjusted home prices continue to grow at a rate
Carroll Co-Invest Fund II, LP Investor Update, Q4 2013
 Carroll Co-Invest Fund II, LP Investor Update, Q4 2013 January 31, 2014 We are pleased to report that Carroll Co-Invest Fund II experienced a successful 4th quarter 2013. Our work at ARIUM Resort, Carroll
MEETING OF THE WQA ADMINISTRATIVE/FINANCE COMMITTEE
 MEETING OF THE WQA ADMINISTRATIVE/FINANCE COMMITTEE TO BE HELD ON TUESDAY, MARCH 12, 2013 AT 12:00 P.M. AT 1720 W. CAMERON AVE., SUITE 100, WEST COVINA, CA 91790 AGENDA WQA Committee Members: Watermaster
FOCUS On Benefits January, 2007
 In This Issue San Francisco Workers Granted Paid Sick Time Family Deductibles That Permit HDHP Coverage Clear SPDs Required Elder Care Benefits California Modifies Sexual Harassment Training Eligibility
Analysis Based on U.S. County Business Patterns. June Part of the Kiva Visa Partnership for U.S. Small Businesses
 KIVA AND VISa study of small business trouble spots Analysis Based on County Patterns June 2011 Part of the Kiva Visa Partnership for Small es research objectives research objectives In late 2010, Visa
FOR IMMEDIATE RELEASE February 8, 2012
 Contact Information Below CoreLogic Reports 830,000 Completed s Nationally in 2011, a Decrease of 24 Percent from One Year Ago 1.4 Million Homes in the Inventory at the End of 2011 SANTA ANA, Calif., CoreLogic
CAPITAL MARKETS UPDATE. Suburban Office: Is this the Next Play?
 CAPITAL MARKETS UPDATE Suburban Office: Is this the Next Play? October 2016 Investment Thesis Background Suburban office product has lagged the property recovery cycle. Most of the lag is the result of
The Five Retail Trends to Watch in January 14, 2015
 The Five Retail Trends to Watch in 2015 January 14, 2015 U.S. ECONOMIC TRENDS Inflation Adjusted Crude Oil Prices Fall Below Long-Term Average Price per Barrel (Nov. 2014 Dollars) $160 $120 $80 $40 $0
Comprehensive Real Estate Counseling and Valuation Services
 Comprehensive Real Estate Counseling and Valuation Services Integra Realty Resources, Inc. specializes in commercial real estate consulting and valuation assignments. IRR s valuers and counselors are among
Lennar s Strategic Business Combination With CalAtlantic Creating a Best-in-Class National Homebuilder
 Lennar s Strategic Business Combination With CalAtlantic Creating a Best-in-Class National Homebuilder October 30, 2017 Disclaimer Forward Looking Statements Some of the statements in this Investor Presentation
A Divided Real Estate Nation
 Real Estate Reality Check Explanation of "What Happened" from the 26 Leadership Conference Boom ended August 2 Mortgage rates rose almost one point Affordability conditions deteriorated Speculative investors