The Economic Backdrop When will this cycle end?
|
|
|
- Kelly Nash
- 5 years ago
- Views:
Transcription
1 The Economic Backdrop When will this cycle end?
2 How far are we into the current economic expansion? Current expansion in 8 th year; 4 th longest since 1960 Length of economic expansions (months) Apr-91-Feb Mar-61-Nov Dec-82-Jun Jul-09-???? 87 Jan-17 Mar-18 May-19 Dec-01-Nov Apr-75-Dec Dec-70-Oct Aug-80-Jun Source: NBER and Moody s Analytics with data through October
3 Macro economic trends Source: Moody s Analytics, ECA, FRB, BLS, S&P Dow Jones Indices LLC, CoreLogic, Inc, FHFA, Freddie Mac, Fannie Mae
4 Labor market trends
5 Apartment Market Conditions Are we at an inflection point?
6 Head-to-Head Which market has the better outlook over the next 12 months?
7 SEATTLE DENVER 3Q Q-2016 Chg 3Q Q-2016 Chg Job growth (Y/Y) 58,200 65,800 13% 47,200 46,700-1% 3.2% 3.5% % 3.3% (15) Occupancy rate 95.8% 95.6% (20) 95.8% 94.9% (90) Rent growth (Y/Y) 7.9% 6.4% (152) 9.8% 2.2% (753) MF permits (T12M) 16,052 11,709-27% 7,926 8,910 12% SF permits (T12M) 8,493 9,540 12% 8,573 9,934 16% Total permits (T12M) 24,545 21,249-13% 16,499 18,844 14%
8 ATLANTA DALLAS 3Q Q-2016 Chg 3Q Q-2016 Chg Job growth (Y/Y) 77,100 72,000-7% 108, ,100-6% 3.1% 2.8% (29) 4.7% 4.2% (47) Occupancy rate 94.9% 94.9% % 95.6% (10) Rent growth (Y/Y) 6.8% 5.4% (140) 6.2% 4.7% (150) MF permits (T12M) 9,740 12,507 28% 19,962 21,532 8% SF permits (T12M) 19,276 21,998 14% 19,962 22,776 14% Total permits (T12M) 29,016 34,505 19% 39,924 44,308 11%
9 SOUTH FLORIDA PHOENIX 3Q Q-2016 Chg 3Q Q-2016 Chg Job growth (Y/Y) 83,800 58,200-31% 65,400 42,800-35% 3.4% 2.3% (113) 3.5% 2.2% (129) Occupancy rate 95.8% 94.7% (110) 94.7% 94.7% 0 Rent growth (Y/Y) 5.6% 3.0% (260) 7.4% 6.3% (110) MF permits (T12M) 12,565 14,069 12% 6,108 7,305 20% SF permits (T12M) 6,945 6,663-4% 14,972 18,159 21% Total permits (T12M) 19,510 20,732 6% 21,080 25,464 21%
10 SOUTH FLORIDA PHOENIX 3Q Q-2016 Chg 3Q Q-2016 Chg Job growth (Y/Y) 83,800 58,200-31% 65,400 42,800-35% 3.4% 2.3% (113) 3.5% 2.2% (129) Occupancy rate 95.8% 94.7% (110) 94.7% 94.7% 0 Rent growth (Y/Y) 5.6% 3.0% (260) 7.4% 6.3% (110) MF permits (T12M) 12,565 14,069 12% 6,108 7,305 20% SF permits (T12M) 6,945 6,663-4% 14,972 18,159 21% Total permits (T12M) 19,510 20,732 6% 21,080 25,464 21%
11 AUSTIN NASHVILLE 3Q Q-2016 Chg 3Q Q-2016 Chg Job growth (Y/Y) 42,900 31,100-28% 32,300 31,900-1% 4.7% 3.2% (143) 3.7% 3.5% (17) Occupancy rate 95.6% 95.3% (30) 96.4% 96.1% (30) Rent growth (Y/Y) 5.4% 2.7% (270) 6.9% 5.4% (150) MF permits (T12M) 9,796 9,084-7% 6,716 8,382 25% SF permits (T12M) 11,731 12,724 8% 10,395 11,614 12% Total permits (T12M) 21,527 21,808 1% 17,111 19,996 17%
12 SAN FRANCISCO NEW YORK 3Q Q-2016 Chg 3Q Q-2016 Chg Job growth (Y/Y) 53,546 24,818-54% 157, ,494-31% 5.3% 2.3% (297) 2.4% 1.6% (79) Occupancy rate 96.6% 95.7% (90) 97.0% 96.9% (10) Rent growth (Y/Y) 11.5% -1.8% (1,330) 4.1% -0.2% (430) MF permits (T12M) 4,544 4,513-1% 59,398 28,926-51% SF permits (T12M) % 6,472 6,501 0% Total permits (T12M) 5,018 5,077 1% 65,870 35,427-46%
13 PORTLAND SAN DIEGO 3Q Q-2016 Chg 3Q Q-2016 Chg Job growth (Y/Y) 38,400 27,200-29% 45,700 27,100-41% 3.6% 2.4% (112) 3.4% 1.9% (144) Occupancy rate 96.4% 95.4% (100) 95.7% 96.1% 40 Rent growth (Y/Y) 14.8% 4.0% (1,080) 7.8% 5.3% (250) MF permits (T12M) 5,460 7,691 41% 4,391 8,273 88% SF permits (T12M) 6,532 7,561 16% 3,045 2,602-15% Total permits (T12M) 11,992 15,252 27% 7,436 10,875 46%
14 ORLANDO TAMPA 3Q Q-2016 Chg 3Q Q-2016 Chg Job growth (Y/Y) 46,900 53,900 15% 41,100 38,000-8% 4.2% 4.6% % 3.0% (36) Occupancy rate 96.1% 96.0% (10) 95.8% 95.6% (20) Rent growth (Y/Y) 7.7% 4.8% (290) 6.4% 5.7% (70) MF permits (T12M) 5,830 8,592 47% 5,627 5,626 0% SF permits (T12M) 10,978 13,989 27% 8,327 10,693 28% Total permits (T12M) 16,808 22,581 34% 13,954 16,319 17%
15 HOUSTON WASHINGTON, DC 3Q Q-2016 Chg 3Q Q-2016 Chg Job growth (Y/Y) 49,600 12,100-76% 63,700 81,400 28% 1.7% 0.4% (128) 2.0% 2.6% 52 Occupancy rate 94.7% 93.2% (150) 95.6% 95.7% 10 Rent growth (Y/Y) 3.2% -2.7% (590) 1.8% 2.2% 40 MF permits (T12M) 24,190 11,769-51% 10,226 11,318 11% SF permits (T12M) 37,563 35,431-6% 12,170 12,867 6% Total permits (T12M) 61,753 47,200-24% 22,396 24,185 8%
16 CHICAGO LOS ANGELES 3Q Q-2016 Chg 3Q Q-2016 Chg Job growth (Y/Y) 77,100 63,700-17% 97,100 76,100-22% 1.7% 1.4% (32) 2.3% 1.8% (54) Occupancy rate 95.6% 95.2% (40) 96.3% 96.0% (30) Rent growth (Y/Y) 3.8% 2.2% (160) 6.8% 3.9% (290) MF permits (T12M) 6,952 9,098 31% 16,747 14,923-11% SF permits (T12M) 7,760 7,873 1% 4,519 4,779 6% Total permits (T12M) 14,712 16,971 15% 21,266 19,702-7%
17 BOSTON PHILADELPHIA 3Q Q-2016 Chg 3Q Q-2016 Chg Job growth (Y/Y) 78,328 46,958-40% 47,500 54,100 14% 3.0% 1.8% (127) 1.7% 1.9% 20 Occupancy rate 96.2% 95.9% (30) 95.7% 95.0% (70) Rent growth (Y/Y) 5.2% 2.4% (280) 4.1% 0.9% (320) MF permits (T12M) 7,884 7,555-4% 5,297 4,864-8% SF permits (T12M) 4,738 5,224 10% 6,374 6,809 7% Total permits (T12M) 12,622 12,779 1% 11,671 11,673 0%
18 CHARLOTTE RALEIGH 3Q Q-2016 Chg 3Q Q-2016 Chg Job growth (Y/Y) 38,891 28,495-27% 24,000 15,700-35% 3.6% 2.6% (107) 4.3% 2.7% (159) Occupancy rate 95.9% 95.9% % 95.6% 10 Rent growth (Y/Y) 6.2% 4.1% (210) 6.1% 3.9% (220) MF permits (T12M) 6,639 7,023 6% 4,073 3,262-20% SF permits (T12M) 11,567 12,654 9% 8,353 9,185 10% Total permits (T12M) 18,206 19,677 8% 12,426 12,447 0%
19 SALT LAKE CITY LAS VEGAS 3Q Q-2016 Chg 3Q Q-2016 Chg Job growth (Y/Y) 25,000 18,900-24% 34,300 26,400-23% 3.8% 2.8% (104) 3.9% 2.9% (100) Occupancy rate 95.9% 95.9% % 95.6% 10 Rent growth (Y/Y) 6.2% 4.1% (210) 6.1% 3.9% (220) MF permits (T12M) 2,786 2,930 5% 3,152 4,259 35% SF permits (T12M) 3,723 4,157 12% 7,560 8,409 11% Total permits (T12M) 6,509 7,087 9% 10,712 12,668 18%
20 Supply Are we building too much?
21 National Pipeline Activity October 2016 compared to one year ago October 2015 October 2016 Pipeline Phase Units Pipeline Phase Units Planned 805,228 Planned 1,009,844 Under Construction 542,213 Under Construction 595,450 Lease Up 131,751 Lease Up 159,545 Grand Total 1,479,192 Grand Total 1,764,839 Source: Axiometrics
22 Top Markets for Projects Under Construction October 2016 compared to one year ago October 2015 October 2016 Under Construction Units Under Construction Units New York, NY 36,629 New York, NY 44,382 Dallas, TX 32,676 Dallas, TX 42,341 Houston, TX 31,446 Houston, TX 32,740 Washington, DC 21,430 Washington, DC 26,291 Seattle, WA 20,295 Los Angeles, CA 23,689 Los Angeles, CA 19,853 Atlanta, GA 21,897 Atlanta, GA 19,314 Seattle, WA 18,312 Denver, CO 16,707 Charlotte, NC 15,029 Source: Axiometrics
23 High Rise Projects (9 floors or higher) Built Since 2000 by Year Number of Properties Including these markets: 2015 Baton Rouge, LA Canton, OH Greensboro, NC Spartanburg, SC 2016 Des Moines, IA Grand Rapids, MI Madison, WI South Bend, IN Includes conversions; Source: Axiometrics
24 How Unit Mixes Differ from Existing Stock Existing Stock 2013 or Newer 60% 50% 45% 53% 55% 47% 40% 30% 20% 10% 0% Studio/One Two/Three Source: Axiometrics
25 When Will Supply Begin to Slow? Dallas Houston Los Angeles New York Seattle Washington, DC 35,000 30,000 25,000 Units 20,000 15,000 10,000 5,000-1Q11 2Q11 3Q11 4Q11 1Q12 2Q12 3Q12 4Q12 1Q13 2Q13 3Q13 4Q13 1Q14 2Q14 3Q14 4Q14 1Q15 2Q15 3Q15 4Q15 1Q16 2Q16 3Q16 4Q16 1Q17 2Q17 3Q17 4Q17 1Q18 2Q18 3Q18 4Q18 1Q19 2Q19 3Q19 4Q19 Source: Axiometrics

26 Sources: Axiometrics, Wall Street Journal


27 Annual Rent Growth by Submarket San Francisco Bay Area 2014 <2% 2%-4% 4%-6% >6% Source: Axiometrics 2015 Sept. 2016


28 2015 Annual Rent Growth by Submarket Austin Sept % 97% Occupancy Rate Long-Term Average Supply and Demand in Equilibrium 96% 95% 94% 93% 92% <2% 2%-4% 4%-6% >6% 91% 90% Source: Axiometrics


29 Source: Axiometrics Concessions Seattle & Southern California


30 Source: Axiometrics Concessions Houston & Dallas/Ft. Worth
31 Affordability Headline or reality?

32 Reported Rent-to-Income Ratios As of 2015 Sources: MPF Research/RealPage, SeekingAlpha.com, Zillow *prior to sale **based on leases tracked by RealPage software

33 Incomes are Growing Fast for Market-Rate Apt. Renters Based on Rent Roll Data Sources: MPF Research/RealPage
34 Product Class, Rent-to-Income Inversely Correlated Based on Rent Roll Data Sources: MPF Research/RealPage
35 The Cheaper the Rent, the More Affordability is an Issue Based on Rent Roll Data Sources: MPF Research/RealPage

36 The Cheaper the Rent, the More Affordability is an Issue Based on Rent Roll Data Sources: MPF Research/RealPage
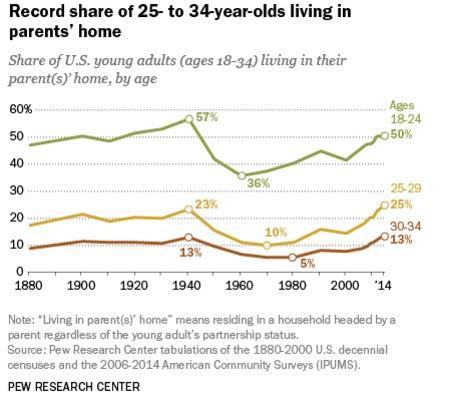
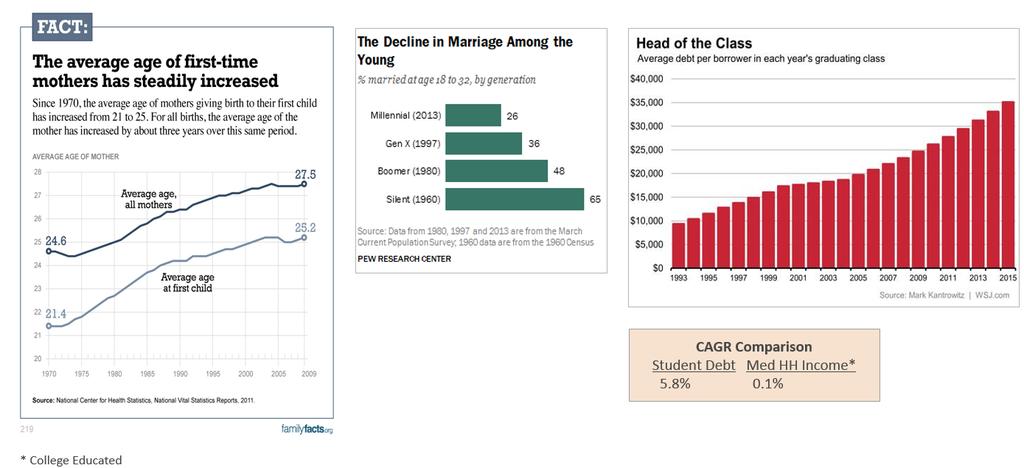
37 Demand & Demographics Millennials vs. Boomers how is demand shifting?
38
39
40 Homeownership rate: how low can it go? Home ownership rate (%) Quarterly 4Q Moving Avg Source: US Census Bureau
41 Changing demographics: implications for demand? Net population growth by age cohort (Mil.) Source: US Census Bureau, National Population Projections
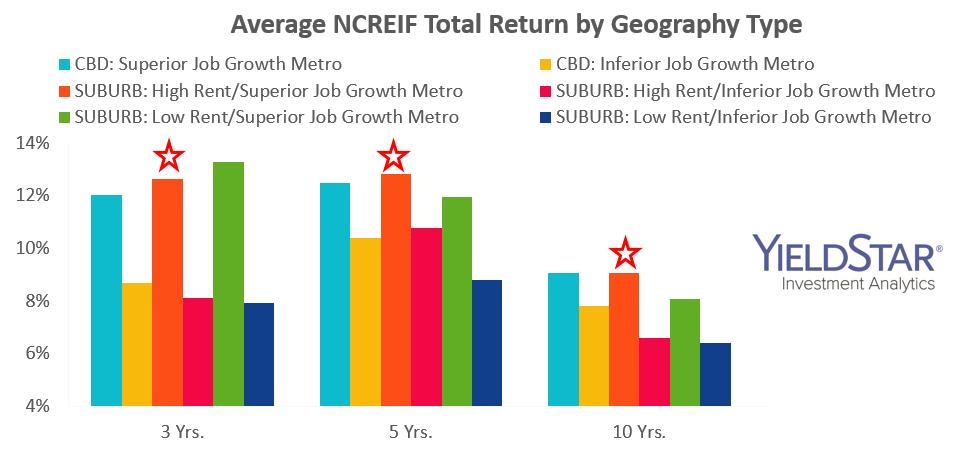
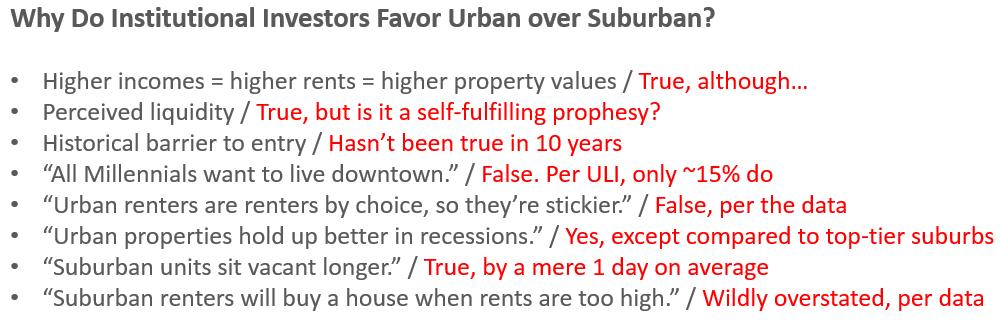
42 Urban vs. Suburban Are we overplaying the urban trend?
43 Sources: MPF Research/RealPage
44 Sources: MPF Research/RealPage
45 Sources: MPF Research/RealPage
46 Sources: MPF Research/RealPage
47 Sources: MPF Research/RealPage
48 Sources: MPF Research/RealPage
49 Sources: MPF Research/RealPage
50 Sources: MPF Research/RealPage
51 Sources: MPF Research/RealPage
52 Sources: MPF Research/RealPage
53 Chart provided by Dan Mahoney, LaSalle Investment Management
54
55
56 Predictions What will 2017 hold?
The 2017 Housing & Economic Outlook
 The 2017 Housing & Economic Outlook Frank E. Nothaft, CoreLogic SVP & Chief Economist @DrFrankNothaft @CoreLogicEcon The views, opinions, forecasts and estimates herein are those of the CoreLogic Office
State of the U.S. Multifamily Market. Q Review and Forecast
 State of the U.S. Multifamily Market Q1 2015 Review and Forecast Agenda Economy Leasing Fundamentals Rent and NOI Trends Single-Family Market Capital Markets Economy page 3 GDP Growth Contributions To
ZipRealty, Inc. Supplemental Data Reclassification of Consolidated Statement of Operations
 Reclassification of Consolidated Statement of Operations Effective January 1, 2007, for income statement presentation purposes, we have reclassified sales support and marketing expenses from general and
Macroeconomic View of the Housing Market. Frank Nothaft CoreLogic Chief Economist December 12 th 2018
 Macroeconomic View of the Housing Market Frank Nothaft CoreLogic Chief Economist December 12 th 2018 2019 Economic and Housing Outlook Economic growth continues, recession risk rises, interest rates increase
Was it all for N 0 u g h t? The 00 Decade and the Year Ahead. Tony Pierson Cornerstone Real Estate Advisers LLC. Real Estate Conference
 Disclaimer This presentation is not intended to be and does not constitute investment advice. This is provided as an accommodation and shall not be relied upon as investment advice. This presentation includes
Housing Recovery is Underway, But Not for Everyone
 Housing Recovery is Underway, But Not for Everyone Eric Belsky August 2013 Dallas, TX Housing Markets Have Corrected In Significant Ways Both price and quantity reductions have occurred Even after price
CAPITAL MARKETS UPDATE. Suburban Office: Is this the Next Play?
 CAPITAL MARKETS UPDATE Suburban Office: Is this the Next Play? October 2016 Investment Thesis Background Suburban office product has lagged the property recovery cycle. Most of the lag is the result of
US Hotel Industry Overview. Chris Crenshaw
 US Hotel Industry Overview Chris Crenshaw ccrenshaw@str.com July 2014 (12 MMA): All Signs Point To A Sellers Market % Change Room Supply* 1.8 bn 0.8% Room Demand* 1.1 bn 3.4% Occupancy 63 % 2.6% A.D.R.*
Emerging Trends in Real Estate Navigating at Altitude
 Emerging Trends in Real Estate 2018 Navigating at Altitude Emerging Trends in Real Estate 2018 Navigating at Altitude We are in a long cycle, not in boom/bust. The key to the next few years is to expand
Rising Risks for the Housing Outlook
 Rising Risks for the Housing Outlook Master Builders Association of Pierce County October 17, 2018 Robert Dietz, Ph.D. NAHB Chief Economist Population Growth Pierce County population growing faster than
TEXAS MULTIFAMILY FOLLOW THE MONEY. THE CAPITAL MARKETS PERSPECTIVE Jeanette I. Rice, Americas Head of Investment Research February 12, 2016
 TEXAS MULTIFAMILY FOLLOW THE MONEY THE CAPITAL MARKETS PERSPECTIVE Jeanette I. Rice, Americas Head of Investment Research February 12, 2016 MULTIFAMILY ON TOP OF THE MARKET 2 MONEY IS FOLLOWING MULTIFAMILY
Emerging Trends in Real Estate We are in a long cycle, not in boom/bust.
 Emerging Trends in Real Estate 2018 Navigating at Altitude We are in a long cycle, not in boom/bust. The key to the next few years is to expand horizons, market by market, property type by property type.
2019 Outlook. January
 2019 Outlook January 2019 0 Performance in the multifamily market remained healthy during 2018 and is expected to continue into 2019, but with more modest growth in comparison to recent years. The multifamily
MetroMonitor Tracking Economic Recession and Recovery in America s 100 Largest Metropolitan Areas
 MetroMonitor Tracking Economic Recession and Recovery in America s 100 Largest Metropolitan Areas Howard Wial and Richard Shearer June 2011 (Updated on June 24, 2011) With job growth slowing and housing
Office of the Chief Economist National Credit Union Administration. Economic Overview. California State Examiner School.
 Office of the Chief Economist National Credit Union Administration California State Examiner School May 30, 2017 Credit Union Performance Trends Recent Data About Credit Union Performance in California,
AEI Center on Housing Markets and Finance Announces Ten Best and Worst Metro Areas to Be a First Time Homebuyer
 AEI Center on Housing Markets and Finance Announces Ten Best and Worst Metro Areas to Be a First Time Homebuyer Edward Pinto and Tobias Peter November 28th, 2018 New AEI study ranks 50 metros by home price
Metropolitan Area Statistics (4Q 2012)
") Metropolitan Area Statistics (4Q 2012) Apartment Completions 4Q 2011 4Q 2012 % Chg. Atlanta 490 288-41% Boston 678 995 47% Chicago 506 711 41% Cleveland 4 13 225% Columbus 255 322 26% Dallas-Ft. Worth
Metropolitan Area Statistics (4Q 2012) Apartment Completions 4Q 2011 4Q 2012 % Chg. Atlanta 490 288-41% Boston 678 995 47% Chicago 506 711 41% Cleveland 4 13 225% Columbus 255 322 26% Dallas-Ft. Worth
Relationships. Results. COMPANY OVERVIEW COMMERCIAL REAL ESTATE DEBT, EQUITY & SERVICING
 Relationships. COMPANY OVERVIEW Results. COMMERCIAL REAL ESTATE DEBT, EQUITY & SERVICING COMMERCIAL REAL ESTATE DEBT, EQUITY & SERVICING Relationships. Results. For more than 50 years, NorthMarq Capital
State Of The U.S. Industrial Market: 2017 Q2
 State Of The U.S. Industrial Market: 2017 Q2 Copyright 2017 CoStar Realty Information, Inc. No reproduction or distribution without permission. The following information includes projections and analyses
Office. Office. IRR Viewpoint 2015
 IRR Viewpoint 05 Above: Designed in 95 in the Art Deco style by architect Timothy Pflueger as the Pacific Telephone and Telegraph Building, 40 New Montgomery Street, San Francisco, CA has been the subject
The U.S. and California Is The Recovery Here at Last? UCLA Anderson School of
 The U.S. and California Is The Recovery Here at Last? Jerry Nickelsburg Senior Economist UCLA Anderson Forecast State of the County January 20, 2010 SEPTEMBER 2008 In September 2008 Financial Markets Stopped
Capital Market Update. February 10, 2011 Marc Louargand, Ph.D., CRE, FRICS Principal SALTASH PARTNERS LLC investing in American ingenuity
 Capital Market Update February 10, 2011 Marc Louargand, Ph.D., CRE, FRICS Principal SALTASH PARTNERS LLC investing in American ingenuity A Brief Tour of the Capital Market What s happened in the past year?
Econometric Advisors APARTMENT OVERVIEW AND OUTLOOK Q4 2017
 Econometric Advisors APARTMENT OVERVIEW AND OUTLOOK Q4 2017 THE U.S. ECONOMY WILL REMAIN ON FIRM FOOTING IN 2018 JOB GROWTH WILL MODERATE AS LABOR MARKET TIGHTENS FURTHER STRONG CONSUMPTION, HIGHER PRIVATE
Relationships. Results. COMPANY OVERVIEW COMMERCIAL REAL ESTATE DEBT, EQUITY & SERVICING
 Relationships. COMPANY OVERVIEW Results. COMMERCIAL REAL ESTATE DEBT, EQUITY & SERVICING C O M M E R C I A L R E A L E S TAT E D E B T, E Q U I T Y & S E R V I C I N G Relationships. Results. For more
Office-Using Jobs and Net Migration Point to Continued Strength
 October 20, 2017 Office-Using Jobs and Net Migration Point to Continued Strength Key Takeaways Secondary Sunbelt office markets are priced to offer attractive, risk-adjusted returns relative to the Gateway²
Moody s/real Commercial Property Price Indices, December 2010
 DECEMBER 21, 2010 STRUCTURED FINANCE SPECIAL REPORT Moody s/real Commercial Property Price Indices, December 2010 Table of Contents: OVERVIEW 1 Notable Observations and Themes 3 NATIONAL ALL PROPERTY TYPE
SOUTHERN NEVADA 2015 ECONOMIC OUTLOOK
 SOUTHERN NEVADA 2015 ECONOMIC OUTLOOK NAIOP Washington D.C. Legislative Retreat February 9-11, 2015 Prepared by: ECONOMIC OVERVIEW 2 Nevada job recovery from Great Recession after 90 months. Nevada Recession
Housing & Mortgage Outlook. Frank Nothaft Chief Economist May 22, 2018
 Housing & Mortgage Outlook Frank Nothaft Chief Economist May 22, 2018 Economic & Housing Outlook Effect of higher mortgage rates Inventory-for-sale remains low Less refinance, more purchase & home-improvement
Capital Markets UpdateTM MULTIFAMILY EDITION SPECIAL FEATURE: SENIOR HOUSING OUTLOOK SECOND QUARTER 2014
 Capital Markets UpdateTM MULTIFAMILY EDITION SPECIAL FEATURE: SENIOR HOUSING OUTLOOK SECOND QUARTER 2014 a Berkshire Hathaway and Leucadia National Company MARKET ACTIVITY SECOND QUARTER 2014 MULTIFAMILY
HIGH AND WIDE: INCOME INEQUALITY GAP IN THE DISTRICT ONE OF BIGGEST IN THE U.S. By Wes Rivers
 An Affiliate of the Center on Budget and Policy Priorities 820 First Street NE, Suite 510 Washington, DC 20002 (202) 408-1080 Fax (202) 325-8839 www.dcfpi.org March 13, 2014 HIGH AND WIDE: INCOME INEQUALITY
Europe June Carol Tomé Executive Vice President, Corporate Services & Chief Financial Officer. Diane Dayhoff Vice President, Investor Relations
 Europe June 2017 Carol Tomé Executive Vice President, Corporate Services & Chief Financial Officer Diane Dayhoff Vice President, Investor Relations Forward Looking Statements and Non-GAAP Financial Measurements
Australia/Asia July Diane Dayhoff Vice President, Investor Relations. Lyndsey Burton Senior Manager, Investor Relations
 Australia/Asia July 2017 Diane Dayhoff Vice President, Investor Relations Lyndsey Burton Senior Manager, Investor Relations Forward Looking Statements and Non-GAAP Financial Measurements Certain statements
Emerging Trends in Real Estate Sustaining Momentum but Taking Nothing for Granted
 Emerging Trends in Real Estate 2015 Sustaining Momentum but Taking Nothing for Granted PwC-ULI Outlook on trends 36th edition 368 interviews 1,055 survey responses 1,400+ participants, a record Who? District
Financial Strength and Operational Excellence
 Financial Strength and Operational Excellence 425 Mass Washington, D.C. RiverTower New York, NY Longacre House New York, NY 1401 Joyce on Pentagon Row Arlington, VA JUNE 2010 Trump Place New York, NY 180
The Housing Market and the Macroeconomy. Karl E. Case. University of North Carolina February 18, 2010
 The Housing Market and the Macroeconomy Karl E. Case University of North Carolina February 18, 2010 Briefly describe some of the connections between the housing market and the Macroeconomy Discuss how
APARTMENT TRENDS. U.S. Economic and Multi-Family Outlook. Special Client Webcast May 31, 2006
 APARTMENT TRENDS U.S. Economic and Multi-Family Outlook Special Client Webcast May 31, 2006 U.S. Apartment Market Economic and Apartment Supply-Demand Overview and Outlook U.S. Economic Conditions Ideal
Employee Benefits Alert
 Employee Benefits Alert September 2005 Issue No. 48 Health Saving Accounts: Comparability Rules The IRS and Treasury recently published proposed regulations concerning the comparability rules for employer
LAS VEGAS LEADS PRICE GAINS IN JUNE ACCORDING TO S&P CORELOGIC CASE-SHILLER INDEX
 LAS VEGAS LEADS PRICE GAINS IN JUNE ACCORDING TO S&P CORELOGIC CASE-SHILLER INDEX NEW YORK, AUGUST 28, 2018 S&P Dow Jones Indices today released the latest results for the S&P CoreLogic Case-Shiller Indices,
VECTRA BANK 23 RD ANNUAL ECONOMIC FORECAST BREAKFAST START SMART IN 2016! Member FDIC VectraBank.com
 VECTRA BANK 23 RD ANNUAL ECONOMIC FORECAST BREAKFAST START SMART IN 2016! Member FDIC VectraBank.com Economic Presentation April 26, 2016 Tatiana Bailey, Ph.D. Director, UCCS Economic Forum A Little Humor
50-State Property Tax Comparison Study: For Taxes Paid in Executive Summary
 50-State Property Tax Comparison Study: For Taxes Paid in 2017 Executive Summary By Lincoln Institute of Land Policy and Minnesota Center for Fiscal Excellence April 2018 As the largest source of revenue
SEPTEMBER S&P CORELOGIC CASE-SHILLER NATIONAL HOME PRICE NSA INDEX UP 6.2% IN LAST 12 MONTHS
 SEPTEMBER S&P CORELOGIC CASE-SHILLER NATIONAL HOME PRICE NSA INDEX UP 6.2% IN LAST 12 MONTHS NEW YORK, NOVEMBER 28, 2017 S&P Dow Jones Indices today released the latest results for the S&P CoreLogic Case-Shiller
S&P CORELOGIC CASE-SHILLER NATIONAL INDEX SETS 30-MONTH ANNUAL RETURN HIGH
 S&P CORELOGIC CASE-SHILLER NATIONAL INDEX SETS 30-MONTH ANNUAL RETURN HIGH NEW YORK, FEBRUARY 28, 2017 S&P Dow Jones Indices today released the latest results for the S&P CoreLogic Case-Shiller Indices,
S&P CORELOGIC CASE-SHILLER NATIONAL HOME PRICE NSA INDEX CONTINUES STEADY GAINS IN OCTOBER
 S&P CORELOGIC CASE-SHILLER NATIONAL HOME PRICE NSA INDEX CONTINUES STEADY GAINS IN OCTOBER NEW YORK, DECEMBER 26, 2017 S&P Dow Jones Indices today released the latest results for the S&P CoreLogic Case-Shiller
Emerging Trends in Real Estate Sustaining Momentum but Taking Nothing for Granted
 Emerging Trends in Real Estate 2015 Sustaining Momentum but Taking Nothing for Granted DALLAS November 6, 2014 36th annual outlook 1,400+ interviews and surveys of industry leaders Rewind: 2014 Emerging
CITIES IN THE WEST: SEATTLE, LAS VEGAS AND SAN FRANCISCO LEAD GAINS IN S&P CORELOGIC CASE-SHILLER HOME PRICE INDICES
 CITIES IN THE WEST: SEATTLE, LAS VEGAS AND SAN FRANCISCO LEAD GAINS IN S&P CORELOGIC CASE-SHILLER HOME PRICE INDICES NEW YORK, JANUARY 30, 2018 S&P Dow Jones Indices today released the latest results for
The Five Retail Trends to Watch in January 14, 2015
 The Five Retail Trends to Watch in 2015 January 14, 2015 U.S. ECONOMIC TRENDS Inflation Adjusted Crude Oil Prices Fall Below Long-Term Average Price per Barrel (Nov. 2014 Dollars) $160 $120 $80 $40 $0
DFW Market Overview. Jay Denton Axiometrics ALL RIGHTS RESERVED.
 DFW Market Overview Jay Denton Apr-13 Jun-13 Aug-13 Oct-13 Dec-13 Feb-14 Apr-14 Jun-14 Aug-14 Oct-14 Dec-14 Feb-15 Apr-15 Jun-15 Aug-15 Oct-15 Dec-15 Feb-16 Apr-16 Jun-16 Aug-16 Oct-16 Dec-16 Feb-17 Apr-17
Regional Snapshot: The Cost of Living in Metro Atlanta
 Regional Snapshot: The Cost of Living in Metro Atlanta Photo by rawpixel.com on Unsplash Atlanta Regional Commission, February 2018 For more information, contact: cdegiulio@atlantaregional.org In Summary
ERRATA. To: Recipients of MG-388-RC, Estimating Terrorism Risk, RAND Corporation Publications Department. Date: December 2005
 ERRATA To: Recipients of MG-388-RC, Estimating Terrorism Risk, 25 From: RAND Corporation Publications Department Date: December 25 Re: Corrected pages (pp. 23 24, Table 4.1,, Density, Density- Weighted,
Emerging Trends in Real Estate 2016
 Emerging Trends in Real Estate 2016 PwC ULI 12 Month Outlook on Trends 37 th Edition 1,800+ Real Estate leaders surveyed 75 Cities Profitability outlook 2010 17.7% 60.6% 21.6% Abysmal to Poor Fair Good
The Mortgage and Housing Market Outlook
 The Mortgage and Housing Market Outlook National Economists Club Washington, DC March 27, 2008 Frank E. Nothaft Chief Economist Recession Risk, Housing Contraction Worsen 1-in-2 chance of recession in
multifamily market overview presented by: Kurt Shoemaker First Vice President
 multifamily market overview 2019 presented by: Kurt Shoemaker First Vice President g r e a t e r d a y t o n a p a r t m e n t a s s o c i a t i o n agenda 01 02 03 04 05 06 macro-level economic indicators
WA S H I N G TO N / BALT I M O R E
 D E L T A A S S O C I A T E S WA S H I N G TO N / BALT I M O R E R E A L E S T A T E M A R K E T O V E R V I E W MULTIFAMILY MARKET OVERVIEW 0 9. 2 9. 2 0 1 5 B y W i l l i a m R i c h, C R E P r e s i
PRESS RELEASE. Home Prices Continue Climbing in June 2013 According to the S&P/Case-Shiller Home Price Indices
 Home Prices Continue Climbing in June 2013 According to the S&P/Case-Shiller Home Price Indices New York, August 27, 2013 Data through June 2013, released today by for its S&P/Case-Shiller 1 Home Price
Emerging Trends in Real Estate 2014
 Canada Emerging Trends in Real Estate 2014 Emerging Trends is the industry s most predictive forecast 35th annual outlook Based on over 1,000 interviews and surveys of industry leaders Sponsored by PwC
CBRE CAP RATE SURVEY. A CBRE Publication. First Half Click to Enter
 CBRE CAP RATE SURVEY A CBRE Publication In This Issue: pg 2 pg 8 pg 17 pg 26 pg 36 pg 41 pg 44 Click to Enter United States The 10-year Treasury (UST) was measurably lower than 2% from April 2012 through
Multifamily Market Outlook
 Multifamily Market Outlook Kim Betancourt Multifamily Economics and Market Research Multifamily Mortgage Business NMHC Research Forum April 2014 1 2 Real Estate Fundamentals: Demographics Favorable Demographics
U.S. and New England Economic Conditions and Outlook
 U.S. and New England Economic Conditions and Outlook Yolanda Kodrzycki Senior Economist and Policy Advisor charts prepared by Ana Patricia Muñoz presented to New England Board of Higher Education conference
US Housing Market Outlook
 US Housing Market Outlook August 8, 2018 John Burns CEO 949-870-1210 jburns@realestateconsulting.com Agenda 1 Our Forecast Process 2 US Economy Outlook: Solid Growth with Rising Risks from Too Much Debt
TAMPA / WESTSHORE MULTI-FAMILY UPDATE
 TAMPA / WESTSHORE MULTI-FAMILY UPDATE Presented by: Phillip A. Smith Westshore Development Forum April 21, 2015 TOPICS Economic Trends Jobs, the Renter, and the Investor Rent Growth Regional Job Growth
CAPITALIZATION RATES BY PROPERTY TYPE
 RATES BY PROPERTY TYPE MID-YEAR 2014 0 RATES BY ASSET TYPE MID-YEAR 2014 O V E R V I E W Capital continues to flow steadily into the U.S. real estate market, as both domestic and foreign investors increase
ehealth Inventory Report of Major Medical Health Plans Available Off of Government Exchanges
 ehealth Inventory Report of Major Medical Health Available Off of Government Exchanges February 2014 Introduction Beginning January 1, 2014, all new major medical health insurance plans were required to
DFW Real Estate FAIRcast. Britt Fair April 1, Fair Texas Title 8201 Preston Road Suite 160 Dallas, TX 75225
 DFW Real Estate FAIRcast Britt Fair April 1, 2019 Fair Texas Title 8201 Preston Road Suite 160 Dallas, TX 75225 Interest Rate Improvement Rates hit all-time lows in July 2016 but rose through Nov 2018
Metro Washington, DC State of the Market
 Metro Washington, DC State of the Market Q1 2016 U.S. office clock San Francisco Peninsula Silicon Valley Houston Dallas, San Francisco Austin Nashville Peaking phase Falling phase Denver, Minneapolis,
The Challenges & Opportunities From Falling Energy Prices March 2015
 The Challenges & Opportunities From Falling Energy Prices March 2015 page 1 Agenda Oil Market: Macro Overview Deep Dive: Houston Economy & CRE Markets Beneficiaries: Who Stands To Gain From Cheap Oil?
U.S. Investment Outlook
 U.S. Investment Outlook Quarterly Investor Research update Q2 2015 U.S. Investment overview 37% 21% 15% 15% U.S. cities dominating global investment activity Top 20 Cities for Transactional Volumes H1
FOR IMMEDIATE RELEASE Contact: Ann Marie Gorden/Robert Nihen
 cutting through complexity News FOR IMMEDIATE RELEASE Contact: Ann Marie Gorden/Robert Nihen June 24, 2014 KPMG LLP 201-505-6288/201-307-8296 agorden@kpmg.com / rnihen@kpmg.com CINCINNATI, CLEVELAND, ATLANTA
PRESS RELEASE. Home Price Gains Continue to Moderate According to the S&P/Case-Shiller Home Price Indices
 Home Price Gains Continue to Moderate According to the S&P/Case-Shiller Home Price Indices New York, July 29, 2014 Data through May 2014, released today by for its S&P/Case-Shiller 1 Home Price Indices,
US CAPITAL MARKETS REPORT
 US CAPITAL MARKETS REPORT Capitalization Rates By Property Type Fall 2016 US Capital Markets Report Capitalization Rates By Asset Type OVERVIEW Year-to-date investment sales volume lagged on a year-over-year
Data Brief. Trends in Employer-Sponsored Health Insurance Premiums and Employee Contributions in Major Metropolitan Areas,
 December 2012 Data Brief Trends in Employer-Sponsored Health Insurance Premiums and Employee Contributions in Major Metropolitan Areas, 2003 2011 The mission of The Commonwealth Fund is to promote a high
Economic and Housing Outlook
 Economic and Housing Outlook Home Builders Association of Virginia June 22, 2018 Robert Dietz, Ph.D. NAHB Chief Economist Housing Market Growing; Single-Family Lags Tax reform changes Macroeconomics post-tax
Multifamily Outlook. United States Fall 2014
 Multifamily Outlook United States Fall 2014 Markets continue to perform at peak levels... with nearterm, pocketed softening on the horizon On the heels of seven quarters of peak-level investment sale volumes,
Multifamily Debt Market
 H U N T M O R T G A G E G R O U P Multifamily Debt Market Hayley Suminski Originator, Boston Office Multifamily Debt Market Asset Types 1. Conventional & Coop 2. Manufactured Housing 3. Seniors Housing
The Great Recession. Recovery: Uneven, But Gaining Steam! 2/15/11. Jon Haveman Owner, Compass Economics SPUR January 25, 2010
 Recovery: Uneven, But Gaining Steam! Jon Haveman Owner, Compass Economics SPUR January 25, 21 The Great Recession 1-2 Punch of Credit Crisis and Consumer Retrenchment GDP Growth (SAAR) to Q3-1 8 6 4 2
Economic and Housing Outlook
 Economic and Housing Outlook Volusia Building Industry Association July 18, 218 Robert Dietz, Ph.D. NAHB Chief Economist Housing Market Growing; Single-Family Lags Tax reform changes Macroeconomics post-tax
U.S. ECONOMIC & PROPERTY MARKET PERSPECTIVE
 AEW RESEARCH U.S. ECONOMIC & PROPERTY MARKET PERSPECTIVE Q3 2018 1 Prepared by AEW Research, September 2018 This material is intended for information purposes only and does not constitute investment advice
Carroll Co-Invest Fund II, LP Investor Update, Q4 2013
 Carroll Co-Invest Fund II, LP Investor Update, Q4 2013 January 31, 2014 We are pleased to report that Carroll Co-Invest Fund II experienced a successful 4th quarter 2013. Our work at ARIUM Resort, Carroll
Economic Risks and Their Meaning for the Southwest STEVE COCHRANE, MANAGING DIRECTOR
 Economic Risks and Their Meaning for the Southwest STEVE COCHRANE, MANAGING DIRECTOR The Europeans Are All-in Composition of the European Central Bank s balance sheet, bil 5,000 Other assets Emergency
The Single-Family Outlook and its Impact on Multifamily
 The Single-Family Outlook and its Impact on Multifamily 2016 NMHC Research Forum April 6-7, 2016 Svenja Gudell, Ph.D. Zillow Chief Economist svenjag@zillow.com @SvenjaGudell HOME VALUES, INVENTORY AND
MKT. Included in both the Russell 2000 & 3000 Indexes
 The security investment described herein relates solely to BRG s Series B Preferred Stock, a non-traded security of BRG which has not been listed on the NYSE MKT. The risks and rewards of investing in
Multifamily Investing: Expectations, Realities, Assessment of Conventional Wisdoms
 REACH RESEARCH RESULTS Multifamily Investing: Expectations, Realities, Assessment of Conventional Wisdoms July 2016 James Halliwell, Managing Director Principal Real Estate Investors PROPERTY SALES VOLUME
Equity Research. January Metro Permits Data. February 27, Housing
 February 27, 2017 Equity Research January Metro Permits Data This week, we analyzed the Census Permit data by market to ascertain how the public builders are performing versus the industry. Appreciating
NIC Fall Conference Investing in Seniors Housing and Care Properties. #NICFall17
 2017 NIC Fall Conference Investing in Seniors Housing and Care Properties #NICFall17 We Really Want to Hear From You! Please Take a Few Minutes to Complete Today s Session Evaluation Accessible in the
Perspectives JAN Market Preview: Real Estate
 Perspectives JAN 2019 2019 Market Preview: Real Estate NAVIGATING THROUGH A LATE MARKET CYCLE The real estate sector managed to pull off another strong year in 2018, delivering a total return of 8.35%,
U.S. ECONOMIC & PROPERTY MARKET PERSPECTIVE
 AEW RESEARCH U.S. ECONOMIC & PROPERTY MARKET PERSPECTIVE Q2 2018 AEW RESEARCH U.S. ECONOMIC & PROPERTY MARKET PERSPECTIVE Q 2 2018 1 Prepared by AEW Research, June 2018 This material is intended for information
U.S. Lodging Industry Update. Are You Tired of Being at the Peak?
 U.S. Lodging Industry Update Question for Jan: Are You Tired of Being at the Peak? R. Mark Woodworth CBRE Hotels Americas Research March 23, 2017 Bright Horizons.. Dusty Dawns.. U.S. Lodging Industry Update
An Economic & Commercial Real Estate Forecast
 WEDNESDAY, NOVEMBER 14, 2018 An Economic & Commercial Real Estate Forecast Presented by: Matthew Gardner CHIEF ECONOMIST WINDERMERE REAL ESTATE So Where are We Headed? The Global Economy Global Growth
Sovran Self Storage, Inc. Company Presentation February 28, 2016
 Sovran Self Storage, Inc. Company Presentation February 28, 2016 Safe Harbor Statement This presentation may contain forward looking statements as defined in Section 27A of the Securities Act of 1933,
The Consequences of Mortgage Credit Expansion. What is the Nature of the Mortgage Default Crisis?
 The Consequences of Mortgage Credit Expansion Atif Mian Amir Sufi University Chicago GSB October 2008 What is the Nature of the Mortgage Default Crisis? 1 Mortgage Defaults, 2005 to 2007 Prime versus Subprime
Grow or Stall? An Economic & Real Estate Forecast for 2016
 Grow or Stall? An Economic & Real Estate Forecast for 2016 A Presentation to BOMA Washington Athletic Club, Seattle, Washington February 22, 2016 Presented by: Matthew Gardner Chief Economist, Windermere
Atlanta Regional Commission Link. Overview of the Greater Washington Region: Trends and Challenges
 Atlanta Regional Commission Link Overview of the Greater Washington Region: Trends and Challenges Stephen S. Fuller, Ph.D. Dwight Schar Faculty Chair and University Professor Director, Center for Regional
Local Consumer Commerce
 RELEASE DATE APR 2017 Local Consumer Commerce January 2017 Click here to download the data DATA THROUGH JAN 2017-0.7 % Highlights across 15 cities Local Consumer Commerce fell 0.7 percent year-over-year
CYCLE FORECAST Real Estate Market Cycles First Quarter 2018 Estimates May 2017
 CYCLE FORECAST Real Estate Market Cycles First Quarter 20 Estimates May 20 So far, 20 continues along at a slow Gross Domestic Product (GDP) growth rate near 2% and employment continues to hover above
Why are you waiting? Austin 3Q12 forecast. Mark Sprague State Director of Information Capital Independence Title
 Why are you waiting? Austin 3Q12 forecast Mark Sprague State Director of Information Capital Independence Title Now is the time to buy! Austin area resale home inventory is at 4.3 months New and resale
PRESS RELEASE. Widespread Slowdown in Home Price Gains According to the S&P/Case-Shiller Home Price Indices
 Widespread Slowdown in Home Price Gains According to the S&P/Case-Shiller Home Price Indices New York, August 26, 2014 Data through June 2014, released today by for its S&P/Case-Shiller 1 Home Price Indices,
VECTRA BANK 23 RD ANNUAL ECONOMIC FORECAST BREAKFAST START SMART IN 2016! Member FDIC VectraBank.com
 VECTRA BANK 23 RD ANNUAL ECONOMIC FORECAST BREAKFAST START SMART IN 2016! Member FDIC VectraBank.com Colorado s Economy and State Budget Office of State Planning and Budgeting April 26, 2016 Jason Schrock,
How to Invest in Real Estate in a Growth Economy
 Origin Capital Acquisition Strategy March 2015 How to Invest in Real Estate in a Growth Economy 1 Investment Focus 8 U.S. Growth Markets 2 Market Opportunity Target Markets Attractive Target Markets Target
Employee Benefits Alert
 Employee Benefits Alert Issue 110 June 2007 The Massachusetts Health Care Reform Act: What s an Employer to Do? The Massachusetts Health Care Reform Act became law in April 2006; the July 1, 2007 effective
R EA L E S TAT E L E N D E RS ASSOCIAT I O N
 R EA L E S TAT E L E N D E RS ASSOCIAT I O N MULTI-FAMILY ROUNDTABLE A P R I L 2 5, 2 0 1 3 Real Estate Lenders Association DC R E A L E S T A T E L E N D E R S A S S O C I A T I O N M U L T I - F A M
THREE DISPARATE CHICAGO-AREA HOUSING MARKETS
 Manufactured Housing Community Council ULI 2008 FALL MEETING MIAMI, FLA OCTOBER 27-28, 2008 Understanding Demographics/Market Analysis: THREE DISPARATE CHICAGO-AREA HOUSING MARKETS Three Disparate Chicago-area