Star Search Strategy. Barbara Star, PhD. Wednesday 07/11/2018
|
|
|
- Randolf Floyd
- 5 years ago
- Views:
Transcription


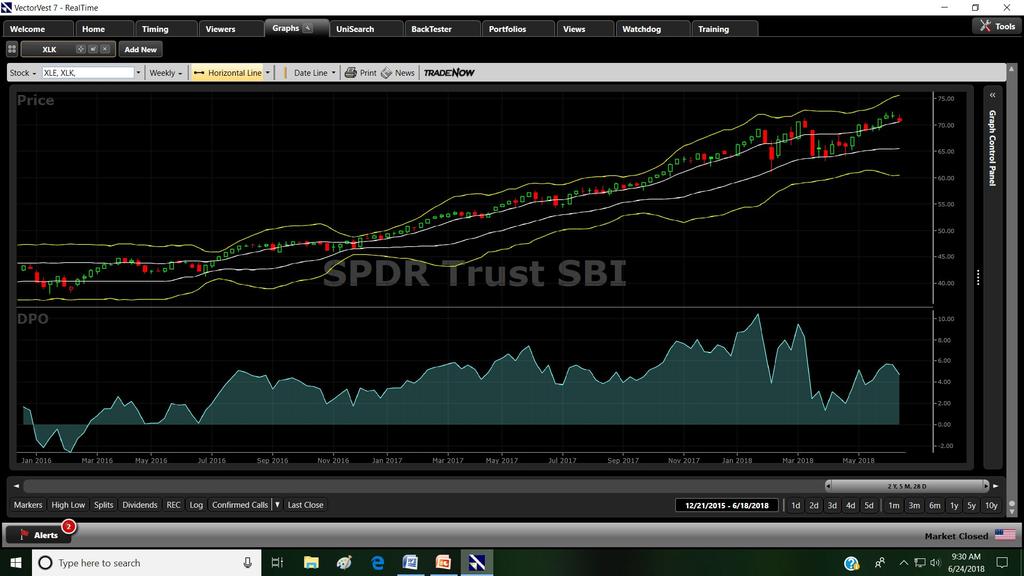
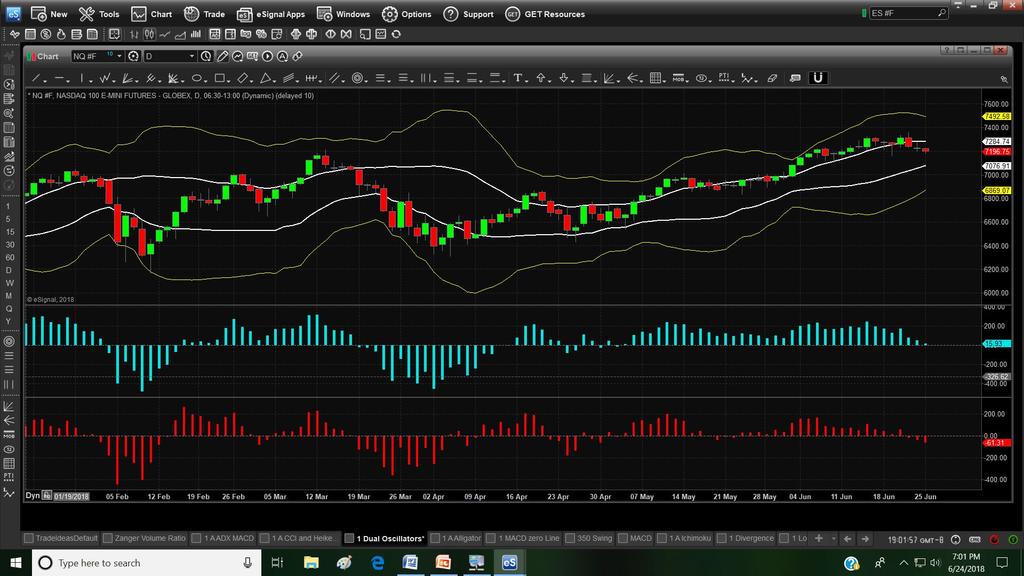
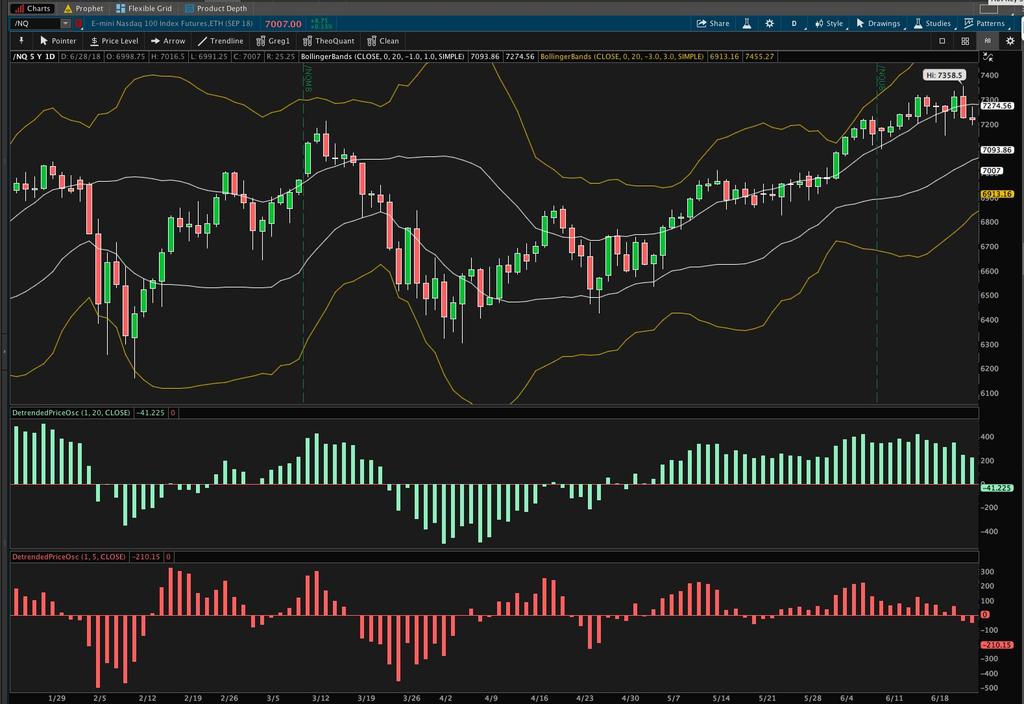
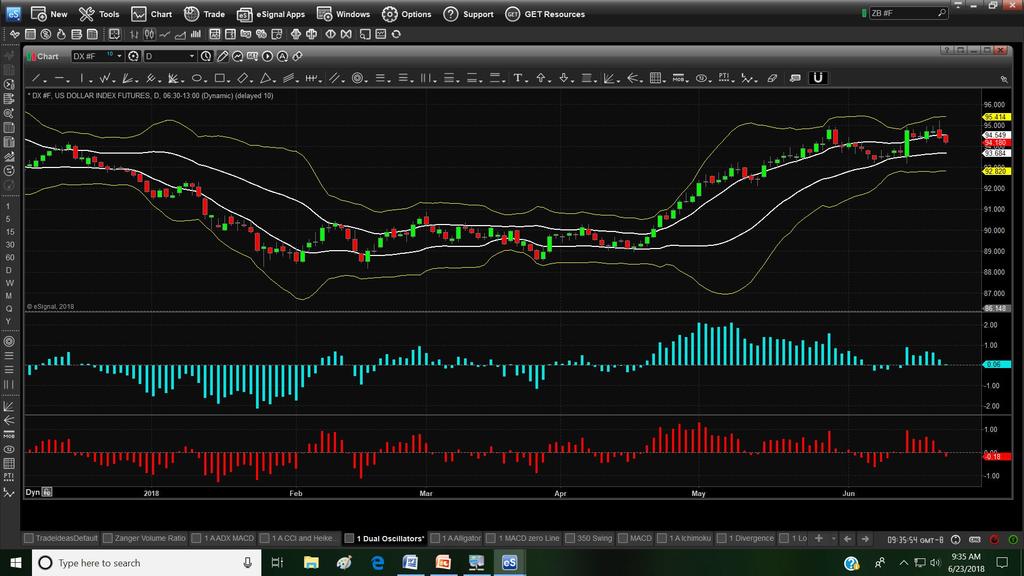
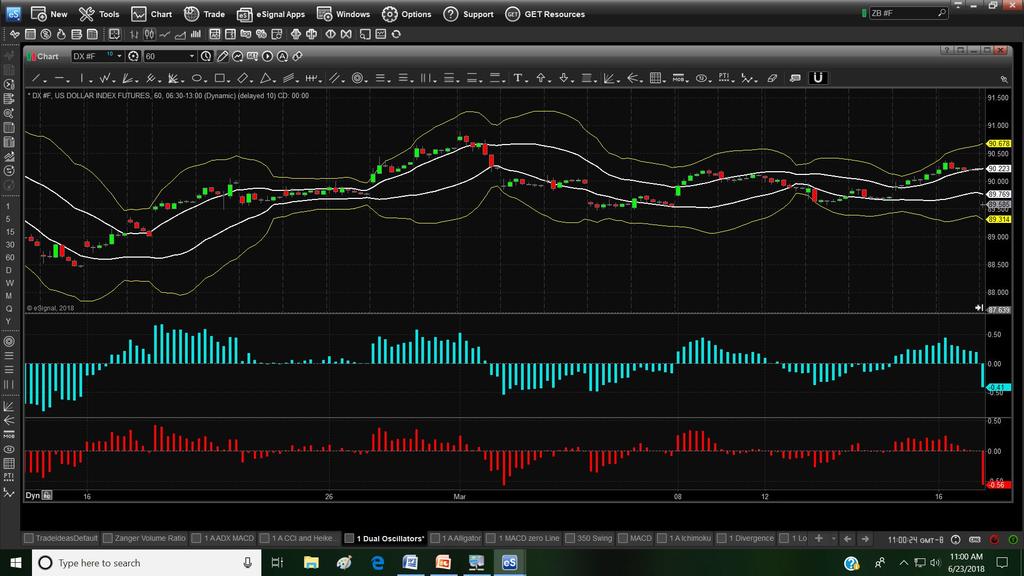
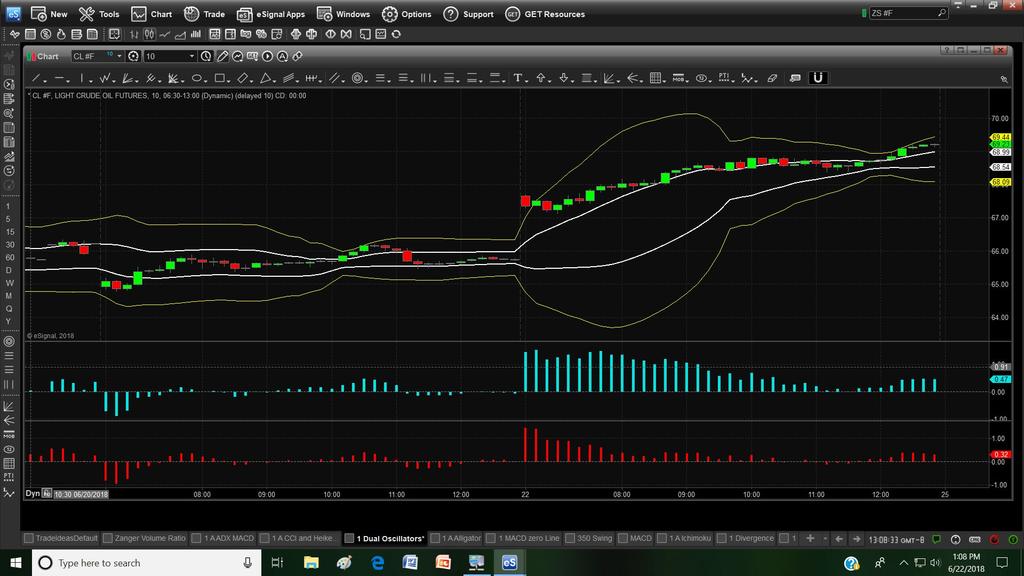
1 Learn a strategy for finding profitable trades in stocks and commodities using a variation of Bollinger Bands and another, less well-known, indicator that is available on most charting software. Both conservative and aggressive trading techniques will be covered. Star Search

2 Star Search Strategy Barbara Star, PhD. Wednesday 07/11/2018


3 Disclaimer Disclaimer: Neither TradersMeetup.net nor any of its hosts, organizers, guests, presenters or other such representatives is, in such capacities, a licensed financial adviser, registered investment adviser, registered broker-dealer nor FINRA SIPC NFA-member firm. TradersMeetup.net does not provide investment or financial advice or make investment recommendations. TradersMeetup.net is not in the business of transacting trades, nor does TradersMeetup.net agree to direct your brokerage accounts or give trading advice tailored to your particular situation. Nothing contained in our content constitutes a solicitation, recommendation, promotion, or endorsement of any particular security, other investment product, transaction or investment. Trading Futures, Options on Futures, and retail off-exchange foreign currency transactions involves substantial risk of loss and is not suitable for all investors. You should carefully consider whether trading is suitable for you in light of your circumstances, knowledge, and financial resources. You may lose all or more of your initial investment. Opinions, market data, and recommendations are subject to change at any time. Disclaimer: Barbara Star, Ph.D. is not licensed to offer specific investment advice. You should be aware of the risks involved in stock, commodity, and Forex investing, and you use the material contained herein at your own risk. This material is believed to be reliable, but there is no guarantee of its accuracy or validity. Dr. Star is not in any way responsible for any errors or omissions which may have occurred. The analysis, ratings, and/or recommendations made during this presentation do not provide, imply, or otherwise constitute a guarantee of performance. Everything you will see and hear today is provided for educational purposes only and not investment advice. The information is designed to empower you to make your own investment decisions, and these decisions are yours, and yours alone to make. All rights reserved. This Material may not be reproduced or distributed, in whole or in part, any other reproduction in whatever form and by whatever media, is expressly prohibited without the prior written consent of TradersMeetup. No Soliciting. No Recording. No Photography.
4 Technical Papers & Reviews The CAM Indicator for Trends and Countertrends Product review: Elliot Wave Turning Points Quick-Scan: Ichimoku Master Zero In on the MACD Product review: Chaikin Analytics Product Review: JBL Risk Manager 9.0 Quick-Scan: Reaction Point Timing Indicator Product Review: Chaikin Analytics for Desktop Product Review: Insiders Guide to Trading Weekly Options Profit with Dual Oscillators & Bands The DMI Stochastic ValueCharts VectorVest 7 Trade Breakouts and Retracements with TMV Commodity Trader s Almanac Product Review: Professional Flux Tool Set The 350 Swing Trade Nison Candle Scanner Second Chance Options VectorVest Real-time Quick Scans: Tsunami Trading Systems Product Review: Best Choice Software Product Review: esignal 10 Confirming Price Trend Bandwidth Volatility Extremes Product Review: CQGNet Professional Directional Breakout Indicator Trade the Price Swings Detecting Trend Direction and Strength How the Pros Use Average Directional Index The MACD Profit Alert Hidden Divergence The MACD Momentum Oscillator Volume Variations and more

5 ( BARBARA STAR BIO - or -

6 AGENDA

7 Purpose of the Original Article

8 So Why Call it Star Search?


9

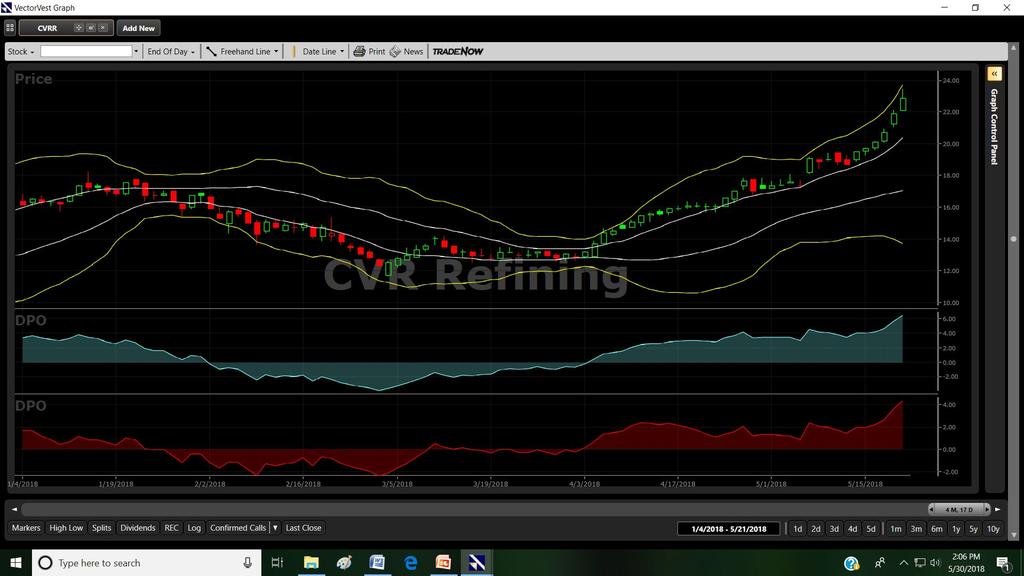
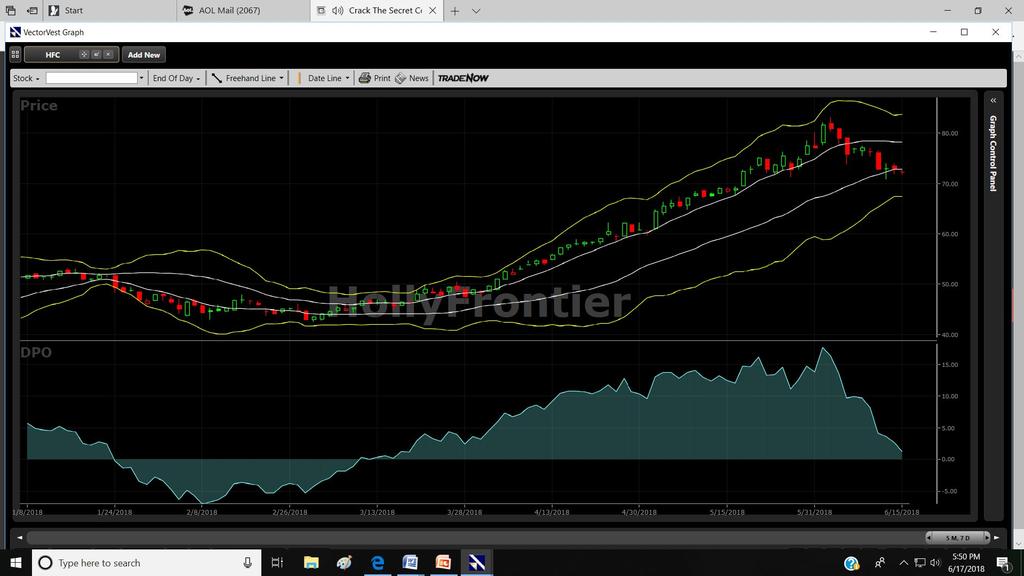
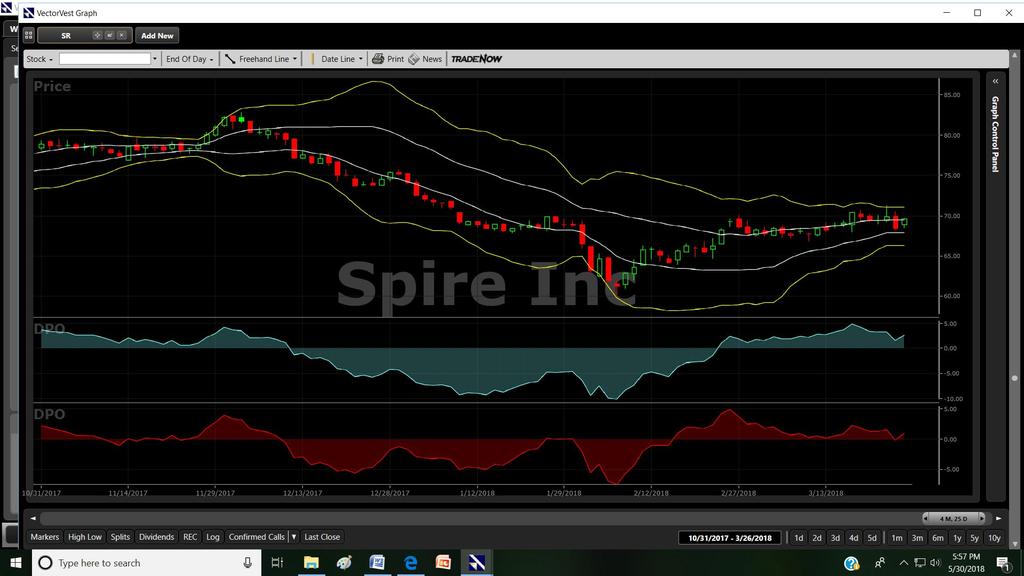
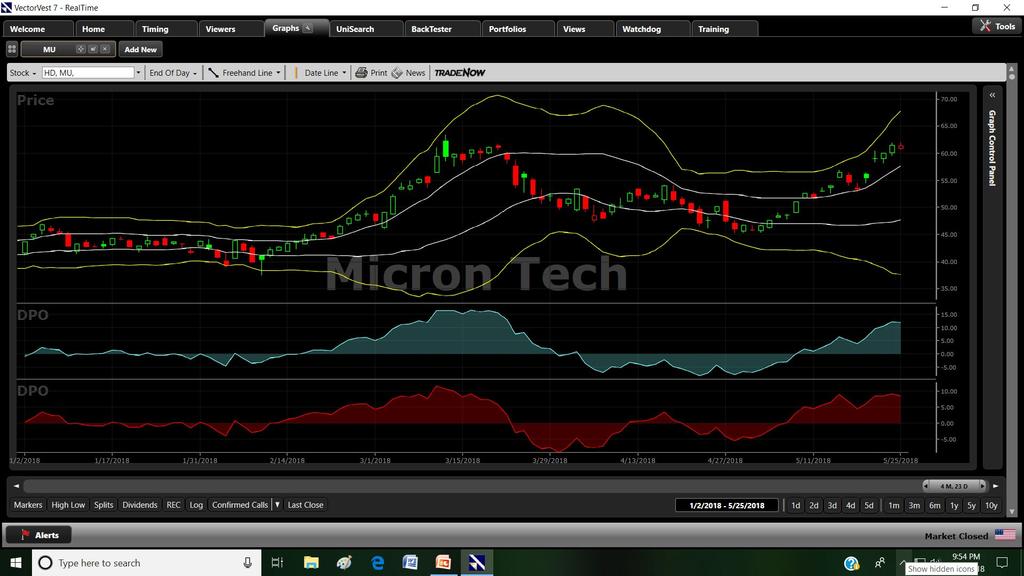
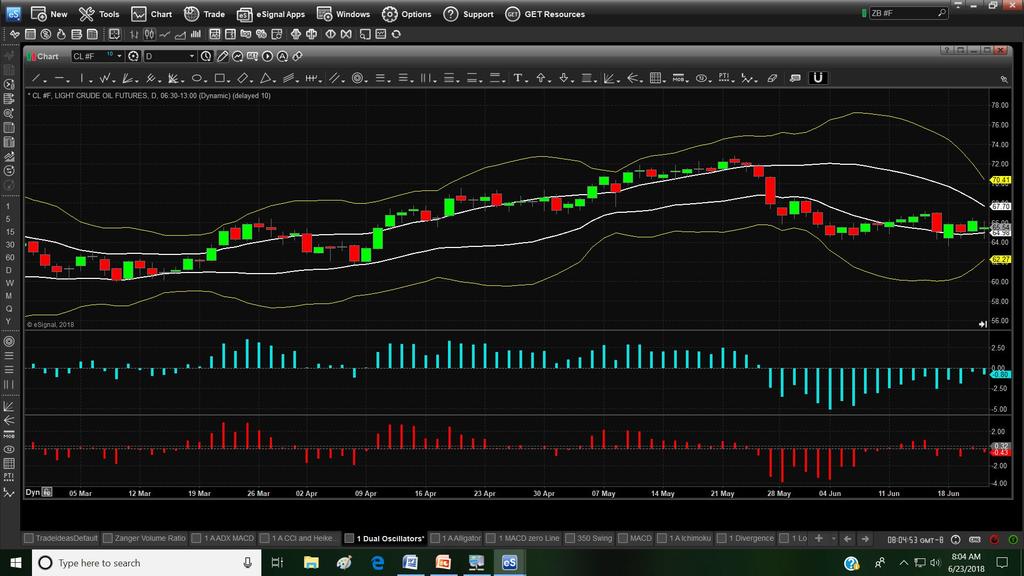
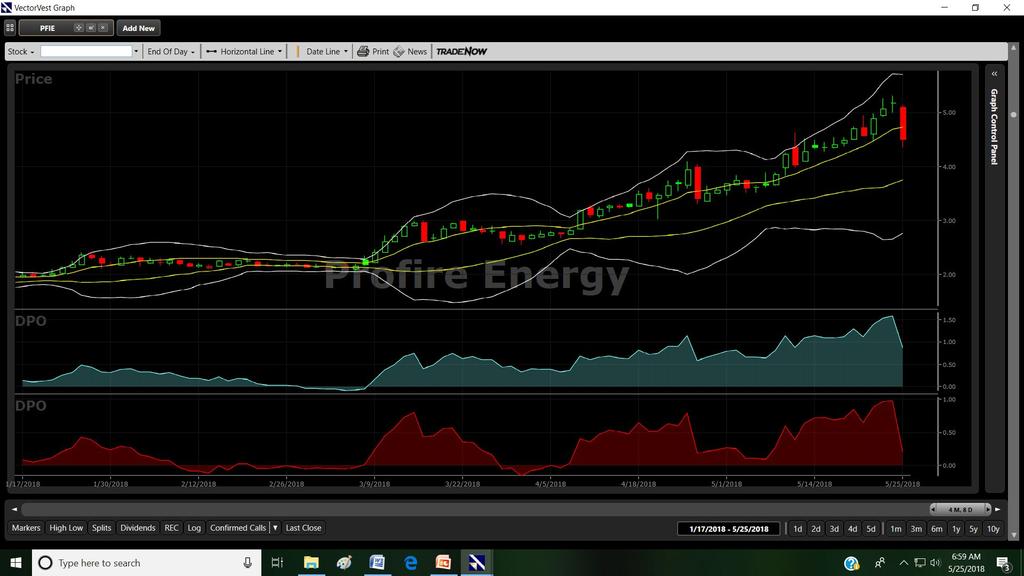
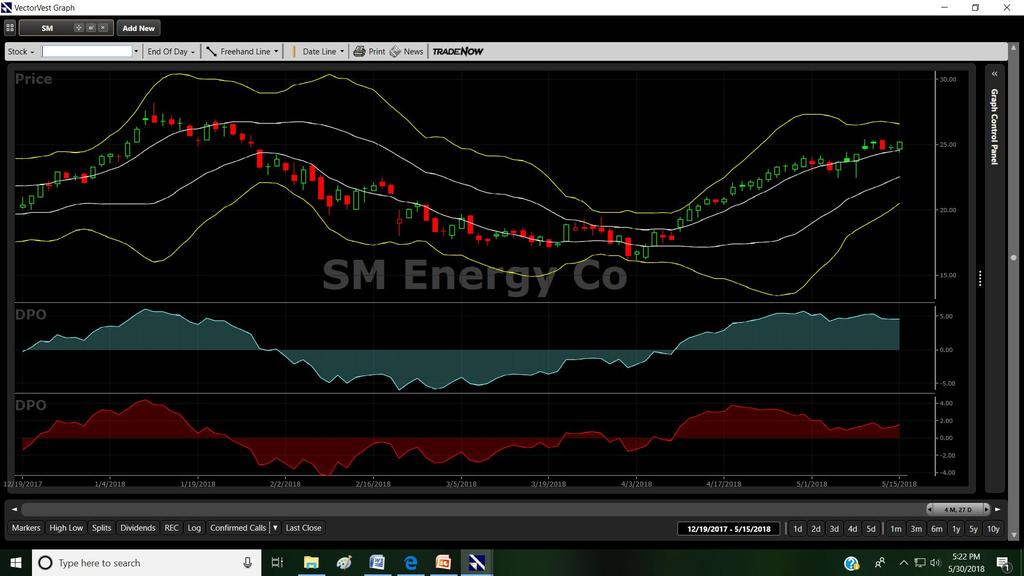
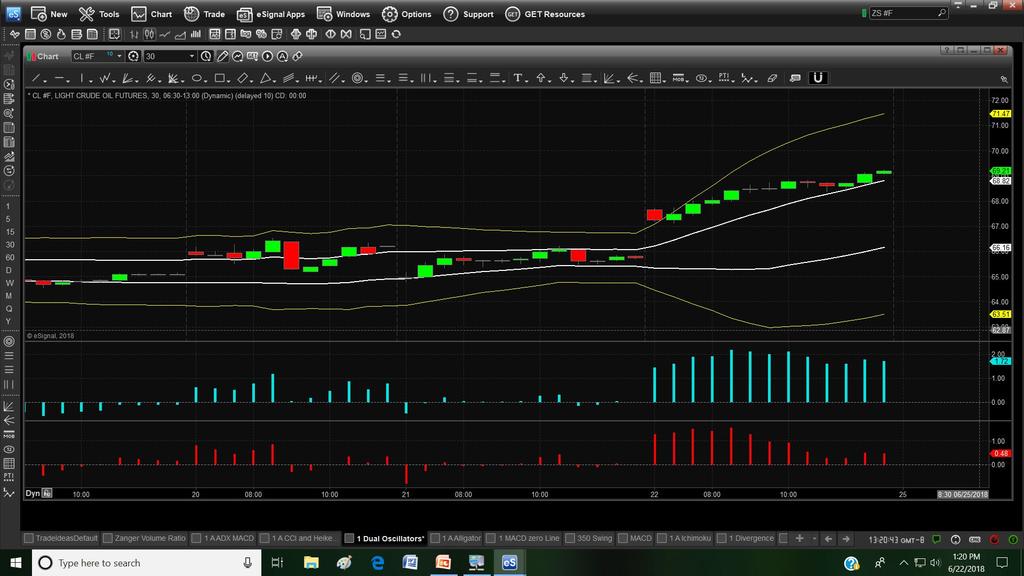
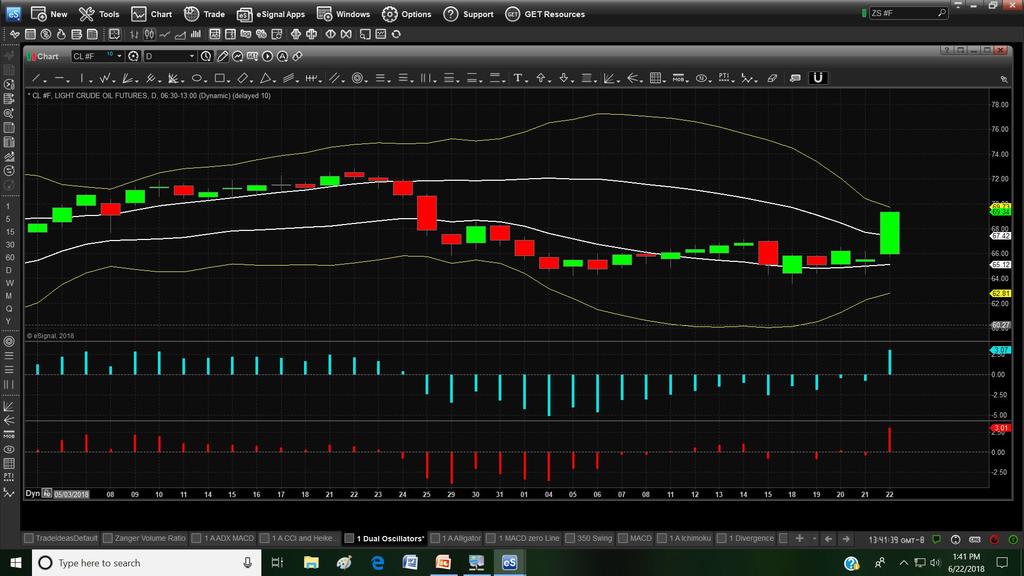
10 Adjust the Bollinger Bands
11 Standard Above/Below 20 MA Bollinger Bands Star Search Upper/Middle/Lower Channels

12 3 Channels Create a Neutral Middle Zone
13
14
15
16


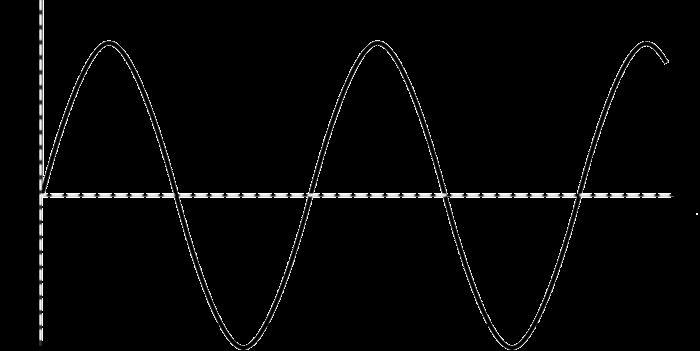
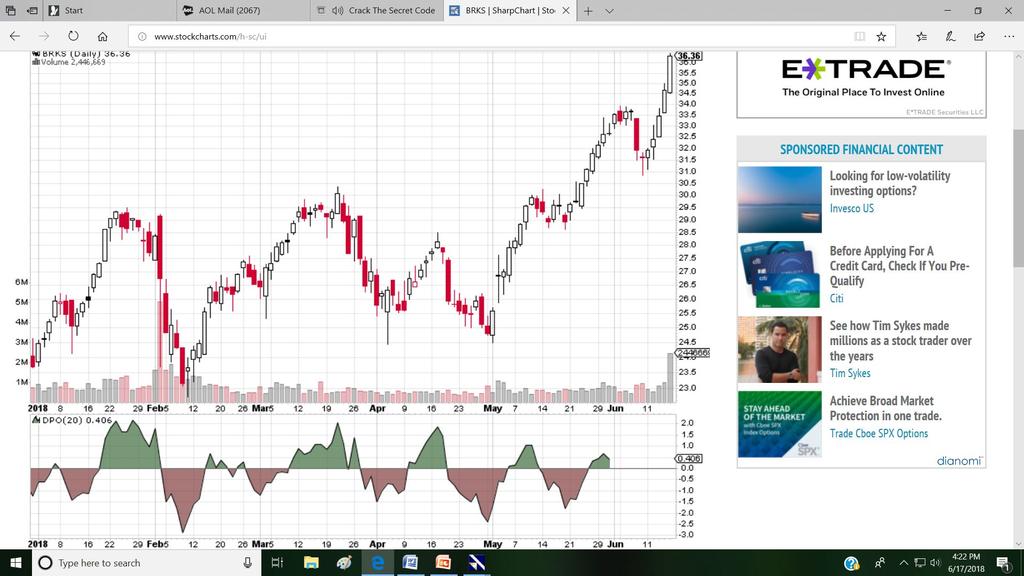
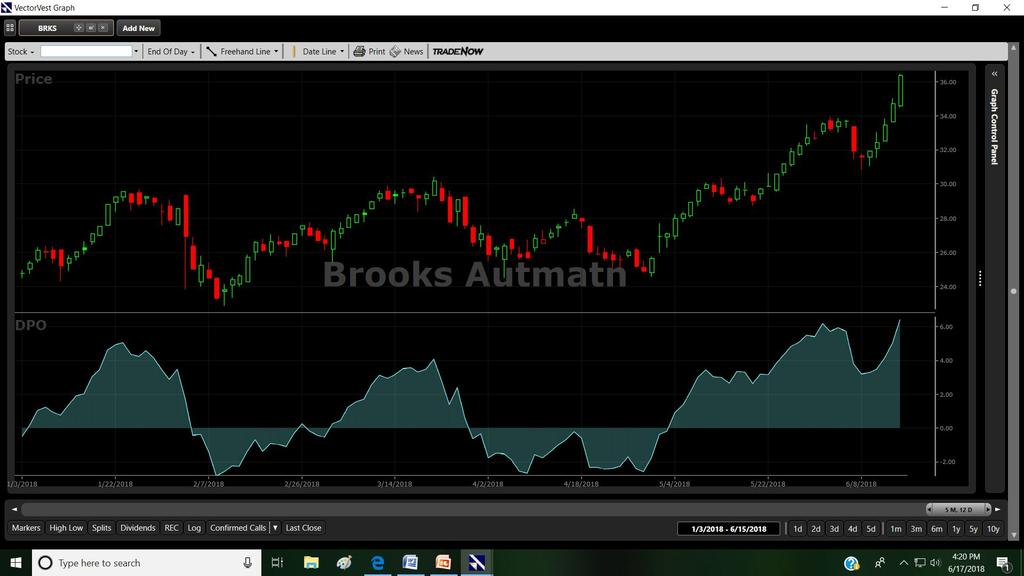
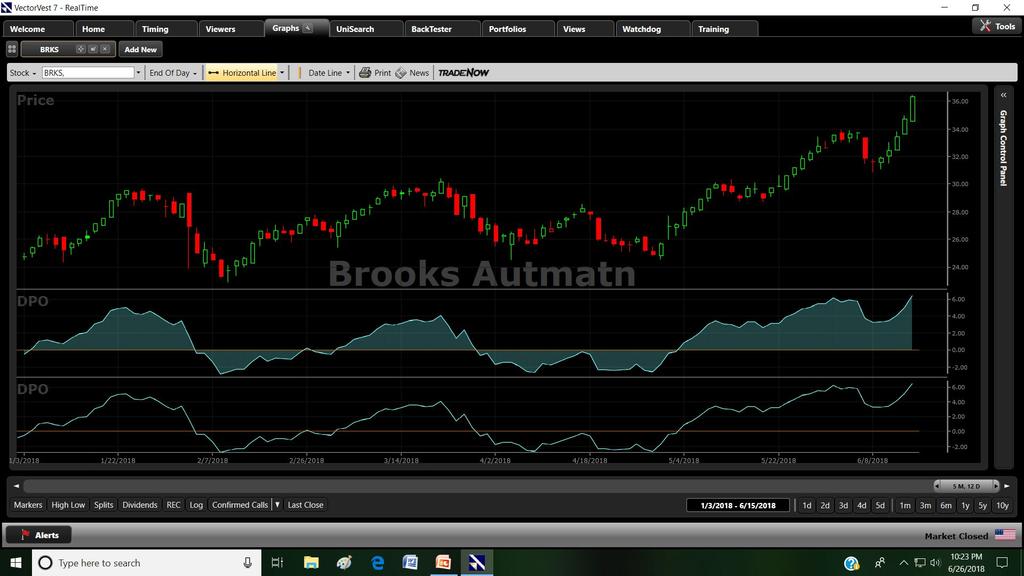
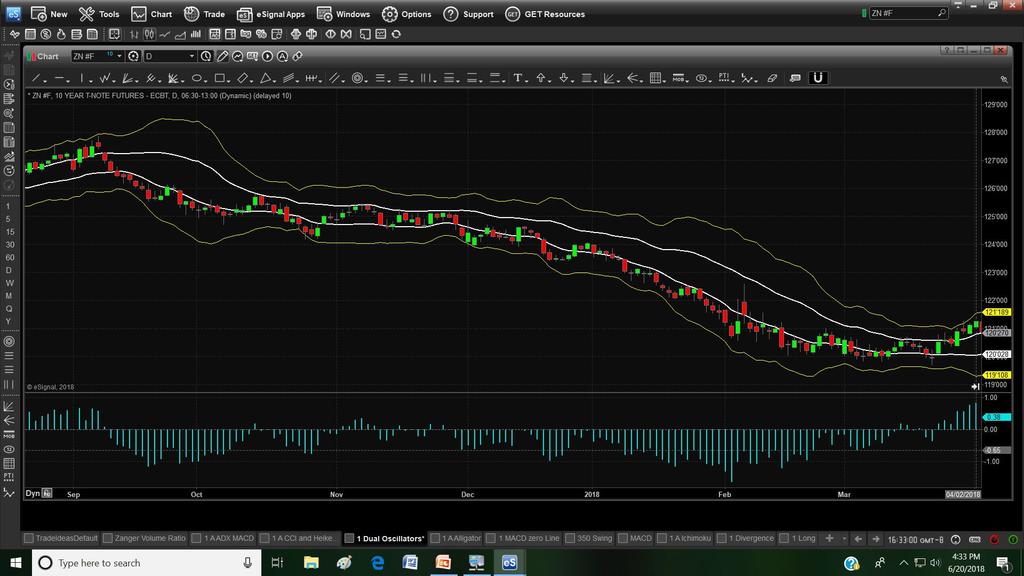
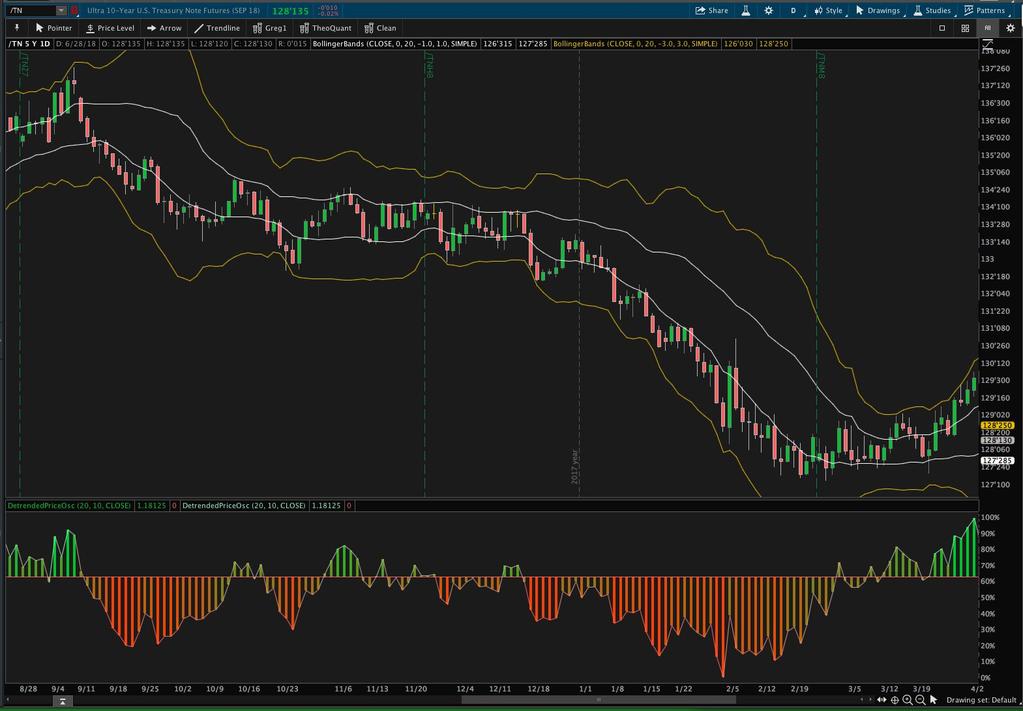
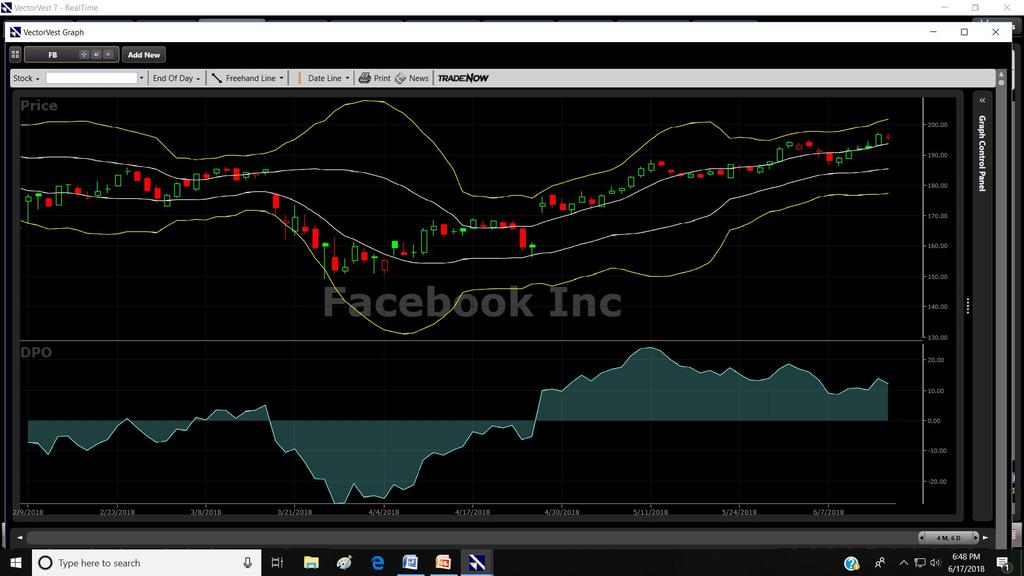
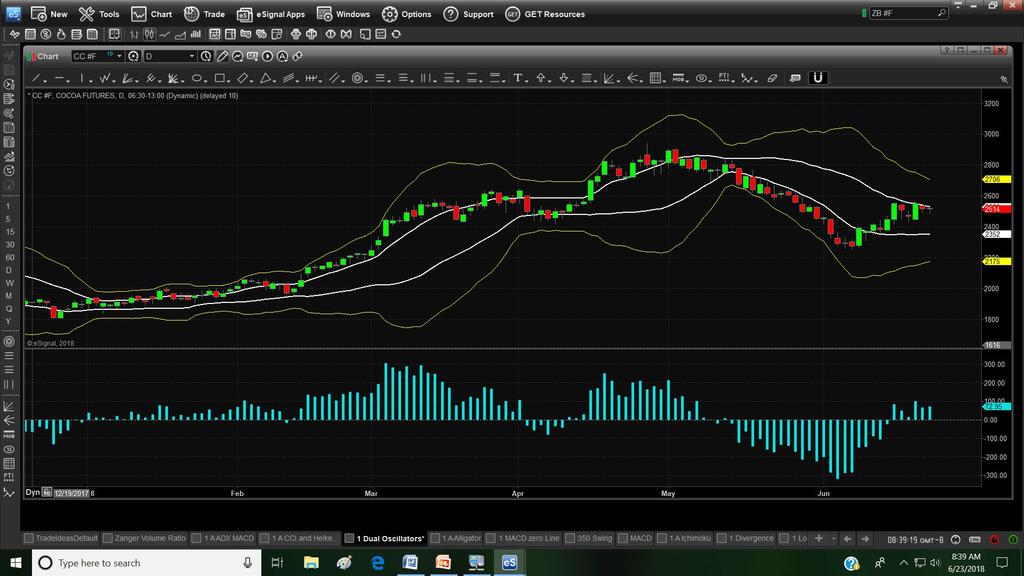
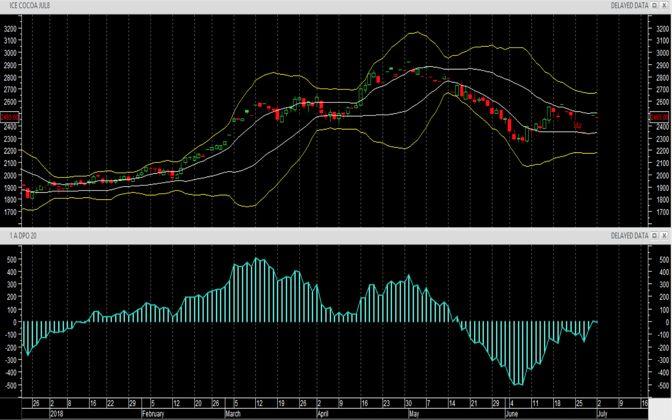
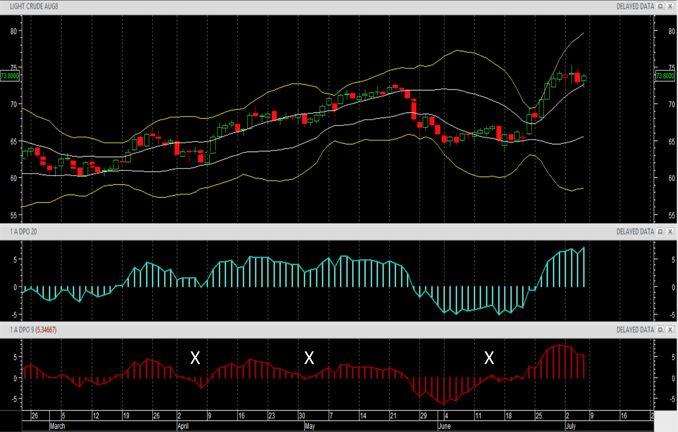
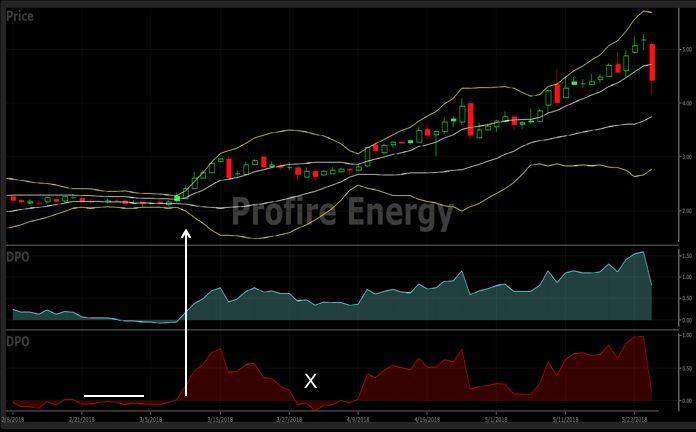
17 Detrended Price Oscillators
18

19
20

21

22


23
24
25
26
27
28
29
30
31


32
33 DPO 9 Functions Aggressive entry Trend Continuation Early Exit

34 Possible Scenarios

35 DPO 9 and DPO 20 In Sync
36
37
38
39
40
41

42
43
44
45
46
47


48
49 ThinkorSwim StarSearch Workspaces Star Search (any symbol):


50

51
MARKET INTERNALS. The Pulse of the Market
 MARKET MARKET INTERNALS INTERNALS The Pulse of the Market Market Internals Gonzalo Peres September 25, 2018 Disclaimer Disclaimer: Neither TradersMeetup.net nor its organizers, hosts or presenters are
Disclaimer. No Soliciting. No Recording. No Photography.
 TradersMeetup.net Disclaimer Disclaimer: Neither TradersMeetup.net nor its organizers, hosts or presenters are licensed financial advisors, registered investment advisors, registered broker-dealer nor
Trading Lessons from the Intraday Frame (study)
") 1 Daily "Idealized Trades" Report Trading Lessons from the Intraday Frame (study) 1 2018 TheoTrade LLC. All rights reserved. 2 Trading Lessons from the Intraday Frame (1-mi) 2 2018 TheoTrade LLC. All rights
1 Daily "Idealized Trades" Report Trading Lessons from the Intraday Frame (study) 1 2018 TheoTrade LLC. All rights reserved. 2 Trading Lessons from the Intraday Frame (1-mi) 2 2018 TheoTrade LLC. All rights
Trading Lessons from the Intraday Frame (study)
") 1 Daily "Idealized Trades" Report Trading Lessons from the Intraday Frame (study) 1 2018 TheoTrade LLC. All rights reserved. 2 Trading Lessons from the Intraday Frame (1-min) 2 2018 TheoTrade LLC. All
1 Daily "Idealized Trades" Report Trading Lessons from the Intraday Frame (study) 1 2018 TheoTrade LLC. All rights reserved. 2 Trading Lessons from the Intraday Frame (1-min) 2 2018 TheoTrade LLC. All
Technicals & Time Frame
 Advanced Charting Neither Better Trades or any of its personnel are registered broker-dealers or investment advisers. I will mention that I consider certain securities or positions to be good candidates
Trading Lessons from the Intraday Frame (study)
") 1 Daily "Idealized Trades" Report Trading Lessons from the Intraday Frame (study) 1 2018 TheoTrade LLC. All rights reserved. 2 Trading Lessons from the Intraday Frame (1-mi) 2 2018 TheoTrade LLC. All rights
1 Daily "Idealized Trades" Report Trading Lessons from the Intraday Frame (study) 1 2018 TheoTrade LLC. All rights reserved. 2 Trading Lessons from the Intraday Frame (1-mi) 2 2018 TheoTrade LLC. All rights
Discover Hidden Market Activity with Volume Profile
 Discover Hidden Market Activity with Volume Profile REFERENCE GUIDE BLAKE YOUNG Investools Instructor ACTIVE TRADER TRACK AUGUST 28-30, 2017 LAS VEGAS, NEVADA Investools Important Information The following
Chapter 2.3. Technical Analysis: Technical Indicators
 Chapter 2.3 Technical Analysis: Technical Indicators 0 TECHNICAL ANALYSIS: TECHNICAL INDICATORS Charts always have a story to tell. However, from time to time those charts may be speaking a language you
Shorting Options. Matt Howard 3/27/2018
 Shorting Options Matt Howard 3/27/2018 DISCLAIMER Disclaimer: Neither TradersMeetup.net nor any of its hosts, organizers, guests, presenters or other such representatives is, in such capacities, a licensed
Inter-market Technical Analysis for April 29, Summary Chart TheoTrade LLC. All rights reserved.
 1 Weekly Inter-market Technical Report Summary Chart 1 2018 TheoTrade LLC. All rights reserved. 2 Intraday Intermarket Volatility and even trend is back in our markets! The main movement recently came
Trading Lessons from the Intraday Frame (study)
") 1 Daily "Idealized Trades" Report Trading Lessons from the Intraday Frame (study) 1 2018 TheoTrade LLC. All rights reserved. 2 Trading Lessons from the Intraday Frame (1-mi) Major Companies Reporting Earnings
1 Daily "Idealized Trades" Report Trading Lessons from the Intraday Frame (study) 1 2018 TheoTrade LLC. All rights reserved. 2 Trading Lessons from the Intraday Frame (1-mi) Major Companies Reporting Earnings
Trading Lessons from the Intraday Frame (study)
") 1 Daily "Idealized Trades" Report Trading Lessons from the Intraday Frame (study) 1 2018 TheoTrade LLC. All rights reserved. 2 Trading Lessons from the Intraday Frame (1-mi) 2 2018 TheoTrade LLC. All rights
1 Daily "Idealized Trades" Report Trading Lessons from the Intraday Frame (study) 1 2018 TheoTrade LLC. All rights reserved. 2 Trading Lessons from the Intraday Frame (1-mi) 2 2018 TheoTrade LLC. All rights
Trading Lessons from the Intraday Frame (study)
") 1 Daily "Idealized Trades" Report Trading Lessons from the Intraday Frame (study) 1 2018 TheoTrade LLC. All rights reserved. 2 Trading Lessons from the Intraday Frame (1-min) 2 2018 TheoTrade LLC. All
1 Daily "Idealized Trades" Report Trading Lessons from the Intraday Frame (study) 1 2018 TheoTrade LLC. All rights reserved. 2 Trading Lessons from the Intraday Frame (1-min) 2 2018 TheoTrade LLC. All
Forex Sentiment Report Q2 FORECAST WEAK AS LONG AS BELOW April
 Forex Sentiment Report 08 April 2015 www.ads-securities.com Q2 FORECAST WEAK AS LONG AS BELOW 1.1200 Targets on a break of 1.1534/35: 1.1740/50 1.1870/75 1.2230/35 Targets on a break of 1.0580/70: 1.0160
Trading Lessons from the Intraday Frame (study)
") 1 Daily "Idealized Trades" Report Trading Lessons from the Intraday Frame (study) 1 2018 TheoTrade LLC. All rights reserved. 2 Trading Lessons from the Intraday Frame (1-min) 2 2018 TheoTrade LLC. All
1 Daily "Idealized Trades" Report Trading Lessons from the Intraday Frame (study) 1 2018 TheoTrade LLC. All rights reserved. 2 Trading Lessons from the Intraday Frame (1-min) 2 2018 TheoTrade LLC. All
Master Trader Joe Ross
 The purpose of the Trader's Trick Entry (TTE) is to get us into a trade prior to entry by most other traders. Trading is a business in which the more knowledgeable have the advantage over the less knowledgeable.
Divergence and Momentum Trading
 presented by Thomas Wood MicroQuant SM Divergence Trading Workshop Day One Divergence and Momentum Trading Risk Disclaimer Trading or investing carries a high level of risk, and is not suitable for all
Chapter 2.3. Technical Indicators
 1 Chapter 2.3 Technical Indicators 0 TECHNICAL ANALYSIS: TECHNICAL INDICATORS Charts always have a story to tell. However, sometimes those charts may be speaking a language you do not understand and you
1 P a g e. Executive Summary
 Executive Summary Over the past week we re-introduced some alternative counts, all of which bullish and some simple more bullish than others. The market keeps tracking them well; and we still can t eliminate
Monthly Dairy Technical Commentary August 19, 2015
 Monthly Dairy Technical Commentary August 19, 2015 CME Class III Milk Futures Range contraction continues for Class III Milk as it continues to correct the September 2014 through January 2015 downdraft.
Advance Certificate in Trading : A PROGRAM FOR SELF-INVESTORS
 Advance Certificate in Trading : A PROGRAM FOR SELF-INVESTORS [Stock Commodity-Forex] Duration: 4 Months Fee: 33,000 + Service Tax Training: Weekends / Weekdays Certifications: Certified Trader Certificate
Trading Lessons from the Intraday Frame (study)
") 1 Daily "Idealized Trades" Report Trading Lessons from the Intraday Frame (study) 1 2018 TheoTrade LLC. All rights reserved. 2 Trading Lessons from the Intraday Frame (1-mi) 2 2018 TheoTrade LLC. All rights
1 Daily "Idealized Trades" Report Trading Lessons from the Intraday Frame (study) 1 2018 TheoTrade LLC. All rights reserved. 2 Trading Lessons from the Intraday Frame (1-mi) 2 2018 TheoTrade LLC. All rights
Trading Platforms-Liquidity-White Label-Management Systems
 Trading Platforms-Liquidity-White Label-Management Systems WORLD CLASS TRADING PLATFORM PROVIDER Brokers Introducing Brokers Forex Training Schools Hedge Funds & Money Managers PROVIDING OPPORTUNITY INTRODUCTION
Technical Analysis Workshop Series. Session 11 Semester 2 Week 5 Oscillators Part 2
 Technical Analysis Workshop Series Session 11 Semester 2 Week 5 Oscillators Part 2 DISCLOSURES & DISCLAIMERS This research material has been prepared by NUS Invest. NUS Invest specifically prohibits the
1 P a g e. Executive Summary
 Executive Summary My call two weeks ago to revoke the major-3 top for the S&P500 based on OEW downtrend confirmations on several indices including the S&P500. was the correct thing today as I was then
Level I Learning Objectives by chapter
 Level I Learning Objectives by chapter 1. Introduction to the Evolution of Technical Analysis Describe the development of modern technical analysis Describe the origins of technical analysis 2. A New Age
C y c l e C a n d l e s T r a d i n g W o r k s h o p
 C y c l e C a n d l e s Trading Workshop Risk Disclaimer Trading or investing carries a high level of risk, and is not suitable for all persons. Before deciding to trade or invest you should carefully
ART OF TRADING. Master the
 Master the ART OF TRADING EXPERT TRAINING FROM TRADING MASTERS AND COACHING PROFESSIONALS From learning the basics to creating a trading plan, our programs will help you increase your knowledge and improve
Trading Lessons from the Intraday Frame (study)
") 1 Daily "Idealized Trades" Report Trading Lessons from the Intraday Frame (study) 1 2018 TheoTrade LLC. All rights reserved. 2 Trading Lessons from the Intraday Frame (1-min) 2 2018 TheoTrade LLC. All
1 Daily "Idealized Trades" Report Trading Lessons from the Intraday Frame (study) 1 2018 TheoTrade LLC. All rights reserved. 2 Trading Lessons from the Intraday Frame (1-min) 2 2018 TheoTrade LLC. All
Inter-market Technical Analysis for April 22, Summary Chart TheoTrade LLC. All rights reserved.
 1 Weekly Inter-market Technical Report Summary Chart 1 2018 TheoTrade LLC. All rights reserved. 2 Intraday Intermarket Volatility is returning to the markets, particularly with the collapse/sell-swing
Trading Lessons from the Intraday Frame (study)
") 1 Daily "Idealized Trades" Report Trading Lessons from the Intraday Frame (study) 1 2018 TheoTrade LLC. All rights reserved. 2 Trading Lessons from the Intraday Frame (1-mi) 2 2018 TheoTrade LLC. All rights
1 Daily "Idealized Trades" Report Trading Lessons from the Intraday Frame (study) 1 2018 TheoTrade LLC. All rights reserved. 2 Trading Lessons from the Intraday Frame (1-mi) 2 2018 TheoTrade LLC. All rights
1 P a g e. Executive Summary
 Executive Summary Last week I was looking for SPX2455-2475 and the S&P500 gave us SPX2454 on Monday and then started to pullback and consolidate causing for many pundits to already start top calling. Close
Trading Lessons from the Intraday Frame (study)
") 1 Daily "Idealized Trades" Report Trading Lessons from the Intraday Frame (study) 1 2018 TheoTrade LLC. All rights reserved. 2 Trading Lessons from the Intraday Frame (1-mi) 2 2018 TheoTrade LLC. All rights
1 Daily "Idealized Trades" Report Trading Lessons from the Intraday Frame (study) 1 2018 TheoTrade LLC. All rights reserved. 2 Trading Lessons from the Intraday Frame (1-mi) 2 2018 TheoTrade LLC. All rights
TRADE PLANNING WITH SIMPLE SUPPORT & RESISTANCE. Presented by Nabil Mattar FX Technical Analyst
 TRADE PLANNING WITH SIMPLE SUPPORT & RESISTANCE Presented by Nabil Mattar FX Technical Analyst 1 DISCLAIMER IG Asia Pte Ltd (Co. Reg. No. 20051002K) holds a capital markets services licence from the Monetary
Premium: Buying Butterfly Spreads
 In Part 3 of our "Premium" series,* we test butterfly spreads to see how this low probability / high profit-potential strategy performs over many occurrences. * Market Measure, Premium: Why Selling it
Using Oscillators & Indicators Properly May 7, Clarify, Simplify & Multiply
 Using Oscillators & Indicators Properly May 7, 2016 Clarify, Simplify & Multiply Disclaimer U.S. Government Required Disclaimer Commodity Futures Trading Commission Futures and Options trading has large
MTF Volatility Squeeze Version 6.0
 MTF Volatility Squeeze Version 6.0 Description: The Multiple Time Frame Volatility Squeeze (MTFVS) indicator shows when there is a reduction in volatility that usually means that consolidation is occurring.
Stay on the Right Side & Finishing the Year Strong! From the Active Trend Trader
 Stay on the Right Side & Finishing the Year Strong! From the Active Trend Trader Disclaimer U.S. GOVERNMENT REQUIRED DISCLAIMER COMMODITY FUTURES TRADING COMMISSION FUTURES AND OPTIONS TRADING HAS LARGE
Technical Analysis for Options Trading. Fidelity Brokerage Services LLC, Member NYSE, SIPC, 900 Salem Street, Smithfield, RI
 Technical Analysis for Options Trading Fidelity Brokerage Services LLC, Member NYSE, SIPC, 900 Salem Street, Smithfield, RI 02917 747561.2.0 Disclosures Options trading entails significant risk and is
Adding longs in the SPX zone will be well-rewarded longer term we believe.
 Executive Summary Last week we found, based on our analyses of the charts: Our SPX2146-2069 target zone remains and can now be narrowed down to SPX2117-2069, as the S&P500 closed at SPX2128 yesterday,
INTERMEDIATE EDUCATION GUIDE
 INTERMEDIATE EDUCATION GUIDE CONTENTS Key Chart Patterns That Every Trader Needs To Know Continution Patterns Reversal Patterns Statistical Indicators Support And Resistance Fibonacci Retracement Moving
MTF Volatility Squeeze Version 4.0
 MTF Volatility Squeeze Version 4.0 Description: The Multiple Time Frame Volatility Squeeze (MTFVS) indicator shows when there is a reduction in volatility that usually means that consolidation is occurring.
McDowell s Special Market Report Using the TradersCoach.com Software Tools
 McDowell s Special Market Report Using the TradersCoach.com Software Tools JULY 2018: Welcome to this month s Market Report! This written report is going to forecast the Dow Jones Industrial Average (hereafter
TD AMERITRADE Technical Analysis Night School Week 2
 TD AMERITRADE Technical Analysis Night School Week 2 Hosted By Derek Moore Director, National Education For the audio portion of today s webcast, please enable your computer speakers. Past performance
1 P a g e. Executive Summary
 Executive Summary Our standard sub division (SSD) Elliot Wave count for the S&P500 continues to track the market well, and we ll keep it as is until the market will tell us different. We continue to expect
Expert Trend Locator. The Need for XTL. The Theory Behind XTL
 Chapter 20 C H A P T E R 20 The Need for XTL esignal does an excellent job in identifying Elliott Wave counts. When combined with studies such as the Profit Taking Index, Wave Four Channels, Trend Channels
Technical Analysis Basics. Identifying Tops
 Technical Analysis Basics. Identifying Tops June 2011 1 Sign Up Now to Upshots forex trade signals disclaimer The information provided in this report is for educational purposes only. It is not a recommendation
1 P a g e. Executive Summary
 Executive Summary We can keep the executive summary very simple, and repeat what we said last week: A break below SPX2405 is now needed to put the Bull-count in jeopardy. Until then we have to look up,
Understanding Oscillators & Indicators March 4, Clarify, Simplify & Multiply
 Understanding Oscillators & Indicators March 4, 2015 Clarify, Simplify & Multiply Disclaimer U.S. Government Required Disclaimer Commodity Futures Trading Commission Futures and Options trading has large
RISK DISCLOSURE STATEMENT / DISCLAIMER AGREEMENT
 RISK DISCLOSURE STATEMENT / DISCLAIMER AGREEMENT Trading any financial market involves risk. This report and all and any of its contents are neither a solicitation nor an offer to Buy/Sell any financial
Table of Contents. Risk Disclosure. Things we will be going over. 2 Most Common Chart Layouts Anatomy of a candlestick.
 Table of Contents Risk Disclosure Things we will be going over 2 Most Common Chart Layouts Anatomy of a candlestick Candlestick chart Anatomy of a BAR PLOT Indicators Trend-Lines Volume MACD RSI The Stochastic
COMMODITIES CORNER. Gold steadies above 5-week lows as market rally pauses. Synopsis
 COMMODITIES CORNER March 06, 2019 Synopsis Gold (Play the Range) US$1,300 US$1,290 US$1,280 US$1,270 Silver (Play the Range) US$15.50 US$15.30 US$15.00 US$14.80 WTI (Play the Range) US$57.30 US$56.30 US$55.30
COMMODITIES CORNER. Oil prices rise on lower U.S. crude inventories, looming Iran sanctions. Synopsis Gold (Play the Range) 2nd Resistance
 2nd Resistance") COMMODITIES CORNER September 12, 2018 Synopsis Gold (Play the Range) US$1,210 US$1,200 US$1,190 US$1,185 Silver (Play the Range) US$14.60 US$14.40 US$14.00 US$13.80 WTI (Play the Range) US$71.40 US$70.20
COMMODITIES CORNER September 12, 2018 Synopsis Gold (Play the Range) US$1,210 US$1,200 US$1,190 US$1,185 Silver (Play the Range) US$14.60 US$14.40 US$14.00 US$13.80 WTI (Play the Range) US$71.40 US$70.20
presented by Thomas Wood MicroQuant SM Divergence Trading Workshop Day One Naked Trading Part 2
 presented by Thomas Wood MicroQuant SM Divergence Trading Workshop Day One Naked Trading Part 2 Risk Disclaimer Trading or investing carries a high level of risk, and is not suitable for all persons. Before
Technical Analysis. Dealing Room Peter Leonidou. Peter Leonidou
 Technical Analysis Dealing Room Questions Traders Should Ask What is the trend? What is the pivot point? What is the support levels? What is the resistance levels? Strong or weaker USD? What 1. Trade
Stacking Indicators Getting a GREAT entry! TWEEZERS Tweezer top/bottom at the band The stock is trending up Gap down (against the trend) Any moving
 Any moving") Dean Storholt I am not a registered broker-dealer or investment adviser. I will mention that I consider certain securities or positions to be good candidates for the types of strategies we are discussing
Dean Storholt I am not a registered broker-dealer or investment adviser. I will mention that I consider certain securities or positions to be good candidates for the types of strategies we are discussing
- My 4 Favorite Trades - Essential Trades of a Professional Trader
 presented by Thomas Wood MicroQuant SM Divergence Trading Workshop Day One - My 4 Favorite Trades - Essential Trades of a Professional Trader Risk Disclaimer Trading or investing carries a high level of
Morning Trading Comments
 Wednesday, June 13, 2018 1 Morning Trading Comments SUMMARY OF TRADING VIEWS The S&P 500 index is now close to the 2800 area, a potential important resistance zone. It will be interesting to see how this
The Art & Science of Active Trend Trading
 CONNECTING THE DOTS Candlesticks & Convergence of Clues The Art & Science of Active Trend Trading Copyright ATTS 2007-2015 1 Dennis W. Wilborn, P.E. Founder, President Active Trend Trading dww@activetrendtrading.com
Stacking Indicators Getting a GREAT entry! TWEEZERS Tweezer top/bottom at the band The stock is trending up Gap down (against the trend) Any moving
 Any moving") Dean Storholt I am not a registered broker-dealer or investment adviser. I will mention that I consider certain securities or positions to be good candidates for the types of strategies we are discussing
Dean Storholt I am not a registered broker-dealer or investment adviser. I will mention that I consider certain securities or positions to be good candidates for the types of strategies we are discussing
COMMODITIES CORNER. Gold set for biggest weekly loss since August as dollar weighs. Synopsis Gold (Play the Range) 2nd Resistance
 2nd Resistance") COMMODITIES CORNER Synopsis Gold (Play the Range) US$1,230 US$1,225 US$1,215 US$1,210 Silver (Play the Range) US$14.70 US$14.60 US$14.30 US$14.20 WTI (Play the Range) US$61.80 US$60.80 US$58.30 US$57.00
COMMODITIES CORNER Synopsis Gold (Play the Range) US$1,230 US$1,225 US$1,215 US$1,210 Silver (Play the Range) US$14.70 US$14.60 US$14.30 US$14.20 WTI (Play the Range) US$61.80 US$60.80 US$58.30 US$57.00
TECHNICAL INDICATORS
 TECHNICAL INDICATORS WHY USE INDICATORS? Technical analysis is concerned only with price Technical analysis is grounded in the use and analysis of graphs/charts Based on several key assumptions: Price
Trading Lessons from the Intraday Frame (study)
") 1 Daily "Idealized Trades" Report Trading Lessons from the Intraday Frame (study) 1 2018 TheoTrade LLC. All rights reserved. 2 Trading Lessons from the Intraday Frame (1-mi) 2 2018 TheoTrade LLC. All rights
1 Daily "Idealized Trades" Report Trading Lessons from the Intraday Frame (study) 1 2018 TheoTrade LLC. All rights reserved. 2 Trading Lessons from the Intraday Frame (1-mi) 2 2018 TheoTrade LLC. All rights
BY JIM PRINCE
 No part of this publication may be reproduced, stored in a retrieval system, or transmitted in any form or by any means electronic, mechanical, photocopying, recording, or otherwise without the prior permission
Proprietary Indicators and Market Timing Webinar Agenda
 Proprietary Indicators and Market Timing Webinar Agenda Saturday, September 26 th, 2009 1200 CDT Our Game Plan Today Housekeeping Remarks Indicators Set Market Timing How to best use Twitter Our Proprietary
Strategic Trade Management. A Comprehensive Trading Plan for Managing Risk in Option Trading
 Strategic Trade Management A Comprehensive Trading Plan for Managing Risk in Option Trading 1 Neither Better Trades or any of its personnel are registered broker-dealers or investment advisers. I will
COMMODITIES CORNER. Oil prices rebound slightly after heavy declines over trade dispute. Synopsis Gold (Play the Range) 2nd Resistance
 2nd Resistance") COMMODITIES CORNER Synopsis Gold (Play the Range) US$1,235 US$1,225 US$1,210 US$1,205 Silver (Play the Range) US$15.70 US$15.50 US$15.20 US$14.90 WTI (Play the Range) US$69.40 US$68.10 US$66.40 US$65.50
COMMODITIES CORNER Synopsis Gold (Play the Range) US$1,235 US$1,225 US$1,210 US$1,205 Silver (Play the Range) US$15.70 US$15.50 US$15.20 US$14.90 WTI (Play the Range) US$69.40 US$68.10 US$66.40 US$65.50
Options Volume and Open Interest Indicators
 Options Volume and Open Interest Indicators Usage Notes February 2015 This suite of six indicators is designed to monitor volume and open interest in options, issue by issue. Many traders want to monitor,
Copyright 2017 TheoTrade, LLC. All Rights Reserved WHAT REALLY DRIVES MARKETS DON KAUFMAN
 1 WHAT REALLY DRIVES MARKETS DON KAUFMAN 2 Risk Disclosure We Are Not Financial Advisors or a Broker/Dealer: Neither TheoTrade nor any of its officers, employees, representaaves, agents, or independent
The Launchpad Strategy
 presented by Thomas Wood MicroQuant SM Divergence Trading Workshop Day One The Launchpad Strategy Risk Disclaimer Trading or investing carries a high level of risk, and is not suitable for all persons.
Welcome to TONI TURNER S TRADING SCHOOL. Series
 Welcome to TONI TURNER S TRADING SCHOOL Series Disclaimer This seminar, How to Read Charts: Five Easy Steps to Chart Analysis, was prepared for educational purposes only. Its contents do not recommend,
C O D I N G T R A D E R. C O M. Stock Sweeper Manual. Version 1.00
 C O D I N G T R A D E R. C O M Stock Sweeper Manual Version 1.00 Table of Contents What is Stock Sweeper?... 2 Scanning Algorithms... 4 Installation... 9 Application Layout... 10 How to use Stock Sweeper...
COMMODITIES CORNER. Gold inches up as retreat of bond yields weigh on dollar. Synopsis Gold (Play the Range) 2nd Resistance
 2nd Resistance") COMMODITIES CORNER October 10, 2018 Synopsis Gold (Play the Range) US$1,200 US$1,195 US$1,185 US$1,180 Silver (Play the Range) US$14.80 US$14.60 US$14.30 US$14.10 WTI (Play the Range) US$75.90 US$74.90
COMMODITIES CORNER October 10, 2018 Synopsis Gold (Play the Range) US$1,200 US$1,195 US$1,185 US$1,180 Silver (Play the Range) US$14.80 US$14.60 US$14.30 US$14.10 WTI (Play the Range) US$75.90 US$74.90
The Art & Science of Active Trend Trading
 CONNECTING THE DOTS Candlesticks & Convergence of Clues The Art & Science of Active Trend Trading Copywrite ATTS 2007-2015 1 Dennis W. Wilborn, P.E. Founder, President Active Trend Trading dww@activetrendtrading.com
4 Keys to Trend Trading Tech Analysis. There is no Holy Grail of Trading Only Tools & Rules
 4 Keys to Trend Trading Tech Analysis There is no Holy Grail of Trading Only Tools & Rules Disclaimer U.S. GOVERNMENT REQUIRED DISCLAIMER COMMODITY FUTURES TRADING COMMISSION FUTURES AND OPTIONS TRADING
CURRENCY GETTING STARTED IN TRADING INCLUDES COMPANION WEB SITE WINNING IN TODAY S FOREX MARKET MICHAEL DUANE ARCHER
 GETTING STARTED IN CURRENCY TRADING INCLUDES COMPANION WEB SITE WINNING IN TODAY S FOREX MARKET T H I R D E D I T I O N MICHAEL DUANE ARCHER Getting Started in CURRENCY TRADING T H I R D E D I T I O N
Intra-Day Trading Techniques
 Pristine.com Presents Intra-Day Trading Techniques With Greg Capra Co-Founder of Pristine.com, and Co-Author of the best selling book, Tools and Tactics for the Master Day Trader Copyright 2001, Pristine
Williams Percent Range
 Williams Percent Range (Williams %R or %R) By Marcille Grapa www.surefiretradingchallenge.com RISK DISCLOSURE STATEMENT / DISCLAIMER AGREEMENT Trading any financial market involves risk. This report and
Go No Go Indicators: Part 2
 Go No Go Indicators: Part 2 March 22, 2017 Dennis W. Wilborn Active Trend Trading Disclaimer U.S. Government Required Disclaimer Commodity Futures Trading Commission Futures and Options trading has large
Monthly Dairy Technical Commentary Thursday September 5, 2013
 Monthly Dairy Technical Commentary Thursday September 5, 2013 CME Class III Milk Futures The weekly price trend for Class III Milk points down from its August 2011 high, and the latest breakdown below
Jumpstart your Career in financial markets with ICSM specialized courses!
 Jumpstart your Career in financial markets with ICSM specialized courses! Greetings from ICSM Institute of Career In Stock Market!! Institute Of Career In stock Market is the pioneer and market leader
COMMODITIES CORNER. Dollar hits another 13-month peak on continuing concerns over Turkey. Synopsis Gold (Play the Range) 2nd Resistance
 2nd Resistance") COMMODITIES CORNER August 15, 2018 Synopsis Gold (Play the Range) US$1,205 US$1,195 US$1,180 US$1,172 Silver (Play the Range) US$15.20 US$15.00 US$14.80 US$14.60 WTI (Play the Range) US$69.40 US$68.10
COMMODITIES CORNER August 15, 2018 Synopsis Gold (Play the Range) US$1,205 US$1,195 US$1,180 US$1,172 Silver (Play the Range) US$15.20 US$15.00 US$14.80 US$14.60 WTI (Play the Range) US$69.40 US$68.10
COMMODITIES CORNER. Gold rises as dollar slips, set for first weekly gain in three. Synopsis
 COMMODITIES CORNER April 12, 2019 Synopsis Gold (Play the Range) US$1,310 US$1,300 US$1,290 US$1,280 Silver (Play the Range) US$15.50 US$15.20 US$14.90 US$14.80 WTI (Play the Range) US$65.50 US$64.50 US$62.50
We have 3 timing/cycles (our Fib-timed trading intervals, Bradley Turn dates, and Gann dates) pointing to a turn around mid-march.
 pointing to a turn around mid-march.") Executive Summary The market reached the lower end of our preferred SPX2350-2370 target zone, without breaking below SPX2352, the past week, and then reversed with a 22p rally off the SPX2354.54 low made
Executive Summary The market reached the lower end of our preferred SPX2350-2370 target zone, without breaking below SPX2352, the past week, and then reversed with a 22p rally off the SPX2354.54 low made
Technical Indicators that Really Work
 Technical Indicators that Really Work TECHNICAL INDICATORS Technical indicators have become more important than Fundamentals. With the proper use of technical indicators investors are able to determine
TRADING VIEW: A Break and close below support.7600c would be the catalyst to looking for short trade opportunities in the sessions ahead.
 06 April 2018 S&P 500 A 5 wave decline can be counted on the daily chart from the 2807.25 high of March to the low of 2552. This is the first indication that a trading low may be in place. Confidence that
Release Notes. November 2014
 Release Notes November 2014 Trade & Orders Options Account Management Chart General Trade Armor Options o New tab with ability to view and trade single leg and select multi-leg options. o Upcoming earnings
An informative reference for John Carter's commonly used trading indicators.
 An informative reference for John Carter's commonly used trading indicators. At Simpler Options Stocks you will see a handful of proprietary indicators on John Carter s charts. This purpose of this guide
QUESTION: What is the ONE thing every trader and investor is looking for? ANSWER: Financial Gains
 QUESTION: What is the ONE thing every trader and investor is looking for? ANSWER: Financial Gains Introduction With over 22 years of Trading, Investing and Trading Education experience (as of writing this)
COMMODITIES CORNER. Gold falls to 1-week low on stronger dollar, but holds above $1,300 level. Synopsis
 COMMODITIES CORNER February 07, 2019 Synopsis Gold (Play the Range) US$1,320 US$1,310 US$1,300 US$1,295 Silver (Play the Range) US$16.20 US$16.00 US$15.60 US$15.50 WTI (Play the Range) US$56.60 US$55.60
Symmetry target: 24000
 Flat/consolidation day for the S&P and NAS, whereas the DJIA continued its relentless Bull run. Since the low made in February 2016 (22 months ago) the DJIA has gained 8000 points, of which the last 3100
FOREX PROFITABILITY CODE
 FOREX PROFITABILITY CODE Forex Secret Protocol Published by Old Tree Publishing CC Suite 509, Private Bag X503 Northway, 4065, KZN, ZA www.oldtreepublishing.com Copyright 2013 by Old Tree Publishing CC,
Maybank IB. Understanding technical analysis. by Lee Cheng Hooi. 24 September Slide 1 of Maybank-IB
 Maybank IB Understanding technical analysis 24 September 2011 by Lee Cheng Hooi Slide 1 of 40 Why technical analysis? 1) Market action discounts everything 2) Prices move in trends 3) History repeats itself
Schwab Investing Insights Trading Edition Text Close Window Size: November 15, 2007
 Schwab Investing Insights Trading Edition Text Close Window Size: from TheStreet.com November 15, 2007 ON TECHNIQUES Two Indicators Are Better Than One The Relative Strength Index works well but it s better
Research Desk StockBroking
 Research Desk StockBroking India ValueMax June 01, 2017 ValueMax Monthly Investment Ideas ValueMax helps clients to take a long stance on stocks from thes&pbse-100 universe. Comprising monthly technical
COPYRIGHTED MATERIAL. Index. P1:a/b P2:c/d QC:e/f T1:g ind JWBK244-Miner August 14, :52 Printer: Yet to come
 Index A AA. See American Airlines ABC (simple) correction, 58 64 followed by new lows, 61 guidelines, 60 momentum reversal, 81 price targets, 100 ABC zigzag, 58 Alternate price projection (APP) external,
US Dow Jones Index / US30Cash (DAILY CHART) System price target 15,660.00
 System price target 15,660.00") DAILY TECHNICAL US Dow Jones Index / US30Cash (DAILY CHART) System price target 15,660.00 Thursday, January 30, 2014 S1=15,660.00 Support R1=16,564.00 R2=16,048.00 ADX Signal Comment: Short positions for
DAILY TECHNICAL US Dow Jones Index / US30Cash (DAILY CHART) System price target 15,660.00 Thursday, January 30, 2014 S1=15,660.00 Support R1=16,564.00 R2=16,048.00 ADX Signal Comment: Short positions for
1 P a g e. Executive Summary
 Executive Summary In last week s update I set a first target of SPX2428 for the S&P500, which was reached on Thursday. I expected from there a 10-15p correction, but instead the market decided to target