TRADE PLANNING WITH SIMPLE SUPPORT & RESISTANCE. Presented by Nabil Mattar FX Technical Analyst
|
|
|
- Emerald Glenn
- 6 years ago
- Views:
Transcription


1 TRADE PLANNING WITH SIMPLE SUPPORT & RESISTANCE Presented by Nabil Mattar FX Technical Analyst 1
2 DISCLAIMER IG Asia Pte Ltd (Co. Reg. No K) holds a capital markets services licence from the Monetary Authority of Singapore for dealing in securities and leveraged foreign exchange trading and is an exempt financial adviser. It is also licensed by International Enterprise Singapore to trade CFDs on commodities. CFDs are leveraged products. CFD trading may not be suitable for everyone and can result in losses that exceed your initial investment, so please ensure that you fully understand the risks and costs involved by reading the Risk Disclosure Statement at Trading in CFDs may not be suitable for many members of the public. You should carefully consider whether such trading is appropriate for you in the light of your personal circumstances. In considering whether to trade, please be aware of the margin requirements, commissions, fees and other charges for which you will be liable. These charges will affect your net profit (if any) or increase your loss. IG provides an execution-only service. The information in this presentation is intended for general circulation. It does not take into account the specific investment objectives, financial situation or particular needs of any particular person. You should take into account your specific investment objectives, financial situation or particular needs before making a commitment to trade, including seeking advice from an independent financial adviser regarding the suitability of the investment, as you deem fit. IG accepts no responsibility for any use that may be made of this information and for any consequences that result. No representation or warranty is given as to the accuracy or completeness of the information. Consequently any person acting on it does so entirely at his or her own risk. This presentation must not be reproduced or further distributed. 2

3 WHY 3
4 Bullish Flag Breakout A B Consolidation BOXING the markets Let the CHARTS be your GUIDE 4
5 TAKEAWAYS OPEN YOUR EYES TO SUPPORT & RESISTANCE Experienced Traders (> 6 months) Lost in a myriad of indicators Indicator point UP BUY Indicator point DOWN - SELL Confused by news and direction New Traders No Trading Strategy Learning how to trade Unsure where to start Mucked around all the time Following a strategy with no success 5

6 TRADE PLANNING BE A DETECTIVE, STACK THE ODDS Crime Scene Investigation Thumbprints Physical Evidence DNA Vehicle Number Autopsy Source: 6
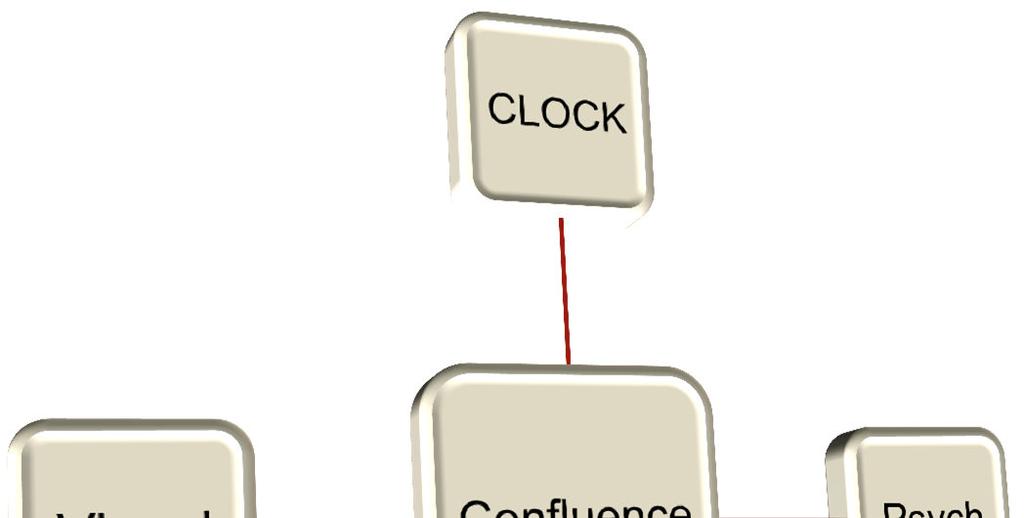
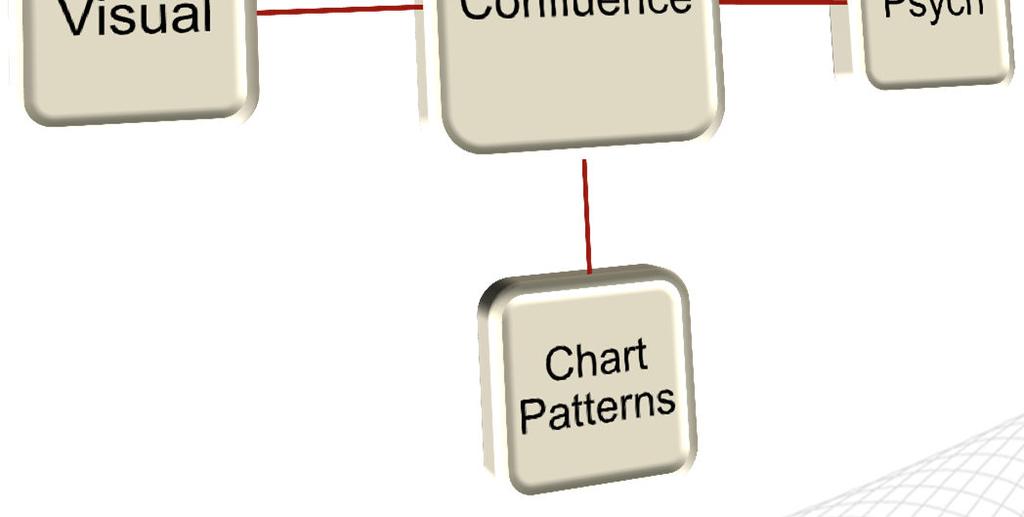
7 TRADE PLANNING BE A DETECTIVE, STACK THE ODDS Trade Planning 1) Establishing a BIAS 2) Finding out where the Buyers and Sellers are Primary Visual S&R Psychological Levels Trend Lines Chart Patterns CLOCK Multiple Time-Frame Analysis Price Action Secondary Pivot Points Fibonacci Levels Candlestick Patterns Divergence Moving Average Oscillators 7
8 TRADE PLANNING IF YOU FAIL TO PLAN, YOU PLAN TO FAIL Takes away the emotions attached to trading Provides guidance to where the market is going even after news releases Creates a systematic approach to trading Painting different scenarios in the market Creating a visual mental image of what might happen and acting accordingly BULLISH Look for Support to BUY Look for Resistance to EXIT BEARISH Look for Resistance to SELL Look for Support to EXIT 8
9 VISUAL & PSYCHOLOGICAL Look for whole numbers 00, 20, 50, 80 Previous failures and bounces Pay attention to shadows and body close of candles ROLE REVERSAL Always think of S&R levels as zones Look for a candle close above or below S&R levels before considering it broken Many times, they are simply market spikes Use multiple time-frames to confirm levels The higher the time-frame, the more respected the levels are A broken support can turn into resistance and vice versa 9
10 Trade Planning Looking for Confluence Why Confluence Works 10
11 11
12 TREND LINES Not a random drawing on the chart There are rules to follow when drawing a trend line Trend lines provide guidelines for price Can be a support/resistance Most of the time, trend lines are sloping The degree of the slope indicates trend strength Applicable to any chart time-frame 12
13 TREND LINE - UPTREND Look out for swing lows on the chart Connect the lows of the swings to form a straight line Lows and not the period close Trend Line must have at least 3 points of contact of the swing low Indicates bullish momentum, more buyers than sellers 13
14 14
15 TREND LINE - DOWNTREND Look out for swing highs on the charts Connect the highs of the swings to form a straight line Highs and not the period close Trend Line must have at least 3 points of contact of the swing high Indicates bearish momentum, more sellers than buyers 15
16 16
17 17
18 CHART PATTERNS Used to measure sentiment period of consolidation provides parameters to the market Detect continuation or reversal of trends Same rules on how we draw trend lines Most common ones: wedge, triangle, pennants, flags Applicable to any chart time-frame adjust trade plan base on time frame i.e. a consolidation on a daily chart might be a new trend on a H1 chart 18
19 Chart Patterns and Trend lines Autochartist Trading Central 19
20 Ascending Triangle 20
21 21
22 2 SIMPLE WAYS TO TRADE IT APPROACH RESISTANCE SUPPORT RESISTANCE RESISTANCE SUPPORT SUPPORT 22
23 2 SIMPLE WAYS TO TRADE IT BREAKOUT ROLE REVERSALS RESISTANCE RESISTANCE SUPPORT SUPPORT RESISTANCE SUPPORT RESISTANCE SUPPORT 23
24 24
25 CLOCK Source: 25
26 CLOCK Market = People Common Psychology and Behavioral Patterns We get hungry at the same time We sleep at the same time We get tired at the same time We all want to Buy low and Sell high Intra-day markets move with these normal human tendencies The CLOCK is a leading indicator that is often overlooked 26

27 CLOCK = London Open Session High/Low (Yellow Box) 27

28 CLOCK = London Open Session High/Low (Yellow Box) 28

29 CLOCK = London Open Session High/Low (Yellow Box) 29

30 CLOCK = London Open Session High/Low (Yellow Box) 30
31 BOXING THE MARKET - CONFLUENCE 31
32 32
 Rising")
 CLOCK -")
33 PUTTING IT ALL TOGETHER CONFLUENCE 1) Rising Trend line 2) Visual Support 3) CLOCK - London Open 33
 Psychological Resistance - 0.")
34 CONFLUENCE 1) Bearish Flag 2) Channel Breakout 3) Visual Resistance 4) Psychological Resistance ) CLOCK - London Open 34
35 Bullish Flag Breakout A B Consolidation 35
36 A 36
37 A B C 37
38 B 38
39 BOXING THE MARKETS 1) Draw your visual / psychological Support and Resistance Lines Be observant to areas of role reversals On candlestick charts, look for body closes and shadows 2) Analyse at least 2 time-frames above your execution chart Match time-frame to the type of trader YOU are Scalper 1min, 5min, 10min Intraday 15min, 1h, 4h Swing 1h, 4h, Daily Position 4h, Daily, Weekly 39
40 BOXING THE MARKETS 3) Look for chart patterns / trend lines Is it a Continuation or Reversal? Is it a Breakout or Consolidation? If you are not proficient yet, leverage on Autochartist, Trading Central There is NO substitute for SCREEN TIME 4) Look for CONFLUENCE areas Overlapping Areas of Support and Resistance STACK THE ODDS FOR YOU 40
41 BOXING THE MARKETS 5) What s your Bias? Bullish Support to BUY, Resistance to EXIT Bearish Resistance to SELL, Support to EXIT Neutral Consolidation. BUY at support, SELL at resistance 6) Create a Plan Include the CLOCK to refine entries and exits Paint different scenarios Execute with Confidence 41
42 THANK YOU To receive the presentation slides, please scan your barcode at the front of the seminar room our at the IG booth (#D05) 42
FOREX. analysing made easy. UNDERSTANDING TECHNICAL ANALYSIS An educational tool by Blackwell Global
 FOREX analysing made easy UNDERSTANDING TECHNICAL ANALYSIS An educational tool by Blackwell Global Risk Warning: Forex and CFDs are leveraged products and you may lose your initial deposit as well as substantial
INTERMEDIATE EDUCATION GUIDE
 INTERMEDIATE EDUCATION GUIDE CONTENTS Key Chart Patterns That Every Trader Needs To Know Continution Patterns Reversal Patterns Statistical Indicators Support And Resistance Fibonacci Retracement Moving
The Launchpad Strategy
 presented by Thomas Wood MicroQuant SM Divergence Trading Workshop Day One The Launchpad Strategy Risk Disclaimer Trading or investing carries a high level of risk, and is not suitable for all persons.
TRADE SIGNALS POWERED BY AUTOCHARTIST
 SAXO TRADER GO TRADE SIGNALS POWERED BY AUTOCHARTIST Trade Signals is a SaxoTraderGO tool that uses Autochartist technology to identify emerging and completed patterns in most leading financial markets.
The Strategies Working Best in Today s E-Mini Market
 The Strategies Working Best in Today s E-Mini Market Todd Mitchell Craig Hill Legal Disclaimer No claim is made by Trading Concepts, Inc. that the trading strategies shown here will result in profits and
TRADE SIGNALS POWERED BY AUTOCHARTIST
 SAXO TRADER GO TRADE SIGNALS POWERED BY AUTOCHARTIST Trade Signals is a SaxoTraderGO tool that uses Autochartist technology to identify emerging and completed patterns in most leading financial markets.
TRADE SIGNALS POWERED BY AUTOCHARTIST
 SAXO TRADER GO TRADE SIGNALS POWERED BY AUTOCHARTIST Trade Signals is a SaxoTraderGO tool that uses Autochartist technology to identify emerging and completed patterns in most leading financial markets.
Trading With Price Action Alone
 Trading With Price Action Alone The very premise of technical analysis, based on the efficient market hypothesis, is that all the information about a financial product or market is reflected in its price.
Welcome to TONI TURNER S TRADING SCHOOL. Series
 Welcome to TONI TURNER S TRADING SCHOOL Series Disclaimer This seminar, How to Read Charts: Five Easy Steps to Chart Analysis, was prepared for educational purposes only. Its contents do not recommend,
Monthly Dairy Technical Commentary August 19, 2015
 Monthly Dairy Technical Commentary August 19, 2015 CME Class III Milk Futures Range contraction continues for Class III Milk as it continues to correct the September 2014 through January 2015 downdraft.
Forex Sentiment Report Q2 FORECAST WEAK AS LONG AS BELOW April
 Forex Sentiment Report 08 April 2015 www.ads-securities.com Q2 FORECAST WEAK AS LONG AS BELOW 1.1200 Targets on a break of 1.1534/35: 1.1740/50 1.1870/75 1.2230/35 Targets on a break of 1.0580/70: 1.0160
INTRODUCTION CHAPTER 1
 INTRODUCTION CHAPTER 1 Autochartist offers traders automated market-scanning tools that highlight trade opportunities based on support and resistance levels. Autochartist products include: Chart pattern
Saudi Market (TADAWUL)... 2 Boursa Kuwait... 3 Abu Dhabi Exchange... 4 Dubai Financial Market... 5 Definitions... 6 Contacts... 7.
... 2 Boursa Kuwait... 3 Abu Dhabi Exchange... 4 Dubai Financial Market... 5 Definitions... 6 Contacts... 7.") QNBFS Technical Technical Spotlight Spotlight Thursday, Sunday, January January 14, 10, 2018 2019 Contents Saudi Market (TADAWUL)... 2 Boursa Kuwait... 3 Abu Dhabi Exchange... 4 Dubai Financial Market...
QNBFS Technical Technical Spotlight Spotlight Thursday, Sunday, January January 14, 10, 2018 2019 Contents Saudi Market (TADAWUL)... 2 Boursa Kuwait... 3 Abu Dhabi Exchange... 4 Dubai Financial Market...
Technical Analysis Workshop Series. Session Three
 Technical Analysis Workshop Series Session Three DISCLOSURES & DISCLAIMERS This research material has been prepared by NUS Invest. NUS Invest specifically prohibits the redistribution of this material
TRADE SIGNALS POWERED BY AUTOCHARTIST
 SAXO TRADER GO TRADE SIGNALS POWERED BY AUTOCHARTIST Trade Signals is a SaxoTraderGO tool that uses Autochartist technology to identify emerging and completed patterns in most leading financial markets.
1. Introduction 2. Chart Basics 3. Trend Lines 4. Indicators 5. Putting It All Together
 Technical Analysis: A Beginners Guide 1. Introduction 2. Chart Basics 3. Trend Lines 4. Indicators 5. Putting It All Together Disclaimer: Neither these presentations, nor anything on Twitter, Cryptoscores.org,
TRADE SIGNALS POWERED BY AUTOCHARTIST
 TRADE SIGNALS POWERED BY AUTOCHARTIST Trade Signals is a powerful tool available in BiGlobal Trade for identifying trading opportunities based on chart patterns using Autochartist technology. As an introduction
Chapter 2.3. Technical Analysis: Technical Indicators
 Chapter 2.3 Technical Analysis: Technical Indicators 0 TECHNICAL ANALYSIS: TECHNICAL INDICATORS Charts always have a story to tell. However, from time to time those charts may be speaking a language you
Saudi Market (TADAWUL)... 2 Boursa Kuwait... 3 Abu Dhabi Exchange... 4 Dubai Financial Market... 5 Definitions... 6 Contacts... 7.
... 2 Boursa Kuwait... 3 Abu Dhabi Exchange... 4 Dubai Financial Market... 5 Definitions... 6 Contacts... 7.") QNBFS Technical Technical Spotlight Spotlight Sunday, February January 14, 11, 2018 2018 Contents Saudi Market (TADAWUL)... 2 Boursa Kuwait... 3 Abu Dhabi Exchange... 4 Dubai Financial Market... 5 Definitions...
QNBFS Technical Technical Spotlight Spotlight Sunday, February January 14, 11, 2018 2018 Contents Saudi Market (TADAWUL)... 2 Boursa Kuwait... 3 Abu Dhabi Exchange... 4 Dubai Financial Market... 5 Definitions...
Methodology. Our team of analysts uses technical and chartist analysis to draw an opinion and make decisions. The preferred chartist elements are:
 Methodology Technical analysis is at the heart of TRADING CENTRAL's expertise. Our methodology is proven. Our chartist and quantitative approach allows us to intervene on different investment horizons.
Resistance to support
 1 2 2.3.3.1 Resistance to support In this example price is clearly consolidated and we can expect a breakout at some time in the future. This breakout could be short or it could be long. 3 2.3.3.1 Resistance
Autochartist User Manual
 Autochartist User Manual compliance@ifxbrokers.com www.ifxbrokers.com +27 42 293 0353 INTRODUCTION Chapter 1 Autochartist offers traders automated market-scanning tools that highlight trade opportunities
Technicals & Time Frame
 Advanced Charting Neither Better Trades or any of its personnel are registered broker-dealers or investment advisers. I will mention that I consider certain securities or positions to be good candidates
Saudi Market (TADAWUL)... 2 Boursa Kuwait... 3 Abu Dhabi Exchange... 4 Dubai Financial Market... 5 Definitions... 6 Contacts... 7.
... 2 Boursa Kuwait... 3 Abu Dhabi Exchange... 4 Dubai Financial Market... 5 Definitions... 6 Contacts... 7.") QNBFS Technical Technical Spotlight Spotlight Sunday, Monday, January April 16, 14, 2018 2018 Contents Saudi Market (TADAWUL)... 2 Boursa Kuwait... 3 Abu Dhabi Exchange... 4 Dubai Financial Market... 5
QNBFS Technical Technical Spotlight Spotlight Sunday, Monday, January April 16, 14, 2018 2018 Contents Saudi Market (TADAWUL)... 2 Boursa Kuwait... 3 Abu Dhabi Exchange... 4 Dubai Financial Market... 5
Saudi Market (TADAWUL)... 2 Boursa Kuwait... 3 Abu Dhabi Exchange... 4 Dubai Financial Market... 5 Definitions... 6 Contacts... 7.
... 2 Boursa Kuwait... 3 Abu Dhabi Exchange... 4 Dubai Financial Market... 5 Definitions... 6 Contacts... 7.") QNBFS Technical Technical Spotlight Spotlight Sunday, Thursday, January May 31, 14, 2018 2018 Contents Saudi Market (TADAWUL)... 2 Boursa Kuwait... 3 Abu Dhabi Exchange... 4 Dubai Financial Market... 5
QNBFS Technical Technical Spotlight Spotlight Sunday, Thursday, January May 31, 14, 2018 2018 Contents Saudi Market (TADAWUL)... 2 Boursa Kuwait... 3 Abu Dhabi Exchange... 4 Dubai Financial Market... 5
Contents. Related Links. QNBFS Home Page QNBFS Trading Portal QNBFS Research Page
 QNBFS Technical Technical Spotlight Spotlight Sunday, Sunday, September January 14, 16, 2018 2018 Contents Saudi Market (TADAWUL)... 2 Boursa Kuwait... 3 Abu Dhabi Exchange... 4 Dubai Financial Market...
Level I Learning Objectives by chapter
 Level I Learning Objectives by chapter 1. Introduction to the Evolution of Technical Analysis Describe the development of modern technical analysis Describe the origins of technical analysis 2. A New Age
Learning Objectives CMT Level I
 Learning Objectives CMT Level I - 2018 An Introduction to Technical Analysis Section I: Chart Development and Analysis Chapter 1 The Basic Principle of Technical Analysis - The Trend Define what is meant
Technical Analysis Workshop Series. Session 11 Semester 2 Week 5 Oscillators Part 2
 Technical Analysis Workshop Series Session 11 Semester 2 Week 5 Oscillators Part 2 DISCLOSURES & DISCLAIMERS This research material has been prepared by NUS Invest. NUS Invest specifically prohibits the
Introduction. Technicians (also known as quantitative analysts or chartists) usually look at price, volume and psychological indicators over time.
 usually look at price, volume and psychological indicators over time.") Technical Analysis Introduction Technical Analysis is the study of market action, primarily through the use of charts, for the purpose of forecasting future price trends. Technicians (also known as quantitative
Technical Analysis Introduction Technical Analysis is the study of market action, primarily through the use of charts, for the purpose of forecasting future price trends. Technicians (also known as quantitative
Saudi Market (TADAWUL)... 2 Boursa Kuwait... 3 Abu Dhabi Exchange... 4 Dubai Financial Market... 5 Definitions... 6 Contacts... 7.
... 2 Boursa Kuwait... 3 Abu Dhabi Exchange... 4 Dubai Financial Market... 5 Definitions... 6 Contacts... 7.") QNBFS Technical Technical Spotlight Spotlight Monday, Sunday, February January 14, 05, 2018 2018 Contents Saudi Market (TADAWUL)... 2 Boursa Kuwait... 3 Abu Dhabi Exchange... 4 Dubai Financial Market...
QNBFS Technical Technical Spotlight Spotlight Monday, Sunday, February January 14, 05, 2018 2018 Contents Saudi Market (TADAWUL)... 2 Boursa Kuwait... 3 Abu Dhabi Exchange... 4 Dubai Financial Market...
Contents. Related Links. QNBFS Home Page QNBFS Trading Portal QNBFS Research Page
 QNBFS Technical Technical Spotlight Spotlight Wednesday, Sunday, January October 14, 31, 2018 2018 Contents Saudi Market (TADAWUL)... 2 Boursa Kuwait... 3 Abu Dhabi Exchange... 4 Dubai Financial Market...
Inter-market Technical Analysis for April 22, Summary Chart TheoTrade LLC. All rights reserved.
 1 Weekly Inter-market Technical Report Summary Chart 1 2018 TheoTrade LLC. All rights reserved. 2 Intraday Intermarket Volatility is returning to the markets, particularly with the collapse/sell-swing
Contents. Related Links. QNBFS Home Page QNBFS Trading Portal QNBFS Research Page
 QNBFS Technical Technical Spotlight Spotlight Wednesday, Sunday, January July 14, 04, 2018 Contents Saudi Market (TADAWUL)... 2 Boursa Kuwait... 3 Abu Dhabi Exchange... 4 Dubai Financial Market... 5 Definitions...
Technical Analysis Workshop Series. Session Two
 Technical Analysis Workshop eries ession Two DICLOURE & DICLAIMER This research material has been prepared by NU Invest. NU Invest specifically prohibits the redistribution of this material in whole or
Introduction. Technical analysis is the attempt to forecast stock prices on the basis of market-derived data.
 Technical Analysis Introduction Technical analysis is the attempt to forecast stock prices on the basis of market-derived data. Technicians (also known as quantitative analysts or chartists) usually look
Class 6: Trading the Lanes (In-depth Line Drawing and Charting) Review of Class So Far
 Review of Class So Far") Today s Class Class 6: Trading the Lanes (In-depth Line Drawing and Charting) Review of class so far Where we are going from here More in-depth technical analysis Trading with brackets (neutral trading)
Today s Class Class 6: Trading the Lanes (In-depth Line Drawing and Charting) Review of class so far Where we are going from here More in-depth technical analysis Trading with brackets (neutral trading)
C O D I N G T R A D E R. C O M. Stock Sweeper Manual. Version 1.00
 C O D I N G T R A D E R. C O M Stock Sweeper Manual Version 1.00 Table of Contents What is Stock Sweeper?... 2 Scanning Algorithms... 4 Installation... 9 Application Layout... 10 How to use Stock Sweeper...
The Art & Science of Active Trend Trading
 CONNECTING THE DOTS Candlesticks & Convergence of Clues The Art & Science of Active Trend Trading Copyright ATTS 2007-2015 1 Dennis W. Wilborn, P.E. Founder, President Active Trend Trading dww@activetrendtrading.com
90 Days Trading Bonds
 90 Days Trading Bonds with Chip Cole 2015, All Rights Reserved. Order Flow Analytics, Inc. 1 Trading & Training chip@orderflowanalytics.com dbvaello@orderflowanalytics.com 2015, All Rights Reserved. Order
The Strategies Working Best in Today s E-Mini Market
 The Strategies Working Best in Today s E-Mini Market Todd Mitchell Craig Hill Legal Disclaimer No claim is made by Trading Concepts, Inc. that the trading strategies shown here will result in profits and
The Art & Science of Active Trend Trading
 Candlesticks Looking for U-Turns The Art & Science of Active Trend Trading Copywrite ATTS 2007-2015 1 Disclaimer U.S. Government Required Disclaimer Commodity Futures Trading Commission Futures and Options
Trading EveryDay reserves the right to change this privacy statement at any time. Be sure to check this page periodically for updates.
 This content is provided by The Trading EveryDay Group, LLC. This site, including its contents, is provided "as educational content only" without warranty or guarantee of any kind, either expressed or
Daily Technical Trader Qatar
 Daily Technical Trader Qatar Wednesday, 03 January 2018 Today s Coverage Ticker Price Target ORDS 91.80 96.30 QSE Index Level % Ch. Vol. (mn) Last 8,620.26 1.14 6.1 QSE Index (Daily) QSE Summary Market
CHARTS. Bar Line Candlestick Charts are the basis of technical analysis They are a graphic display of price action. Notes:
 TECHNICAL ANALYSIS CHARTS Bar Line Candlestick Charts are the basis of technical analysis They are a graphic display of price action Candlestick charts have become the industry standard for technical traders.
10-Year Treasury Notes ($UST Price)
") 1 Weekly Inter-market Technical Report 10-Year Treasury Notes ($UST Price) Monthly The 10-Year Note has developed a clear rising parallel trend channel that reaches now to the $128 level with confluence
1 Weekly Inter-market Technical Report 10-Year Treasury Notes ($UST Price) Monthly The 10-Year Note has developed a clear rising parallel trend channel that reaches now to the $128 level with confluence
By Tri, Senior Analyst
 1/1/2014 Trend Following By Tri, Senior Analyst NUS Students Investment Society NATIONAL UNIVERSITY OF SINGAPORE Introduction Trend following was introduced by Richard Dennis when he taught trading strategies
Figure 3.6 Swing High
 Swing Highs and Lows A swing high is simply any turning point where rising price changes to falling price. I define a swing high (SH) as a price bar high, preceded by two lower highs (LH) and followed
SCEPTRE TRADING A COURSE IN DAY AND SWING TRADING
 SCEPTRE TRADING A COURSE IN DAY AND SWING TRADING STOCK PRICE CHARACTERISTICS AND TRADING TECHNIQUES INTRODUCTION Overview of where we re going this week during the course Why use technical analysis to
Inter-market Technical Analysis for April 29, Summary Chart TheoTrade LLC. All rights reserved.
 1 Weekly Inter-market Technical Report Summary Chart 1 2018 TheoTrade LLC. All rights reserved. 2 Intraday Intermarket Volatility and even trend is back in our markets! The main movement recently came
CMT LEVEL I CURRICULUM Self-Evaluation
 CMT LEVEL I CURRICULUM Self-Evaluation DEAR CFA CHARTERHOLDER, As a CFA charterholder, the requirement that you sit for the CMT Level I exam is waived. However, the content in the CMT Level I Curriculum
Trading Lessons from the Intraday Frame (study)
") 1 Daily "Idealized Trades" Report Trading Lessons from the Intraday Frame (study) 1 2018 TheoTrade LLC. All rights reserved. 2 Trading Lessons from the Intraday Frame (1-mi) 2 2018 TheoTrade LLC. All rights
1 Daily "Idealized Trades" Report Trading Lessons from the Intraday Frame (study) 1 2018 TheoTrade LLC. All rights reserved. 2 Trading Lessons from the Intraday Frame (1-mi) 2 2018 TheoTrade LLC. All rights
The Art & Science of Active Trend Trading
 CONNECTING THE DOTS Candlesticks & Convergence of Clues The Art & Science of Active Trend Trading Copywrite ATTS 2007-2015 1 Dennis W. Wilborn, P.E. Founder, President Active Trend Trading dww@activetrendtrading.com
2.0. Learning to Profit from Futures Trading with an Unfair Advantage! Income Generating Strategies Essential Trading Tips & Market Insights
 2.0 Learning to Profit from Futures Trading with an Unfair Advantage! Income Generating Strategies Essential Trading Tips & Market Insights Income Generating Strategies Essential Trading Tips & Market
Technical Analysis Workshop Series. Session Six 1, 2, 3 Price-Bars Patterns
 Technical Analysis Workshop Series Session Six 1, 2, 3 Price-Bars Patterns DISCLOSURES & DISCLAIMERS This research material has been prepared by NUS Invest. NUS Invest specifically prohibits the redistribution
Trading Lessons from the Intraday Frame (study)
") 1 Daily "Idealized Trades" Report Trading Lessons from the Intraday Frame (study) 1 2018 TheoTrade LLC. All rights reserved. 2 Trading Lessons from the Intraday Frame (1-mi) 2 2018 TheoTrade LLC. All rights
1 Daily "Idealized Trades" Report Trading Lessons from the Intraday Frame (study) 1 2018 TheoTrade LLC. All rights reserved. 2 Trading Lessons from the Intraday Frame (1-mi) 2 2018 TheoTrade LLC. All rights
presented by Thomas Wood MicroQuant SM Divergence Trading Workshop Day One Naked Trading Part 2
 presented by Thomas Wood MicroQuant SM Divergence Trading Workshop Day One Naked Trading Part 2 Risk Disclaimer Trading or investing carries a high level of risk, and is not suitable for all persons. Before
FOREX TRADING STRATEGIES.
 FOREX TRADING STRATEGIES www.ifcmarkets.com www.ifcmarkets.com 2 One of the most powerful means of winning a trade is the portfolio of Forex trading strategies applied by traders in different situations.
4 Keys to Trend Trading Tech Analysis. There is no Holy Grail of Trading Only Tools & Rules
 4 Keys to Trend Trading Tech Analysis There is no Holy Grail of Trading Only Tools & Rules Disclaimer U.S. GOVERNMENT REQUIRED DISCLAIMER COMMODITY FUTURES TRADING COMMISSION FUTURES AND OPTIONS TRADING
Trends. Define the term Trend Explain why Trend is important Identify Primary, Secondary, and Short-Term trends
 Trends Define the term Trend Explain why Trend is important Identify Primary, Secondary, and Short-Term trends 1 What is a Trend? Uptrend Prices rise and fall in Trends Trend is defined as: Up (Rising)
Intraday candlestick secrets for day and swing trades
 Intraday candlestick secrets for day and swing trades www.candlecharts.com 1 Intraday Candle Charts Be more flexible with candle patterns on intraday candle charts than with daily or weekly candles 2 Non
Lighting the Way: Using Candlestick Patterns. The Art & Science of Active Trend Trading
 Lighting the Way: Using Candlestick Patterns The Art & Science of Active Trend Trading Disclaimer U.S. Government Required Disclaimer Commodity Futures Trading Commission Futures and Options trading has
- My 4 Favorite Trades - Essential Trades of a Professional Trader
 presented by Thomas Wood MicroQuant SM Divergence Trading Workshop Day One - My 4 Favorite Trades - Essential Trades of a Professional Trader Risk Disclaimer Trading or investing carries a high level of
Chapter 2.3. Technical Indicators
 1 Chapter 2.3 Technical Indicators 0 TECHNICAL ANALYSIS: TECHNICAL INDICATORS Charts always have a story to tell. However, sometimes those charts may be speaking a language you do not understand and you
Saudi Market (TADAWUL)... 2 Boursa Kuwait... 3 Abu Dhabi Exchange... 4 Dubai Financial Market... 5 Definitions... 6 Contacts... 7.
... 2 Boursa Kuwait... 3 Abu Dhabi Exchange... 4 Dubai Financial Market... 5 Definitions... 6 Contacts... 7.") QNBFS Technical Technical Spotlight Spotlight Sunday, Monday, January March 05, 14, 2018 Contents Saudi Market (TADAWUL)... 2 Boursa Kuwait... 3 Abu Dhabi Exchange... 4 Dubai Financial Market... 5 Definitions...
QNBFS Technical Technical Spotlight Spotlight Sunday, Monday, January March 05, 14, 2018 Contents Saudi Market (TADAWUL)... 2 Boursa Kuwait... 3 Abu Dhabi Exchange... 4 Dubai Financial Market... 5 Definitions...
Contents. Related Links. QNBFS Home Page QNBFS Trading Portal QNBFS Research Page
 QNBFS Technical Technical Spotlight Spotlight Wednesday, Sunday, January September 14, 2018 05, 2018 Contents Saudi Market (TADAWUL)... 2 Boursa Kuwait... 3 Abu Dhabi Exchange... 4 Dubai Financial Market...
Compass FX
 SYNERGY Trading Method Disclaimer Unique experiences and past performances do not guarantee future results. Trading in the off-exchange Foreign Exchange market (Forex) is very speculative in nature, involves
Daily Technical Trader Dubai
 Daily Technical Trader Dubai Sunday, 01 October 2017 Today s Coverage Ticker Price (AED) 1 st Target UPP 0.845 0.88 DFM General Index Level % Ch. Vol. (mn) Last 3,563.99 0.06 93.7 Resistance/Support Levels
Chapter 3.3. Price Patterns
 1 Chapter 3.3 Price Patterns 0 TECHNICAL ANALYSIS: PRICE PATTERNS Traders vote with their chequebooks. If they believe a stock or CFD is going to move higher then they will buy the stock or CFD. If they
Intra-Day Trading Techniques
 Pristine.com Presents Intra-Day Trading Techniques With Greg Capra Co-Founder of Pristine.com, and Co-Author of the best selling book, Tools and Tactics for the Master Day Trader Copyright 2001, Pristine
CONNECING THE DOTS Candlesticks & Convergence of Clues. The Art & Science of Active Trend Trading
 CONNECING THE DOTS Candlesticks & Convergence of Clues The Art & Science of Active Trend Trading Disclaimer U.S. Government Required Disclaimer Commodity Futures Trading Commission Futures and Options
BUY SELL PRO. Improve Profitability & Reduce Risk with BUY SELL Pro. Ultimate BUY SELL Indicator for All Time Frames
 BUY SELL PRO Improve Profitability & Reduce Risk with BUY SELL Pro Ultimate BUY SELL Indicator for All Time Frames Risk Disclosure DISCLAIMER: Crypto, futures, stocks and options trading involves substantial
Daily Technical Trader Abu Dhabi
 Daily Technical Trader Abu Dhabi Sunday, 19 November 2017 Today s Coverage Ticker Price (AED) 1 st Target RAKBANK 4.75 5.45 ADX General Index Level % Ch. Vol. (mn) Last 4,327.58-0.22 30.1 Resistance/Support
presented by Thomas Wood MicroQuant SM Divergence Trading Workshop Day One Black Gold
 presented by Thomas Wood MicroQuant SM Divergence Trading Workshop Day One Black Gold Risk Disclaimer Trading or investing carries a high level of risk, and is not suitable for all persons. Before deciding
Daily Technical Trader Qatar
 Daily Technical Trader Qatar Monday, 20 November 2017 Today s Coverage Ticker Price Target BRES 28.50 29.45 QSE Index Level % Ch. Vol. (mn) Last 7,827.50 0.02 1.6 QSE Index (Daily) QSE Summary Market Indicators
Active Trend Trading Rules Review
 Active Trend Trading Rules Review Active Trend Trader: Dennis W. Wilborn A Trend Should Be Assumed to Continue in Effect Until Such Time as Its Reversal Has Been Definitely Signaled Edwards & Magee Disclaimer
Monthly Dairy Technical Commentary Thursday September 5, 2013
 Monthly Dairy Technical Commentary Thursday September 5, 2013 CME Class III Milk Futures The weekly price trend for Class III Milk points down from its August 2011 high, and the latest breakdown below
DAILY DAY TRADING PLAN
 DAILY DAY TRADING PLAN Gatherplace will be used to place all of your trades. You will be using the 5 minute chart for the trade setup and the 1 minute chart for your entry, stop and trailing stop.you will
Trading Lessons from the Intraday Frame (study)
") 1 Daily "Idealized Trades" Report Trading Lessons from the Intraday Frame (study) 1 2018 TheoTrade LLC. All rights reserved. 2 Trading Lessons from the Intraday Frame (1-mi) 2 2018 TheoTrade LLC. All rights
1 Daily "Idealized Trades" Report Trading Lessons from the Intraday Frame (study) 1 2018 TheoTrade LLC. All rights reserved. 2 Trading Lessons from the Intraday Frame (1-mi) 2 2018 TheoTrade LLC. All rights
Date: 10 th Sep 2018 NIFTY
 Date: 10 th Sep 2018 NIFTY Indian market managed to close on positive note after it seen some selling pressure at the start of week on the back of rupee depreciation, higher crude prices and worries over
10-Year Treasury Notes ($UST Price)
") 1 Weekly Inter-market Technical Report 10-Year Treasury Notes ($UST Price) Monthly Continuing from last week's report, bonds (notes) appear to be on a strong buy signal on the monthly chart, as price is
1 Weekly Inter-market Technical Report 10-Year Treasury Notes ($UST Price) Monthly Continuing from last week's report, bonds (notes) appear to be on a strong buy signal on the monthly chart, as price is
TRADING STRATEGY SERIES LEARN HOW TO SPOT OPPORTUNITIES IN VOLATILE MARKETS fpmarkets.com.au
 1 TRADING STRATEGY SERIES LEARN HOW TO SPOT OPPORTUNITIES IN VOLATILE MARKETS This educational material does not constitute financial product advice and does not take into account your investment objectives,
Level I Learning Objectives by chapter (2017)
") Level I Learning Objectives by chapter (2017) 1. The Basic Principle of Technical Analysis: The Trend Define what is meant by a trend in Technical Analysis Explain why determining the trend is important
Level I Learning Objectives by chapter (2017) 1. The Basic Principle of Technical Analysis: The Trend Define what is meant by a trend in Technical Analysis Explain why determining the trend is important
2.0. Learning to Profit from Futures Trading with an Unfair Advantage! Income Generating Strategies Starting the Trading Day
 2.0 Learning to Profit from Futures Trading with an Unfair Advantage! Income Generating Strategies Starting the Trading Day Income Generating Strategies Starting the Trading Day Pre-Market Analysis Before
Day Trade Warrior. Advanced Trading Course Daily Chart Patterns & Understanding Triggers & Windows
 Day Trade Warrior Advanced Trading Course Daily Chart Patterns & Understanding Triggers & Windows Charting is Technical Analysis Technical Analysis is a form of interpreting price action and critical areas
How to perform accurate market analysis
 How to perform accurate market Roman Sadowski Good market combines the fundamental and the technical. This combination is essential to form a longer-term bias in the market. Good market needs to consider
US Dow Jones Index / US30Cash (DAILY CHART) System price target 15,660.00
 System price target 15,660.00") DAILY TECHNICAL US Dow Jones Index / US30Cash (DAILY CHART) System price target 15,660.00 Thursday, January 30, 2014 S1=15,660.00 Support R1=16,564.00 R2=16,048.00 ADX Signal Comment: Short positions for
DAILY TECHNICAL US Dow Jones Index / US30Cash (DAILY CHART) System price target 15,660.00 Thursday, January 30, 2014 S1=15,660.00 Support R1=16,564.00 R2=16,048.00 ADX Signal Comment: Short positions for
END OF DAY DATA CORPORATION. Scanning the Market. using Stock Filter. Randal Harisch 2/27/2011
 END OF DAY DATA CORPORATION Scanning the Market using Stock Filter Randal Harisch 2/27/2011 EOD's Stock Filter tool quickly searches your database, identifying stocks meeting your criteria. The results
WHAT IS AUTOCHARTIST?
 WHAT IS AUTOCHARTIST? Autochartist is the world s most advanced tool for the automatic identification of Chart Patterns and Fibonacci Patterns. Our proprietary technology allows us to monitor thousands
Supercharge your trading strategy with sentiment analysis
 Supercharge your trading strategy oandamt4.com Forex Indices Commodities Precious Metals Bonds One reason many traders struggle is the lack of clear guidelines that assist in decision making. Frequent
Daily Technical Trader Qatar
 Daily Technical Trader Qatar Tuesday, 25 July 2017 Today s Coverage Ticker Price Target QEWS 197.90 208.00 QSE Index Level % Ch. Vol. (mn) Last 9,579.16 0.84 8.2 QSE Index (Daily) QSE Summary Market Indicators
Technical Stock Market and Stock Analysis UCLA Extension
 Technical Stock Market and Stock Analysis UCLA Extension Date: February 4, 2012 Duration: Instructor: 9:00 AM - 4:00 PM Andrew Lais Investment Executive and General Principal Course Topics and Aim: This
On Our Technical Watch
 By the Kenanga Research Team l research@kenanga.com.my Figure 1: Daily Charting FBMKLCI Index Basic Data 52-week High 1,729.13 (in Million) 52-week Low 1,600.92 KLCI Vol 199.37 Current Level 1,662.92 Bursa
The Engulfing Trader Copyright 2014
 Www.ForexWinners.Ru Prologue and Introduction This book is for all those that are just fed up with all the hype out there in the market. So called guru s selling expensive strategies and systems guaranteeing
Advance Certificate in Trading : A PROGRAM FOR SELF-INVESTORS
 Advance Certificate in Trading : A PROGRAM FOR SELF-INVESTORS [Stock Commodity-Forex] Duration: 4 Months Fee: 33,000 + Service Tax Training: Weekends / Weekdays Certifications: Certified Trader Certificate
Day Trade Warrior. Chapter 5. Intraday Chart Patterns
 Day Trade Warrior Chapter 5. Intraday Chart Patterns What do we know? We have learned about Managing Risk (2:1 profit loss ratio 50% success target) We have learned how to find the Right Stocks (high relative
Market Technical Analysis REPORT : Europe
 1 Market Technical Analysis REPORT : Europe using Integrated Pitchfork Analysis by Dr Mircea Dologa, MD, CTA MORNING of April 30th 2007 The traders must progressively monitor the conditions of the market
Technical Analysis. A Language of the Market
 Technical Analysis A Language of the Market Acknowledgement: Most of the slides were originally from CFA Institute and I adapted them for QF206 https://www.cfainstitute.org/learning/products/publications/inv/documents/forms/allitems.aspx
Using Price Action to Identify Trends. GFF Brokers
 Using Price Action to Identify Trends GFF Brokers What this ebook is about This ebook focuses on the use of price action techniques to identify trends and micro trends. Price action analysis is a technical
Lara s Weekly. S&P500 + GOLD + USOIL Elliott Wave & Technical Analysis. Lara Iriarte CMT 23 February, 2018
 Lara s Weekly S&P500 + GOLD + USOIL Elliott Wave & Technical Analysis Lara Iriarte CMT 23 February, 2018 S&P 500 Contents S&P 500 GOLD USOIL About Disclaimer 3 18 36 48 48 S&P 500 S&P 500 Upwards movement