COMMISSION OF THE EUROPEAN COMMUNITIES COMMISSION STAFF WORKING DOCUMENT EUROPE S DEMOGRAPHIC FUTURE: FACTS AND FIGURES
|
|
|
- Jonas Cook
- 6 years ago
- Views:
Transcription
1 EN EN EN
2 COMMISSION OF THE EUROPEAN COMMUNITIES Brussels, SEC(2007) 638 COMMISSION STAFF WORKING DOCUMENT EUROPE S DEMOGRAPHIC FUTURE: FACTS AND FIGURES EN EN
3 TABLE OF CONTENTS Europe s demographic future: facts and figures Introduction and executive summary Background Highlights of this report Demographic transition: a common feature of social and economic development The demographic transition paradigm Fertility Trends in fertility Drivers of fertility Tempo and quantum effects on fertility rates Results of the 2006 Eurobarometer on fertility and ageing Longevity Main trends in longevity Expected trends in longevity Important longevity differences between socio-economic groups Migration Overview of migration trends Relative contribution of migration and fertility to population growth Cohort effects: the baby boom The EU-27 population projection Changes in the population structure Projection methods An estimate of projection uncertainty for the EU The regional dimension of population change Global demographic trends Europe s place in the global population Population trends and challenges in Europe s neighbourhood The economic and social impacts of demographic change EN 2 EN
4 3.1. Introduction Employment trends Ageing of the labour force and labour market bottlenecks Ageing, productivity and prospects for economic growth The impact of ageing on future productivity Challenges to public finances and intergenerational solidarity Pensions Health and long-term care Long-term care Opportunities for tackling demographic change Introduction Demographic renewal: how much scope is there for increased fertility? Potential for more births Unlocking the potential for more births Financial support Access to services Flexibility in working hours and work organisation Conclusion Promoting employment in Europe Potential for more jobs of better quality Unlocking the potential for increased employment A more productive and dynamic Europe The potential to raise productivity Unlocking the potential for productivity growth Ageing consumers and the silver economy Conclusion Receiving and integrating immigrants in Europe The potential of migration for redressing labour market imbalances Unlocking the potential of migration Conclusion EN 3 EN
5 4.6. Sustainable public finances Potential for tackling the demographic challenge Unlocking the potential Conclusion Overall conclusion Annex I. Country statistics and comments Belgium Bulgaria Czech Republic Denmark Germany Estonia Greece Spain France Ireland Italy Cyprus Latvia Lithuania Luxembourg Hungary Malta Netherlands Austria Poland Portugal Romania Slovenia Slovakia Finland Sweden United Kingdom Sources and Definitions EN 4 EN
6 Annex II. European research projects on demographic change and its impacts EN 5 EN
7 EUROPE S DEMOGRAPHIC FUTURE: FACTS AND FIGURES 1. INTRODUCTION AND EXECUTIVE SUMMARY 1.1. Background Demographic change is high on the European policy agenda and, indeed, Europe has to brace itself for profound changes in its population structure. During the coming decade, the baby boom cohorts will start retiring from the labour market. Young cohorts entering the labour market will be much smaller as a result of low fertility. In about ten years, total employment in the EU could start to fall, in spite of rising employment rates. Europe s potential growth rate could decline at a time when significant additional resources will be required to meet the needs of an increasing number of elderly people for whom adequate pensions and health and long-term care provision will have to be secured. In October 2006, the Commission presented its views on the demographic challenge and the best ways for tackling it in the communication The demographic future of Europe from challenge to opportunity 1. This communication followed a major public debate launched by the Green Paper Confronting demographic change: a new solidarity between the generations of March as well as discussions at the level of heads of state and government at the Hampton Court informal summit of October The Commission expressed confidence in Europe s ability to cope with the demographic challenge and presented five key areas in which there are major opportunities for constructive policy responses: Promoting demographic renewal in Europe; Promoting employment in Europe: more jobs and longer working lives of better quality; A more productive and dynamic Europe; Receiving and integrating migrants in Europe; Sustainable public finances to guarantee adequate social protection and equity between the generations. As was announced in the Communication, a European report will present an assessment of the demographic situation every two years, reflecting the ongoing debate and research in the EU, in conjunction with the European Demographic Forum. This first Demographic report summarises the extensive analytical work carried out prior to the adoption of the communication on Europe s demographic future. It draws extensively on the work carried out by the Economic Policy Committee and the Commission (Directorate-General for Economic and Financial Affairs) on future public expenditure 1 COM(2006) 571, adopted on 12 October COM(2005) 94, adopted on 16 March EN 6 EN
8 trends. Furthermore, it reviews on a series of demographic impact studies and a Eurobarometer survey commissioned under a special budget appropriation approved by the European Parliament (the Walter Pilot Action of 2004 and 2005, i.e. named after its initiator, MEP Ralf Walter). These studies looked at a variety of relevant issues including the link between population decline/ageing and economic growth, the impact of demographic change on the skills and qualifications demanded by the labour market, as well as issues related to innovation and productivity growth in Europe. Finally, the report also reflects the hearings of leading experts in January and March 2006 as well as the first European Forum on demography held on October 2006 in Brussels. The aim of this report is to present the main facts and figures that underpin the debate on Europe s demographic future and appropriate policy responses. It starts by presenting the main drivers of demographic change fertility, life expectancy and migration and puts these into a long-term and global perspective. Another chapter discusses the economic impact of ageing and the effect this will have on future living conditions in Europe. A major ambition of this report is to provide facts and figures to illustrate the potential of each of the five key policy areas in which constructive responses to the demographic challenge can be developed. Thus, one chapter also reviews to what extent Member States have already started unlocking this potential. Although it covers a wide range of different areas, the material presented is certainly still incomplete and the analysis must be regarded as very preliminary. However, the chapter should provide a useful starting point for a realistic assessment of the European Union s preparedness for demographic change. Country summaries based on a set of traditional demographic indicators complete the picture. In the communication of October 2006 the Commission announced its intention to hold a major European Forum on Demography every two years. In connection with each Forum, a report like the present one is to be published to support an informed and constructive debate both at European level and in the Member States. The reactions to this first report received from the various stakeholders who participated in the debate initiated by the Green Paper and from the high-level group of governmental demographic experts will serve to further improve the presentations of the biennial Demographic Situation Report. There are probably numerous ways in which future reports could be improved over the present one. Comments and suggestions would therefore be gratefully received and should be sent to: Unit E1 Directorate-General for Employment, Social Affairs and Equal Opportunities European Commission B-1049 Brussels Empl-e1-courrier@ec.europa.eu EN 7 EN
9 1.2. Highlights of this report This Report on the Demographic Situation in Europe 2006 consists of three main sections corresponding to the main subjects covered by the Communication on the Demographic future of the EU: an overview of the drivers of demographic change, an analysis of the main impacts of this change and a description of the potential for responding to the challenges posed by demographic change within five key policy areas. This summary highlights the main themes of the report, each of which is discussed more extensively in the respective chapters. Chapter 2: Demographic transition: a common feature of social and economic development The main drivers of demographic change are fertility, mortality (life expectancy) and migration. In addition, the passage of age cohorts of different sizes through the life cycle can have significant impacts. Regarding fertility, there are roughly two groups of countries within the EU: those with a moderately low fertility in the range of births per woman and those with very low fertility in the range of 1.5 births or less. The average for the EU-25 is 1.5 (2005). The fertility rate needed for a full replacement of generations is estimated by demographers at 2.1, but given current levels of migration and rising life expectancy, the population size will decline only at fertility rates significantly below this replacement rate. Currently observed fertility rates may also underestimate long-term trends. The indicator is constructed in such a way that postponement of childbearing will initially lead to a lower fertility rate until the mothers new, higher average age at birth is reached. This tempo effect may be affecting countries with the lowest birth rates, notably in Central and Eastern Europe. The Eurostat population projections up to 2050 assume an increase in fertility rates, particularly in countries with the lowest rates: for the EU-25, a slight recovery from 1.5 to 1.6 is assumed. A Eurobarometer survey carried out in 2006 revealed a generally positive attitude of Europeans towards childbearing. Women would like to have more children than they actually have. Moreover, they would also prefer to have their children somewhat later in life than they actually do. Since the 19th century, gains in life expectancy have above all been the result of reduced mortality in early life, due to general socio-economic progress and public health measures. More recently, mortality in mid-life has also been reduced. While socio-economic factors such as income and education remain important for gains in life expectancy, the availability of modern medical treatment is playing an increasing role, as are lifestyle changes. Life expectancy is generally higher in the old (EU-15) Member States (82.4 and 76.7 for women and men respectively) than in the new (EU-10) Member States (78.7 and 70.4 for women and men). The Eurostat population projections expect further increases in life expectancy by about six years for men and five years for women (EU-25) between 2004 and These will have to be brought about mainly by declining mortality at higher ages, thus contributing to the increasing share of older and very old people in the total population. Such progress in life expectancy will, however, be contingent on the avoidance of unhealthy lifestyles, including smoking, poor diet, lack of physical exercise and excessive alcohol consumption. Migration has become a major determinant of demographic change in the EU. In the second half of the 20 th century, large parts of Europe witnessed a historical change from emigration to immigration. Net migration into the EU reached a peak of almost 2 million in 2003/2004. EN 8 EN
10 However, two thirds of this observed flow concerned Italy and Spain where large numbers of illegal migrants, the majority of whom had arrived in these countries in previous years, were regularised and thus suddenly appeared in the migration statistics. If immigration is maintained at this very high level, the EU s working age population would continue to grow until around 2030 rather than already starting to decline by the end of the present decade, as is currently assumed in the Eurostat population projection. However, such a perspective would raise growing concerns about the integration of these immigrants. Indeed, the degree of integration of populations of immigrant origin already present in many Member States is often seen as highly problematic. The baby boom cohorts, born between 1945 and 1965, currently still boost the working age population. They will start retiring soon, thereby bringing about a major shift in the balance between the active and the retired. About 15 to 20 years later, these cohorts will start relying heavily on health and long-term care systems. The combination of these trends will leave the total population size roughly unchanged by 2050, but will transform Europe s population structure. According to Eurostat s baseline population projection, the median age of the EU will increase between 2004 and 2050 from 39 to 49 years. The number of young people (aged 0-14) in the EU will continue to decline in absolute terms from around 100 million in 1975 to some 66 million by the year The population of working age (15-64) will be most numerous around the year 2010 (331 million) but will subsequently decline to about 268 million by While ageing will affect all Member States of the EU, it will do so to varying degrees. The old-age dependency ratio (number of people over 65 divided by the number of people aged 15-64) will reach around 53% in 2050 for the EU-25 (up from 25% today), with the highest rates projected for Italy and Spain (66-67%) and the lowest for Denmark, Luxembourg, Malta, the Netherlands and Sweden (around 40%). While it may still be one or two decades before the impact of ageing becomes clearly visible at the level of an entire country, the impact can already be observed at regional level. In some regions, natural change (difference between births and deaths) has already become negative. Migration may either aggravate or alleviate these trends. Regions will increasingly have to include the effects of long-term population trends in their regional medium-term strategies. A number of regions have already been active and are at the forefront of strategic thinking and actions to tackle the demographic challenge. A century ago some 15% of the world population lived in the area of the current EU-25; nowadays this share is 7% and by the year 2050 the share of the EU-25 in the total world population is projected to be around 5%, according to the UN population projections (2004). While all world regions except sub-saharan Africa will experience significant ageing of their populations, the EU is the only major world region where the total population is projected to decline in the coming four decades. Although declining fertility can be observed in many developing countries, the demographic and socio-economic contrasts between Europe and its Southern neighbours suggest that strong migratory pressures will persist over the coming decades. Chapter 3: The economic and social impacts of demographic change. Demographic change will gradually limit the scope for future employment growth. Although the population of working age (aged 15-64) is already expected to decline from around 2011 onwards, total employment in the EU-25 is expected to continue growing up to around 2017 EN 9 EN
11 due to rising labour force participation. Thanks to higher education levels and greater labour force attachment of younger cohorts of women, female employment rates are projected to rise from just over 55% in 2004 to almost 65% by The employment rates of older workers are also projected to increase, from 40% in 2004 for the EU-25 to 47% by 2010 and 59% in From around 2017 onwards, however, the shrinking working age population will lead to stagnation and, subsequently, reduction of total employment. Projections show that, as employment decreases and productivity becomes the only source of future economic growth, the annual average potential GDP growth rate in the EU-25 will decline from 2.4% in the period 2004 to 2010 to only 1.2% in the period Declining employment at a time when the number of older people in need of adequate pensions and health and long-term care is rising will make it a challenge to provide sufficient resources for social protection in a sustainable way. The projected increase in these expenditure categories by 2050 is about 4.5 percentage points of GDP in the EU-25. Public and private spending on pensions, which averaged 13% of GDP in the EU (in 2003), has ensured that being old is no longer associated with being poor or being dependent on one s children. However, Europe s future ability to provide the ageing population with adequate pensions will crucially depend on whether the effective retirement age can be raised and the pension systems adapted to increasing life expectancy, thereby making the relationship between contributions and benefits transparent. The main consumers of health and long-term care today are elderly people, whose projected increasing numbers will result in greater demand for these services. According to Eurostat projections, the share of the total population over 80 will rise from 4.1% in 2005 to 6.3% in 2025 and to 11.4% in Although age in itself is not the only factor influencing healthcare spending (though it does serve as a proxy for a person s health status), projections illustrate that an ageing population will bring about pressure for increased public spending on health and long-term care. Chapter 4: Opportunities for tackling demographic change. The Commission s Communication on The demographic future of Europe from challenge to opportunity identified five key policy areas in which constructive responses to the demographic challenge can be developed. These include birth rates, employment levels, productivity growth, migration and the sustainability of public finances. If policies in these areas are formulated in an integrated manner, synergies may be reached. For example, policies that promote the labour market participation of older workers will also have a positive impact on public finances. In addition, more competitive markets will increase the return on investment in older workers. Promoting demographic renewal in Europe through greater gender equality While the choice to have or not to have (more) children is and must remain a private one, there appears to be scope for policies to enable families to make their choices. Indeed, survey evidence suggests that Europeans generally would like to have more children than they actually have. International comparisons show that policies supportive of those who wish to have children can have some effect in raising birth rates. Even small changes in fertility rates will have a strong impact on the population size and age structure in the long run. However, an increase in fertility rates will only translate into a larger working age population and increased employment after 20 or more years. Therefore, it could at best make a small contribution to tackling the challenge of providing for the ageing baby boom cohorts. Furthermore, the number of women of childbearing age is also projected to fall in the coming decades. EN 10 EN
12 If the aim is to enable people to have the number of children they really wish, public policies that promote greater gender equality and facilitate the reconciliation of work and care seem to be most successful. It is primarily women who adjust their career ambitions to the needs of their families (including caring for elderly relatives), either by dropping out of the labour market or working part-time. Countries that have achieved the highest female labour force participation and the most progress in terms of gender equality (as reflected in differences in time use patterns between men and women) today also display relatively high fertility rates. Some 20 years ago, countries with high female labour force participation tended to display lower fertility than those with low female labour force participation. Access to services (in particular affordable day care provision of high quality), flexibility in working hours and conditions as well as gender equality (including shared family and domestic responsibility) are all important factors in reconciling work and private life. In addition to policies that promote better conditions for women and men wishing to raise a family, it may become increasingly important to address biological obstacles to fertility. As potential parents postpone the moment at which they decide to have children, infertility is becoming a more and more frequent obstacle to the realisation of their desire to have children. The availability of fertility treatments may then have some impact on birth rates. Promoting employment in Europe: more jobs and longer working lives of better quality The effective old-age dependency ratio, or the ratio between people over 65 and the employed persons aged 15-64, is even higher than the demographic dependency ratio and is projected to rise from 37 to 70 in the EU-25 by Despite a significant increase in employment rates, the effective old-age dependency ratio is projected to worsen significantly. Raising the EU-25 employment rate to the level of the current three best-performing Member States, however, would compensate for about two-thirds of the decline in employment expected to result from a shrinking working-age population. Such an increase in employment rates would, of course, require many changes in the labour market and in institutional arrangements. A life-cycle approach aimed at enabling people to remain much longer active and productive, including through lifelong learning and better health protection, is needed. The main potentials for increased employment rates lie with women and older workers and some other disadvantaged groups on the labour market.. In order to unlock these potentials, raising levels of educational attainment seems to be particularly important. Higher levels of education are associated with significantly higher employment rates and much lower unemployment rates. In 2005, the average employment rate among the highly-skilled in the EU was 82.5%, for the medium-skilled (those having completed upper secondary education) it was 68.7%, whereas for the lowest skilled it was only 46.4%. Both the Lisbon strategy and the European Employment Strategy aim to increase employment and growth and provide guidance on how to meet demographic challenges. A higher labour force participation of women will require better provision of affordable highquality childcare and care of other dependents, shared family and domestic responsibilities between men and women, reduced gender pay gaps, enhanced gender equality and equal opportunities. The European Pact for Gender Equality adopted in 2006 aims at mainstreaming gender in all actions taken and will be a tool for increasing the employment of women. Prolonging working lives by providing effective incentives for later retirement is an even more important policy to unlock the potential for increased employment. This concerns not only pension schemes, but also early retirement and social security schemes (disability, unemployment, sickness) that are sometimes used as an exit-route. Older workers are nowadays in a much better health condition than the same category of workers 40/50 years ago. Moreover, as today s older workers entered the labour market at a later stage, EN 11 EN
13 strengthening incentives to remain on the labour market seems appropriate. This can be further reinforced by adopting a life-cycle perspective. Active ageing needs to be prepared for by a good initial education that enables workers to participate in lifelong learning. Health promotion throughout working life, as well as effective and efficient health services are also important because a healthy workforce is more productive. Ill health is a key factor in absenteeism and early retirement. Pension reforms in the majority of Member States are already raising the labour market exit age and would be further underpinned by promoting the employability of older workers, both with regard to their skills and their health status. The labour potential of all groups must be fully used and measures taken to better integrate disadvantaged groups on the labour market, such as disabled persons, ethnic minorities and people with a migration background. A high youth unemployment rate is also a serious concern. A more productive and dynamic Europe Economic growth and high living standards beyond 2017, when total employment is expected to decline, will depend solely on increases in labour productivity. There is a huge potential for productivity improvements in Europe if all Member States were to catch up with the highestperforming countries whose productivity levels are above or close to that of the US. Indeed, even the productivity leaders can further accelerate their growth by removing obstacles to innovation and structural change and by boosting research and development leading to new products and more efficient production processes. The key to unlocking this potential is to invest in human capital. The example of the highestperforming Member States shows that general education levels across the EU can still be raised significantly. In this context, it is particularly important to reduce the number of early school leavers, who will face increasing difficulties in future labour markets. In 2005, 17% of men and 13% of women aged had not reached more than lower secondary education and were not in further education or training. Further improvements are also necessary with regard to the proportion of people with an upper-secondary or tertiary education. Spending on tertiary education in the EU-25 represents only 1.2% of GDP, compared to 2.9% in the US. The gap between the EU and the US is somewhat smaller with regard to R&D spending, which is just under 2% of GDP in the EU and nearly 2.7% in the US. Europe s future capacity for innovation and productivity growth will depend on increased investment in top-level education and research. This will also be crucial for successful adaptation to the new market opportunities brought about by the silver economy, i.e. new goods and services adapted to the changing needs and demand patterns of an ageing society. Receiving and integrating migrants in Europe Europe will continue to be an attractive destination for migrants due to its prosperity and wellfunctioning societies. However, it should be noted that the EU is not as successful as the USA and Canada in attracting the highest-skilled migrants. The procedure adopted in 2005 for the admission of third-country researchers is a first step towards addressing this issue 3. Such arrangements need not come at the cost of developing countries in the form of brain drain, but can and should be beneficial to all parties. Around 3.7% of the EU-27 population are non-eu nationals (5.1% in the EU-15). Migration is therefore already responding to the needs of 3 Directive 2005/71/EC. EN 12 EN
14 European labour markets, and this need for both high- and low-skilled migrant labour will continue. While internal mobility of workers within the EU will not change demographic trends for the EU as a whole, it does represent an enormous potential for higher rates of participation and employment as it opens up better opportunities for people living in regions where they face poor labour market prospects. Countries that have experienced rapid economic growth over recent years, like Spain and Ireland, have clearly benefited enormously from the significant inflow of workers both from outside and from within the European Union. The main challenge to realising the potential of immigration is the integration of migrants and their descendants into European societies. The Member States of the EU have evidently had different degrees of success with labour market and social integration. The educational attainment of non-nationals is generally substantially lower than that of nationals, although in several Member States the percentage of non-nationals with tertiary level education is actually higher that that of nationals. At the same time, in several Member States, the employment rates of migrants, particularly migrant women, are very low. Linked to this insufficient integration of migrants in their host societies is a rather negative perception of immigration: Eurobarometer results indicate that on average only 4 out of 10 EU citizens feel that immigrants contribute a lot to their country, while a slight majority of citizens (52%) do not agree with this statement. Sustainable public finances to guarantee adequate social protection and equity between the generations In all Member States, the ageing of the population will increase public expenditure on pensions, health and long-term care. Projections show that most Member States where pensions are financed by specific contributions will see a growing imbalance between contributions and needs. The reserve funds established by several Member States can alleviate future financing needs but appear to be inadequate in most cases. In most Member States, public finances are not sustainable in the long run under current policies. Budgetary consolidation and further reform efforts in pension, health and long-term care systems are required. An increase in the number of years that people remain active and in good health will help to reduce the financial pressure on health and long-term care systems. Apart from future expenditure and revenue trends, the long-term sustainability of public finances depends on the current deficit and debt situation, which if left unchanged can put public finances on an unsustainable path. Interest payments on public debt can represent more than 10% of public revenue in some Member States. Reducing current deficit and debt levels and avoiding unsustainable expenditure trends are recommended policies to ensure that Member States remain capable of meeting future spending needs, including those arising from population ageing. The potential for further consolidation of public finances differs greatly across Member States. To consolidate public finances over the long-term, it is important to act at a time when growth prospects are still favourable. The EU has a window of opportunity of about 10 years until employment is projected to start to fall as a result of a shrinking working age population. Mobilising the full potential of older workers, including making use of the window of opportunity to reform pension and healthcare systems and prevent the early withdrawal of the baby boom cohorts from the labour market will be key to tackling the challenges of ageing. This will strengthen Member States' capacity to ensure adequate social protection of the EN 13 EN
15 elderly while making sufficient investment in younger generations and hence maintain intergenerational solidarity. EN 14 EN
16 2. DEMOGRAPHIC TRANSITION: A COMMON FEATURE OF SOCIAL AND ECONOMIC DEVELOPMENT 2.1. The demographic transition paradigm Explanations and projections of population trends in different parts of the world have been generally guided by the paradigm of demographic transition. This term was first used by the American demographer Warren Thompson in to label the changes or transitions he observed in birth and death rates in industrialised societies over the past two hundred years. There always appears to be a common pattern: after an initial decline in death rates, birth rates also start to fall, albeit with a certain lag. During this time lag, birth rates will be much higher than mortality rates, resulting in a rapidly growing population. The paradigm fits well with the remarkable mortality and fertility changes that happened first in Europe in the 19 th century and in much of the rest of the world during the 20 th century. The transition can be broken down into four different phases. Stage one corresponds to pre-modern-times and is characterised by the absence of a clear population trend. During the second stage there is a dramatic rise in population caused by a decline in the death rate while the birth rate remains high. The decline in the death rate is due to improvements in food supply thanks to higher yields in agriculture and to improvements in public health 5 (water and food handling, hygienic conditions) which result in a particularly pronounced decrease in childhood mortality. The increasing survival of children leads to a younger population structure. The trend is amplified as the larger surviving cohorts start to have children of their own at the same high fertility rate as their parents. During stage three the birth rate declines, which moves the population back towards stability (in most Northern European countries such a decline in birth rates already started at the end of the 19 th century). Towards the end of stage three the fertility rate falls to replacement levels, but as a result of population momentum (i.e. the large number of young people), the population continues to grow. Finally, stage four is characterised once again by stability with the population no longer growing and the population age structure has become much older. Such a demographic transition seems to be a common feature of development across the world, although there are important differences in timing between the various regions. In the 1950s, the birth rates in Europe were almost twice as high as the death rates, which resulted in significant population growth. It was during the 1990s that Europe entered stage four, when the gap between birth and death rates closed. Europe then started to have a birth deficit resulting in negative natural growth. Consequently, any further population growth has been the result of net immigration. Less developed regions of the world are by and large still in stage three of their demographic transition death rates have already declined significantly and birth rates are now also coming down, albeit from a very high level. India is expected to complete its demographic transition by the middle of this century. The only region in the world where birth rates have not yet come down is Sub-Saharan Africa, which still appears to be in stage two of the demographic transition. Here the population is growing fast even though the decrease in death rates has recently slowed (due to the fact that in several African countries mortality has actually increased as a result of the HIV/AIDS epidemic). 4 Thompson Warren S. 1929, Population, American Sociological Review 34(6), pp Readers of the British Medical Journal chose the sanitary revolution as the biggest advance in healthcare since 1840, see EN 15 EN
17 2.2. Fertility Europe s demographic past is well described by the demographic transition paradigm. However, the very low fertility rates observed over the past decades raise the question whether the assumption of a return to a stable population size, as foreseen for the fourth stage of the demographic transition, is a good guide to the future Trends in fertility The most commonly used indicator for fertility is the Total Fertility Rate (TFR). It gives the average number of children per woman, assuming that all women are going to give birth according to age specific fertility rates observed for a given period. All EU Member States have now TFR levels below 2.1, the level needed for the replacement of generations. Within the EU there are roughly two groups of countries: those with a moderately low fertility (in the range of births per woman) and those with very low fertility (in the range of 1.5 births or less). The difference may appear small at first glance. However, it has major implications for a country s long-term demographic future. The Australian demographer Peter McDonald 6 has warned that: In a stable population with a fertility rate of 1.3 births per woman, the population falls at the rate of 1.5% per annum. Such a population, in 100 years, would (all other things remaining equal) fall to less than a quarter of its original size. In contrast, with a fertility of 1.9, the rate of decline in a stable population is only 0.2% and the population size after 100 years would be 82% of its original size. McDonald concludes that it is an error to convey the impression that in the long run of history a fertility rate of 1.3 and a fertility rate of 1.9 is much the same thing. Fertility falls from 1.9 to 1.3 through 60% of all women having one fewer child! On the basis of this argument a distinction is made between countries with a dangerously low fertility rate of below 1.6 and countries with a comfortably low fertility rate. The latter countries can still expect to offset their natural population decline with a reasonable level of immigration. 6 McDonald, P., Gender equity, social institutions and the future of fertility, Journal of Population Research, No 17(1), 2000, pp EN 16 EN
18 Table 2.1 Total (period) fertility rates (increases compared to previous column shaded) 1960/ / / / / /05* 2050** EU EU NMS BE CZ DK DE EE : EL ES FR IE IT CY LV : LT LU HU MT NL AT PL PT SI SK FI SE UK BG RO HR *** TR *** Source: Eurostat. * Preliminary or most recent. ** According to EUROPOP2004, Baseline, data for France refer to metropolitan France only. *** UN data. Table 2.1 shows that since the 1970s, all Member States have experienced fertility decline, sometimes very substantial and at a fast speed. In Ireland, for instance, the TFR has declined since the 1960s by almost 50%. In several of the new Member States, such as Poland, the drop was even larger than 50%. Fertility declines were less abrupt in some of the Western and Northern Member States. Currently, women in the EU-25 have on average 1.5 children (1.55 in the old Member States and 1.25 in the new Member States). Despite the fertility decline in Ireland, however, this Member State still has one of the highest fertility rates in Europe, together with France and Finland, while the Czech Republic, Poland, Slovenia and Slovakia have the lowest rates. EN 17 EN
19 Drivers of fertility The literature offers basically two types of explanations for the decline in fertility 7. Economists have proposed a rational choice approach while sociologists have concentrated on changes in cultural and individual values. The rational choice approach focuses on various mechanisms. Gary Becker 8 argued that as women become more educated, raising children involves much higher opportunity costs assuming that mothers have to reduce their labour force participation. Richard Easterlin highlighted the importance of a positive economic outlook: If the couple s potential earning power is high in relation to aspirations, they will have an optimistic outlook and will feel freer to marry and have children. If their outlook is poor relative to aspirations, the couple will feel pessimistic and, consequently, will be hesitant to marry and have children 9. A third major rational choice fertility theory proposed by David Friedman focuses on the economic value of children. The idea here is that people have a larger number of children to reduce uncertainty in their future lives. Social protection arrangements, however, limit uncertainty and reduce the economic rationale for having a large number of children, which we still see in many non- European countries where population-wide social protection systems do not function properly. Sociologists have often challenged or complemented the rational choice approach to fertility. Dirk van de Kaa and Ronald Lesthaeghe have proposed complementing the rational approach by paying more attention to the dramatic changes in individual values and behaviour that have taken place since the 1960s. Only by understanding the newly acquired autonomy of the individual can one comprehend current family formation decisions 10. Van de Kaa and Lesthaeghe postulate a Second Demographic Transition (SDT) characterised by new patterns of behaviour in terms of living arrangements (single living, pre- and post-marital cohabitation, delayed fertility, high prevalence of non-marital fertility and high rates of divorce) and new individual values with respect to family and fertility behaviour. Table 2.2 illustrates how these values have changed in Western Europe in the process of moving from the first to the second demographic transition in table 2.2 below. 7 See also Liefbroer, A. C., The impact of perceived cost and rewards of childbearing and entry in parenthood: evidence from a panel study, European Journal of Population, Becker, G.S., A Treatise on the Family, Harvard University Press, Cambridge MA, Easterlin, R.A., Birth and Fortune: The impact of numbers on personal welfare, Basic Books, New York, Van de Kaa, D. J., Europe s second demographic transition, Population Bulletin, No 42, 1987, pp EN 18 EN
20 Table 2.2 Overview of demographic and societal characteristics related to FDT and SDT in Western Europe FDT SDT A. Marriage Rise in proportions marrying, declining Fall in proportions married, rise in age at first age at first marriage marriage Low or reduced cohabitation Rise in cohabitation (pre- & post-marital) Low Divorce Rise in divorce, earlier divorce High remarriage Decline of remarriage following both divorce and widowhood Decline in marital fertility via reductions at older ages, lowering mean ages at first parenthood B. Fertility Further decline in fertility via postponement, increasing mean age at first parenthood, structural subreplacement fertility Deficient contraception, parity failures Efficient contraception (exceptions in specific social groups) Declining illegitimate fertility Rising extra-marital fertility, parenthood within cohabitation Low definitive childlessness among married couples Rising definitive childlessness in unions C. Societal background Preoccupations with basic material needs: income, work conditions, housing, health, schooling, social security. Solidarity prime value Rising memberships of political, civic and community oriented networks. Strengthening of social cohesion Strong normative regulation by State and Churches. First secularisation wave, political and social pillarisation Segregated gender roles, familistic policies, embourgeoisement, promotion of breadwinner family model Ordered life course transitions, prudent marriage and dominance of one single family model Rise of higher order needs: individual autonomy, self-actualisation, expressive work and socialisation values, grass-roots democracy recognition. Tolerance prime value. Disengagement from civic and community oriented networks, social capital shifts to expressive and affective types. Weakening of social cohesion Retreat of the State, second secularisation wave, sexual revolution, refusal of authority, political dépillarisation Rising symmetry in gender roles, female economic autonomy Flexible life course organisation, multiple lifestyles, open future Source: Lesthaeghe R and Surkyn J, 2007, 'When history moves on: the foundation and diffusion of a second demographic transition', forthcoming in Jayakodi, R.; Thornton, A.; Axinn, W. (Eds), International Family Change Ideational Perspectives. Mahwah, New Jersey: Lawrence Earlbaum & Associates. It is far too early to tell whether the second demographic transition will be as universal as the first demographic transition. If it is mainly driven by changes in values, it could be less permanent and more specific to individual countries. However, birth rates far below replacement levels have also been observed in the most developed Asian countries Tempo and quantum effects on fertility rates The most common used period indicator for fertility is the Total Fertility Rate (TFR), which is based on age specific fertility rates in a particular year. The TFR indicator has to be regarded as an estimate or a projection to the extent that it is based on the assumed future fertility pattern of younger women as derived from the probability of giving birth observed among current older cohorts of women. The effects of changes in current fertility patterns on future fertility probabilities are not taken into account. Thus, when more and more women are EN 19 EN
21 postponing births, the TFR will inevitably go down initially (tempo effect), even though the likelihood of having children at a later age would go up if these women still wished to have the same number of children (quantum effect). Once the general process of postponement in a country has stopped, the TFR will go up again. The sensitivity of the TFR to postponement (and the opposite catching-up effect) causes the TFR to be a volatile and unstable indicator. In most EU countries, however, the postponement of childbearing does appear to result in reduced average fertility for the cohort as a whole. The share of children without siblings appears to be increasing, and childlessness among women in their 30s and 40s is becoming more frequent. Cohort fertility rates, which are known only at the end of a cohort s fertile life span, are a more stable indicator of long-term trends as they are not affected by differences in the timing of children (postponement). Cohort fertility turns out to be only slightly higher than the period rates, which suggests that postponement is still reducing TFR. However, an obvious problem in using cohort rates is that they are not available for (younger) cohorts that have not yet reached the end of their fertile life span, so do not allow a timely observation of fertility trends. The latest available average cohort fertility rates for the generations of women born in 1955 and 1965 in the EU and 1.77, respectively also confirm that fertility has now dropped below the replacement level. In the EU, the fertility rates of women aged younger than 30 years have declined since the 1970s, while the fertility rates of women over 30 have risen since the 1980s, which is a clear indication of postponement. Since 1980 the average TFR has declined by 0.4 children per woman. During the same period the mean age at childbearing has risen by 2 years to 29 years. In recent years the decline in fertility rates at young ages appears to have slowed down in many Member States and even stopped in several countries. As a consequence, the decline in the total fertility rate (TFR) has also slowed down or even turned into a slight increase. In some countries, the rise in fertility at older ages has slowed down, suggesting that in these countries the catching-up phase is near its end, but in most countries a strong increase in fertility at ages 30 or more is still going on, suggesting that the TFR in these countries may increase in the coming years. Fertility is therefore likely to recover in Member States where it is below average (due to the tempo effect), particularly in the new Member States 11. While a reversal in TFR trends can be expected in a number of Member States, there is nevertheless concern that very low fertility rates could persist. Lutz, Skirbekk and Testa warn in a recent paper 12 of a low fertility trap resulting from a self-reinforcing mechanism. Their low fertility trap hypothesis (LFTH) has three components: a demographic one based on the negative population momentum, i.e. the fact that fewer potential mothers in the future will result in fewer births; a sociological one saying that the ideal family size for the younger cohorts is declining as a consequence of the lower actual fertility observed among previous cohorts; and an economic one based partly on Easterlin s relative earnings power hypothesis, saying that the aspirations of young people are increasing while their expected income may be declining as a consequence of the rising cost of population ageing. 11 De Beer, P., An assessment of the tempo effect for future fertility in the EU, European Observatory on the Social Situation, the demography network (forthcoming), Lutz, W., Skirbekk V. and M. R. Testa, The low-fertility trap hypothesis: forces that may lead to further postponement and fewer births in Europe, Vienna Institute for Demography (VID) research paper, No 4, EN 20 EN
22 Together, these three factors could trigger a downward spiral, particularly in those countries where the TFR currently lies significantly below 1.5 births per woman Results of the 2006 Eurobarometer on fertility and ageing 13 Both the SDT and the LFTH suggest that people now have different values and life styles and have become less interested in having children. A Eurobarometer (EB) survey carried out in 2006 checked whether Europeans have indeed become less interested in children. The survey confirmed the generally positive attitude of Europeans towards childbearing that was first found in the 2002 EB survey. The two-child family remains the most common aspiration of Europeans. The mean ideal number of children is 2 or slightly higher, both for men and women as well as for each age group. Austria and Romania are the only European countries with ideals below the replacement level among young female and male cohorts. This picture remains largely unchanged when we look at the ideals that people have for their own family size, rather than general ideals., As is normal, however, ideals are somewhat removed from reality: when one adds up the number of children already born and the number people still intend to have, for women in the prime reproductive ages, several countries have averages of less than 2 (Austria, Romania, Spain, Italy, Slovakia, Germany, Malta, and the Czech Republic) see Figures 2.1 and 2.2. Women would not only like to have more children than they actually have, they would also prefer to have their children somewhat later in life than they actually do (half a year later on average). This confirms that the tempo effect could still be relevant. The age indicated as the latest ages to start having children is 41 for a woman and 46 for a man, despite the fact that female biological fertility, on average, starts to decline rapidly after the age of The most relevant conditions considered as a prerequisite for having children are the health of the two partners (75% for the mother s health and 68% the father s health among men, and 77% for the mother s health and 66% the father s health among women), the presence of a supportive partner (72% overall), a good working situation of the father (61% and 62% among female and male respondents, respectively), the financial situation (60% overall), and the availability of appropriate housing conditions (55% among men and 59% among women). The importance of the role of both partners for a good family life and particularly for raising children is recognised, but the role of mothers is still considered more crucial. The predominant opinion is that men and women should both contribute to the household income, although fathers should not concentrate too much on their jobs according to almost 80% of respondents of childbearing age in the EU-25. Half of respondents also believe that mothers should not work too much, fearing that family life would suffer if they have a full-time job, while more than half of the respondents are convinced that children of pre-school age would suffer if their mother went out to work. A large majority of Europeans (around 70%) feel, however, that a working mother is able to establish just as warm a relationship with her children as a non-working mother. 13 Testa M. R. Childbearing preferences and family size issues in Europe, VID Report on the special Eurobarometer, No 253, wave 65.1 and 65.31, TNS Opinion & Social for the EC, On average female fertility begins to decline slightly at 30, the decline becoming very strong after 35 and infertility usually setting in at 41. See Te Velde, E.R. and P.L. Pearson, The variability of female reproductive ageing, Human Reproduction Update, 8 th year, 2002, pp EN 21 EN
23 Figure 2.1 Childless women, and childless women not intending to have any children, by country, ages CC10 EU25 EU15 2AC+2CC AT BE LU DE(W) DE IT SK DK FI DE(E) NL TR ES FR LV UK RO IE MT PT SE EE CY EL CZ SI PL HU LT BG HR 0,0 10,0 20,0 30,0 40,0 50,0 60,0 Childless women not intending to have a child Childless women still considering having a child Source: Childbearing preferences and family size issues in Europe by M.R. Testa, results of the 2006 Euro Barometer on fertility and ageing. Note: Own adaptation of Figure 21 in the report. EN 22 EN

24 Figure 2.2 Mean actual and ideal number of children, by country. Women aged 25 to 39 Source: Childbearing preferences and family size issues in Europe by M.R. Testa, results of the 2006 Euro Barometer on fertility and ageing. BOX 2.1 Towards a better understanding of fertility determinants: A major new survey The Eurobarometer is a very useful instrument to monitor public opinion but its rather small sample size (only 1000 respondents per Member State) makes it unsuitable for a more rigorous scientific analysis of fertility. A few years ago the United Nations Economic Commission for Europe (UNECE) took the initiative of collecting a new major international data set with a sample size of around persons per country to allow for a more structural and in-depth analysis of fertility. The project is called the Generations and Gender Project (GGP) 15 and will be used to study relationships between parents and children (generation) and between adults (gender). Participation is voluntary, but already 17 EU Member States have signed up or are thinking of participating in the near future. 15 See for more information EN 23 EN
25 2.3. Longevity Main trends in longevity Decreasing mortality at more advanced ages has become an important driver behind population ageing. Table 2.3 presents an overview of the trend in life expectancy at birth for men and women in the EU-27 plus Croatia and Turkey. Declining mortality results in the extension of life span, measured as the average life expectancy at birth, which is the number of years newborn babies may expect to live after going through the different stages of the life cycle at the currently prevailing mortality rates for each of these stages. Table 2.3 and 2.4 show that on average for the EU-25, European women may expect to live 81.8 years while the life expectancy for men is 75.6 years. Life expectancy is generally higher in the old Member States (82.4 and 76.7 for women and men, respectively) than in the new Member States (78.7 and 70.4 for women and men). The Baltic States report the lowest life expectancies along with very large gender differences (around 77 years for women and 65 for men). Relatively large gender differences are also reported for France and Spain (7-8 years). Overall, gender differences in mortality are nevertheless declining in the EU-25, as male mortality rates are falling to the levels observed for women. Table 2.3 Life expectancy, men 1960/ / / / / * 2050** EU EU NMS BE CZ DK DE EE EL ES FR IE IT CY : LV LT LU HU MT NL AT PL PT SI SK FI SE UK BG RO HR *** TR 50.3*** 55.0*** 59.0*** 64.0*** *** Source: Eurostat. * Preliminary or most recent. ** According to EUROPOP 2004, Baseline, data for France refer to metropolitan France only. *** UN Data. EN 24 EN
26 Table 2.4 Life expectancy, women 1960/64* 1970/ / / / ** 2050*** EU EU NMS BE CZ DK DE EE EL ES FR IE IT CY : LV LT LU HU MT NL AT PL PT SI SK FI SE UK BG RO HR *** TR 54.0**** 592**** 63.2**** 68.5**** **** Source: Eurostat. * Period average. ** Preliminary or most recent. *** According to EUROPOP 2004, Baseline, data for France refer to metropolitan France only. **** UN data Expected trends in longevity Future increases in life expectancy will depend mostly on declining mortality at higher ages. This translates into increasing life expectancy aged 60. Current mortality rates imply that a European man at age 60 has an additional 15 years to live, which is 20% of his total life span. A 60 year-old European woman may expect to live an additional 20 years which is 25% of her total life span. A major question is whether the future increase in life expectancy will consist of years in good health. This would allow older people to remain active on the labour market longer and reduce the period of dependency at the end of the life cycle. Healthy life expectancy adjusts life expectancy for time spent in poor health. It should be noted that this indicator is estimated on the basis of self-reporting. Cultural differences between countries can make inter-country comparisons misleading. Table 2.5 provides an overview of health life expectancy at birth in a number of EU countries. EN 25 EN
27 Table 2.5 Healthy Life Years Source: Eurostat New Cronos. (:) Not available. (e) Estimated value. (p) Provisional value. Males Females EU (e) 66.0 (e) Euro area : : BE 67.4 (e) 69.2 (e) CZ : : DK 63.0 (e) 60.9 (e) DE 65.0 (e) 64.7 (e) EL 66.7 (e) 68.4 (e) ES 66.8 (e) 70.2 (e) FR 60.6 (e) 63.9 (e) IE 63.4 (e) 65.4 (e) IT 70.9 (e) 74.4 (e) CY HU 53.5 (p) 57.8 (p) MT : : NL 61.7 (e) 58.8 (e) AT 66.2 (e) 69.6 (e) PL : : PT 59.8 (e) 61.8 (e) FI 57.3 (e) 56.5 (e) SE 62.5 (e) 62.2 (e) UK 61.5 (e) 60.9 (e) HR : : IS : : NO 66.3 (p) 64.2 (p) Since 1980 the average annual increase in life expectancy at birth in the EU-25 countries has been slightly under 2.5 months. There is general agreement among demographers that life expectancy will continue to rise, but there is no agreement on how fast and to what level 16. Some experts expect that life expectancy will continue to rise by 2 years per decade. They see no reason why this linear increase should ever stop. Others expect that the increase will slow down once a biological limit is reached. In addition, public health problems could also slow down or even reverse the trend towards a higher life expectancy. In several EU Member States, the average annual increase in life expectancy has been lower in recent years than in the previous decades. Another relevant issue is whether or not differences in life expectancy across European countries will become smaller. The latest population projection of Eurostat assumes that by 2050 life expectancy in the EU-10 will converge towards the level of the EU- 15, but a considerable gap of 3 to 4 years is projected to remain. One important factor explaining the increase in life expectancy during the last decades has been the strong decrease in mortality from cardiovascular diseases at late middle age. With most people now surviving to old age, any further substantial increases in life expectancy can only be achieved through a major reduction in mortality at advanced ages. Death at advanced age often cannot be attributed to one single disease, but rather to a general state of frailty 16 This section is based on: Future trends in mortality and life expectancies in the European Union, 2006, a policy brief prepared by Paul de Beer of the DEMO network of the SSO (forthcoming). EN 26 EN
28 leading to what is termed co-morbidity. Medical advances in the treatment of one disease may therefore lead to only a limited gain in lifespan as very old patients may die from another disease. Moreover, whereas medical progress and improved living conditions have led, and probably will continue to lead, to an increase in life expectancy, it is much more uncertain what the effect of lifestyle (smoking, diet, physical exercise, use of alcohol) will be. The decline in smoking since the 1970s and 1980s has had a favourable impact on life expectancy but the current increase in the prevalence of obesity may well have an adverse effect. Thus, even though medical advances may contribute to a further rise in life expectancy, unhealthy behaviour may have the opposite effect. Moreover, the effect of accumulating environmental risks is difficult to take into account. The latest 2005 figures from Latvia and Lithuania showed a drop in life expectancy. This shows that a downturn in life expectancy is still a real risk in some Member States Important longevity differences between socio-economic groups 17 The clearest and most striking difference in life expectancy is between men and women. In 2004, men in the EU-25 had a life expectancy 6 years shorter than that of women. By 2050 this gap is expected to have the narrowed by one year but the motto that men die quicker but women are sicker continues to apply as women have lower mortality risks but higher risks of disability when growing older. The main causes of death of persons over 65 are cancer and cardiovascular disease, together accounting for three quarters of all deaths in almost every European country. Given that the incidence of most chronic conditions rises with age, older people often suffer from several chronic conditions at the same time, requiring complicated and labour-intensive long-term care solutions. A still largely underestimated chronic condition affecting 10-15% of persons over 65 in Europe is depression. Older people suffering from depression are more likely to have multiple chronic illnesses and more likely to face limitations in their daily living. Depression is also a major cause of suicide among older Europeans. A large part of the observed differences in life expectancy between EU-15 and EU-10 countries is due to preventable mortality (from causes that can be avoided by effective intervention, e.g. lifestyle factors or accidents) or treatable mortality (caused by conditions for which effective medical treatments are available). Persons with a lower socio-economic status and/or education have on average a lower life expectancy which to a large extent can be explained by the basis of structural factors such as a more stressful life and an unhealthier lifestyle. Good health in old age is the result of genetic predisposition as well as lifestyle factors such as healthy diet, refraining from smoking, engaging in physical exercise and avoiding excessive alcohol use. 17 This section summarises some of the conclusions that can be found in the The State of ageing and health in the EU by the International Longevity Centre-UK and The Merck Company Foundation, June EN 27 EN
29 2.4. Migration Overview of migration trends The third main driver of demographic change and in our developed societies also the most volatile one is international migration. In the second half of the 20 th century, large parts of Europe witnessed a historical change from emigration to immigration. The exact number of migrants residing in Europe is unknown, partly due to the fact that many European countries collect data on nationality rather than the place or country of birth, thus making it impossible to identify first-generation immigrants after they have obtained the citizenship of their host country. For the year 2005, the United Nations has estimated that there are about 40 million migrants in the EU-27 Member States see Table 2.6. About 3% of these migrants are refugees. Europe has a much higher share of migrants (8.8%) in its total population of 728 million than is generally found in the less developed regions of the world (1.4%) while the opposite is true for refugees. In 10 EU Member States, the share of the foreign-born population is estimated to be higher than 10%. Table 2.6 International Migration Migrant Stock 2005 Refugees 2004 Number*1000 % of population Net Migration Average Number*1000 Number*1000 % of population Developed regions Less developed regions EU BE CZ DK DE EE EL ES FR IE IT CY : : : : : LV LT LU HU MT NL AT PL PT SI SK FI SE UK BG RO EN 28 EN
30 Source: United Nations, Department of Economic and Social Affairs, Population Division, Figure 2.3 shows that net migration into the EU reached a peak of almost 2 million in 2003/2004. Figure 2.4 shows the main destinations of the migration flows. The flows for Italy and Spain, which accounted for almost two thirds of the total, were heavily impacted by decisions to regularise illegal migrants. If immigration were to remain at this high level, then the EU s working age population would continue to grow until around 2030, rather than already starting to decline in 2011, as is currently assumed in the baseline scenario of the Eurostat population projection. Movement of persons inside the EU could potentially also affect demographic development in individual Member States. The recent enlargements of the European Union have led to a short-term increase in migration from the new Member States in particular towards the UK and Ireland (see section 4.5 for more discussion of this topic). Figure 2.3 Net migration into the EU-25 (projected from 2005) Source: Eurostat, National data. Notes: Net migration is defined as the population change not attributable to births and deaths. Direct observations of immigration or emigration flows are not available or not sufficiently precise. Corrections to population figures are included in this indicator. EN 29 EN
31 Figure 2.4 Annual Crude Net Migration Rate (Average , in thousands) Source: Eurostat, National data. The ageing of the population also entails the ageing of the workforce, as well as an imminent decline in both the workforce and the population. According to the latest Eurostat population projection, the population aged is going to decrease by one million annually after These trends are likely to generate major labour market bottlenecks and skills shortages, which will act as a major pull factor for international migration into the European Union. At the same time, the continuing high population growth in Europe s neighbourhood, especially in Africa, combined with poor economic performance and political instability, could act as a strong push factor. Figures from the year 2000 show a total GDP for the EU almost 10 times greater than the combined GDP of sub-saharan Africa. In comparison, GDP for North America was approximately 3 times larger than that of Central and South America. More migration is also likely to follow as a result of globalisation and the creation of transnational communities. Interestingly, the gender imbalance in international labour migration seems to be shifting, with male domination (around two thirds) falling in most countries, signalling the pull effect of the increasing feminisation of labour markets in the developed world Relative contribution of migration and fertility to population growth Although international migration may play a crucial role in solving future labour market shortages, its impact on population ageing is likely to be small. Scenario calculations by the United Nations have shown that to halt, let alone reverse, population ageing, truly massive and increasing flows of young migrants would be required 18. For example, to keep the age structure in Germany unchanged, over 3 million migrants per year would have to be admitted. Clearly, increased immigration cannot prevent ageing, but it can realistically contribute to alleviating labour market bottlenecks. Furthermore, a comparison between the natural rate of 18 Replacement migration: is it a solution to declining and ageing populations, UN population division, New York, 2000, EN 30 EN

32 population growth and the migration rate in Figure 2.5 shows that in several Member States, immigration has already been helpful in postponing population decline. Figure 2.5 Net Migration and Natural Population Growth (average ) Source: Eurostat Note: Figures exclude intra-eu flows and include regularisations of previously undeclared migrants. Scenario calculations that compare the outcomes for different assumptions show the relative importance of changes in fertility versus migration for the future changes in the population. For example, Eckart Bomsdorf and Bernard Babel have conducted an interesting sensitivity analysis for Germany 19. They find that a total extra increase in the German population of 2.5 million by 2050, as compared to the baseline scenario, which assumes a decline of 12 million with other factors remaining unchanged, could be achieved in any of the following three ways 20 : - An increase in the TFR by 0.1 (which in 2003 stood at 1.35); - An increase in life expectancy by 2.67 years (which in 2003 stood at 75.3 and 81.3 for men and women respectively); - An increase in annual net migration by persons (which in 2003 stood at ). Table 2.7 below compares the results for fertility and migration in a comparative way. Table 2.7 Change in the German population by 2050 (in 1000 persons) compared to the baseline projection, due to a 10% or 20% change in fertility and in net migration Change in % -20% -10% 10% 20% - in the Fertility rate Bomsdorf E. and B. Babel, Wie viel Fertilität und Migranten braucht Deutschland?, HWWA, 85 th year, Vol. 6, June For reasons of simplicity the effect of the change in base ( Sockel ) migration was ignored. This effect is relatively small and results from the average age of emigrants being higher than those of immigrants. EN 31 EN
33 - in the Net migration Source: Bombsdorf and Babel, see footnote 19. These scenario calculations forcefully illustrate that, over several decades, even small changes in fertility can have a sizeable impact on future demographic development Cohort effects: the baby boom Demographic developments are also strongly influenced by variations in cohort sizes. The large cohorts that were born between 1945 and 1965, in what is known as the baby boom, form a large bulge in the population that is gradually working its way through the overall age structure. At present, the baby boom cohorts are still part of the working age population, which, as a result, currently represents a large proportion of the total population. The share of the European population in working age is expected to peak at 67% by the end of The fact that large cohorts boost the working age population has been described as a demographic dividend 21. The retirement of the baby boomers will compound the increase in the old-age dependency ratio (i.e. the number of persons over 65 divided by the number of people aged between 15 and 64) which results from rising life expectancy and low fertility rates. Figure 2.6 below presents the differences in the annual growth rates of the total population and the population of working age for a number of European countries. After 2010 the difference in most countries will turn negative, signalling the end of the demographic dividend. The baby boom in Southern Europe emerged later than in Northern and Western Europe as a result of which the boost in the working age population was delayed. In all three parts of Europe it is expected that the difference in growth rates will turn negative after The baby boom effect in the Central European Member States has come later and been somewhat more subdued. 21 See also the VID/IFS Walter demographic impact study. EN 32 EN
, Walter demographic impact study,")
34 Figure 2.6 Difference between the growth rate of the working age and total populations, Prskawetz, A., Th. Lind et al. The relationship between demographic change and economic growth in the EU, VID and IFS (Institute for Future Studies), Walter demographic impact study, forthcoming, EN 33 EN
35 Source: A. Prskawetz, 2006, see footnote The EU-27 population projection The results of the latest Eurostat population projection for the EU are based on a series of assumptions about future trends in fertility, mortality and migration. The total population for the EU-27 is projected to shrink from million in 2004 to million in Figure 2.7 below shows how the form of the age pyramid is expected to change as the bulge representing the baby-boom cohorts becomes older. 23 Aggregate projections were originally only presented for the EU-25, but will be adjusted to the EU-27 to the extent feasible. EN 34 EN
36 Figure 2.7 Age pyramids for the EU-25 population in 2004 and 2050 Age Males Females Age Males Females Source: Economic Policy Committee and European Commission, population in 2050 according to the Ageing Working Group Scenario (2006). EN 35 EN
37 Fertility rates in the baseline scenario are assumed to rise from 1.5 in 2004 to 1.6 by 2030 and to stay constant around that level until Fewer births eventually translate into smaller cohorts of young persons entering the labour market, especially when compared with the much larger older cohorts leaving for retirement. Life expectancy at birth has increased by 8 years since 1960 and is assumed in the projections to rise by 6.3 years for males to 81.7 and by 5.1 years for females to 86.8 between 2004 and Moreover, longer life expectancy will dramatically increase the numbers of persons reaching very old ages (80+) from 18 million in 2004 to nearly 50 million in By 2050 the differences in life expectancy between the old Member States (87.3 and 82.3 for women and men respectively) and the new Member States (84.1 and 78.6 respectively) are predicted to become smaller, especially for men. Net migration inflows are assumed on average to fall from an estimated 1.3 million people in to some people annually between 2015 and 2050 (an annual net migration rate of 0.2% of the population). Although net inflows of migrants are projected to accumulate to some 40 million people between 2004 and 2050, they are insufficient to prevent population decline, let alone stabilise the age structure of the population. These demographic forces will cause the total population in the EU-27 in 2050 to be slightly smaller and much older Changes in the population structure According to the baseline projection the median age in the EU will increase from 39 to 49 years between 2004 and The number of young people (age 0-14) in the European Union will continue to decline in absolute terms from around 100 million in 1975 to some 66 million by the year Their share relative to the working-age population (the young-age dependency rate) will, however, rise slightly from currently 24% to 26% in the EU-25. The population of working age (15-64) will be most numerous around the year 2010 (331 million) and will subsequently decline to about 268 million by The population aged 65 and over will continuously increase from currently 86 million to 141 million by Its size relative to the working age population in the EU-25 (the old-age dependency rate) has increased from 20% in 1975 to currently 25%. It is projected to double to 51% by This means that the EU will move from having four to only two persons between 15 and 64 for every citizen aged 65 or above. See also Table 2.8 below. 24 Actual realised net migration into the EU was almost 2 million due to large regularisations in Spain and Italy. EN 36 EN

38 Table 2.8 Population in three age groups, absolute numbers (millions) / years EU EU NMS years EU EU NMS years EU EU NMS Source: 2005 Demographic monitor of the SSO. Ageing is not going to affect the Member States of the EU in a uniform way. Figure 2.8 shows that there are relatively young and old Member States. Moreover, a ranking of Member States by the old-age dependency ratio, as in Figure 2.8, reveals significant changes reflecting in particular the differences in assumed fertility rates. Figure 2.8 Projected old-age dependency ratio by Member State for selected years, baseline variant of the Trend scenario The relative share of the population aged 80 and over to the working age population will increase even more sharply: from the current 6% in the EU-25 to 20% by EN 37 EN
39 Projection methods 25 Currently the most popular way of handling uncertainty is to present alternative variants (e.g. high and low fertility) around a baseline scenario or benchmark projection. This scenario approach was also used by Eurostat for its latest EU population projection in One can then study a given policy problem under each variant. It is, a priori, hard to determine what aspects of future demographics should be varied and by how much. Alternative scenarios should be based on clearly distinct and plausible storylines. This would force the user of a projection to choose the picture of the future that is considered to be the most plausible. When several parameters are used for projections, however, the number of alternative scenarios can become very large and it may not be possible to determine which scenario is the most meaningful. Some researchers therefore advocate another approach to demographic projections which takes uncertainty about the future more explicitly into account. The idea is to do stochastic or probabilistic projections to produce a realistic range of different population paths that fall within a meaningful confidence interval. Stochastic projections are, however, computationally more demanding and for the user more difficult to comprehend. BOX 2.2 Base year data problems and high-quality population data During the first 20 years of the projection period, projections are quite reliable, in particular for the working age population, provided no major mistakes are made in the starting or base year. In the previous projection, such mistakes were made in the Spanish base year migration data, which made the projection go off the mark within only a few years. This shows that the availability of recent high-quality population data is essential for reliable population projections. Population registers that cover all the population and are continuously updated by legally controlled administrative procedures provide the best basis for such population data. Countries relying on censuses are in a weaker position due to errors in both registration and the census itself. The main problem in most EU population systems is the recording of outmigration. Because being registered is frequently a precondition for the opening of bank accounts, entitlement to subsidised or low-cost social and health services, etc., there are incentives for incoming migrants to register in their new country/region/municipality. In most cases, however, there are no incentives to deregister at the old place of stay. One solution would be to have details of all in-migration records in the population registers of destination countries/regions/municipalities sent back to the registers of the original place of stay. Such a system has been in use within and between the Nordic countries and functions well. 25 See the Walter demographic impact study by ETLA on population projections. EN 38 EN

40 An estimate of projection uncertainty for the EU-25 How large the uncertainty of a population projection may become after 20 years is shown below in Figure 2.9. This is taken from an interesting example of a stochastic projection for the EU-25 prepared by IIASA and the VID 26. The blue segment indicates the confidence interval in 2020, the green segment that in 2030 and the dark yellow segment the one in The population pyramid of 2050 indicates that the projections for the number of persons below 30 and over 70 are much more uncertain than for the number of persons of intermediate age. The future size of the intermediate age groups is to a large extent, apart from migration, determined by the population momentum of those already born. The number of middle-aged persons is less vulnerable to mistakes made in fertility and mortality assumptions. Figure 2.9 Uncertainty intervals of a probabilistic population projection for the EU 25 in 2050 Source: S. Scherbov and M. Mamolo, 2006, Vienna Institute for Demography, see footnote Scherbov, S. and M. Mamolo, Probabilistic population projections for the EU-25, VID European Demographic Research Papers, No 1, EN 39 EN
41 2.7. The regional dimension of population change While it may still be one or two decades before the impact of ageing becomes clearly visible at the level of an entire country, the impact of ageing and population decline (notably due to migration) can already be observed at regional level. The main recent trends identified by Eurostat 27 at regional level can be summarised as follows: In the north-east of the European Union the population is decreasing. Most affected by this decline are eastern Germany, Poland, the Czech Republic, Slovakia and Hungary, the three Baltic States and parts of Sweden and Finland. Many EU regions have been experiencing a negative natural population change since the beginning of the decade (i.e. more people have died than have been born). This negative pattern predominates in Germany, the Czech Republic, Slovakia, Hungary, Slovenia and adjacent regions, as well as in the Baltic States and Sweden to the north and Greece in the south. Ireland, France, the three Benelux countries and Denmark are mostly experiencing a natural increase in the population. In some regions, a negative natural change has been offset by positive net migration. This is most conspicuous in western Germany, eastern Austria, the north of Italy, Slovenia, as well as the south of Sweden and regions in Spain, Greece and the United Kingdom. The opposite is much rarer: in only a few regions (namely in the north of Poland), has a positive natural change been offset by negative net migration. Figures 2.10 and 2.11 below present, respectively, the change in population between 2000 and 2030 at regional NUTS 2 level for Europe and a breakdown of this change. 27 Eurostat Statistical Yearbook Regions, EN 40 EN


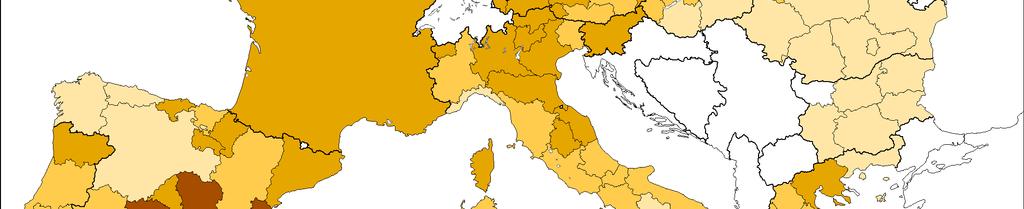
42 Figure 2.10 Relative change in population EN 41 EN


43 Figure 2.11 Components of population change EN 42 EN
44 Demographic ageing is especially evident in the predominantly rural regions of some Member States, notably Portugal, Spain, Greece, Italy, Germany and France, where the proportion of people over 65 is high.moreover in Germany, the Nordic and Baltic countries and in Southern Europe, strong rural-urban migration of females in the economically active age groups results in a high degree of masculinisation of the rural population 28. The increasing importance of regional and local public authorities as policy initiators and service providers will compel regions to include the effects of long-term population trends in their regional medium-term strategies. A number of regions have already been active and are at the forefront of strategic thinking and actions in relation to the demographic challenge 29. The Union s Cohesion Policy provides a valuable tool for Member States to adapt their regional and national economies to the challenges of ageing. The Structural Fund programmes and the European Agricultural Fund for Rural Development (EAFRD) have already supported many projects addressing aspects of demographic change. These include successful initiatives to cope with depopulation in urban, rural and sparsely populated areas, initiatives to encourage migration to depopulated areas, fighting discrimination and promoting gender equality and making regions more attractive places to live in. Regions which expect their population to decline are encouraged to work with support from the Structural Funds on policies to mitigate the effects of this anticipated trend and secure the quality of life of the remaining population. BOX 2.3 The impact of demographic change on a region: the case of the Free State of Saxony (Germany) 30 A very impressive example of a regional response was given by Georg Milbradt, Prime Minister of Saxony, at the First European Demography Forum. The population of Saxony has been shrinking since In 1950, it had 5.7 million inhabitants; in 2005 this number had fallen to 4.3 million. The projection for the year 2020 is 3.8 million. After German reunification in 1989, the number of births fell by more than 50% and a few years later nursery schools, kindergartens and primary schools had to be closed because of a lack of children. These small cohorts have now reached the secondary and vocational school age and universities will be affected next. Although birth rates have since recovered, they have not regained their old level. The initial drop in birth rates will in the future be compounded by the exodus of young people. Many high-skilled young people, in particular women, are leaving Saxony to study or work elsewhere in Germany. The working age population will shrink approximately twice as much as the overall population and firms in Saxony are already having problems finding sufficient numbers of qualified young professionals to replace retiring staff. The shortage of qualified staff is going to get worse during the next three or four years when the large baby 28 See 'Study on Employment in Rural Areas' (SERA) at 29 See also the Joint Declaration of European regions Facing demographic change as a regional challenge presented at the 2006 Forum to Commissioner Spidla, 30 Based on the presentation of the Prime Minister of Saxony Prof. Georg Milbradt at the First European Demography Forum in 2006, see EN 43 EN
45 boomer cohorts start to retire. The shortage of qualified labour will hamper Saxony s economic growth prospects. The population decline has led to decreasing utilisation of the region s infrastructure. Already more than housing units are permanently empty, out of a total of 2.3 million. Water and sewage systems are used far below their normal capacity, resulting in hygiene problems and increasing costs per capita. The number of elderly persons in institutional care is growing rapidly resulting in a sharp increase in health and nursing expenditure. At the same time, budget revenue will decrease by nearly a quarter up to Even though Saxony does not intend to take on any new debt from 2007 onwards, public debt per capita is expected to increase. However, Saxony has anticipated the negative consequences of ageing and emigration and has started to adapt. Mr Milbradt gave two examples. Saxony has started to reconstruct its cities by demolishing empty housing units, with a target of units by Local authorities are required to adjust their urban planning to a shrinking population. Saxony has also begun to downsize its administrative structures. Saxony needs to ensure that it remains an attractive place for business and to make sure that nobody will fall behind. The main challenge, as Mr Milbradt sees it is to ensure access to education and healthcare all over Saxony (...) without producing any additional debts. Mr Milbradt pleaded for a new way of thinking in which the universal growth paradigm is replaced by a limited number of strong local growth centres against the backdrop of an otherwise shrinking periphery. Only with such a strategy will it be possible to focus the limited available resources. Saxony has started to apply a demographic test to all its laws and funding programmes. In spite of its shrinking population Saxony hopes to remain one of the most dynamic regions in Germany, and, so far, it has been able to maintain its economic growth Global demographic trends Europe s place in the global population According to the United Nations, the world s population increased during the 20 th century from 1.6 to 6.4 billion. In the next half century the UN expects a further increase to 9.1 billion 31. Demographic shifts will not change the ranking of the major world regions according to population size. The EU-25 with 456 million inhabitants currently ranks third after China (1.3 billion inhabitants) and India (1.1 billion), followed by the United States with 300 million inhabitants. In 2050, the EU-25 will still be in third place with 450 million, after India (1.6 billion) and China (1.4 billion) and before the United States with 395 million inhabitants. But the EU is the only major world region where the total population is projected to decline in the coming four decades. In many developing countries, population growth rates are still very high due to birth rates well above the replacement level and a very young age structure. For this reason, the population in these countries is likely to double over the coming decades, which explains why the world population is expected to increase from its current 6.4 billion to 9.1 billion by There are, however, more and more countries in which birth rates have now fallen well below the replacement level and where the population is ageing 31 Based on the 2003 UN world population projection. The 2004 update published in 2005 led to only small changes. EN 44 EN
46 rapidly. For these countries a future of even more rapid population ageing and, in many cases, a shrinking total population size is expected. Because of these significantly different trends between various parts of the world, there is still simultaneously concern about the negative consequences of rapid population growth and, in other parts of the world, about the negative implications of rapid population aging. The demographic divide does not always coincide with the traditional split between industrialised and developing countries. Some developing countries have recently seen very rapid fertility declines, and the number of poor countries with sub-replacement fertility is increasing. China is the most prominent example: fertility has recently fallen to an (uncertain) level between 1.4 and Over the next two decades China will see both significant further growth and the beginning of significant population ageing, i.e. doubling the present low oldage dependency ratio to 15%. However, it is expected to grow by another 200 million people due to the momentum caused by the very young age structure, which will lead to a further increase in the number of women of reproductive age. At the same time, the one-child family policy can be expected to result in a rapidly increasing share of older people in the total population. During the first part of this century a significant number of countries will simultaneously experience population growth and aging. This will be the case with the USA which, unlike Europe, is expected to continue to grow significantly thanks to high immigration and higher birth rates than in Europe. Figure 2.12 below illustrates these trends in population growth rates for different parts of the world from 1950 to 2050, based on UN data estimates and projections. It shows that Europe consistently has the lowest annual population growth rate of all continents, falling from 1% per year in 1950 to zero growth at the moment and shrinking at an expected rate of 0.5% by The figure also shows that even Africa is beyond its peak in growth rates. North America, which saw fairly stable population growth of around 1% from 1965 to the present, is expected to decline only moderately in the future. By 2050 the UN expects North America to have a higher population growth than Latin America, and higher than the world average. 32 See also the presentation of Mr Juwei Zhang of the Chinese Institute of Population and Labour Economics at the recent Demography Forum EN 45 EN
47 Figure 2.12 Average annual population growth rates of selected world regions, Source: United Nations (2003) (medium variant). Table 2.9 gives an overview of trends in mortality and fertility in the main regions of the world. Over the past half century, life expectancy has increased considerably in all parts of the world. Only in Africa has the HIV/AIDS epidemic in particular slowed down the improvement in life expectancy. In some of the hardest hit countries there has even been population decline. The UN assumes for the future a recovery in Africa, along with a continued increase in life expectancy in all parts of the world. Table 2.9 Life expectancy at birth and total fertility rates for selected world regions ( ) Life Expectancy at Birth (both sexes) Total Fertility Rate Region Africa Eastern Asia Southcentral Asia Western Asia Europe Latin America & Caribbean Northern America WORLD Source: United Nations (2003) (medium variant). EN 46 EN
48 Fertility rates have also declined considerably in all world regions. The European region has the lowest TFR at 1.4; Africa is at the other extreme with an average rate still close to 4.9. For the coming decades, the UN assumes a continued decline in fertility for the whole world with the exception of Europe, where at least a partial recovery is expected from the projections Population trends and challenges in Europe s neighbourhood 33 The Mediterranean Sea represents one of the sharpest demographic divides in the world. Greece, Italy and Spain, which have among the lowest fertility rates, are ageing rapidly and will see their populations shrink, while the countries on the southern rim have some of the most rapidly growing populations. Although fertility rates have been falling in Northern Africa, its population is still growing fast due to the population momentum generated by the very young age structure. A comparison of population trends in Italy and Egypt over a 100-year period is very striking. In 1950 Egypt had less than half the population size of Italy, but the population grew so fast that by the early 1990s both countries were of equal size. Over the coming decades Italy is expected to start shrinking, while Egypt will continue its rapid population growth. The fertility decline in Egypt seems to have slowed (or even stalled) at a level above three children per woman. But even if the decline continues, Egypt s population may still double so that by 2050 it is likely to be about three times that of Italy s. On the Eastern border of the EU the situation is very different (see Table 2.10 below). There are huge income differences compared with the EU but the demographic trends are quite similar. In most eastern European countries, the political and economic transition since 1990 has caused a very rapid decline in fertility to levels that are even lower than in the new Member States. In addition, these countries are confronted with net migration losses, which means that they face the prospect of significant shrinking and ageing of their populations. Table 2.10 Main demographic indicators in neighbouring countries of the EU Total Population (1.000) Countries TFR Life Expectancy at Birth The Eastern Neighbours Percentage aged 0-14 Percentage aged 60 and above Russian Federation Turkey Ukraine The Southern Neighbours Algeria Egypt Morocco Syrian Arab Republic Tunisia Wilson, Ch., La transition démographique en Europe et en Méditerranée. In Paul Sant Cassia et Thierry Fabre (eds), Les Défis et les Peurs: entre Europe et Méditerranée, Actes Sud/MMSH, November 2005, pp EN 47 EN
49 Source: United Nations Population Projections of 2003 (medium variant) The demographic contrasts between Europe and its southern neighbours strongly suggest that strong migratory pressures will persist over the coming decades. The differences in expected population growth combined with huge differences in standards of living constitute a strong push factor for emigration towards the EU. In the Eastern European countries a comparable demographic push factor does not exist, but significant migration flows could result from dissatisfaction with economic and political conditions. EN 48 EN
50 3. THE ECONOMIC AND SOCIAL IMPACTS OF DEMOGRAPHIC CHANGE 3.1. Introduction At present, the baby boom cohorts are still of working age, but within a few years they will start retiring. This will lead to a decline in the population of working age and a rapid increase in the number of pensioners. As the baby boomers grow older, they will also require more health and long-term care. Ageing will thus lead to increasing demands on social protection systems (pensions and health/long-term care) while the potential labour force will be declining. The impact on public finances of these trends has been examined for the EU-25 Member States by the European Commission and the Economic Policy Committee (EPC) in a comprehensive projections exercise based on the latest EUROSTAT population projections Employment trends Although the population of working age (aged 15-64) is already expected to decline from 2011 onwards, total employment in the EU-25 is expected to grow up to 2017 thanks to rising labour force participation. According to the projection, which is based on current policies, the overall employment rate of the EU-25 would rise from 63% in 2004 to 67% by 2010 and to 70% by 2020: the EU would thus reach the overall Lisbon employment target, but ten years behind schedule, see figure 3.1. The projected increase in the employment rate will occur for two main reasons: 1. Female employment rates are projected to rise from just over 55% in 2004 to almost 65% by 2025, remaining stable thereafter. The increase will come for the most part from cohort effects: older women with low participation rates will be replaced by younger women with a higher educational attainment and consequently a stronger attachment to the labour market; furthermore, policies to increase the availability of child care and other family-friendly measures will also have a positive effect; 2. The employment rates of older workers are projected to increase massively from 40% in 2004 for the EU-25 to 47% by 2010 and 59% in This increase in the employment rate of older workers, observed since 2000, marks a significant reversal of the decades-long trend towards earlier withdrawal from the labour force. Older workers have accounted for three-quarters of all employment growth in the EU in recent years, and about half of the projected increase is due to the positive effects of recent pension reforms that have curtailed access to early retirement schemes and improved financial incentives for older workers to remain in the labour market. 34 See The impact of ageing on public expenditure: projections for the EU-25 Member States on pensions, healthcare, long-term care, education and unemployment transfers ( ), European Economy, Special Report, No 1, For the assumptions underlying the projection, see The 2005 EPC projections of age-related expenditure ( ) for the EU-25 Member States: underlying assumptions and projection methodologies, European Economy Special Report, No 4, 2005: EN 49 EN
51 Figure 3.1 Projected employment rates and Lisbon targets Total Female Older workers Lisbon target (p) 2020 (p) 2050 (p) (p) 2020 (p) 2050 (p) (p) 2020 (p) 2050 (p) Source: European Commission. In figure 3.2 three phases can be distinguished: 1. Between 2004 and 2011, there is scope for significant employment and economic growth as both the population of working age and employment rates are expected to increase. 2. Between 2012 and 2017, rising employment rates can offset the decline in the size of the working-age population brought about by the baby boom generation entering retirement and being replaced by much smaller younger cohorts (due to the decline in fertility). The overall number of persons employed in the EU will continue to increase, albeit at a slower pace, and this period could be characterised by tightening labour market conditions. 3. After 2018, the ageing effect will dominate. By then, the cohort trend towards higher female employment rates will broadly have come to an end putting an even higher pressure on active measures to increase employment among women In the absence of further reforms to increase the labour force participation of older workers (and raise the effective retirement age), no significant further increases in the employment of older workers can be expected either. Consequently, the declining size of the working age population must be expected to translate into declining total employment and reduced growth prospects. Having increased by some 20 million between 2004 and 2017, employment during this last period is projected to contract gradually by almost 30 million until The demographic dividend of the baby boom (i.e. the fact that these large cohorts are of working age) combined with the current positive employment rate trends constitute a window of opportunity lasting until about 2017, in which structural reforms to prepare for the longer-term impact of ageing can be pursued under relatively favourable growth conditions. At the same time, differences in employment rates between urban and rural areas will remain vital and significant. This especially concerns the participation of women and young people in the labour markets. The continued modernisation and restructuring of Europe s agricultural EN 50 EN
52 sector will place a heavy burden on many rural areas and will create challenges to their development, such as the risk of exclusion associated with lack of skills and low incomes and the management of the restructuring process. Figure 3.2 Projected working age population and total employment, EU-25 Source: European Commission Ageing of the labour force and labour market bottlenecks A recent study 35 for the Commission looked at possible imbalances in the labour market during the next decade given the expected slow growth or even decline in the working age population and the ageing of the workforce. The focus was on the demand for labour by education/skill level and by sector and on the supply of labour to meet this demand. Future labour demand and supply in 2014 were projected assuming that the trends observed between 1994 and 2004 will continue. The study finds that labour demand will increase relative to supply for the more highly educated people, especially in the EU-10. At the same time there will also be considerable replacement demand for less skilled people, especially in EU-15 countries. See also figures 3.3 and 3.4 below. The study underlines that policy needs to focus on expanding the number of persons with tertiary education not just in the new Member States but also in states where demand is projected to run ahead of supply (for example Denmark, Germany, Spain, Italy, the Netherlands, Finland and Sweden). The study also highlights that policy must focus on ensuring that employment rates are increased among women and those over 50. Moreover, higher employment rates among women and older workers need to be supported by ensuring lifelong access to suitable training and by providing support in the form of childcare and elderly care to make it possible for people to work. Given that low-skilled jobs are not going to disappear there could be future bottlenecks in the commercial services and in the health and long-term care sectors. This could perhaps be avoided by improving the attractiveness of less qualified jobs, not only in terms of pay but also in terms of general working conditions. In the UK for instance, the employment rate of 35 The implication of demographic trends for employment and jobs, Walter demographic impact study by Alphametrics Ltd for the European Commission, November 2005, see EN 51 EN
53 low-skilled women is (surprisingly) lower than the EU average even though the average employment rate for women in the UK is above the EU average. This is probably caused by a lack of affordable child care for women in this category. This evidence of the need to improve the attractiveness of low-skilled jobs confirms the present direction of the European Employment Strategy, which is as much concerned with job quality as with getting more people into work. The expected demand for less-skilled workers may also imply a need to reconsider immigration policy. Figure 3.3 Projected required increase in employment rates among those with tertiary education in the EU-15 and NM-7 in 2014 % of population in each age group Men, Women, Men, Women, Men, Women, Men, Women, EU-15 NM-7 Figure 3.4 Projected required increase in employment rates among those with low education in the EU-15 and NM-7 in 2014 % of population in each age group Men, Women, EU-15 Men, Women, Men, Women, Men, NM-7 Women, Source: Alphametrics 2005, see footnote 35, country-level results are presented in an annex to this chapter. EN 52 EN
54 BOX 3.1 Public preferences for how to best tackle potential labour force shortages The 2006 Eurobarometer on fertility and ageing 36 contained a question concerning possible solutions to the future problem of shortages in the workforce due to population ageing. The most popular solutions in the EU-25 are a switch from part-time to full-time working (around 15% of the answers) and raising the labour force participation of women (14% and 20% of responses among men and women, respectively). The idea that a higher number of children per family will ease the problem of shortages in the workforce also receives relatively strong support (15%). An increase in the number of working hours per week receives the fewest mentions (5%). In addition, increasing the legal retirement age or the number of immigrants from non-eu countries is not very popular either (slightly more than 5% of respondents chose these options). Which of the following suggestions aimed at solving potential shortages in the workforce do you agree with most? (% of respondents in the EU agreeing with the suggestions, maximum of two choices) Discouraging early retirement Raising the legal retirement age Encouraging people to have more children Encouraging immigration of workers from outside the EU Encouraging part-time workers to change to fulltime work Increasing the number of legal weekly working hours Encouraging non-working women to participate in the labour market None Men Women Other DK Source: Eurobarometer Testa M. R. Childbearing preferences and family size issues in Europe, VID Report on the special Eurobarometer, No 253, wave 65.1 and 65.31, TNS Opinion & Social for the EC, EN 53 EN
55 Ageing, productivity and prospects for economic growth Falling employment levels as a result of a shrinking working-age population will act as a drag on economic growth. Using prudent assumptions for the evolution of productivity based on trends observed in recent decades, the Economic Policy Committee and the European Commission project that the EU-25 will see a decline in the annual average potential GDP growth rate from 2.4% in the period 2004 to 2010 to only 1.2% in the period For the EU-10, the decline is much steeper, in part due to their less favourable demographic prospects. For the EU-15, labour productivity is on average projected to be 1.7% for the period 2010 up to A higher productivity rate is projected for the EU-10 countries: on average 3.1% for the period and 1.9% between 2031 and 2050, thus allowing them to converge towards the level of economic performance in the EU-15 Member States. Bringing together the labour force projections and the assumptions about future productivity growth allows for a projection of future GDP growth rates (see also figure 3.5). For the EU- 15, annual average potential GDP growth rate is projected to decline from 2.3% in the period to 1.3% between 2031 and For Euro area countries such as Germany, Greece, Spain, Italy, Austria, Italy and Portugal, potential annual growth rates are expected to drop to only 1%. An even steeper decline is foreseen in the EU-10, from 4.3% in the period to 0.9% between 2031 and 2050, reflecting their less favourable demographic prospects. EN 54 EN
56 Figure 3.5 Projected (annual average) GDP growth rates in the EU-15 and EU-10 and their determinants (employment/productivity) 5 EU Labour productivity growth and Employment growth GDP growth Labour productivity growth Employment growth GDP growth GDP per capita growth S i 14 S i EU Labour productivity growth and Employment growth GDP growth Labour productivity growth Employment growth GDP growth GDP per capita growth -1 Source: European Commission The impact of ageing on future productivity Once employment has stopped growing (due to a shrinking working age population and employment rates levelling out), the only source of GDP growth will be productivity. Several commentators have suggested that an individual s productivity may decline with age, and that consequently a rising share of older workers in the labour force would automatically reduce overall labour productivity in the economy. It is also feared that older workers may be less likely to embrace innovation, more resistant to the introduction of new technologies and that ageing societies may also be less inclined to make long-term investments, notably in education and R&D. Recent simulation analysis carried out as preparatory work for the joint European Commission Economic Policy Committee projections shows that the negative effect of a EN 55 EN
57 change in the age structure of the population on productivity is likely to be fairly limited. While it is accepted that an individual s labour productivity is expected to decline after the age of 55, a very strong fall in the productivity of older workers compared with that of primeage workers would be required to significantly depress total labour productivity. On the basis of the current evidence, such an outcome appears rather unlikely. Macro-simulations show that to get a 5% decline compared with the baseline productivity level (i.e. a 0.1 percentage point decline in annual average productivity growth rates) one would need to assume that the productivity of those aged and respectively is only 70% and 50% of that of prime-age workers, which is obviously very pessimistic. It is important to recognise that productivity is much more than a simple property calculated by summing up individual inputs: it is rather a system attribute that cannot be separated from its social context. Changes in the educational and age composition of the workforce are the central explanatory factors for productivity growth. Ultimately, it is the composition of human capital in combination with technology that determines the growth potential of an economy. This macro-finding of the European Commission, Directorate-general for Economic and Financial Affairs is more or less confirmed in a recent micro-productivity study that was carried out for the European Commission 37. The study found an inverted U-shaped relationship between individual productivity and age and also found, for most workers but not for all, significant decreases in productivity after the age of 50. The reason for this is likely to be age-related reductions in cognitive abilities, while experience can boost productivity up to a point beyond which additional tenure has little effect. Older persons become less quick (dexterity) and may experience a decline in their memory and reasoning abilities, see table 3.1 below. In addition, senior workers may also find it more difficult to adjust to new ways of working. Table 3.1 Average ability measured as deviation and scaled by standard deviation from ability levels of year-olds Age Numerical ability Managerial ability Clerical perception Finger dexterity Manual dexterity Experience Source: Impact of population ageing on innovation and productivity growth in Europe, see footnote 37. Educational attainment clearly has a strong effect on productivity and could very well compensate for the negative effects of ageing on productivity in the longer run. The study found that an extra year of education could increase productivity by 20%, which is larger than the 8-10% that is typically found in the literature. On the basis of mining and manufacturing data from Sweden, the study found that in some local labour markets the productivity of year-old workers was in fact continuing to increase. The older workers were not as productive as prime-aged workers but they were 37 This section is based on The Impact of Population Ageing on Innovation and Productivity Growth in Europe, Walter demographic impact study by VID and IFS, November 2005, see EN 56 EN
58 clearly more productive than the youngest workers. These older workers were experienced and highly skilled and they were working with modern capital equipment. This is potentially an important result because it indicates that the proper matching of available skills through well-functioning labour markets may be as important as education for maintaining the productivity of an ageing workforce. A labour market with a young labour force is usually characterised by high job turnover, which is also costly and reduces value added per employee. A labour market with an old labour force no longer needs such high turnover provided the older workers have been well matched. In purely quantitative terms, industrial restructuring and reallocation of labour are likely to be much more important for future productivity than the age composition of the labour force. If the result found above for Swedish industrial workers has a more general validity, then past policies encouraging early retirement could have lowered aggregate productivity in many European firms. Moreover, even if older workers have a lower productivity than the prime workforce, raising their participation rates would still increase per capita income simply because more older workers would be able to earn their own living to a larger extent. With the help of the microeconomic results found for Sweden, the study is able to draw country-specific conclusions with respect to future income growth prospects. These prospects could still be fairly good over the next 20 years. The study estimates that between 2005 and 2025 projected growth rates of labour productivity may rise from slightly below 1% to over 2% as participation rates converge to those of the best performing countries. The expected rise in participation will automatically generate an increase in the average level of educational attainment of the workforce. After 2025, however, there is a risk due to declining productivity growth in the absence of further improvements in participation rates and education enrolment rates. To maintain fast productivity growth beyond 2025 requires an extra effort to make sure that educational achievement levels throughout the EU reach the levels of today s best performing countries. This implies that future income trends for individual Member States will depend very much on their actual participation rates, educational attainment and age structure. For instance, in Sweden (see figure 3.6), the automatic increase in educational levels will help to increase GDP per capita over the coming years but this may not be enough for a continued increase. Labour force participation rates are already high in Sweden and the growth potential available through increased labour force participation will therefore be more difficult to achieve. On the other extreme is Austria, see figure 3.7, which has a very high educational level but whose labour force participation rates for older workers are among the lowest in the EU. The growth potential of labour market reforms aimed at increasing these participation rates is therefore high for Austria. For Italy, see figure 3.8, both policies (increasing educational levels and labour force participation) appear appropriate and would help to increase GDP per capita over the coming decades. EN 57 EN
59 Figure 3.6 Sweden, GDP per capita Sweden GDP per capita Euro (constant 1995) Constant participation/enrollment Constant participation/converging enrollment Convergence participation/enrollment Figure 3.7 Italy, GDP per capita Italy GDP per capita Euro (constant 1995) Constant participation/enrollment 5000 Constant participation/converging enrollment Convergence participation/enrollment Figure 3.8 Austria, GDP per capita Austria GDP per capita Euro (constant 1995) Constant participation/enrollment Constant participation/converging enrollment 5000 Convergence participation/enrollment Source: Impact of population ageing on innovation and productivity growth in Europe, see footnote 37. EN 58 EN
60 The problem of an ageing workforce for future productivity often appears to be exaggerated. The negative effects of ageing per se are not particularly strong and can be more than offset by higher education levels, although this can only be achieved over relatively long time spans. Instead of focussing on whether productivity declines with age, a more relevant question is how to adapt education and lifelong learning policies in the context of an ageing society. Ageing should actually increase the economic returns to education, as the benefits of higher productive potential can be exploited over a longer time horizon, provided skills are updated throughout working life. The discussion of the demographic dividend has shown that changes in relative cohort size are likely to exert an important impact on economic growth. The simulation results in the box below indicate the order of magnitude of these age-related effects for the future. The general conclusion is that it will be hard to avoid a decline in GDP growth rates, but that this decline will be more severe in demographic scenarios that imply slow or even negative rates of workforce growth. Policies aimed at ensuring an expansion, or at least non-negative growth, of the working age population can thus be recommended. Preferably, such policies should both encourage immigration and aim to restore fertility rates to near-replacement level. The projections imply negative, but not catastrophic effects of population ageing on per capita GDP growth rates. Moreover, analysis of the growth forecasts based on different population scenarios shows that the forecast outcomes are not very sensitive to different demographic assumptions. Restricting immigration, though, would come at the price of somewhat lower per capita income growth. BOX 3.2 The effect of future demographic change on economic growth in the EU 38 The researchers estimated a separate growth model for each of the EU-25 countries in which a major part of past economic growth could be explained by change over time in the relative size of the various cohorts that make up the working age population. In a next step, this model was fed with the latest Eurostat population projections and used to generate future GDP growth rates. The results were calculated for five different Eurostat variants: 1/ the base line scenario; 2/ the baseline scenario with zero migration to analyse the effect of migration; 3/ the baseline scenario with a high fertility assumption to analyse the effect of higher fertility; 4/ the high scenario with low life expectancy to maximise the number of young, and 5/ an old scenario which combines low fertility with high life expectancy to maximise the number of old. Figure 3.10 below presents the aggregate results for the EU 39 for the five different scenarios. The general long-term trend in growth rates is downward, primarily because of the negative effect of an increasing share of the older population. More people over 65 implies a lower growth rate in GDP per worker and has a depressing effect on GDP per capita due to the declining share of the working age population. 38 The relationship between demographic change and economic growth in the EU by A. Prskawetz, Th. Fent, W. Barthel of Vienna Institute for Demography, J. Crespo-Cuaresma of Vienna University and Th. Lindh, B. Malmberg, M. Halvarsson of the Institute for Future Studies, Walter demographic impact study 2006, forthcoming. 39 Luxembourg and Cyprus had to be excluded due to the lack of demographic and initial income data respectively. EN 59 EN

61 The high fertility variant leads to a growth rate after 2030 that is 0.2% larger than the original base line. The variant with the maximum number of young arrives at a 0.3% higher growth rate. The zero migration variant leads to a 0.4% lower growth rate whereas the variant with the maximum number of elderly generates a 0.5% lower growth rate. In general the negative effects of more ageing and/or less migration are larger than the positive effects of higher fertility and lower life expectancy. GDP growth rates for the EU-25 according to various population scenarios These are ceteris paribus results assuming that increased life expectancy has no effect on the economic behaviour of individuals. However, recent research suggests that such an assumption is probably unwarranted. Instead, longer life expectancy can result in increased investment in education, increased savings rates and, possibly, a higher optimal rate of retirement. Thus, the negative effects on GDP growth rates should perhaps be seen as the outcome of a scenario where such adaptations to higher life expectancy are impeded by bad policies. The zero migration scenario 40 has a relatively strong negative effect on the per capita income growth rate for countries that today have positive net migration. 40 The Eurostat baseline projection makes very different assumptions about trends in net migration for different countries. For instance, in 13 of the EU-15 countries, Eurostat assumes declining net migration, the exceptions being NL and FI. EN 60 EN
62 3.3. Challenges to public finances and intergenerational solidarity The challenge of demographic ageing not only consists in ensuring that Europe s economy can continue to grow thanks to higher labour force participation and strong productivity growth. The issue of a declining working age population may be less difficult to tackle than the problem of providing adequate resources for an increasing number of older people who need adequate pensions and health and long-term care. The changes in demography therefore constitute a major challenge for public finances and social cohesion, which is illustrated by the fact that in 2050 there will be two working-age people per elderly citizen as opposed to the current ratio of four to one. The long-term projections carried out by the Economic Policy Committee and the European Commission show that the pension, health and long-term care costs linked to the ageing population will lead to significant increases in public spending in most Member States by Many Member States have already carried out reforms which put them on the path to greater sustainability, but substantially increased expenditure on pensions is still projected for some countries. On the basis of current policies, total age-related public expenditure is projected to increase by 3.4 percentage points of GDP, while expenditure on pensions, health and long-term care alone is projected to increase by 4.4 percentage points for the EU-25 and up to 10 percentage points in some Member States See Economic Policy Committee/European Commission: The impact of ageing populations on public spending on pensions, health and long-term care, education and unemployment benefits for the elderly, February 2006, available under: The focus of these projections is forward-looking and they are not directly comparable with ESSPROS figures as they do not include occupational private expenditure and private healthcare. EN 61 EN
63 Pensions The trends for pensions are presented in Table 3.2 below. Table 3.2 Projected change in spending on public pensions (in % of GDP) Level Change from 2004 BE CZ DK DE EE EL : : : ES FR IE IT CY LV LT LU HU MT NL AT PL PT SI SK FI SE UK EU Source: Economic Policy Committee and European Commission. Public and private spending on pensions, which in 2003 averaged 13% of GDP in the EU, has ensured that being old is no longer associated with being poor or dependent on one s children (see the table below). This has mainly been achieved through the provision of public pensions (amounting to about 10% of GDP). Public spending on pensions is projected to increase in most countries; in some, it is projected to decrease because a part of it is being shifted into private pension savings. Despite this shift to private provision, and the need to ensure well functioning, competitive and open pension and retirement markets, the adequacy of retirement income will continue to be a public responsibility. However, there are significant differences across Member States as far as the fight against poverty in old age is concerned and poverty risks among older people generally remain somewhat higher than for the rest of the population (see also figure 3.9 below on poverty risks). EN 62 EN
64 Figure 3.9 Risk of poverty amongst older people (ceiling at 60% of the median) BE BG CZ DE DK EE IE GR ES FR IT CY LV LT LU HU MT NL AT PL PT RO SI SK FI SE UK Total 65+ Source: HBS for BG and RO, EU-SILC for others. Income reference year Notes: At-risk-of-poverty rates are defined as the share of persons with an equivalised disposable income below an at-risk-ofpoverty threshold. Equivalised disposable income is defined as the household s total disposable income divided by its equivalent size to take account of its size and composition. The at-risk-of poverty threshold is set at 60% of the national median equivalised disposable income. It must be noted that income generated from owner-occupied housing or housing at below market rents i.e. imputed rent is not included in the definition of income. Inclusion of this element of income could make a significant difference in the measurement of risk-of-poverty rates. Pension systems aim not only to ensure that older people do not have to live in poverty, but also provide arrangements to allow them to maintain a living standard after retirement that is not too far off from what they enjoyed during their working lives. Earnings related pensions are essential in this respect and in future will continue to be the main source of pension income for retired people. Thanks to pension entitlements that generally provide 60-70% of an individual s income upon retirement, older people enjoy living standards relatively close to that of the general population, generally ranging between 75% and 90% of that of the 0-64 population. However, there are significant differences between men and women as a result of differences in past earnings due to different employment histories. In some countries, credits have been introduced for periods devoted to care. Future levels of pensions in relation to earnings (income replacement levels) will depend firstly on the pace of accrual of pension entitlements, which is linked to developments in the labour market, and on the maturation of pension schemes. On the whole, pension schemes (in particular statutory schemes) currently manage to ensure adequate income replacement levels after a full career in most Member States. In certain cases, however, current average pension levels turn out to be low compared to current earnings, reflecting low coverage or low income replacement under statutory schemes, as well as maturing pension systems and incomplete careers or under-declaration of earnings in the past. EN 63 EN
65 The work carried out on future replacement rates by the Indicators Sub-Group of the Social Protection Committee 42 suggests that reforms of statutory schemes may reduce replacement rates at given retirement ages. Pensions are generally indexed to prices, which means that they generally lag behind the evolution of wages. This can translate into significant reductions in theoretical replacement rates upon retirement. On the other hand, rising female labour force participation and longer working lives in all Member States will result in higher average pensions. In southern and eastern Member States, economic modernisation and corresponding employment changes will also lead to better pension outcomes in the future. These structural developments could offset the trend towards less generous benefit rules to a significant extent. However, other factors could also work in the opposite direction, for example further postponement of entrance to the labour market or an increase of periods of unemployment. Several countries have extended or are in the process of extending the period of earnings history used for calculating the pension entitlement. Thus, instead of using the years of highest earnings towards the end of the career, earnings over a much longer period or even the entire career are taken into account (i.e. going from a final wage system to an average wage system). This will usually lead to lower pension levels, particularly if past earnings are not fully adjusted for (nominal) wage growth. Pension levels can also be lowered by adjustments to the formula used to calculate benefits. One significant development has been the introduction of a demographic adjustment factor as in the Swedish scheme where rising life expectancy will lower the replacement rate unless people postpone their retirement. Mechanisms to take into account the ratio between the employed and retired are also being developed. Such reforms provide strong incentives for people to postpone retirement in line with rising life expectancy until they can get an adequate pension. Europe s future ability to provide adequate pensions to the ageing baby boom cohorts will crucially depend on whether the effective retirement age can be raised again. Pension systems must also make the relationship between contributions and benefits more transparent and be adapted to increasing life expectancy. While in the 1960s it was normal to retire well after 60, workers left the labour markets increasingly earlier during the 1970s and 1980s and, although this trend now seems to have reversed, the average ages upon leaving the labour market are still below the levels of the late 1960s. Moreover, the employment phase of the life-cycle has been compressed by longer periods spent in education. While the number of years in employment has declined since the 1960s, life expectancy at 60 increased within the EU-25 by around 4 years between 1960 and 2000 (from 15.8 years to 19.3 years for men and from 19 years to 23.6 years for women). The most recent Eurostat projections are based on a further increase of four years in life expectancy at 65 between 2004 to 2050 (an additional 4.4 years for men and 3.9 years for women) 43. In short, contribution years have decreased over the past decades while the years in receipt of benefits have increased and could continue to increase. Pension reforms that restore the balance between contribution years and years of benefit receipt will make a major contribution towards preventing poverty in old age at a time when the number of pensioners will be much larger than today. 42 See 43 Joint Report on Social Protection and Social Inclusion, See EN 64 EN

66 Health and long-term care The probability of needing health and long-term care increases with age, with most care needs concentrated during the final years of life. The main consumers of health and long-term care are therefore people over 80 whose share in the total population according to the Eurostat population projection will rise from 4.1% in 2005 to 6.3% in 2025 and to 11.4% in 2050, mainly due to further increases in life expectancy, falls in fertility rates and the effect of the baby boom generation reaching old age. The number of the 80+ in the EU-25 is projected to grow by 58% between 2005 and 2025 (see also figure 3.10). Figure 3.10 Increase of population 80+ vs. increase of the proportion of the population 80+ in the total population between 2005 and 2025 Source: European Commission. Note: Increase of the proportion of the population 80+ on right axis. Although not age but rather the health status of a person is the main factor behind healthcare spending, the Economic Policy Committee projections illustrate that an ageing population would increase the pressure for more public spending in healthcare. It could push up healthcare spending by between 1% and 2% of GDP in most Member States, i.e. an increase of approximately 25% over current spending (see also table 3.3 below). EN 65 EN
67 Table 3.3 Projected change in public spending on healthcare (in % of GDP) Level Change from 2004 BE CZ DK DE EE EL ES FR IE IT CY LV LT LU HU MT NL AT PL PT SI SK FI SE UK EU Source: Economic Policy Committee and European Commission. Improvements in the health status of the elderly are projected to have a large effect on health spending, moderating the projected increase in spending on healthcare due to ageing. If healthy life expectancy would evolve broadly in line with the change in life expectancy, then the projected increase in spending on healthcare due to ageing could be halved. In comparison, less progress has been made in incorporating other important drivers of spending, mainly on the supply side, into the projection model. Stylised scenarios (see figure 3.11 below) indicate that the projected increase in public spending on healthcare is very sensitive to the assumptions regarding the evolution of unit costs and the income elasticity of demand. Healthcare spending around the world is generally already rising at a faster rate than economic growth 44. Spending on health as a share of GDP could increase rapidly if unit costs (wages, pharmaceutical prices, spending on technologies) grow faster than their equivalents in the economy as a whole, on account of public policies aiming to improve access to health or improve quality (by reducing waiting lists, increasing choice, etc.), or if rising per capita income levels and rising death-related costs lead to increased demand for healthcare services. 44 Snapshots: Health Care Spending in the United States and OECD Countries, January EN 66 EN

68 Figure 3.11 Projected change in healthcare expenditure between 2004 and 2050 (in % of GDP, EU-25) 45 Source: Economic Policy Committee and European Commission. The pure ageing scenario ageing scenario assumes that age-specific health spending per capita remains constant over time. The constant health scenario captures the potential impact of improvements in the health of the elderly. The death-related costs scenario combines an increase in healthy life with the fact that most healthcare costs are incurred in the final years of a person s life. The income elasticity scenario assumes that the income elasticity of demand for healthcare exceeds unity. Finally, the Ageing Working Group (AWG) reference scenario shows the impact of a balanced combination of the factors affecting healthcare spending Long-term care An ageing population will place a strong upward pressure on public spending for long-term care as frailty and disability rise sharply at older ages, especially amongst the very old (aged 80+). According to the AWG reference scenario based on current policy settings, public spending on long-term care is projected to increase by between 0.1 percentage points and 1.8 percentage points of GDP between 2004 and 2050 (see also table 3.4 below). However, this range reflects very different approaches to the provision and/or financing of formal care. The projections are based on the current institutional setting and assume no change in public provision policy. 45 European Economy Special Report, No 1, 2006, pp EN 67 EN
69 Table 3.4 Projected public spending on long-term care (as % of GDP) BE DK DE EL : : : : : : : ES FR IE IT LU NL AT PT : : : : : : : FI SE UK CY : : : : : : : CZ EE : : : : : : : HU : : : : : : : LT LV MT PL SK SI EU EU LO EU-1O Source: European Commission Note: EU-25, EU-15 and EU-10 average weighted by GDP. The projections show that an ageing population may lead to a growing gap between the number of elderly persons with a disability who are in need of care (which will more than double by 2050) and the actual supply of formal care services. Countries with very low projected increases in public spending currently have very low levels of formal care. If these countries would respond to the growing need for professional care by increasing the supply of formal care services, their spending rates may increase much more dramatically. The results for the different long-term care scenarios are presented in figure 3.12 below. The Economic Policy Committee/European Commission study has also prepared an estimate of the number of dependent elderly people for those countries for which both data from SHARE 46 on disability rates and data from national sources on the numbers of people living in institutions are available 47 (see table 3.5 below). In most countries, around 20% of the population aged 65+ has some form of disability. For men, this ranges from 12% in the Netherlands to 27% in the UK, and for women from 19% in Denmark, the Netherlands and Austria to 33% in the UK. 46 SHARE: Survey of Health Ageing and Retirement in Europe, Editor A. Boersch-Supan, European Economy Special Report, No 1, 2006, p EN 68 EN
70 Table 3.5 Estimated elderly dependent population in 2004 for 8 EU Member States (in thousands) Total dependent population aged 65+ As % of total population aged 65+ Men Women Men Women Men Women Men Women Men Women Men Women DK DE ES IT NL AT SE UK Source: SHARE, 1+ ADLs, AWG population scenario reported in the Economic Policy Committee and European Commission (2005a). Note: Estimates of the number of people in institutions by age have been made for Denmark, Spain, the Netherlands and Sweden. According to SHARE, Older people are often at the centre of a complex exchange network within a family where they both give and receive support. Many persons between 50 and 65 are involved with personal care for their parents and later on for their spouses. There appears to be a strong North/South divide in Europe; a higher proportion of older people are involved in family support in northern and continental countries, where as in southern countries help and support tends to be confined to a few individuals within the family who are more intensely involved as either the givers or receivers of care. As a consequence older people living alone are more likely to be given support in northern countries. Table 3.6 below, taken from SHARE, provides detailed information on the living situation and the type of care received by the 80+ in the SHARE countries. Table 3.6 Living situation and type of care of persons 80+ who are not living in an institution SE DK NL DE FR AT CH ES IT EL TOTAL Mean age in years Living alone in % Living as couple in % Living with family in % Personal care from HH in % Personal care from HH or PCG in % Practical help or personal care (HH or PCG) in % Getting help from children in % Source: SHARE Note: HH=household, PCG= professional care giver. EN 69 EN
71 The share of very old persons living alone is between 50% and 70%; only in Spain is this share lower at 39%. There are larger differences when it comes to living with family. It appears that this arrangement is much more common in southern than in northern Europe, e.g. 37% in Spain and 22% in Italy compared to only 3% in Sweden and the Netherlands. In terms of the type of care received within the household, from a professional care giver or from one s own children, the situation is rather diverse. For instance, there does not appear to be a tradeoff between professional care and getting help from children. SHARE concludes that A mixture of public, voluntary and personal care does not erode family support. Instead family members are freed from the more arduous tasks of intensive personal care (undertaken by professional services) and are able to devote more time to other family relationships. The Economic Policy Committee/European Commission has also constructed a number of different long-term care scenarios to explore the sensitivity of future public expenditure under various assumptions 48. The first scenario is once more the pure ageing scenario assuming constant disability rates. The constant disability scenario assumes an improvement in general disability status. The cost/gdp per capita scenario assumes that unit costs evolve in line with GDP per capita. The increased formal care scenario assumes a change in policy, where formal care services are provided to a growing share of the elderly population (the prevalence of receiving formal care increases in all countries by 1% per year during the period Finally the Ageing Working Group reference scenario combines these scenarios in a prudent way (see Figure 3.12). The analysis shows that the main risk with an ageing population would be an increase in the demand for formal long-term care. There may be less informal care available within households on account of trends in family size and the projected increase in the participation of women in the labour market. For countries currently with less developed formal care systems, the headline projected increase in public spending on long-term care may not fully capture the pressure on public finances, as policy changes in favour of more formal care provision may be needed in future. 48 European Economy Special Report, No 1, 2006, p EN 70 EN
72 Figure 3.12 Change in long-term care expenditure (in % of GDP, EU-25) 1,6 1,4 1,2 1 0,8 0,6 0,4 0,2 0 Pure ageing GDP per capita Constant disability Cost - GDP per worker Increased formal care AWG reference scenario Source: Economic Policy Committee and European Commission. Future healthcare needs will depend not only on ageing-related developments (including healthy ageing trends). Future expenditure will also depend on new technological developments (which may increase expenditure by making new forms of treatment and care available or reduce it by replacing expensive with cheaper treatments). The provision of (formal) long-term care is a highly labour intensive activity with relatively little room for technology-driven productivity increases. Long-term care needs will be very much influenced by the expectations of patients, who normally prefer to be cared for at home care, as well as by the capacity and willingness of families to provide informal care (which is likely to depend on the geographic proximity of relatives or the employment status of potential carers). As reflected in the Joint Report on Social Protection and Social Inclusion , the National Reports from the Member States highlight other significant areas essential for the sustainability of long-term care systems. These include developing more formalised care for the elderly and disabled and attaching a higher priority to home care services and the introduction of new technology (e.g. independent living systems) which can enable people to live in their own homes for as long as possible. And, in addition, Member States also stress the importance of rehabilitation, which in turn helps dependents return to an active life. 49 COM(2007) 13 final. EN 71 EN
73 4. OPPORTUNITIES FOR TACKLING DEMOGRAPHIC CHANGE 4.1. Introduction In its Communication on The demographic future of Europe from challenge to opportunity, the Commission presented a constructive response to the demographic challenge and highlighted five policy areas in which the Member States can take measures to tackle this challenge. The areas are: demographic renewal, i.e. lifting the obstacles to a return to higher fertility rates; raising employment levels, which will result in a better balance between active and inactive people; boosting productivity growth and hence the economy s ability to meet the needs of an ageing population; receiving and integrating immigrants so as to avoid future labour shortages; and ensuring the sustainability of public finances and thus securing the ability to maintain adequate social protection and public services in the future. This chapter examines how much scope there is for improvement in each of these five areas and provides some indications as to the obstacles that need to be overcome to unlock the potential for tackling the demographic challenge. Clearly, combinations of measures in several of these areas are needed, but each Member State has different potentials in each of these areas and will therefore require its own specific policy mix. The data presented in this chapter should allow each Member State to identify the areas with the greatest scope for improvement and to define policy priorities accordingly Demographic renewal: how much scope is there for increased fertility? The Commission s communication on the demographic future of Europe stressed that Member States can respond to low birth rates and that such reactions are both necessary and realistic. The necessity stems from the fact that people generally would like to have more children than they actually have. That a policy response to low birth rates is realistic is demonstrated by international comparisons underlining the effectiveness of policies to support those who wish to have children Potential for more births In all EU Member States the fertility rate has declined to a level below the replacement level of 2.1 and the EU average is just below 1.5 (see figure 4.1 below). This means roughly that every generation is replaced by a generation that is 25% smaller. At the same time, there are large differences in fertility levels between Member States. EN 72 EN
74 Figure 4.1 Total Fertility Rates in ,1 1,9 1,7 1,5 1,3 1,1 0,9 0,7 0,5 PL SK SI LT CZ EL BG LV HU RO DE ES IT MT PT AT CY EU-25 EE LU BE NL SE DK FI UK IE FR Source: Eurostat. Two groups can be distinguished. On the one hand, there are countries with fertility rates above 1.6 (e.g. FR, UK, NL, BE, DK and SE), which, given rising life expectancy and continuing migration, will prevent population decline. In most other Member States, however, fertility rates do not exceed 1.5, implying that population decline seems inevitable. A return to higher fertility rates would not prevent the accelerated ageing resulting from the baby boom cohorts growing old. Moreover, with rising life expectancy, a constant old-age dependency ratio could only be achieved by fertility rates well above the replacement level and this would mean continuous population growth. Higher fertility will eventually result in a larger labour force, but this takes about 20 years, i.e. the time it takes for these cohorts to go through the education system and enter the labour market. Figure 4.2 illustrates the long-term effects of higher fertility on the working age population. It compares the size of the potential labour force in 2030, 2040 and 2050 under the baseline scenario and a high fertility scenario. EN 73 EN
75 Figure 4.2 Difference in the size of the working age population for the High Fertility Scenario and the Baseline Scenario (in % of baseline labour force) 12% 10% 8% 6% 4% 2% 0% EU-25 EU-15 NMS-10 EA BE BG CZ DK DE EE IE EL ES FX IT CY LV LT LU HU MT NL AT PL PT RO SI SK FI SE UK Source: Eurostat New Cronos and own calculations 50. The baseline scenario assumes continuing low fertility rates in the EU-25, albeit at a somewhat higher level than today in the low fertility countries. In 2050 the highest total fertility rates are expected in Sweden and France (1.85), compared to TFRs of 1.4 or 1.45 in countries such as Spain, Italy, Germany and Austria, which are expected to have the lowest fertility rates. For the EU as a whole, the TFR in 2030 is assumed to be Under the high fertility scenario, it is assumed that the fertility rate in 2035 will have stabilised at 1.93 per woman, relative to the baseline value. Figure 4.2 shows that the higher fertility scenario will have hardly any impact on the population of working age in 2030; the effect will only start to be noticeable from 2040 onwards. In spite of the fact that increased fertility rates will only produce positive economic impacts after a very long time lag, many countries consider low fertility rates as a public policy issue. According to the UN population perception surveys, 18 out of 29 European countries considered their fertility level as satisfactory in By 2005 a majority of 28 out of 43 perceived the fertility level as too low 51. Only two of the EU-10 and six of the EU-15 Member States believed that no intervention was called for to raise fertility levels 52. The replies of the Member States to the Commission s Green Paper on demography confirmed that majority of Member States now tend to see the current low fertility rate as a matter of public concern. 50 EUROPOP 2004 population projection, the difference between the baseline scenario and a high fertility scenario. 51 Various UN Population Perception Surveys held between 1979 and In these surveys governments are asked whether countries consider their level of fertility too low, satisfactory or too high. 52 On fertility policy the question asked is: Should one raise, maintain or lower policy intervention or should there be no policy intervention? EN 74 EN
76 In the long run, higher fertility rates would prevent population decline and, while not reversing demographic ageing, would contribute to a more balanced mix of younger and older people in society. However, it is a highly personal choice whether to have children or not and the only way governments in a free society can influence fertility rates is by removing obstacles that prevent those who would like to have children from actually having them. Apparently, there are several constraints preventing Europeans from realising their desire to have children, see also the previous discussion in section The problems include a lack of jobs and housing for young people wanting to start a family, the difficulty of reconciling paid work with family life and perhaps also a general lack of confidence in the future 53. All these factors may have a negative impact on young people thinking about starting a family and on the likelihood of existing families having an extra child. Greater gender equality and a better work/life balance seem to be conducive to increasing both female labour force participation and fertility. In fact there has been a reversal in the sign of the correlation between fertility and female labour force participation among OECD countries since the middle of the 1980s. This cross-country correlation switched from in 1970 to 0.68 in Today, countries where many women are in paid employment, often supported by effective instruments to reconcile work with private and family responsibilities for both men and women, tend to have higher fertility rates than countries where fewer women work. Countries where it has remained difficult to reconcile employment and having a family tend to have experienced a large decline in births combined with only a modest increase in female labour force participation. In Italy, for example, female force participation went from about 34% in 1975 to just about 51% in 2004, a fairly low figure when compared to the 75% in Sweden. The TFR in Italy and Sweden stood at 2.5 and 2.3 during the first half of the 1960s, but in 2004 was 1.3 and 1.8, respectively. The availability of childcare helps to combine work and family and appears to have a particular effect on the probability of working for highly educated women Unlocking the potential for more births Public policy matters when trying to understand differences in fertility. It can create better conditions for founding a family, raising children, reconciling work and family life as well as sharing family and domestic responsibilities between women and men. Clearly, some Member States have already found relatively successful policy mixes. 53 Survey realized near Europeans aged old living in 14 countries in the period from 1999 to Population Policy Acceptance Study Dialog, produced by the Federal Institute for Population Research for the Robert Bosch Stiftung. 54 De Laat, J. and A. Sevilla Sanz, Working women, men's home time and lowest-low fertility, Essex University ISER, Working Paper, No 23, EN 75 EN
77 BOX 4.1 Different family policy mixes in Europe At the 2005 Green Paper conference Confronting demographic change: a new solidarity between the generations, one of the experts, Linda Hantrais 55, summed up the current situation across the EU as follows: Some countries would appear to be more successful (the Nordic states) in achieving relatively high employment rates for women in combination with a widespread level of social acceptance of working motherhood, measured in terms of attitudes and practices and the legitimacy of public policy intervention. They do so through a high tax economy and heavy reliance on the public sector. Southern European countries are at the other end of the spectrum, low female employment rates (except Portugal) combine with heavy reliance on intergenerational support networks, which are, however, increasingly being called into question. In between are two contrasting models. The Anglo-Saxon countries depend on highly flexible labour markets, small public sectors, a low-wage household service sector and a welfare-to-work ethos. The corporatist countries (Austria, Germany and the Netherlands) have remained closer to the traditional male breadwinner model, with less public support for families and greater reliance on collective labour agreements and on women prioritising their role as mothers at home rather than working mothers. The Central and East European countries present a rather different configuration: they combine traditionally high female activity rates, although both male and female rates have been falling, with a strong commitment to mothers as workers, not however for reasons of gender equality. Here, cutbacks in the provision of public services and the shrinking public sector have hit women hardest and have forced families to become more self-reliant. All Member States support families in one form or another, the main types of support being: 1. Financial support (including tax breaks) to reduce the financial inequality between people with and without children; Financial support Children are costly in terms of both direct costs and foregone earnings. These costs create considerable income differences between otherwise comparable couples with and without children. Social protection benefits compensate for the direct and indirect costs of having children. According to Eurostat data on social protection expenditure (ESSPROS which do not include tax benefits or spending on education), about three quarters of social protection benefits targeted at families take the form of benefits in cash. In 2004, they amounted to some 1.5% of GDP for the EU-25, ranging from 0.4% in Spain to more than 3% in Luxembourg (see table 4.1 below). Benefits in kind amounted to 0.6% of GDP with an even larger variation across countries. The differences become larger when one corrects for the fact that the share of young people differs between countries. 55 See EN 76 EN
78 Table 4.1 Social protection benefits targeted at family support in the EU Share of population between 0-19 in % Support intensity corrected for the share of the young* 2004 TFR Total family support Support in cash In % of GDP Support in kind EU e 1.5 e 0.6 e EU : 2.1 e 1.5 e 0.6 e EA p 1.5 p 0.5 p BE CZ p 1.4 p 0.2 p DK DE p 2.2 p 0.7 p EE IE EL ES p 0.4 p 0.3 p FR p 2 p 0.5 p IT p 0.7 p 0.5 p CY LV p 1 p 0.2 p LT p 0.7 p 0.4 p LU p 3.3 p 0.6 p HU MT NL p 0.7 p 0.5 p AT PL p 0.9 p : PT p 0.8 p 0.5 p SI p 1.4 p 0.6 p SK p 1.6 p 0.1 p FI SE p 1.6 p 1.5 p UK e 1.3 e 0.4 e Source: Eurostat, ESSPROS. * support in % of GDP divided by the share of the young (0-19) in the population. ** e = estimated value, p = provisional value. The data collected by the OECD are not directly comparable. However, they do illustrate the value of tax breaks to families, which again display a wide variation across countries (see Figure 4.3). EN 77 EN

79 Figure 4.3 Public spending on family benefits in cash, services and tax measures, 2003 (in % of GDP) Source: OECD data base on family policies, 2006: In spite of the support for families, households with children remain exposed to a slightly higher risk of poverty than the population as a whole (see table 4.2 below). The risk of poverty is likely to have an impact on young couples thinking about starting a family of their own. This was confirmed by the replies to the 2006 Eurobarometer survey, which in particular mention adequate working, financial and housing conditions as prerequisites for having children (see chapter 2.2.4). Table 4.2 At-risk-of-poverty after social transfers, 2004 (in %) With children Total BE CZ 15 8 DK 9 11 DE EE EL ES FR IE IT CY LV LT LU HU MT NL AT PL PT SI 9 10 SK FI SE UK EU Source: Eurostat EU-SILC and national data. Note: Risk-of-poverty defined as income below 60% of the median income. EN 78 EN
80 Access to services Table 4.1 and Figure 4.3 show that family support in the form of services (or benefits in kind) plays a major role in a number of countries, in particular the Nordic countries and France. Given its importance for reconciling professional and private life and hence for achieving high employment rates the Barcelona summit of 2002 set two targets for the availability of childcare, namely to provide, by the year 2010, childcare for at least 33of children aged 0-3 and for 90% of children between the age of 3 and mandatory school age. Table gives an overview of the progress achieved by Table 4.3 Provision of childcare in European countries in 2003 Country Childcare coverage rate 0 3 years Target=33% Childcare coverage rate 3 compulsory school age Target =90% Public expenditure on formal day care as a % of GDP BE (Flanders) 81% 100% BE (Wallonia) 33% 98% 0.1% CZ 8% 85% 0.0% DK 56% 93% 1.7% DE 7% 89% 0.4% EE 22% 79% EL 7% 60% 0.4% ES 10% 98% 0.1% FR 43% 100% 0.7% IE : : 0.2% CY : : : IT 6% 93% : LV 16% 75% : LT 18% 60% : LU 14% 80% : HU 6% 86% : MT : : : NL 35% 100% 0.2% AT 9% 82% 0.4% PL 2% 60% PT 19% 75% 0.2% SI 27% 59% SK 70% 0.1% FI 21% 70% 1.2% SE 41% 90% 1.3% BG 7% 74% : Source: Plantenga and Remery, 2005, see footnote 56. With the exception of a few countries, the level of coverage for the older children is already quite high. Ten countries meet the 90% target. By contrast, the provision of child care for the youngest age group is below 10% in several countries. Most child care services are partly subsidised. According to Plantenga and Remery, parents pay on average only 25-35% of the 56 Plantenga J. and C. Remery, Reconciliation of work and private life: a comparative review of 30 European countries, European Commission, Directorate-General for Employment, Social Affairs and Equal Opportunities, EN 79 EN
81 cost. They find that, besides affordability, cultural norms about motherhood and the proper way to care for (young) children also limit the use of crèches. In the case of young children, leave arrangements and care provided by relatives (especially grandparents) are often preferred by many parents. The presence of children combined with the lack of services also has a clear impact on the employment situation of women. Table 4.4 shows that everywhere in the EU, except in Slovenia and Portugal, the employment rate of women caring for young children is lower than that of women without children. Table 4.4 Employment impact of parenthood for women* EU EU EU BE CZ DK : DE EE EL ES FR IE : IT CY LV LT LU HU MT NL AT PL PT SI SK Fl : : UK * Difference in employment rates for women with children under 6 and women without children (age group 20-50). Source: EU Labour Force Survey Spring data, LU 2003, 2004 and 2005: Annual average data, data not available for SE. Notes: Data may lack comparability due to changes in certain survey characteristics: between 2002 and 2003 for FR and LU, between 2003 and 2004 for IT and AT, between 2004 and 2005 for DE and ES. : means no data available Flexibility in working hours and work organisation Part-time work has become a widely used option to reconcile work and family life. Table 4.5 shows that part-time work is much more prevalent amongst women than men. In 2005, 33% of women in the EU had part-time jobs as compared to 7% of men. This high prevalence of part-time working among women relative to men shows again that it is mainly women who adapt their employment patterns and careers to the needs of family life. EN 80 EN
82 Table 4.5 Share of part-time work (in %) Source: Eurostat Labour Force Survey. Women Men BE 41 7 CZ 8 2 DK DE 44 8 EE 10 5 EL 9 2 ES 25 5 FR 31 6 IE 32 6 IT 26 5 CY 14 5 LV 12 8 LT 9 5 LU 38 3 HU 6 3 MT 19 5 NL AT 39 6 PL 14 8 PT 17 7 SI 11 7 SK 4 1 FI 19 9 SE UK EU Flexible working-time arrangements, such as flexitime systems or teleworking, may offer both mothers and fathers alternative opportunities for reconciliation. According to the Fourth Working Conditions Survey of the European Foundation for Improvement in Living and Working Conditions 57, more and more Europeans are making use of flexible working-time arrangements (see Figure 4.4 below). In the surveyed countries, 48% of establishments offer some form of working time flexibility but only 25% allow extended flexibility (i.e. the possibility to accumulate hours for a day off or longer periods of leave). The use of flexitime is lower in Southern European countries and the new Member States than in the rest of Europe. 57 For the report see At the 2006 Forum on the Demographic Future of Europe, John Hurley of the Dublin Foundation summarised the results working time arrangements, see EN 81 EN

83 Figure 4.4 Incidence of different forms of flexible working time arrangements, by country (%) Base: All establishments (management interviews). Source: European Foundation for Living and Working Conditions in Dublin, The survey also confirms that parental leave is mostly taken up by women and that, even in a country like Sweden, men still take up only 17% of total parental leave. The take-up of parental leave, in particular by men, increases with the level of the replacement income. Figure 4.5 summarises the possibilities for workers to influence their daily working hours across Europe. Over half of all workers (56%) have their working time arrangements set by the company with no possibility of change, 9% of workers can choose between several fixed working schedules, 17% can adapt their working hours within certain limits (i.e. flexitime); and, in 18% of cases, it is the worker who decides on individual working hours (e.g. selfemployed workers). Around 50% of workers in northern European countries can adapt their working time (to a certain extent) to their particular needs. In contrast, fewer than 25% of workers in southern and Eastern Europe are able to do this. EN 82 EN

84 Figure 4.5 Working time discretion by country Source: Fourth Working Conditions Survey of the Dublin Foundation, A key factor influencing work/life balance found in the survey is the length of the working week. Over 40% of those who work long hours say they are dissatisfied with their work/life balance; by contrast, 85% of those who work less than 30 hours per week are happy with their work/life balance. Regular long working days (of over 10 hours in length) also have a negative impact. In particular working fathers report more dissatisfaction with their work/life balance than women. The Dublin Foundation suggests that the dissatisfaction of working fathers could be related to their inability and/or frustration to meet the changing social expectations regarding a father s domestic role. This would suggest that there is potential for change among working fathers. Women still carry a disproportionate share of the negative impact of children on labour market participation. This is reflected in lower employment rates of women, a higher incidence of part-time working and the gender pay gap (see table 4.6). ). Indeed, female labour force participation is 15 percentage points below that of men, while part-time working is four to five times more prevalent among women. In addition, there is a large gap in the hourly pay earned by women and by men. In 2004, women s average gross hourly earnings were 15% less than men s across the EU, though with wide variations across Member States. EN 83 EN
85 Table 4.6 Employment rate of women/men and Gender pay gap for (in %) Women Men BE CZ DK DE EE EL ES FR IE IT CY LV LT LU HU MT NL AT PL PT SI SK FI SE UK EU Source: Eurostat Labour Force Survey. The empirical evidence suggests that promoting the reconciliation of a professional career with a fulfilling private life will result in higher employment rates, in particular for women, and higher fertility rates. But having a family will always bring additional work and responsibilities, which are currently to a large extent assumed by women and forces them to sacrifice professional career opportunities. Progress towards greater equality between women and men will therefore also require a more equal sharing of household and family work. Tables 4.7 and 4.8 illustrate how large the differences between women and men still are. Time use survey data show that women spend much more time than men doing domestic work and that they have less free time. The differences between women and men tend to be larger in southern and Eastern Europe. The Dublin Foundation s Working Conditions Survey showed that part-time working women actually worked longer hours than full-time working men when counting both paid and unpaid work. EN 84 EN
86 Table 4.7 and 4.8 Allocation of daily time for women and men aged 20 to 74 in Europe Hours and minutes per day Women BE DE EE ES FR IT LV LT HU PL SI FI SE UK NO Gainful work, 2:07 2:05 2:33 2:26 2:31 2:06 3:41 3:41 2:32 2:29 2:59 2:49 3:12 2:33 2:53 study Domestic work 4:32 4:11 5:02 4:55 4:30 5:20 3:56 4:29 4:58 4:45 4:58 3:56 3:42 4:15 3:47 Travel 1:19 1:18 1:06 1:05 0:54 1:14 1:20 1:04 0:51 1:06 1:02 1:07 1:23 1:25 1:11 Sleep 8:29 8:19 8:35 8:32 8:55 8:19 8:44 8:35 8:42 8:35 8:24 8:32 8:11 8:27 8:10 Meals, personal 2:43 2:43 2:08 2:33 3:02 2:53 2:10 2:22 2:19 2:29 2:08 2:06 2:28 2:16 2:08 care Free time 4:50 5:24 4:36 4:29 4:08 4:08 4:09 3:49 4:38 4:36 4:29 5:30 5:04 5:04 5:51 Total Hours and minutes per day Men BE DE EE ES FR IT LV LT HU PL SI FI SE UK NO Gainful work, 3:30 3:35 3:40 4:39 4:03 4:26 5:09 4:55 3:46 4:15 4:07 4:01 4:25 4:18 4:16 study Domestic work 2:38 2:21 2:48 1:37 2:22 1:35 1:50 2:09 2:40 2:22 2:40 2:16 2:29 2:18 2:22 Travel 1:35 1:27 1:17 1:16 1:03 1:35 1:28 1:13 1:03 1:13 1:09 1:12 1:30 1:30 1:20 Sleep 8:15 8:12 8:32 8:36 8:45 8:17 8:35 8:28 8:31 8:21 8:17 8:22 8:01 8:18 7:57 Meals, personal 2:40 2:33 2:15 2:35 3:01 2:59 2:10 2:25 2:31 2:23 2:13 2:01 2:11 2:04 2:02 care Free time 5:22 5:52 5:28 5:17 4:46 5:08 4:48 4:50 5:29 5:25 5:34 6:08 5:24 5:32 6:03 Total Source: Eurostat - National Time Use Surveys conducted between 1998 and 2004 by national statistical agencies and research institutes. Notes: Unspecified time use is included in 'Free time'. FR: In France, long periods spent on rest were coded as 'Sleep' and in the other countries as 'Rest', included here in 'Free time'. NO: encouraged reporting conversation as a main activity by diary instruction (coded as 'Socialising', which is part of 'Free time'). National data were rounded, which may result in small discrepancies. Cross-country differences in gender equality at home appear to be linked to differences in fertility. In Northern European countries the increased labour force participation of women has been followed by an increase in men s contribution to household work. Less egalitarian attitudes in Southern Europe may have acted as a brake on female labour force participation, as women often have to choose between raising children and paid work. A recent econometric study by De Laat and Sevilla Sanz 58 found that the difference in an egalitarian attitudes score between the most and the least egalitarian country in their sample (Norway and Spain, respectively) explains a difference in fertility of up to 0.87 children. There is strong evidence that policies to support families and to promote gender equality do matter and that they can raise fertility rates. The highest birth rates in Europe can indeed be observed in those countries that have the most generous family policies and which also have 58 De Laat, J. and A. Sevilla Sanz, Working women, men s home time and lowest-low fertility, Essex University ISER, Working Paper, No 23, EN 85 EN

87 made most progress in gender equality. A study by the OECD 59 has tried to simulate the effects of different policies on total fertility rates. The results presented in Box 4.2 should not be regarded as predictions of the most likely outcomes, but as an indication of the likely effects on fertility rates of various policies based on a very simplified set of assumptions. The policies considered are taxes and transfers that lower the direct costs of children, greater availability of part-time employment for women, longer periods of parental leave, and greater availability of formal childcare for preschool children. Despite the obvious limitations, the results suggest that these policies can help parents overcome the obstacles that prevent them from having the number of children they want. BOX 4.2 Policy simulation of the effect on fertility Notes: Countries are ranked in increasing order of the total fertility rates that could be achieved as a result of four sets of policies: i) a reduction in the direct costs of children (measured as the difference between the equivalised disposable income of a two-earner couple without children and that of a two-earner couple with 2 children, where the principal earner earns 67% of the earnings of an APW (Average Productive Wage), and the spouse 33%; ii) an increase in the availability of part-time employment to the level achieved in the three OECD countries where it is highest (Japan, the Netherlands and the United Kingdom); iii) an increase in the availability of formal childcare (the share of children below 3 years of age attending formal childcare) to the levels of the three countries where it is highest (Denmark, Sweden and the United States); and iv) an increase in the length of leave (both maternity and parental) to the levels of the four countries where it is the highest (Germany, France, Spain and Finland). The simulations allow for the possibility of substitution between longer parental leave and greater childcare availability. The combined effect of these policies, e.g. in the case of Japan, is an increase of the total fertility rate from a level of 1.3 in 1999 to around 2.0. Source: OECD, see footnote 59. In addition to policies that promote better conditions for women and men wishing to raise a family, it may become increasingly important to address biological obstacles to fertility. As potential parents postpone the moment at which they decide to have children, fertility problems are becoming a more and more frequent obstacle to the realisation of their desire. The availability of Artificial Reproduction Techniques (ART), such as in vitro fertilisation, may also have an impact on a country s total fertility rate. A recent study conducted by RAND 60 suggests that, if the UK adopted the same policy regime concerning the availability of ART as is currently practised in Denmark, its fertility rate could go up by This may not seem very much but would still have a sizeable impact on population growth in the long run. In fact, the size of the effect is comparable to the effects on fertility of policies considered 59 D Addio A. C. and M. Mira d Ercole, Trends and determinants of fertility rates and the role of policies, OECD Social Policy Division, see 60 Grant, J. and others, Should ART be part of the population mix?, RAND Europe, paper prepared for the 2006 meeting of the European Association of Human Reproduction and Embryology in Prague. EN 86 EN
88 in the above-mentioned OECD study. More research, taking account of possible deadweight effects and involving more countries, is needed to confirm this result Conclusion There is convincing evidence that better conditions for families, increased gender equality, higher female employment and more support for those who would like to start a family would have a positive impact on fertility rates in the EU. However, it should also be clear that the imminent challenge of demographic ageing cannot be addressed by raising fertility rates. Higher fertility rates will affect the balance between active and retired people only after two decades at least before that, significant investment in the education of these additional children will be required. However, helping people to achieve their goal of starting a family and raising children is now recognised as an important policy goal. The Barcelona target of access to childcare, the Commission s Gender equality Roadmap and the Member States European Pact for Gender Equality specifically address the need to further support gender equality policies, including better work/life balance measures, to help meet the demographic challenge Promoting employment in Europe The second strand of the constructive response to the demographic challenge presented by the Commission in its communication on the demographic future of Europe is the need to raise employment rates. Demographic ageing will reduce the population of working age (generally defined as people aged years) while the number of people over 65 (generally assumed to be retired) will increase. The old-age dependency ratio, i.e. the number of people over 65 relative to the population of working age, will become less favourable and the active population will have to shoulder a heavier burden of providing for the elderly. However, what matters with regard to the production and distribution of resources is not the ratio between these two age groups but the ratio between people actually in employment and people receiving benefits. Raising employment rates, improving integration within the labour market especially for young people and disadvantaged groups such as the disabled, ethnic minorities and immigrants and encouraging older workers to stay longer on the labour market can help maintain a good balance between the active and the retired in a context of demographic ageing. Indeed many Member States have considerable scope for raising their employment and economic performance levels through higher labour force participation Potential for more jobs of better quality As the baby boom cohorts reach retirement age and smaller young cohorts enter the labour market, the balance between the inactive and active segments of the population could worsen significantly. However, Europe has a huge potential to compensate for this demographic effect by raising levels of employment. The European Council decisions of Lisbon and Stockholm which set targets for overall employment, as well as rates for women and older workers, are indicative of the labour market potential inherent in Europe. In 2005 the overall, female and older people s employment rates were respectively around 6.4 and 7.5 percentage points below the Lisbon and Stockholm employment targets for Rates for older 61 Employment in Europe 2006, European Commission, Directorate-General for Employment, Social Affairs and Equal Opportunities. EN 87 EN
89 workers aged actually improved most in the period , rising by approximately 6 percentage points (see figure 4.7 below). If individual Member States were to bring up employment rates on the whole, and for women and year-olds in particular, to the levels of the current three best-performing countries, this would make a major contribution to tackling the demographic deficit. As shown in the chart below, the greatest improvements would have to be made in securing higher employment rates for older workers. The next greatest challenge lies in raising rates for women, while the best overall employment rates are somewhat more within reach. Figure 4.6 Potential gap in employment rate (female, senior) in the EU (in %)* SE DK UK EE FI PT CY IE LV LT NL CZ EU-15 DE ES EU-25 EL EA FX RO BG NMS-10 MT HU IT LU BE SI AT SK PL Female empl Empl Source: Eurostat. * Calculated with respect to the three best performing countries. Translated into absolute numbers of jobs that need to be created, improving labour market performance in these areas has a substantial potential for making up the job deficit foreseen in 2050 as compared to 2010 levels (second column in Table 4.8 below). However, calculating the contribution of a 25% increase in employment rates for year-olds reveals that the potential employment contribution that can be expected from this group is likely to be rather modest. EN 88 EN
90 Table 4.8 Main employment results from the demographic projections, in thousands I II III IV V VI VII Estimated employment in 2050 for yearolds (1) Decline in comparison with 2010 (2) Increase in female employment rate (3) Increase in ER (4) Decrease in UR (5) Increase in ER for yearolds (6) Increase of 25% in ER for yearolds (7) EU EU NMS EURO BE BG CZ DK DE EE IE EL ES FR IT CY LV LT LU HU MT NL AT PL PT RO SI SK FI SE UK Notes: (I) Employment in 2050 is estimated as the current employment rate multiplied by the expected population of year-olds based on Eurostat s central variant scenario. (II) Difference between the estimated number of jobs in 2010 and in (III) (VI) For each case, estimated number of jobs gained if the corresponding rate reaches the current average level of the 3 best-performing EU-25 countries. (VII) Estimated number of jobs gained if the employment rate for year-olds is increased by 25% in each country. ER = employment rate; UR = unemployment rate. Source: Own calculations based on Eurostat population projections and Labour Force Survey data. The high prevalence of part-time work amongst women also represents an untapped potential for raising the number of hours worked in Europe. EN 89 EN
91 Unlocking the potential for increased employment Raising levels of educational attainment is one of the keys to unlocking the potential for increased employment in Europe 62. Skill levels are significantly related to employment rates, with employment generally being higher the greater the educational attainment level. In 2005 the average employment rate was 82.5% among the high-skilled in the EU and 68.7% for the medium-skilled (those having completed upper secondary education), whereas for the lowskilled it was only 46.4% 63 (see table 4.9). Table 4.9 Employment (ER), unemployment (UR) and activity rates (AR) by education levels in 2005(age group 15-64, in %) Total, irrespective of education level High education level Medium education level Low education level ER UR AR ER UR AR ER UR AR ER UR AR BE CZ DK DE EE EL ES FR IE IT CY LV LT LU HU MT NL AT PL PT SI SK FI SE UK EU-25 Total Men Women Source: Eurostat Labour Force Survey, spring results Fortunately, the level of educational attainment among the EU-25 working age population continues to rise, contributing to a more employable and adaptable workforce and in turn to 62 The revised Employment Guidelines adopted by the European Council in their decision of 12 th July 2005 (2005/600/EC) specifically cover this area: Guideline 23, which calls for expanding and improving investment in human capital through specified measures including lifelong learning strategies, and Guideline 24, which calls on Member States to adapt education and training systems in response to new competence requirements. 63 Employment in Europe 2006, European Commission, Directorate-General for Employment, Social Affairs and Equal Opportunities. EN 90 EN
92 increased employment and participation rates. In 2005, the high-skilled (i.e. those having completed tertiary education) represented close to 20% of the working age population, while the low-skilled (those with only lower secondary education or below) represented just under 33% 64. This compares with shares of 17.6% and 36.2% respectively in 2000 and reflects the ongoing improvements in the level of human capital in the EU. This has mainly been the result of improvements in the skill composition of the female working age population, where the high-skilled share has increased 3 percentage points and that of the low-skilled fallen by 4.3 percentage points, compared to changes of 1.7 and -2.5 percentage points respectively for men. However, present levels of education still show that there is great potential for increasing employment by raising these levels even more. Women have accounted for the greatest growth in employment in recent years 65, both in relative and absolute terms. Indeed, the overall increase in female employment has been more than twice that for men. This reflects the recent trend of rising labour market participation for women, among whom activity rates increased from 60% to 62.5% between 2000 and 2005 against an increase in the male rate of only 0.4 percentage points. In many Member States, however, especially those in the north of Europe, a disproportionate number of women who combine employment with having children work in part-time jobs. In 2005, almost 40% of women with children, whether under 6 or older, worked part-time (i.e. for less than 30 hours a week), while around 10% worked under 15 hours a week 66 (see Figure 4.7 below). Both figures are around twice the rates for women without children. Such jobs not only yield less income than full-time ones but are often inferior in terms of their status and the responsibilities they involve, aspects which equally need to be taken into account when assessing the opportunity cost to women of having children. 64 Ibid. 65 Ibid. 66 Is the pressure on parents of young children too heavy? Policy brief prepared for the European Commission s Directorate-General for Employment, Social Affairs and Equal Opportunities by the Social Situation Observatory, Social Inclusion and Income Distribution Network. EN 91 EN

93 Figure 4.7 Average hours worked per week by women and men (aged 20-49) with or without children (aged 0-6) in EU Member States-2004 Source: Eurostat, European Labour Force Survey, Note: Data are not available for DK, IE and SE. Having children has a more pronounced effect on the employment of women with low education (no qualifications beyond compulsory schooling) than those with higher levels. In the EU-25 as a whole in 2004, the proportion in employment of women aged with low education and children under 6 was 20 percentage points lower than for women with the same level of education without children, which averaged just under 40%. For women with children aged 6-11, the proportion was over 7 percentage points lower. By contrast, for women with tertiary education, the difference in employment rates between those with children under 6 and those without young children was 12 percentage points and for those with children aged 6-11 less than 2 percentage points. Prolonging working lives by promoting the postponement of retirement is another key to unlocking the potential for increased employment. Pension reforms in the majority of Member States are already raising the labour market exit age, but much can still be achieved in this area. The statutory retirement age in most Member States is currently 65. In France, however, the statutory retirement age is 60 and in several other countries including Belgium, Italy, Austria and the United Kingdom, there is a separate lower age for women. The average exit age in 2005 for the EU-25 was estimated to be 60.4 years (see figure 4.10). Employment amongst EN 92 EN
94 55-64-year-olds increased by almost a quarter in the period 2000 to , indicating that pension reforms and other incentives put in place by Member States are having a clear effect. Figure 4.8 Healthy life expectancy, life expectancy and average exit age from the labour market in the EU-15, Males Females Life expectancy Healthy life expectancy Average exit age Source: Eurostat. Achieving longer working lives also involves addressing the causes of early retirement. Data available on the reasons given for their inactivity by year-olds indicate that many individuals were already retired. However, as the figures below show, many were inactive due to disability or the onset of illness. According to table 4.10, the differences across countries are striking and to a great degree probably reflect different institutional arrangements rather than differences in health status. 67 Employment in Europe 2006, European Commission. EN 93 EN
95 Table 4.10 Percentage of population and causes of inactivity for inactive persons aged 50-64, 2005 (in %) Ageing and the labour market Personal/ family reasons Percentage of inactive individuals Retirement Illness/ disability Believe job not available Other reasons Inactive as % of total population BE CZ DK : 3 29 DE EE : : 32 EL ES FR : IE : 1 1 : IT CY : 3 38 LV LT LU HU MT : NL AT PL PT : SI SK FI SE UK EU Source: Eurostat Labour Force Survey. Note: Other reasons include education and volunteer work. The fact remains however, that Europeans are living longer in good health than ever before in history (see figure 4.9). The increase in healthy life expectancy signals the potential for greater labour market participation amongst those members of society who are currently retiring well before statutory retirement age. EN 94 EN
96 Figure 4.9 Life expectancy in good health in FI HU NL DK UK PT SE FR DE IE GR BE CY AT ES IT Females Males Source: Eurostat. Note: Provisional value for PT, all others estimated with the exception of CY A more productive and dynamic Europe The third response to the demographic challenge identified by the Communication on the demographic future of Europe is the improvement of productivity. Once the population of working age has started declining and no further improvements in employment rates can be expected, Europe s economic growth will depend on rising productivity alone. This has to be boosted by structural reforms to allow the less productive countries to catch up with the more advanced countries. Reforms will foster the development and uptake of new technologies as well as structural change in response to a changing environment. One driving factor behind this structural change will be the rising demand of older people for goods and services that are well-adapted to their specific needs. This silver economy will create new business opportunities and markets The potential to raise productivity The decline in the working age population of the EU as a whole is already expected to start in 2010, but further increases in employment rates could ensure further employment growth up to Thereafter, economic growth and improvements in living standards will become dependent on increases in productivity. In fact, labour productivity gains already account for two-thirds of the average economic growth recorded in the EU-25 between 2000 and The most obvious indication of the scope for productivity growth is the productivity gap between the highest performing countries and the rest. Table 4.11 presents productivity per hour in 2004 relative to the EU-15 average. Leaving aside Luxembourg, the EU Member EN 95 EN
97 States with the highest productivity per hour worked are Belgium, Ireland and the Netherlands, all exceeding the EU-15 average by about 20% (nearly 30% in the case of Belgium). Productivity in the US is close to the level of the EU productivity leaders. Catching up with the productivity leaders represents a considerable potential for accelerated growth in most Member States, in particular those that have joined the EU since Table 4.11 Productivity per hour relative to the EU-15 average Source: Eurostat. Note: (e) = estimated value, (f) = forecast EU EA EA13 : EA BE e e e CZ 44.2 e DK DE EE : IE 96.9 e e e EL ES FR f IT f LV : 30.6 e 35.4 e LT 29.9 e LU e e e MT : 76.6 e 71.5 e NL e e AT PL : 41.4 e 45.6 e PT 60.2 e 66.0 e 59.5 f SI : 61.0 e 67.9 e SK 38.7 e FI SE UK 90.0 e 94.3 e 99.7 e US JP 76.4 e 77.2 e 80.8 f Even the productivity leaders can accelerate their growth by further raising general education levels, removing obstacles to innovation and structural change, and boosting research and development leading to new products and more efficient production processes. However, the potential to move the production frontier is harder to quantify than the catch-up potentials Unlocking the potential for productivity growth Labour productivity depends to a large extent on previous investment in human capital. Table 4.12 shows that in 2005 around 15% of all young people in the EU-25, 6 million persons aged EN 96 EN
98 18 to 24, came under the category of early school-leavers 68. The Lisbon target agreed to by the Member States for this category is to reduce early school-leaving to below 10%. The proportion of early school-leavers was particularly high among men and in some Member States more than one third of young men had dropped out of school. These early schoolleavers will have poor employment prospects, their risk of being unemployed will be much higher than average and if they do find work, it will tend to be low-productivity and lowquality jobs. Table 4.12 Early school-leavers in %, 2005 Source: Eurostat. Women Men BE CZ 7 6 DK 8 9 DE EE EL 9 18 ES FR IE IT CY LV 8 16 LT 6 12 LU HU MT NL AT 9 9 PL 4 7 PT SI 3 6 SK 6 6 FI 7 11 SE 8 9 UK EU Another important indicator of educational attainment is the upper-secondary education completion rate among year-olds. Upper secondary education is the phase when the majority of young people prepare for transition into the labour market. This rate has stagnated at around 77% since 2000 (74% for men, 79% for women), as against the Lisbon target agreed by the Member States of at least 85%. Table 4.13 shows that in 2005 only five Member States had reached this target for men. Among 22-year-olds, a larger share of women had completed upper secondary education than men. This is reflected not only in the EU average but also in the figures for almost every single Member State. The young cohorts are on average achieving a higher level of educational than earlier cohorts. The share of the total population having completed secondary education in Member States ranges from 26% up to 90% and is generally lower than that of women and men aged Percentage of the population aged with at most lower secondary education and not in further education or training. EN 97 EN
99 Table 4.13 Educational attainment in 2005 (% completing secondary education)* Women Men Total population aged BE CZ DK DE EE EL ES FR IE IT CY LV LT LU HU MT NL AT PL PT SI SK FI SE UK EU * Percentage of those aged and total population who have successfully completed at least upper-secondary education (ICED3) Source: Eurostat. A good initial education provides the basis for lifelong learning which is vital for keeping skills up-to-date and remaining employable. Lifelong learning can be measured by looking at participation in training of people aged For this group the Lisbon target agreed to by the Member States is 12.5%. Table 4.14 shows that in southern European countries and in most new Member States the likelihood of having recently participated in training is lowest and often hardly exceeds half the EU-15 average. Generally, older workers tend to be less likely to participate in training in all Member States A more extensive discussion on education can be found in the Commission paper "Progress towards the Lisbon Objectives in Education and Training", EN 98 EN
100 Table 4.14 Life Long Learning: % of workers between having participated in some form of training during the last 4 weeks Source: Eurostat New Cronos Total Men Women EU EU EU EU EU BE BG CZ DK DE EE IE EL ES FR IT CY LV LT LU HU MT NL AT PL PT RO SI SK FI SE UK As regards the gender dimension, in most countries women participated more in lifelong learning than men, independently of their educational attainment levels. Persons with higher initial educational attainment levels and younger generations also do more training: highly educated people participate seven times more in lifelong learning those with a low level of education, while participation decreases after the age of 34. In order to compete successfully in the knowledge economy, tertiary education is becoming increasingly important. The development of new technologies and their transformation into new products and services and better production methods requires highly skilled graduates. Yet, at present the EU invests approximately 1.2% of GDP in tertiary education compared to nearly 2.9% in the US. A lack of top-level graduates may limit the scope for raising the overall level of investment in research and development. But inadequate funding of research may also lead to a brain drain EN 99 EN

101 with many highly qualified researchers moving to centres of excellence elsewhere. Figure 4.10 shows that there are large differences between the Member States in the amount of money spent on R&D. Sweden and Finland are the two best ranked countries with around 3.5% of GDP. The EU average is below 2% while R&D spending in the US represents close to 2.7% of GDP. Figure 4.10 R&D Intensity (Gross domestic expenditure on R&D (GERD) as % of GDP) Notes: (1) EL: 2003; BE, IT, MT, NL, SI, UK: (2) PL: 2008; IE: 2013; UK: (3) IE: The target is 2.50% of GNP in (4) EU-25: The EU-25 R&D intensity for 2005 was estimated by DG Research. EU-25: The EU-25 R&D intensity for 2010 results from the aggregation of the targets set by the Member States (including estimated targets for IE, PL and the UK). (5) Member States have been ranked according to the current level of R&D intensity from left to right. Taken from the annex to the 2006 Annual Lisbon Progress Report: Macro-economic, micro-economic and employment issues, European Commission Ageing consumers and the silver economy Europe, together with Japan, will be the first region in the world to experience rapid population ageing. This will result in major shifts in demand patterns towards goods and services adapted to the needs of the elderly. Europe has the opportunity to become a world leader in these new markets for older consumers. The size of these new markets will depend on the number of older consumers and on their purchasing power, which is more difficult to assess. According to the AARP (the American Association of Older People), consumers over the age of 45 were already responsible for more than half (52%) of total consumer spending in the United States in 2001, up from 47% in Between 1984 and 2001, the total average annual expenditure of older consumers in the US increased at a greater rate (+8%) than that for all consumers (+6%), largely reflecting the ageing of the baby boomers. Given that the average retirement incomes of many pensioners in EN 100 EN
102 the EU are comparable or even better than those in the US, thanks to higher replacement rates, a similar rise in the purchasing power of older persons as a group can be expected in the EU 70. In a recent study, the Deutsches Institut for Wirtschaft (DIW) 71 has confirmed the increasing importance of the older generation for the economy. Persons over 60 are already responsible for almost one third of total private consumption in Germany. This share is expected to increase on purely demographic grounds to more than 40% in Total consumer spending in Germany is expected to decrease 6% by 2050 compared to This decrease is likely to affect all age categories except persons older than 75. Demographic ageing will lead to a reduction in consumer spending on all goods and services except for health and long-term care. Ageing has already started to influence consumer spending in Germany. Over the last 10 years, persons over 75 have almost doubled their consumer spending from 43 to 80 billion. The DIW study predicts that the growing size of this age group will lead to another doubling of their spending to 168 billion by The Dutch Ministry of Social Affairs has recently published a report on the future income situation of older Dutch citizens 72. Figure 4.11 shows the average disposable income for households in 2006 according to age. Disposable income peaks at the age of 40. Thereafter it starts to decline as a result of decreasing labour force participation and stagnating career profiles. At the official retirement age of 65 there is a slight increase. Pension income at the age of 80 is lower than at the age of 65, as there were in the past fewer opportunities to accumulate a second-pillar pension. Figure 4.11 Disposable household income according to age, 2006 Source: Dutch Ministry of Social Affairs 2006, MICROS. Figure 4.11 also displays equivalised income (correcting for differences in household composition). Equivalised income remains almost flat from the mid-20s to 80 years of age. The report thus concludes that older people enjoy income levels that are similar to those of people between 30 and 64 years of age. However, it should be noted that the relative income 70 Gaberlavage, G., Beyond 50.04: A Report to the Nation on Consumers in the Marketplace, Research Report, AARP Public Policy Institute, May Buslei, H., E. Schulz and V. Steiner, Auswirkungen des demographischen Wandels auf die private Nachfrage nach Gütern und Dienstleistungen in Deutschland bis 2050, DIW Berlin, 2006, commissioned by the Bundesministerium für Familie, Senioren, Frauen und Jugend. 72 Future income of older people, Working document, Dutch Ministry of Social Affairs, 2006, in Dutch see EN 101 EN
103 situation of older people in the Netherlands is very good compared to that of some other Member States. The information on income gives an incomplete picture of purchasing power. Wealth tends to be concentrated in the hands of older people, notably in the form of home ownership, which, for many households, represents their most important private asset, with the possible exception of private pension entitlements. Financial instruments such as reverse mortgages may allow older people to use housing wealth for consumption purposes, which could boost the purchasing power of the elderly. The combination of good supply conditions (high levels of education, R&D, responsive and flexible markets) and the growing purchasing power of older consumers offers a huge new potential for economic growth, sometimes referred to as the silver economy. There is no precise definition of this concept, so there are no statistics measuring the progress towards the silver economy. This is not a single new sector of the economy, but rather a wide range of age-related products and services in many existing sectors, including information and communication technologies, financial services, housing, transport, energy, tourism, culture, infrastructures, and local services as well as long-term care. BOX 4.3 A European network to promote the silver economy An interesting illustration of what may be possible under the heading of the Silver Economy is provided by the SEN@R network 73. This network brings together 12 EU regions, representing 6 countries and 53 million inhabitants, with the aim to develop new ageingrelated goods and services opportunities. Within the network, special interest groups have been set up around themes such as financial services, culture and tourism, health and life style, and independent living. In 2006 the network held a second large Silver Economy conference in Kerkrade (NL), at which many interesting examples were presented 74. The European Central Bank has recently presented an overview of the consequences of ageing in the banking sector 75. Banks may face a decrease in business as a result of lower interest income and a declining demand for traditional services such as personal credit and mortgages. On the other hand, they could increase their business in other areas by offering new products tailored to senior customers (e.g. reverse mortgages), thus compensating for the decreasing demand for credit and mortgages among younger customers. There will also be a growing demand for asset management and advisory services. Banks will also have to adjust to new risks (i.e. longevity risk) which are linked to some of the new products such as annuities. Furthermore, the traditional boundaries between banks, insurance companies and investment companies are likely to become blurred. Older people also represent an important demand factor as the main consumers of health and long-term care services. The increased demand for these services is going to create many new jobs. At the same time, available public resources have to be used in a rational way to ensure financial sustainability. One way to limit the need for expensive institutional care is to enable older people to remain in their homes as long as possible. Information and Communication Technologies (ICT) in combination with both formal and informal care may make this Maddoni, A. and others, Macro economic implications of demographic developments in the Euro area, ECB occasional paper series, No 51, August EN 102 EN
104 feasible for much larger groups of older people than is currently the case. Even many frail elderly people suffering from chronic diseases could, thanks to the right technologies, continue to live independently. BOX 4.4 Products and services for independent living based on new technologies 76 Older people are more likely to suffer from functional limitations in areas such as mobility, vision, hearing and in some aspects of cognitive performance. Specifically designed ICTbased assistive technologies can be of great benefit. In particular, the design-for-all approach appears very promising for the development of new products. There are three domains where ICT applications may particularly benefit older persons with limitations. - In the assistive technology domain, ICT-based products are designed to compensate for motor, sensory and cognitive difficulties frequently experienced by older adults. For instance, speech technology has been deployed in assistive technology applications during recent years. Portable devices have been developed to detect lost objects like a key, to support people with light to moderate memory loss. Also personalised route guidance systems for travelling or use at home have been developed for elderly persons with impaired mobility. In the longer run, more powerful devices are expected, including robots designed to support dependent people in carrying out a variety of tasks such as navigating and manipulating every day objects without any human support. In the assistive technology domain more than products (not all involving an ICT component) have become available during the last decade. Unfortunately, most are produced in small series and therefore at a very high price. There is also much latent demand in that people in need of an assistive technology are not aware that a product is on the market. - In the smart home domain, support for the independence of older people can be provided by adding intelligence networks to the immediate home environment. ICT is used to integrate various home appliances, devices and services to enable residents to control and monitor their living space from any location within the home. This may encompass relatively simple home automation functions, such as turning lights on and off, smoke alarms or access control; it can also involve of fully automated electrical systems. Despite a considerable research effort to exploit smart home technology, actual take-up is still largely confined to experimental settings and demonstrators. The lack of technical standards inhibits the creation of the right conditions for a mass market for smart home applications. However, recent activities in the consumer electronics industry may lead to the emergence of a commercial value chain along which home networking products and services may soon flow to the consumer. - In the tele-care/tele-medicine domain, the focus is on applications utilizing ICT to enable the remote provision of support by parties that usually interact with older people in a care-related context. Applications include for instance alarm systems addressing security-related needs, e.g. getting help in an emergency, and the remote monitoring of vital data for medical purposes. Psycho-social needs can also be catered for with the help of video-telephony to provide social support and reassurance. 76 Impacts of New Technologies and Information Society, Walter demographic impact study by Empirica and the Work Research Centre, 2005 available at See also the Joint Research Plan on the basis of Article 169 of the Treaty on Ambient Assisted Living EN 103 EN
105 Some alarm systems are location-independent, allowing users to initiate an alarm whenever and wherever they need to. Alarm systems are by now the most widely used Independent Living Technology application, although actual take-up varies considerably across countries. In the EU-15 Member States, on average some 4% of the 50+ population have such alarms. Figure: Community alarm services used by the EU population Source: Empirica WRC While active alarm systems require the client to actively call for help when an emergency arises, passive systems are triggered by the absence of a particular event. The simplest passive alarm system consists of monitoring agreed regular telephone calls made by the individual to a service centre and triggering an alarm if a call is not made. More recent passive alarm systems have been automated and often combined with the monitoring of particular health parameters such as blood pressure or temperature. Market potentials will dramatically rise due to demographic development, particularly among the very old. For instance, the potential demand for tele-care applications capable of addressing the needs of people being treated for heart diseases is likely to nearly triple between 2005 and 2050, from 4 million to 11 million. The Independent Living Technology (ILT) domain has not yet matured; only few applications such as community alarms and assistive technology devices are widely available today. Many ILT implementations still exist only in experimental settings. In conclusion it can be stated that only a minority of older people are currently benefiting from ILT applications that have a high potential utility for them. Market forces alone will not ensure that ICT developments in response to demographic ageing will be optimal for older people and for European society as a whole. Public policy will be required to help shape developments in the ways needed to exploit the positive potential and reduce the likelihood of negative impacts Conclusion There is considerable scope for productivity growth in the EU, both in catching up with the productivity leaders and by investing in human capital as well as research and in development, thereby boosting Europe s innovation potential and capacity to adapt to a changing economic environment. Older people, in particular the retired have still very low EN 104 EN
106 levels of ICT skills and a below-average use of the internet 77. This will also strengthen the ability of European businesses and workers to seize the new economic opportunities arising from the silver economy, i.e. new goods and services responding to the needs of an ageing population Receiving and integrating immigrants in Europe The Communication on the demographic future of Europe emphasised the importance of continued immigration. This will be necessary to meet the needs of the European labour market, both for qualified and unskilled labour. Europe s prosperity and political stability, along with the dynamic population growth in neighbouring countries, will ensure that immigration can at least partly offset the decline in Europe s potential labour force due to large cohorts retiring from the labour market and small young cohorts entering it. However, the Communication also stressed the importance of integrating immigrants and respecting the needs of their countries of origin The potential of migration for redressing labour market imbalances For more than two centuries, most countries of Europe have primarily been countries of emigration, but the last 60 years have seen all countries of Western Europe gradually become destinations for international migrants and asylum seekers. Today, all western European countries and several central European Member States of the European Union have a positive migration balance. Over recent years, net migration into the enlarged EU appears to have exceeded migration into other traditional recipient nations such as the United States of America. Figure 4.12 Net migration Source: Eurostat, OECD Employment and Labour Market Statistics. Notes: Net migration is measured as the difference between the total population on 1 January and 31 December for a given 77 See also the Commission s second annual progress report on the Information Society (IP/07/453), and the forthcoming communication on ICT and Ageing Well in the Information Society. 78 There is also a supply side aspect to ageing as social services may also benefit from a larger proportion of elderly due to their involvement in volunteer activities. See EN 105 EN
107 calendar year, minus the difference between births and deaths (or natural increase). The figures reflect large-scale regularisations in some Member States. In some Member States, the number of deaths already exceeds the number of births ( natural population decrease ), but positive net migration prevents the population from actually shrinking. Over the coming years, more and more countries will experience a natural population decrease, so immigration might become increasingly important. Table 4.15 compares the projected decline in the working age population with the expected cumulative total inflow of migrants. It also shows the share of the gross fall (i.e. without migration) likely to be offset by projected numbers of immigrants (column IV). These are simplified assumptions, but the calculation gives a rough indication of the contribution of continued immigration in the years to come. Table 4.15 Population of working age and migration, Non-EU immigrants as % of pop Projected decline in the population of working age Immigration assumed under the baseline scenario 2050 III/(II + III) I (%) II (thous.) III (thous.) IV CZ DK DE EE IE EL ES FR IT CY LV LT LU HU MT NL AT PL : PT RO SI SK FI SE UK Source: Eurostat population projections. EN 106 EN
108 Around 56 million persons entering the country and finding jobs would be needed to compensate for the projected reduction in the population of working age for the EU-27. Some countries, typically those with the highest projected fertility rates such as Ireland, would not need additional labour in order to maintain current job levels. Other Member States would require quite dramatic numbers of immigrants (Germany, Spain, Italy and Poland). All in all, net migration well above the European levels of recent decades would be necessary to compensate for the decline in the working age population. However, migrant inflows have varied dramatically in recent years across Member States, with countries bordering the Mediterranean receiving vastly greater influxes of migrants in absolute terms than other areas of the EU. Figure 4.13 Non-EU migration inflows, 5-year averages 1,2% 1,0% 0,8% 0,6% 0,4% 0,2% 0,0% LV SK MT LT PT FI HU CZ BE SI SE NL IE DK IT UK DE LU AT ES CY EE EL FR Source: Eurostat. Note: Years indicate first year of period. Rates are calculated as the number of non-eu migrants per year divided by total population. Not only the magnitude but also the nature of migration flows differs greatly across the EU. Figure 4.14 shows figures for a number of OECD countries. Illegal migration has been a major cause for concern in EU countries bordering the Mediterranean and Spain, Italy and Greece have all regularised the status of large numbers of illegal migrants within recent years The European Council and the European Commission have taken a wide range of initiatives aimed at dealing with the challenges posed by this issue, see COM(2005) 621, COM(2006) 402 and COM(2006) 735. EN 107 EN

109 Figure 4.14 International migration by category of entry, selected OECD countries, 2004, harmonised data, % of total inflows Source: OECD. Note: OECD harmonised statistics, for details of sources see: To the extent that employment opportunities are unevenly distributed across the EU, the internal mobility of workers in the EU also represents an enormous potential for higher rates of participation and employment on the labour market. The full potential of intra-eu mobility is, however, not yet harnessed, as transitional arrangements still restrict the mobility of citizens from the Member States that have joined the EU since Table 4.16 shows that currently the percentage of non-eu nationals in EU-15 Member States is significantly higher than the percentage of EU-10 nationals. Labour market data show that employment rates among EU-10 nationals residing in other EU countries are comparable to the rates for nationals of those countries and other EU-15 nationals. Moreover, they are generally higher than for non-eu nationals. In Ireland, Spain and the UK, EU-10 nationals even have higher employment rates than local nationals. This shows that EU-10 nationals positively contribute to overall labour market performance, to sustained economic growth and to the state of public finances in their host countries See COM(2006) Ibid. EN 108 EN
Social Protection and Social Inclusion in Europe Key facts and figures
 MEMO/08/625 Brussels, 16 October 2008 Social Protection and Social Inclusion in Europe Key facts and figures What is the report and what are the main highlights? The European Commission today published
PROGRESS TOWARDS THE LISBON OBJECTIVES 2010 IN EDUCATION AND TRAINING
 PROGRESS TOWARDS THE LISBON OBJECTIVES IN EDUCATION AND TRAINING In 7, reaching the benchmarks for continues to pose a serious challenge for education and training systems in Europe, except for the goal
PROGRESS TOWARDS THE LISBON OBJECTIVES 2010 IN EDUCATION AND TRAINING
 PROGRESS TOWARDS THE LISBON OBJECTIVES IN EDUCATION AND TRAINING In, reaching the benchmarks for continues to pose a serious challenge for education and training systems in Europe, except for the goal
Active Ageing. Fieldwork: September November Publication: January 2012
 Special Eurobarometer 378 Active Ageing SUMMARY Special Eurobarometer 378 / Wave EB76.2 TNS opinion & social Fieldwork: September November 2011 Publication: January 2012 This survey has been requested
Special Eurobarometer 418 SOCIAL CLIMATE REPORT
 Special Eurobarometer 418 SOCIAL CLIMATE REPORT Fieldwork: June 2014 Publication: November 2014 This survey has been requested by the European Commission, Directorate-General for Employment, Social Affairs
Themes Income and wages in Europe Wages, productivity and the wage share Working poverty and minimum wage The gender pay gap
 5. W A G E D E V E L O P M E N T S At the ETUC Congress in Seville in 27, wage developments in Europe were among the most debated issues. One of the key problems highlighted in this respect was the need
COVER NOTE The Employment Committee Permanent Representatives Committee (Part I) / Council EPSCO Employment Performance Monitor - Endorsement
 / Council EPSCO Employment Performance Monitor - Endorsement") COUNCIL OF THE EUROPEAN UNION Brussels, 15 June 2011 10666/1/11 REV 1 SOC 442 ECOFIN 288 EDUC 107 COVER NOTE from: to: Subject: The Employment Committee Permanent Representatives Committee (Part I) / Council
COUNCIL OF THE EUROPEAN UNION Brussels, 15 June 2011 10666/1/11 REV 1 SOC 442 ECOFIN 288 EDUC 107 COVER NOTE from: to: Subject: The Employment Committee Permanent Representatives Committee (Part I) / Council
Securing sustainable and adequate social protection in the EU
 Securing sustainable and adequate social protection in the EU Session on Social Protection & Security IFA 12th Global Conference on Ageing 11 June 2014, HICC Hyderabad India Dr Lieve Fransen European Commission
COUNCIL OF THE EUROPEAN UNION. Brussels, 13 June /1/13 REV 1 SOC 409 ECOFIN 444 EDUC 190
 COUNCIL OF THE EUROPEAN UNION Brussels, 13 June 2013 10373/1/13 REV 1 SOC 409 ECOFIN 444 EDUC 190 COVER NOTE from: to: Subject: The Employment Committee Permanent Representatives Committee (Part I) / Council
Flash Eurobarometer 470. Report. Work-life balance
 Work-life balance Survey requested by the European Commission, Directorate-General for Justice and Consumers and co-ordinated by the Directorate-General for Communication This document does not represent
COMMISSION OF THE EUROPEAN COMMUNITIES COMMISSION STAFF WORKING DOCUMENT. Demography Report 2008: Meeting Social Needs in an Ageing Society
 COMMISSION OF THE EUROPEAN COMMUNITIES Brussels, SEC(2008) 2911 COMMISSION STAFF WORKING DOCUMT Demography Report 2008: Meeting Social Needs in an Ageing Society Executive Summary SUMMARY Member States
January 2010 Euro area unemployment rate at 9.9% EU27 at 9.5%
 STAT//29 1 March 20 January 20 Euro area unemployment rate at 9.9% EU27 at 9.5% The euro area 1 (EA16) seasonally-adjusted 2 unemployment rate 3 was 9.9% in January 20, the same as in December 2009 4.
Gender pension gap economic perspective
 Gender pension gap economic perspective Agnieszka Chłoń-Domińczak Institute of Statistics and Demography SGH Part of this research was supported by European Commission 7th Framework Programme project "Employment
October 2010 Euro area unemployment rate at 10.1% EU27 at 9.6%
 STAT//180 30 November 20 October 20 Euro area unemployment rate at.1% EU27 at 9.6% The euro area 1 (EA16) seasonally-adjusted 2 unemployment rate 3 was.1% in October 20, compared with.0% in September 4.
Eurofound in-house paper: Part-time work in Europe Companies and workers perspective
 Eurofound in-house paper: Part-time work in Europe Companies and workers perspective Presented by: Eszter Sandor Research Officer, Surveys and Trends 26/03/2010 1 Objectives Examine the patterns of part-time
Flash Eurobarometer 408 EUROPEAN YOUTH REPORT
 Flash Eurobarometer EUROPEAN YOUTH REPORT Fieldwork: December 2014 Publication: April 2015 This survey has been requested by the European Commission, Directorate-General for Education and Culture and co-ordinated
Transition from Work to Retirement in EU25
 EUROPEAN CENTRE EUROPÄISCHES ZENTRUM CENTRE EUROPÉEN 1 Asghar Zaidi is Director Research at the European Centre for Social Welfare Policy and Research, Vienna; Michael Fuchs is Researcher at the European
No work in sight? The role of governments and social partners in fostering labour market inclusion of young people
 No work in sight? The role of governments and social partners in fostering labour market inclusion of young people Joint seminar of the European Parliament and EU agencies 30 June 2011 1. Young workers
COMMISSION OF THE EUROPEAN COMMUNITIES
 EN EN EN COMMISSION OF THE EUROPEAN COMMUNITIES Brussels, 29.4.2009 COM(2009) 180/4 COMMUNICATION FROM THE COMMISSION TO THE EUROPEAN PARLIAMENT, THE COUNCIL, THE EUROPEAN ECONOMIC AND SOCIAL COMMITTEE
PUBLIC PERCEPTIONS OF VAT
 Special Eurobarometer 424 PUBLIC PERCEPTIONS OF VAT REPORT Fieldwork: October 2014 Publication: March 2015 This survey has been requested by the European Commission, Directorate-General for Taxations and
Flash Eurobarometer N o 189a EU communication and the citizens. Analytical Report. Fieldwork: April 2008 Report: May 2008
 Gallup Flash Eurobarometer N o 189a EU communication and the citizens Flash Eurobarometer European Commission Expectations of European citizens regarding the social reality in 20 years time Analytical
Aggregation of periods for unemployment benefits. Report on U1 Portable Documents for mobile workers Reference year 2016
 Aggregation of periods for unemployment benefits Report on U1 Portable Documents for mobile workers Reference year 2016 Frederic De Wispelaere & Jozef Pacolet - HIVA KU Leuven June 2017 EUROPEAN COMMISSION
Growth, competitiveness and jobs: priorities for the European Semester 2013 Presentation of J.M. Barroso,
 Growth, competitiveness and jobs: priorities for the European Semester 213 Presentation of J.M. Barroso, President of the European Commission, to the European Council of 14-1 March 213 Economic recovery
Flash Eurobarometer 398 WORKING CONDITIONS REPORT
 Flash Eurobarometer WORKING CONDITIONS REPORT Fieldwork: April 2014 Publication: April 2014 This survey has been requested by the European Commission, Directorate-General for Employment, Social Affairs
The economic and budgetary consequences of ageing populations
 The economic and budgetary consequences of ageing populations Henri Bogaert Bureau du Plan and Chairman of the Ageing Working Group Giuseppe Carone European Commission DG ECFIN Rome, 23 February 2007 Outline
EUROPE 2020 STRATEGY FORECASTING THE LEVEL OF ACHIEVING ITS GOALS BY THE EU MEMBER STATES
 Abstract. Based on the interdependencies that exist between world economies, the effects of the Europe 2020 strategy is going to affect every company no matter if it operates or not in an EU member state.
Employment of older workers Research Note no. 5/2015
 Research Note no. 5/2015 E. Őzdemir, T. Ward M. Fuchs, S. Ilinca, O. Lelkes, R. Rodrigues, E. Zolyomi February - 2016 EUROPEAN COMMISSION Directorate-General for Employment, Social Affairs and Inclusion
The Skillsnet project on Medium-term forecasts of occupational skill needs in Europe: Replacement demand and cohort change analysis
 The Skillsnet project on Medium-term forecasts of occupational skill needs in Europe: Replacement demand and cohort change analysis Paper presented at the Workshop on Medium-term forecast of occupational
Country Health Profiles
 State of Health in the EU Country Health Profiles Brussels, November 2017 1 The Country Health Profiles 1. Highlights 2. Health status 3. Risk Factors 4. Health System (description) 5. Performance of Health
European Commission Directorate-General "Employment, Social Affairs and Equal Opportunities" Unit E1 - Social and Demographic Analysis
 Research note no. 1 Housing and Social Inclusion By Erhan Őzdemir and Terry Ward ABSTRACT Housing costs account for a large part of household expenditure across the EU.Since everyone needs a house, the
Aleksandra Dyba University of Economics in Krakow
 61 Aleksandra Dyba University of Economics in Krakow dyba@uek.krakow.pl Abstract Purpose development is nowadays a crucial global challenge. The European aims at building a competitive economy, however,
Meeting Social Needs in an Ageing Society
 Meeting Social Needs in an Ageing Society Dr Krzysztof Iszkowski DG for Employment, Social Affairs and Equal Opportunities Social and demographic analysis 2 European population is growing, but: for how
The EFTA Statistical Office: EEA - the figures and their use
 The EFTA Statistical Office: EEA - the figures and their use EEA Seminar Brussels, 13 September 2012 1 Statistics Comparable, impartial and reliable statistical data are a prerequisite for a democratic
COMMISSION STAFF WORKING DOCUMENT Accompanying the document. Report form the Commission to the Council and the European Parliament
 EUROPEAN COMMISSION Brussels, 4.5.2018 SWD(2018) 246 final PART 5/9 COMMISSION STAFF WORKING DOCUMENT Accompanying the document Report form the Commission to the Council and the European Parliament on
Working away at the cost of ageing: the labour market adjusted dependency ratio
 Working away at the cost of ageing: the labour market adjusted dependency ratio EPC Issue Paper No.64 April 2011 By Benedetta Guerzoni and Fabian Zuleeg ISSN 1782-494X EUROPE S POLITICAL ECONOMY PROGRAMME
Parlemeter - November 2012 European Parliament Eurobarometer (EB/EP 78.2)
") Directorate-General for Communication Public Opinion Monitoring Unit Parlemeter - November European Parliament Eurobarometer (EB/EP 78.2) ANALYTICAL SYNTHESIS Brussels, 14 February 2013. Coverage: Population:
Directorate-General for Communication Public Opinion Monitoring Unit Parlemeter - November European Parliament Eurobarometer (EB/EP 78.2) ANALYTICAL SYNTHESIS Brussels, 14 February 2013. Coverage: Population:
Flash Eurobarometer 458. Report. The euro area
 The euro area Survey requested by the European Commission, Directorate-General for Economic and Financial Affairs and co-ordinated by the Directorate-General for Communication This document does not represent
New Europeans. Fieldwork : March 2010 April 2010 Publication: April 2011
 Special Eurobarometer European Commission New Europeans Report Fieldwork : March 2010 April 2010 Publication: April 2011 Special Eurobarometer 346 / Wave TNS Opinion & Social This survey was requested
Continued slow employment response in 2004 to the pick-up in economic activity in Europe.
 Executive Summary - Employment in Europe report 2005 Continued slow employment response in 2004 to the pick-up in economic activity in Europe. Despite the pick up in economic activity employment growth
Fieldwork February March 2008 Publication October 2008
 Special Eurobarometer 298 European Commission Consumer protection in the internal market Fieldwork February March 2008 Publication October 2008 Report Special Eurobarometer 298 / Wave 69.1 TNS Opinion
NOTE ON EU27 CHILD POVERTY RATES
 NOTE ON EU7 CHILD POVERTY RATES Research note prepared for Child Poverty Action Group Authors: H. Xavier Jara and Chrysa Leventi Institute for Social and Economic Research (ISER) University of Essex The
COMMISSION DECISION of 23 April 2012 on the second set of common safety targets as regards the rail system (notified under document C(2012) 2084)
 2084)") 27.4.2012 Official Journal of the European Union L 115/27 COMMISSION DECISION of 23 April 2012 on the second set of common safety targets as regards the rail system (notified under document C(2012) 2084)
27.4.2012 Official Journal of the European Union L 115/27 COMMISSION DECISION of 23 April 2012 on the second set of common safety targets as regards the rail system (notified under document C(2012) 2084)
Pensions and other age-related expenditures in Europe Is ageing too expensive?
 1 Pensions and other age-related expenditures in Europe Is ageing too expensive? Bo Magnusson bo.magnusson@his.se Bernd-Joachim Schuller bernd-joachim.schuller@his.se University of Skövde Box 408 S-541
Two years to go to the 2014 European elections European Parliament Eurobarometer (EB/EP 77.4)
") Directorate-General for Communication PUBLIC OPINION MONITORING UNIT Brussels, 23 October 2012. Two years to go to the 2014 European elections European Parliament Eurobarometer (EB/EP 77.4) FOCUS ON THE
Directorate-General for Communication PUBLIC OPINION MONITORING UNIT Brussels, 23 October 2012. Two years to go to the 2014 European elections European Parliament Eurobarometer (EB/EP 77.4) FOCUS ON THE
Live Long and Prosper? Demographic Change and Europe s Pensions Crisis. Dr. Jochen Pimpertz Brussels, 10 November 2015
 Live Long and Prosper? Demographic Change and Europe s Pensions Crisis Dr. Jochen Pimpertz Brussels, 10 November 2015 Old-age-dependency ratio, EU28 45,9 49,4 50,2 39,0 27,5 31,8 2013 2020 2030 2040 2050
Report on the distribution of direct payments to agricultural producers (financial year 2016)
") Report on the distribution of direct payments to agricultural producers (financial year 2016) Every year, the Commission publishes the distribution of direct payments to farmers by Member State. Figures
Report on the distribution of direct payments to agricultural producers (financial year 2016) Every year, the Commission publishes the distribution of direct payments to farmers by Member State. Figures
in focus Statistics T he em ploym ent of senior s in t he Eur opean Union Contents POPULATION AND SOCIAL CONDITIONS 15/2006 Labour market
 T he em ploym ent of senior s in t he Eur opean Union Statistics in focus OULATION AND SOCIAL CONDITIONS 15/2006 Labour market Authors Christel ALIAGA Fabrice ROMANS Contents In 2005, in the EU-25, 22.2
Aging with Growth: Implications for Productivity and the Labor Force Emily Sinnott
 Aging with Growth: Implications for Productivity and the Labor Force Emily Sinnott Emily Sinnott, Senior Economist, The World Bank Tallinn, June 18, 2015 Presentation structure 1. Growth, productivity
In 2008 gross expenditure on social protection in EU-27 accounted for 26.4 % of GDP
 Population and social conditions Author: Antonella PUGLIA Statistics in focus 17/2011 In 2008 gross expenditure on social protection in EU-27 accounted for 26.4 % of GDP Social protection benefits are
In 2009 a 6.5 % rise in per capita social protection expenditure matched a 6.1 % drop in EU-27 GDP
 Population and social conditions Authors: Giuseppe MOSSUTI, Gemma ASERO Statistics in focus 14/2012 In 2009 a 6.5 % rise in per capita social protection expenditure matched a 6.1 % drop in EU-27 GDP Expenditure
REGIONAL PROGRESS OF THE LISBON STRATEGY OBJECTIVES IN THE EUROPEAN REGION EGRI, ZOLTÁN TÁNCZOS, TAMÁS
 REGIONAL PROGRESS OF THE LISBON STRATEGY OBJECTIVES IN THE EUROPEAN REGION EGRI, ZOLTÁN TÁNCZOS, TAMÁS Key words: Lisbon strategy, mobility factor, education-employment factor, human resourches. CONCLUSIONS
Flash Eurobarometer 458. The euro area
 The euro area Survey requested by the European Commission, Directorate-General for Economic and Financial Affairs and co-ordinated by the Directorate-General for Communication This document does not represent
Europeans attitudes towards the issue of sustainable consumption and production. Analytical report
 Flash Eurobarometer 256 The Gallup Organisation Analytical Report Flash EB N o 251 Public attitudes and perceptions in the euro area Flash Eurobarometer European Commission Europeans attitudes towards
Investment and Investment Finance. the EU and the Polish story. Debora Revoltella
 Investment and Investment Finance the EU and the Polish story Debora Revoltella Director - Economics Department EIB Warsaw 27 February 2017 Narodowy Bank Polski European Investment Bank Contents We look
Fiscal sustainability challenges in Romania
 Preliminary Draft For discussion only Fiscal sustainability challenges in Romania Bucharest, May 10, 2011 Ionut Dumitru Anca Paliu Agenda 1. Main fiscal sustainability challenges 2. Tax collection issues
Relative Affluence and Fertility: Reviewing the Easterlin s Hypothesis via Subjective Survey Data from Eurobarometer
 Relative Affluence and Fertility: Reviewing the Easterlin s Hypothesis via Subjective Survey Data from Eurobarometer Tommaso Gennari 1, Francesco Scalone 2 Paper presented at the 2009 Annual Meeting of
EUROPEAN COMMISSION EUROSTAT
 EUROPEAN COMMISSION EUROSTAT Directorate F: Social statistics Unit F-3: Labour market Doc.: Eurostat/F3/LAMAS/29/14 WORKING GROUP LABOUR MARKET STATISTICS Document for item 3.2.1 of the agenda LCS 2012
Issues Paper. 29 February 2012
 29 February 212 Issues Paper In the context of the European semester, the March European Council gives, on the basis of the Commission's Annual Growth Survey, guidance to Member States for the Stability
Joint Parliamentary Meeting. Social Cohesion and Demographic Development in a Sustainable Europe
 DIRECTORATE GENERAL FOR INTERNAL POLICIES POLICY DEPARTMENT A: ECONOMIC AND SCIENTIFIC POLICY POLICY DEPARTMENT B: STRUCTURAL AND COHESION POLICIES POLICY DEPARTMENT C: CITIZENS' RIGHTS AND CONSTITUTIONAL
Proposal for a DECISION OF THE EUROPEAN PARLIAMENT AND OF THE COUNCIL. on the European Year for Active Ageing (2012) (text with EEA relevance)
 (text with EEA relevance)") EUROPEAN COMMISSION Brussels, 6.9.2010 COM(2010) 462 final 2010/0242 (COD) C7-0253/10 Proposal for a DECISION OF THE EUROPEAN PARLIAMENT AND OF THE COUNCIL on the European Year for Active Ageing (2012)
EUROPEAN COMMISSION Brussels, 6.9.2010 COM(2010) 462 final 2010/0242 (COD) C7-0253/10 Proposal for a DECISION OF THE EUROPEAN PARLIAMENT AND OF THE COUNCIL on the European Year for Active Ageing (2012)
Swedish Fiscal Policy. Martin Flodén, Laura Hartman, Erik Höglin, Eva Oscarsson and Helena Svaleryd Meeting with IMF 3 June 2010
 Swedish Fiscal Policy Martin Flodén, Laura Hartman, Erik Höglin, Eva Oscarsson and Helena Svaleryd Meeting with IMF 3 June 21 The S2 indicator Ireland Greece Luxembourg United Slovenia Spain Lithuania
Employment and Social Policy
 Special Eurobarometer 377 European Commission Employment and Social Policy REPORT Special Eurobarometer 377 / Wave TNS opinion & social Fieldwork: September October 2011 Publication: December 2011 This
Weighting issues in EU-LFS
 Weighting issues in EU-LFS Carlo Lucarelli, Frank Espelage, Eurostat LFS Workshop May 2018, Reykjavik carlo.lucarelli@ec.europa.eu, frank.espelage@ec.europa.eu 1 1. Introduction The current legislation
COMMISSION STAFF WORKING DOCUMENT Accompanying the document
 EUROPEAN COMMISSION Brussels, 9.10.2017 SWD(2017) 330 final PART 13/13 COMMISSION STAFF WORKING DOCUMENT Accompanying the document REPORT FROM THE COMMISSION TO THE EUROPEAN PARLIAMENT, THE COUNCIL, THE
V. MAKING WORK PAY. The economic situation of persons with low skills
 V. MAKING WORK PAY There has recently been increased interest in policies that subsidise work at low pay in order to make work pay. 1 Such policies operate either by reducing employers cost of employing
Investment in France and the EU
 Investment in and the EU Natacha Valla March 2017 22/02/2017 1 Change relative to 2008Q1 % of GDP Slow recovery of investment, and with strong heterogeneity Overall Europe s recovery in investment is slow,
SOLIDARITY THAT SPANS THE GLOBE: EUROPEANS AND DEVELOPMENT AID
 Special Eurobarometer 392 SOLIDARITY THAT SPANS THE GLOBE: EUROPEANS AND DEVELOPMENT AID REPORT Fieldwork: June 2012 Publication: October 2012 This survey has been requested by Directorate-General Development
Standard Eurobarometer
 Standard Eurobarometer 67 / Spring 2007 Standard Eurobarometer European Commission SPECIAL EUROBAROMETER EUROPEANS KNOWELEDGE ON ECONOMICAL INDICATORS 1 1 This preliminary analysis is done by Antonis PAPACOSTAS
Aggregation of periods or salaries for unemployment benefits. Report on U1 portable documents for migrant workers
 Aggregation of periods or salaries for unemployment benefits Report on U1 portable documents for migrant workers Prof. dr. Jozef Pacolet and Frederic De Wispelaere HIVA KU Leuven June 2015 EUROPEAN COMMISSION
2 ENERGY EFFICIENCY 2030 targets: time for action
 ENERGY EFFICIENCY 2030 targets: time for action The Coalition for Energy Savings The Coalition for Energy Savings strives to make energy efficiency and savings the first consideration of energy policies
August 2008 Euro area external trade deficit 9.3 bn euro 27.2 bn euro deficit for EU27
 STAT/08/143 17 October 2008 August 2008 Euro area external trade deficit 9.3 27.2 deficit for EU27 The first estimate for the euro area 1 (EA15) trade balance with the rest of the world in August 2008
Consultation on the European Pillar of Social Rights
 Contribution ID: 05384989-c4b4-45c1-af8b-3faefd6298df Date: 23/12/2016 11:12:47 Consultation on the European Pillar of Social Rights Fields marked with * are mandatory. Welcome to the European Commission's
May 2009 Euro area external trade surplus 1.9 bn euro 6.8 bn euro deficit for EU27
 STAT/09/106 17 July 2009 May 2009 Euro area external trade surplus 1.9 6.8 deficit for EU27 The first estimate for the euro area 1 (EA16) trade balance with the rest of the world in May 2009 gave a 1.9
Macroeconomic Policies in Europe: Quo Vadis A Comment
 Macroeconomic Policies in Europe: Quo Vadis A Comment February 12, 2016 Helene Schuberth Outline Staff Projection of the Euro Area Monetary Policy Investment Rebalancing in the euro area Fiscal Policy
Taylor & Francis Open Access Survey Open Access Mandates
 Taylor & Francis Open Access Survey Open Access Mandates Annex C European Union November 2014 November 2014 0 The results presented in this report are based on research carried out on behalf of Taylor
Influence of demographic factors on the public pension spending
 Influence of demographic factors on the public pension spending By Ciobanu Radu 1 Bucharest University of Economic Studies Abstract: Demographic aging is a global phenomenon encountered especially in the
Flash Eurobarometer 441. Report. European SMEs and the Circular Economy
 European SMEs and the Circular Economy Survey requested by the European Commission, Directorate-General Environment and co-ordinated by the Directorate-General for Communication This document does not
RETIREMENT Differences in State of Affairs and legacies across the EU28
 RETIREMENT Differences in State of Affairs and legacies across the EU28 EC/OECD Workshop on delivering longer working lives and higher retirement ages Brussels, 12-13 November 2014 Fritz von Nordheim European
Taxation trends in the European Union EU27 tax ratio at 39.8% of GDP in 2007 Steady decline in top personal and corporate income tax rates since 2000
 DG TAXUD STAT/09/92 22 June 2009 Taxation trends in the European Union EU27 tax ratio at 39.8% of GDP in 2007 Steady decline in top personal and corporate income tax rates since 2000 The overall tax-to-gdp
January 2009 Euro area external trade deficit 10.5 bn euro 26.3 bn euro deficit for EU27
 STAT/09/40 23 March 2009 January 2009 Euro area external trade deficit 10.5 26.3 deficit for EU27 The first estimate for the euro area 1 (EA16) trade balance with the rest of the world in January 2009
Standard Eurobarometer 83 Spring 2015 THE EU BUDGET REPORT
 Standard Eurobarometer 83 Spring 2015 THE EU BUDGET REPORT Fieldwork: May 2015 This survey has been requested and co-ordinated by the European Commission, Directorate-General for Communication. http://ec.europa.eu/public_opinion/index_en.htm
Special Eurobarometer 459. Report. Climate change
 Climate change Survey requested by the European Commission, Directorate-General for Climate Action and co-ordinated by the Directorate- General for Communication This document does not represent the point
State of play of CAP measure Setting up of Young Farmers in the European Union
 State of play of CAP measure Setting up of Young Farmers in the European Union Michael Gregory EN RD Contact Point Seminar CEJA 20 th September 2010 Measure 112 rationale: Measure 112 - Setting up of young
Prerequisites for Active Ageing
 Prerequisites for Active Ageing ETUC conference EY2012: Improving solidarity between the generations and active ageing overcoming obstacles to older people remaining in work and facilitating access to
Joint Report on Social Protection and Social Inclusion 2010
 MEMO/1/62 Brussels, 4 March 1 Joint Report on Social Protection and Social Inclusion 1 What is the Joint Report and what does it cover? The Joint Report reviews the main trends in social protection and
COMMISSION STAFF WORKING DOCUMENT. accompanying document to the
 EN EN EN EUROPEAN COMMISSION Brussels, xxx SEC(9) yyy final COMMISSION STAFF WORKING DOCUMENT accompanying document to the REPORT FROM THE COMMISSION TO THE COUNCIL, THE EUROPEAN PARLIAMENT, THE EUROPEAN
46 ECB FISCAL CHALLENGES FROM POPULATION AGEING: NEW EVIDENCE FOR THE EURO AREA
 Box 4 FISCAL CHALLENGES FROM POPULATION AGEING: NEW EVIDENCE FOR THE EURO AREA Ensuring the long-term sustainability of public finances in the euro area and its member countries is a prerequisite for the
November 5, Very preliminary work in progress
 November 5, 2007 Very preliminary work in progress The forecasting horizon of inflationary expectations and perceptions in the EU Is it really 2 months? Lars Jonung and Staffan Lindén, DG ECFIN, Brussels.
THE 2015 EU JUSTICE SCOREBOARD
 THE 215 EU JUSTICE SCOREBOARD Communication from the Commission to the European Parliament, the Council, the European Central Bank, the European Economic and Social Committee and the Committee of the Regions
Developments for age management by companies in the EU
 Developments for age management by companies in the EU Erika Mezger, Deputy Director EUROFOUND, Dublin Workshop on Active Ageing and coping with demographic change Prague, 6 September 2012 12/09/2012 1
2009 Ageing Report : Assessing the economic and budgetary consequences of ageing populations: (projections for the EU27 Member States)
") 2009 Ageing Report : 1 Assessing the economic and budgetary consequences of ageing populations: (projections for the EU27 Member States) Giuseppe Carone (European Commission - DG ECFIN) Wien, 4 th December
2009 Ageing Report : 1 Assessing the economic and budgetary consequences of ageing populations: (projections for the EU27 Member States) Giuseppe Carone (European Commission - DG ECFIN) Wien, 4 th December
I. EUROPEANS AND THE TAX ON FINANCIAL TRANSACTION (TFT)...10 IV. THE REACTIONS OF THE MEMBER STATES TO THE CRISIS...19
...10 IV. THE REACTIONS OF THE MEMBER STATES TO THE CRISIS...19") Directorate General for Communication Directorate C - Relations with Citizens PUBLIC OPINION MONITORING UNIT Brussels, 22 June 2011 EUROPEANS AND THE CRISIS European Parliament Eurobarometer ( Parlemeter
Directorate General for Communication Directorate C - Relations with Citizens PUBLIC OPINION MONITORING UNIT Brussels, 22 June 2011 EUROPEANS AND THE CRISIS European Parliament Eurobarometer ( Parlemeter
Investment in Germany and the EU
 Investment in Germany and the EU Pedro de Lima Head of the Economics Studies Division Economics Department Berlin 19/12/2016 11/01/2017 1 Slow recovery of investment, with strong heterogeneity Overall
Social protection in the European Union
 Population and social conditions Author: Alexandra PETRÁŠOVÁ Statistics in focus 46/2008 Social protection in the European Union In 2005, expenditure on social protection accounted for 27.2% of GDP in
Research note 4/2010 Over-indebtedness New evidence from the EU-SILC special module
 Research note 4/2010 Over-indebtedness New evidence from the EU-SILC special module Social Situation Observatory Income distribution and living conditions Applica (BE), European Centre for the European
Fieldwork February March 2008 Publication June 2008
 Special Eurobarometer 297 European Commission Attitudes towards radioactive waste Fieldwork February March 2008 Publication June 2008 Report Special Eurobarometer 297 / Wave 69.1 TNS Opinion & Social This
Overview of EU public finances
 6 volume 17, 12/29B I Overview of EU public finances PRE-CRISIS DEVELOPMENTS Public finance developments in the EU up to 28 can be divided into three stages: In 1997, the Stability and Growth Pact entered
H Marie Skłodowska-Curie Actions (MSCA)
") H2020 Key facts and figures (2014-2020) Number of NL researchers funded by MSCA: EU budget awarded to NL organisations (EUR million): Number of NL organisations in MSCA: 427 268.91 351 In detail, the number
H2020 Key facts and figures (2014-2020) Number of NL researchers funded by MSCA: EU budget awarded to NL organisations (EUR million): Number of NL organisations in MSCA: 427 268.91 351 In detail, the number
Export of family benefits. Report on the questionnaire on the export of family benefits
 Report on the questionnaire on the export of family benefits Prof. dr. Jozef Pacolet and Frederic De Wispelaere HIVA-KU Leuven June 2015 EUROPEAN COMMISSION Directorate-General for Employment, Social Affairs
Flash Eurobarometer 386 THE EURO AREA REPORT
 Eurobarometer THE EURO AREA REPORT Fieldwork: October 2013 Publication: November 2013 This survey has been requested by the European Commission, Directorate-General for Economic and Financial Affairs and