David A Penn, Director and Associate Professor Business and Economic Research Center Jones College of Business Middle Tennessee State University
|
|
|
- Franklin Dorsey
- 5 years ago
- Views:
Transcription


1 David A Penn, Director and Associate Professor Business and Economic Research Center Jones College of Business Middle Tennessee State University David.Penn@mtsu.edu
2 National Economic Conditions GDP growing, but needs to grow more quickly Employment increasing moderately Unemployment rate falling, but Household balance sheet repairs improving Housing showing real improvement
3 Concerns U.S. trading partners weakening Euro zone very weak China slowing down Export growth is weakening Policy may tighten too quickly Inflation not remotely an issue Deficit falling rapidly Sequester managed, but could have been avoided

4 Growth of GDP GDP growth somewhat lower than pre-recession Problem: climbing out of a big hole
5 Shares of growth before and after the recession Household spending Investment spending Equipment and software Housing construction Exports Government spending
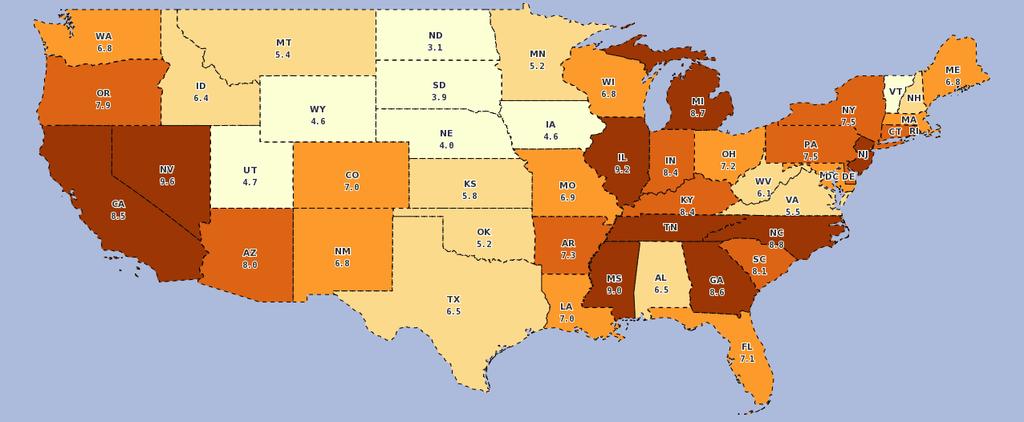
6 U.S. unemployment rate 7.6% June 2013 Still elevated Down just 0.6 points from one year ago Does not include discouraged workers
7 Inflation (CPI) 1.4% in May No evidence of sustained inflation Gives monetary policy some wiggle room
8 Inflation since 2008 due to oil price fluctuations
9 Balance Sheet Recession Net worth continues to repair, but still lower than 2007 peak after inflation Could reach recovery within 18 months
10 Household debt service 10.5% of disposable income At a 30- year low
11 New vehicle sales Sales climbed above 15 million vehicles in 2012 Still lower than prerecession levels But growth rate is impressive
12 Housing construction Single family permits on the rise since 2011
13 Monthly supply of new homes Just 4 months supply onhand. Explains rising housing construction and firming prices
14 Home Prices Rising from the low in 2011
15 US payroll employment Employers are hiring at about the same pace as prerecession But climbing out of a big hole
16 Job Openings and Unemployed 3.1 unemployed per job opening at present Down from 6.5 during the recession But much higher than 1.8 before the recession Not enough jobs to go around
17 What does the U.S. economy need? Demand #1 constraint on business hiring: lack of demand for goods and services Stable fiscal policy Sequester cuts are undermining the recovery Tax hike earlier this year also not helpful More certainty about health care costs Lots of speculation about hiring plans
18 Tennessee at a Glance (June 2012) Indicator Year Ago This Month Year to Year % Change Nonfarm Employment (thousand) 2,707,900 2,749, Labor Force (thousand) 3,151,840 3,143, Unemployed (thousand) 271, , Unemployment Rate (percent) State Sales Tax Collections (million $) 589, , Single Family Unit Housing Permits 1,191 1, Total Housing Permits 1,722 2,
19 Growth of real earned income Purchasing power of income growth Accelerating since early 2012
20 Tennessee unemployment rate Rise this year difficult to explain
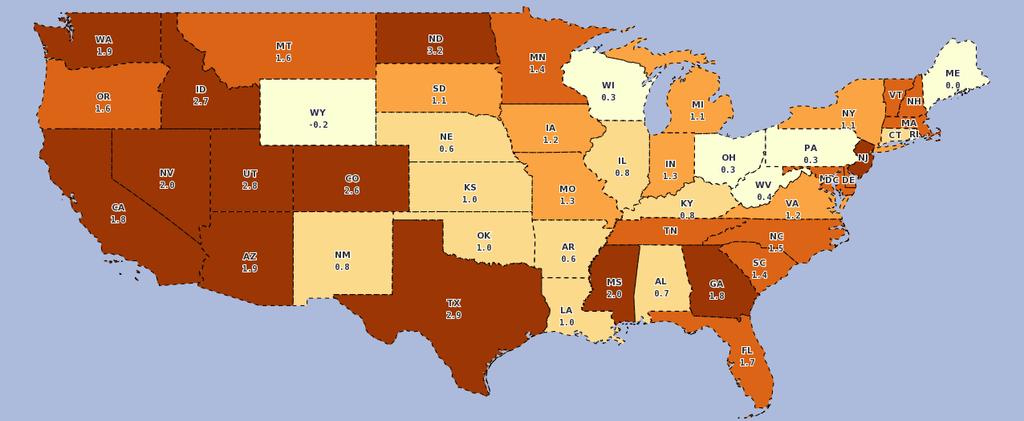
21 Unemployment rate June 2013
22 Payroll employment growth (YTY 2 nd QTR)


23 Manufacturing job growth 2 nd QTR Tennessee added 5,900 manufacturing jobs over the year

24 Middle Tennessee unemployment rates May 2013

25 Private sector employment growth rate Dec 2011-Dec 2012
26 Middle Tennessee Job Growth Private Sector Job Growth Dec. Area New Jobs Growth Rate (%) Davidson County 15, Rutherford County 7, Williamson County 5, Sumner County 3, Robertson County 1, Coffee County 1, Maury County 1, Wilson County Montgomery County Bedford County Warren County Middle Tennessee 41, Tennessee 59, Source: Bureau of Labor Statistics QCEW series.
27 Fastest job growth in the U.S. Among the 329 largest counties in the U.S. Davidson, Williamson rank high for wage growth County Percent increase in employment Dec Rank Elkhart, IN Lexington, SC Rutherford, TN Utah, UT Montgomery, TX Williamson, TN Davidson, TN Source: BLS QCEW series
28 Nashville MSA Job creation booming Unemployment rate slow to improve Housing construction improving significantly Home price growth positive Consumer spending growth positive but slowing Most sectors adding jobs
29 Nashville MSA at a Glance (May 2012) Indicator Year Ago This Month Year to Year % Change Nonfarm Employment (thousand) 783, , Labor Force (thousand) 847, , Unemployed (thousand) 57,198 59, Unemployment Rate (percent) State Sales Tax Collections (million $) 149, , Single Family Unit Housing Permits Total Housing Permits
30 Nonfarm employment Nashville MSA Growth rate very strong Leveling out lately
31 Ranking of Job Growth in Largest MSAs Metropolitan Area Job Growth Rate Ranking New Jobs Austin-Round Rock-San Marcos, TX 4.15% 1 27,117 Salt Lake City, UT 4.14% 2 22,200 Nashville-Davidson--Murfreesboro--Franklin, TN 4.06% 3 27,633 Dallas-Fort Worth-Arlington, TX 3.55% 4 93,150 Tampa-St. Petersburg-Clearwater, FL 3.52% 5 35,317 Houston-Sugar Land-Baytown, TX 3.45% 6 80,067 Jacksonville, FL 3.20% 7 16,633 Phoenix-Mesa-Glendale, AZ 2.88% 8 43,800 San Jose-Sunnyvale-Santa Clara, CA 2.85% 9 23,050 Louisville-Jefferson County, KY-IN 2.54% 10 13,417 2 nd quarter over the year growth rate among the 55 largest employing metropolitan areas.
32 Initial Employment Data Modest growth Dec 2012: 12,700 new jobs over the year 1.7% growth
33 Employment after revision Rapid growth! Dec 2012: 30,800 new jobs 3.9% growth
34 Nashville Job Growth by Industry Positives More growing sectors than declining sectors Manufacturing adding jobs very quickly Big gains in professional services Retail jobs growing Government improving to neutral
35 Nashville Job Growth by Industry Negatives Information losing jobs Financial sector employment losing again
36 Nashville MSA Job Growth by Industry Industry May Sep Jan May Job Growth (1,000) Total Nonfarm Mining, Logging, and Construction Manufacturing Durable Goods Non-Durable Goods Wholesale Trade Retail Trade Transportation and Utilities Information (0.6) Financial Activities (0.4) Professional and Business Services Education and Health Services Leisure and Hospitality Other Services (0.4) Government Over the year percent change
37 Nashville unemployment rate Steadily lower over time Higher since January
38 Consumer spending mostly strong Sales tax collections for May 2013 (yty) Nashville: +4.7% Memphis: +5.0 Chattanooga: Knoxville: +3.4 Tennessee: +3.9


39 Single family home construction Nashville MSA Accelerating growth rate Level remains low, but growing fast
40 Tennessee home prices 2013Q1 Tennessee: 0.9% higher over the year Nashville MSA: 2.6% higher United States: 2.0% higher
41 Going Forward 12 Months Nashville economy Job growth 3.5% over the year Unemployment rate 6.1% (6.8% now). Home prices rising, could accelerate Construction growth continues Manufacturing continues to grow
42 Summary Middle Tennessee and the Nashville MSA are experiencing solid growth Payroll employment Housing construction Taxable sales
43 Headwinds Export markets (especially China) Payroll growth Willingness to take on more debt Congress
44 Business and Economic Research Center TACIR economic recovery website

45 TACIR economic recovery website
Economic and Fiscal Update
 Economic and Fiscal Update OCTOBER 2012 Donald J. Bruce, Professor Center for Business and Economic Research The University of Tennessee, Knoxville 88Q2 89Q2 90Q2 91Q2 92Q2 93Q2 94Q2 95Q2 96Q2 97Q2 98Q2
Outlook for the Texas Economy. Luis Bernardo Torres Ruiz, Ph.D. August 26, 2016
 Outlook for the Texas Economy Luis Bernardo Torres Ruiz, Ph.D. August 26, 2016 Research Economist Texas Society of Architects Contents 1. U.S. Economic Outlook 2. Texas Economic Outlook 3. Challenges and
 4th Quarter 211 TENNESSEE HOUSING MARKET David A. Penn, Director Business and Economic Research Center Jennings A. Jones College of Business Middle Tennessee State University This quarterly series is supported
Housingmarket. Tennessee. 2nd Quarter Business and Economic Research Center David Penn, Ph.D., Associate Professor, Economics
 Tennessee Housingmarket 2nd Quarter 214 Business and Economic Research Center David Penn, Ph.D., Associate Professor, Economics Supported by Tennessee Housing Development Agency Economic Overview ennessee
Outlook for the Texas Economy. Luis Bernardo Torres Ruiz, Ph.D. June 29, 2016
 Outlook for the Texas Economy Luis Bernardo Torres Ruiz, Ph.D. June 29, 2016 Research Economist Texas Gas Association Contents 1. Economic Outlook 2. Housing Market 3. Challenges and Issues During the
Macroeconomic View of the Housing Market. Frank Nothaft CoreLogic Chief Economist December 12 th 2018
 Macroeconomic View of the Housing Market Frank Nothaft CoreLogic Chief Economist December 12 th 2018 2019 Economic and Housing Outlook Economic growth continues, recession risk rises, interest rates increase
Texas Economic Outlook: Strong Growth Continues
 Texas Economic Outlook: Strong Growth Continues Keith Phillips Assistant Vice President and Senior Economist 1/23/18 The views expressed in this presentation are strictly those of the presenter and do
U.S. Economic Update and Outlook. Laurel Graefe, REIN Director Federal Reserve Bank of Atlanta October 2, 2013
 1 U.S. Economic Update and Outlook Laurel Graefe, REIN Director Federal Reserve Bank of Atlanta October 2, 213 Following the deepest recession since the 193s, the economic recovery is well under way, though
TENNESSEE HOUSING MARKET
 2nd Quarter 21 TENNESSEE HOUSING MARKET David A. Penn, Director Business and Economic Research Center Jennings A. Jones College of Business Middle Tennessee State University This quarterly series is supported
Texas Mid-Year Economic Outlook: The Skies are Beginning to Clear Keith Phillips Assistant Vice President and Senior Economist
 Texas Mid-Year Economic Outlook: The Skies are Beginning to Clear Keith Phillips Assistant Vice President and Senior Economist The views expressed in this presentation are strictly those of the presenter
Trends in Total and Out-of- Pocket Spending in Metro Areas:
 Trends in Total and Out-of- Pocket Spending in Metro Areas: 2012-2015 It is well-documented that health care prices vary widely by geography. 1 These variations can also lead to differences in health care
TENNESSEE HOUSING MARKET
 3rd Quarter 21 TENNESSEE HOUSING MARKET David A. Penn, Director Business and Economic Research Center Jennings A. Jones College of Business Middle Tennessee State University This quarterly series is supported
Texas Economic Outlook: Tapping on the Brakes
 National Economy Picking Up After Q1 Pause Texas Economic Outlook: Tapping on the Brakes Keith Phillips Assistant Vice President and Senior Economist Consumer spending picked up in 1 as housing prices
Texas Mid-Year Economic Outlook: Strong Growth Continues
 Texas Mid-Year Economic Outlook: Strong Growth Continues Keith Phillips Assistant Vice President and Senior Economist 9/27/18 The views expressed in this presentation are strictly those of the presenter
Texas Economic Outlook: Cruising in Third Gear
 Texas Economic Outlook: Cruising in Third Gear Keith Phillips Assistant Vice President and Senior Economist 1/19/17 The views expressed in this presentation are strictly those of the presenter and do not
A summary of economic events, data, and trends published by the Community Research Institute. Allen County Labor Force
 Allen County Insight January 213 A summary of economic events, data, and trends published by the On the web: www.ipfw.edu/cri In this Issue Focus on... Labor Force Labor Participation Rate Occupations
Economic Update. Don Bruce Research Professor Boyd Center for Business and Economic Research. January 2019
 Economic Update Don Bruce Research Professor Boyd Center for Business and Economic Research January 2019 January 2019 http://cber.haslam.utk.edu/erg/erg2019.pdf http://cber.haslam.utk.edu/ 2 National Economy
Cost of Living Comparisons: Valdosta, Georgia, and the Nation 2011 Annual Review February 15, 2012
 Overview The fourth quarter of 2011 survey comparing relative costs of living for middle management households among U.S. metropolitan areas and cities shows that it costs 6.1 percent less to live in Georgia
Employment in Central Oregon: January, 2015
 FOR IMMEDIATE RELEASE: March 10, 2015 CONTACT INFORMATION: Damon Runberg, Regional Economist Damon.M.Runberg@oregon.gov (541) 388-6442 Employment in Central Oregon: January, 2015 Central Oregon finished
Projected Job Growth
 1 Projected Job Growth Baton Rouge is projected to increase employment by 1.1% in 2018, which translates into approximately 4,500 new jobs Percentage change in nonfarm jobs* Actual Growth YTD Actual Growth
The Arkansas Economic Outlook Focus on Hot Springs
 The Arkansas Economic Outlook Focus on Hot Springs Dr. Michael Pakko Chief Economist and State Economic Forecaster Institute for Economic Advancement, UALR Regional Economic Forecast Hot Springs December
REGIONAL SUMMARIES. Nonfarm employment grew in the second quarter. Non-farm jobs totaled 56,900 in June, up from 55,500 in June 2016.
 Second Quarter 2017 Quarterly narrative An independent economic analysis of four Arkansas metro areas: Central Arkansas Northwest Arkansas The Fort Smith region Jonesboro metro REGIONAL SUMMARIES Fort
Massachusetts Outlook,
 Massachusetts Outlook, 2016-2020 Highlights The state s economic growth will be pulled by two forces in opposite directions. Constraining growth will be a slower increase in the availability of workers
HOUSTON-THE WOODLANDS-SUGAR LAND METROPOLITAN STATISTICAL AREA (H-W-S MSA) Visit our website at
 Visit our website at") Labor Market Information DECEMBER 2015 Employment Data HOUSTON-THE WOODLANDS-SUGAR LAND METROPOLITAN STATISTICAL AREA () Visit our website at www.wrksolutions.com The Houston-The Woodlands-Sugar Land Metropolitan
Labor Market Information DECEMBER 2015 Employment Data HOUSTON-THE WOODLANDS-SUGAR LAND METROPOLITAN STATISTICAL AREA () Visit our website at www.wrksolutions.com The Houston-The Woodlands-Sugar Land Metropolitan
2018 Texas Economic Outlook: Firing on All Cylinders
 218 Texas Economic Outlook: Firing on All Cylinders Keith Phillips Assistant Vice President and Senior Economist 4/5/218 The views expressed in this presentation are strictly those of the presenter and
Arkansas Economic Outlook
 Arkansas Economic Forecast Conference 2011 Arkansas Economic Outlook Dr. Michael Pakko Chief Economist and State Economic Forecaster Institute for Economic Advancement, UALR November 2, 2011 Arkansas Experience
Central Oregon Employment Situation for December 2014
 January 26, 2015 Contact: Damon M. Runberg Regional Economist (541) 388-6442 Central Oregon Employment Situation for December 2014 Central Oregon closed out 2014 with mixed results. This past year Deschutes
Analysis Based on U.S. County Business Patterns. June Part of the Kiva Visa Partnership for U.S. Small Businesses
 KIVA AND VISa study of small business trouble spots Analysis Based on County Patterns June 2011 Part of the Kiva Visa Partnership for Small es research objectives research objectives In late 2010, Visa
THE STATE OF THE ECONOMY
 THE STATE OF THE ECONOMY ANGELA GUO Portland State University The United States economy in the fourth quarter of 2013 appears to have a more robust foothold pointing to a healthier outlook for 2014. Much
The Arkansas Economic Outlook
 The Arkansas Economic Outlook Dr. Michael Pakko Chief Economist and State Economic Forecaster Arkansas Economic Development Institute, UALR December 1, 2017 Overview Review of Economic Conditions: Output
CYCLE FORECAST Real Estate Market Cycles Third Quarter 2017 Estimates November 2016
 CYCLE FORECAST Real Estate Market Cycles Third Quarter 0 Estimates November 0 It is expected that 0 should have a growth trajectory higher than the past six years. Economists revised their forecasts to
2016 Texas Economic Outlook: Riding the Energy Roller Coaster Keith Phillips Assistant Vice President and Senior Economist
 216 Texas Economic Outlook: Riding the Energy Roller Coaster Keith Phillips Assistant Vice President and Senior Economist The views expressed in this presentation are strictly those of the presenter and
$15.74 PER HOUR STATE HOUSING
 TENNESSEE STATE #37 * RANKING In Tennessee, the Fair Market Rent () for a two-bedroom apartment is $819. In order this level of and utilities without paying more than 30% of income on housing a household
MORE BALANCED ECONOMIC GROWTH By the Bureau of Business Research and the Nebraska Business Forecast Council
 VOLUME 71, NO. 719 PRESENTED BY THE UNL BUREAU OF BUSINESS RESEARCH (BBR) JUNE 2017 MORE BALANCED ECONOMIC GROWTH By the Bureau of Business Research and the Nebraska Business Forecast Council U.S. Macroeconomic
Implications of the Financial Crisis for Housing and Community Development
 Implications of the Financial Crisis for Housing and Community Development The Center for Community Studies Vanderbilt University May 14, 2009 Dan Immergluck Associate Professor City & Regional Planning
Florida: An Economic Overview
 Florida: An Economic Overview January 26, 2016 Presented by: The Florida Legislature Office of Economic and Demographic Research 850.487.1402 http://edr.state.fl.us Key Economic Variables Improving Economy
Analysis & Background
 1 Values shown are June estimates. # # # Analysis & Background Expected Revisions to Colorado Second quarter 2017 Quarterly Census of Employment and Wages (QCEW) results indicate Colorado total nonfarm
Utah Land Title Association Economic Overview February 1, 2016
 Utah Land Title Association Economic Overview February 1, 2016 Utah is One of the Fastest Growing CA 0.9% States in the Country Percent Change in Population for States: 2012 to 2013 WA 1.1% OR 0.8% NV
An abnormally-slow December caps off the year with a range of bright spots as well as challenges. U.S. employment situation: September 2013
 An abnormally-slow December caps off the year with a range of bright spots as well as challenges U.S. employment situation: September 2013 U.S. Release employment date: October situation: 22, December
Zions Bank Economic Overview
 Zions Bank Economic Overview Utah League of Cities and Towns June 18, 2018 Utah Economic Conditions CA 0.6% OR 1.4% WA 1.7% NV 2.0% Utah Population 3 rd Fastest Growing in U.S. ID 2.2% UT 1.9% AZ 1.6%
Uinta Basin Energy Summit Economic Overview September 10, 2015
 Uinta Basin Energy Summit Economic Overview September 10, 2015 Overview National Economic Conditions Utah Economic Conditions Utah is One of the Fastest Growing CA States in the Country Percent Change
Continued Rapid Growth for Tennessee s Premier Financial Services Franchise. Terry Turner, President and CEO Harold Carpenter, CFO March 2009
 Continued Rapid Growth for Tennessee s Premier Financial Services Franchise Terry Turner, President and CEO Harold Carpenter, CFO March 2009 Safe Harbor Statements Forward-looking statements Pinnacle Financial
MetroMonitor Tracking Economic Recession and Recovery in America s 100 Largest Metropolitan Areas
 MetroMonitor Tracking Economic Recession and Recovery in America s 100 Largest Metropolitan Areas Howard Wial and Richard Shearer June 2011 (Updated on June 24, 2011) With job growth slowing and housing
COMMODITY PRICES LIMIT NEBRASKA GROWTH By the Bureau of Business Research and the Nebraska Business Forecast Council
 VOLUME 71, NO. 717 PRESENTED BY THE UNL BUREAU OF BUSINESS RESEARCH (BBR) DECEMBER 2016 COMMODITY PRICES LIMIT NEBRASKA GROWTH By the Bureau of Business Research and the Nebraska Business Forecast Council
Vista. San Antonio has. South Texas Economic Trends and Issues. Steady-as-She-Goes? An Analysis of the San Antonio Business Cycle
 Federal Reserve Bank of Dallas San Antonio Branch Winter 2004 Vista South Texas Economic Trends and Issues Steady-as-She-Goes? An Analysis of the San Antonio Business Cycle San Antonio has historically
Current Economic Conditions in the Eighth Federal Reserve District. Louisville Zone
 Current Economic Conditions in the Eighth Federal Reserve District Louisville Zone September 21, 2012 Prepared by the Research Division of the Federal Reserve Bank of St. Louis Eighth Federal Reserve District
Zions Bank Economic Overview
 Zions Bank Economic Overview Utah Institute of Real Estate Management Economic Summit September 12, 2017 National Economic Conditions August Job Indicators Indicator Expectation Actual Total Nonfarm Payrolls
AN ECONOMIC REPORT TO THE GOVERNOR OF THE STATE OF TENNESSEE
 AN ECONOMIC REPORT TO THE GOVERNOR OF THE STATE OF TENNESSEE Matthew N. Murray, Associate Director and Project Director Center for Business and Economic Research PREPARED BY THE Center for Business and
Current Economic Conditions in the Eighth Federal Reserve District. Louisville Zone
 Current Economic Conditions in the Eighth Federal Reserve District Louisville Zone March 23, 2012 Prepared by the Research Division of the Federal Reserve Bank of St. Louis Eighth Federal Reserve District
Economic Outlook /10/2010
 Economic Outlook 211 212 12/1/21 The University of Arizona s Thirtieth Annual Forecast Luncheon Dean Professor of Economics and Halle Chair in Leadership Director Economic and Business Research Center
The Urgent Need for Job Creation
 The Urgent Need for Job Creation John Schmitt and Tessa Conroy July 21 Center for Economic and Policy Research 1611 Connecticut Avenue, NW, Suite 4 Washington, D.C. 29 22-29338 www.cepr.net CEPR The Urgent
PRODUCER SERVICES: A HUB FOR STEM AND AN ENGINE FOR JOB GROWTH By Brock Thompson, Eric Thompson
 VOLUME 70 NO. 714 PRESENTED BY THE UNL BUREAU OF BUSINESS RESEARCH (BBR) NOVEMBER 2015 PRODUCER SERVICES: A HUB FOR STEM AND AN ENGINE FOR JOB GROWTH By Brock Thompson, Eric Thompson Introduction roducer
Traditional Regional Economic Indicators
 Cleveland State University EngagedScholarship@CSU Urban Publications Maxine Goodman Levin College of Urban Affairs 2-1-2005 Traditional Regional Economic Indicators Robert Sadowski How does access to this
MORGANTOWN METROPOLITAN STATISTICAL AREA OUTLOOK COLLEGE OF BUSINESS AND ECONOMICS. Bureau of Business and Economic Research
 2013 MORGANTOWN METROPOLITAN STATISTICAL AREA OUTLOOK COLLEGE OF BUSINESS AND ECONOMICS Bureau of Business and Economic Research 1 MORGANTOWN METROPOLITAN STATISTICAL AREA OUtlook 2013 EXECUTIVE SUMMARY
January 2015 Lutgert College Of Business FGCU Blvd. South Fort Myers, FL Phone
 Southwest Florida Regional Economic Indicators January 215 Lutgert College Of Business 151 FGCU Blvd. South Fort Myers, FL 33965 Phone 239-59-7319 www.fgcu.edu/cob/reri Table of Contents Introduction:
Zions Bank Salt Lake Northeast Region Officers Mee8ng Economic Overview. July 28, 2016
 Zions Bank Salt Lake Northeast Region Officers Mee8ng Economic Overview July 28, 2016 National Economic Conditions Readings on the U.S. economy since the turn of the year have been somewhat mixed. - Janet
Outlook for the Texas Economy
 Outlook for the Economy LUIS TORRES RESEARCH ECONOMIST WESLEY MILLER RESEARCH ASSISTANT TECHNICAL REPORT 2 MAY 217 TR Contents About this Report... 3 March 217 Summary... Economic Activity... 7 Business
Zions Bank Economic Overview
 Zions Bank Economic Overview Jackson Hole Mountain Resort March 20, 2018 National Economic Conditions When Good News is Bad News Is Good News?? Dow Tops 26,000 Up 44% Since 2016 Election Source: Wall Street
The Washington Area Economy: Repositioning for Renewed Growth
 Finance and Administration Roundtable The Washington Area Economy: Repositioning for Renewed Growth Stephen S. Fuller, Ph.D. Dwight Schar Faculty Chair and University Professor Director, Center for Regional
Understanding the New Trump Economy Economic Overview. November 15, 2016
 Understanding the New Trump Economy Economic Overview November 15, 2016 Uncertainty at the Na@onal and Interna@onal Level Source: Bureau of Labor Statistics The Trump Bump Why? National Job Growth 500
Employment in Central Oregon: June 2015
 FOR IMMEDIATE RELEASE: July 21, 2015 CONTACT INFORMATION: Damon Runberg, Regional Economist Damon.M.Runberg@oregon.gov (541) 706-0779 Employment in Central Oregon: June 2015 There were no significant changes
Current Economic Conditions in the Eighth Federal Reserve District. Memphis Zone
 Current Economic Conditions in the Eighth Federal Reserve District Memphis Zone September 21, 2012 Prepared by the Research Division of the Federal Reserve Bank of St. Louis Eighth Federal Reserve District
A Divided Real Estate Nation
 Real Estate Reality Check Explanation of "What Happened" from the 26 Leadership Conference Boom ended August 2 Mortgage rates rose almost one point Affordability conditions deteriorated Speculative investors
Current Economic Conditions in the Eighth Federal Reserve District. Memphis Zone
 Current Economic Conditions in the Eighth Federal Reserve District Memphis Zone December 21, 2012 Prepared by the Research Division of the Federal Reserve Bank of St. Louis Eighth Federal Reserve District
FORM G-37. Name of Regulated Entity: Citigroup Global Markets Inc. Report Period: Second Quarter of 2018
 Name of Regulated Entity: Citigroup Global Markets Inc. Report Period: Second Quarter of 2018 I. CONTRIBUTIONS made to officials of a municipal entity (list by state) Complete name, title (including any
Indicators of a recovering economy Building permits through the roof
 Indicators of a recovering economy The resale and new home market continues to improve nationwide. The National Association of Realtors reported that previously-owned homes sold at an annual pace of 4.92
Single-family home sales and construction are not expected to regain 2005 peaks
 Single-family home sales and construction are not expected to regain 25 peaks Millions of units 8. 7. 6. 5. Housing starts (right axis) 4. Home sales (left axis) 3. 2. 1. 198 1985 199 1995 2 25 21 215
The Arkansas Economic Outlook
 The Arkansas Economic Outlook Dr. Michael Pakko Chief Economist and State Economic Forecaster Institute for Economic Advancement, UALR November 5, 2015 Disclaimer: The views expressed are my own, and do
Finance and Administration Roundtable. The Washington Area Economy: Repositioning for Renewed Growth
 5/2/25 Finance and Administration Roundtable The Washington Area Economy: Repositioning for Renewed Growth Stephen S. Fuller, Ph.D. Dwight Schar Faculty Chair and University Professor George Mason University
The Dog Ate My Home. By: Anirban Basu Sage Policy Group, Inc. January 11, 2012
 The Dog Ate My Home By: Anirban Basu Sage Policy Group, Inc. January 11, 2012 Penny wise, Euro foolish Top 12 Stock Exchanges 2008 Growth Rank Exchange Index 2008 % Change 3 London SE FTSE 100-31.3% 1
Washington Building Congress. The U.S. and Washington Area Economic Performance and Outlook
 Washington Building Congress The U.S. and Washington Area Economic Performance and Outlook Stephen S. Fuller, Ph.D. Dwight Schar Faculty Chair and University Professor Director, Center for Regional Analysis
Employee Benefits Alert
 Employee Benefits Alert September 2005 Issue No. 48 Health Saving Accounts: Comparability Rules The IRS and Treasury recently published proposed regulations concerning the comparability rules for employer
Plunging Crude Prices: Impact on U.S. and State Economies
 Plunging Crude Prices: Impact on U.S. and State Economies Mine Yücel Senior Vice President and Director of Research August 7, 215 Oil and gas prices plunge Nominal price, $, weekly 16 14 12 Oil Price 1
Emerging Trends in the U.S. and Colorado Economies
 Emerging Trends in the U.S. and Colorado Economies Sam Chapman Associate Economist Federal Reserve Bank of Kansas City Denver Branch The views expressed are those of the presenter and do not necessarily
Office. Office. IRR Viewpoint 2015
 IRR Viewpoint 05 Above: Designed in 95 in the Art Deco style by architect Timothy Pflueger as the Pacific Telephone and Telegraph Building, 40 New Montgomery Street, San Francisco, CA has been the subject
ECONOMIC AND FINANCIAL HIGHLIGHTS
 ECONOMIC AND FINANCIAL HIGHLIGHTS LABOR MARKET Contributions to Change in Nonfarm Payrolls 2 Unemployment and Labor Force Participation Rate 3 MANUFACTURING ISM Manufacturing Index 4 CONSUMERS Light Vehicle
NAHEFFA March 26, The views expressed are my own and do not necessarily reflect official positions of the Federal Reserve System.
 NAHEFFA March 26, 219 The views expressed are my own and do not necessarily reflect official positions of the Federal Reserve System. National Economy Growing Strongly Jobs grew 1.8% in 218 the fastest
A Perspective from the Federal Reserve Institute of Internal Auditors San Antonio Chapter August 19, 2015 Blake Hastings Senior Vice President
 A Perspective from the Federal Reserve Institute of Internal Auditors San Antonio Chapter August 19, 215 Blake Hastings Senior Vice President The views expressed in this presentation are strictly those
The Fiscal Year of Memphis Light, Gas and Water has not changed. The fiscal year end remains December 31.
 Electric System Subordinate Revenue Refunding Bonds Series 2008 - Section 4(a)(iii) Electric System Subordinate Revenue Refunding Bonds Series 2010 - Section 4(a)(iii) Electric System Revenue Bonds Series
SOUTHERN NEVADA 2015 ECONOMIC OUTLOOK
 SOUTHERN NEVADA 2015 ECONOMIC OUTLOOK NAIOP Washington D.C. Legislative Retreat February 9-11, 2015 Prepared by: ECONOMIC OVERVIEW 2 Nevada job recovery from Great Recession after 90 months. Nevada Recession
Outlook for the Texas Economy
 Outlook for the Economy LUIS TORRES RESEARCH ECONOMIST WESLEY MILLER RESEARCH ASSOCIATE BAILEY CUADRA RESEARCH ASSISTANT TECHNICAL REPORT 2 4 6 DECEMBER 217 TR Contents About this Report... 3 October 217
How the Job Market Looked at the Start of the Year, Shutdown and All
 This copy is for your personal, noncommercial use only. To order presentationready copies for distribution to your colleagues, clients or customers visit http://www.djreprints.com. https://blogs.wsj.com/economics/2019/02/01/howthejobmarketlookedatthestartoftheyearshutdownandall/
Employment in Central Oregon: December 2016
 FOR IMMEDIATE RELEASE: January 24, 2017 CONTACT INFORMATION: Damon Runberg, Economist Damon.M.Runberg@oregon.gov (541) 706-0779 Employment in Central Oregon: December 2016 There was a distinct urban-rural
Southwest Florida Regional Economic Indicators. August 2013
 Southwest Florida Regional Economic Indicators August 213 Regional Economic Research Institute Lutgert College Of Business Phone 239-59-7319 Florida Gulf Coast University 151 FGCU Blvd. South Fort Myers,
2013 ECONOMY REPORT. Produced by the Research Division, January Alvaro Lima, Director of Research Mark Melnik John Avault Gregory Perkins
 2013 ECONOMY REPORT Produced by the Research Division, January 2013 Alvaro Lima, Director of Research Mark Melnik John Avault Gregory Perkins PETER MEADE, DIRECTOR AS WE ENTER 2013, Boston s population
Current Economic Conditions in the Eighth Federal Reserve District. Memphis Zone
 Current Economic Conditions in the Eighth Federal Reserve District Memphis Zone December 23, 2011 Prepared by the Research Division of the Federal Reserve Bank of St. Louis Eighth Federal Reserve District
August 2004 Index as of October
 T O T E N N E S S E E SAAR 10.0 7.5 5.0 2.5 0.0-2.5-5.0-7.5-10.0 E N N E S S E E FIGURE 1 Monthly Percentage Change in the Tennessee Leading Index (seasonally adjusted at annual rates) 6.4 Mar-04 0.4 Apr-04
Key Labor Market and Economic Metrics
 Key Labor Market and Economic Metrics May Update Incorporates Data Available on May 27 th, 2016 This reference is the result of a collaboration between the Bureau of Labor Market Information and Strategic
Transmission of material in this release is embargoed until 8:30 a.m. (EDT) Wednesday, October 31, 2012
 Wednesday, October 31, 2012") Transmission of material in this release is embargoed until 8:30 a.m. (EDT) Wednesday, October 31, USDL-12-2162 Technical information: Media contact: (202) 691-6199 NCSinfo@bls.gov www.bls.gov/ect (202)
Transmission of material in this release is embargoed until 8:30 a.m. (EDT) Wednesday, October 31, USDL-12-2162 Technical information: Media contact: (202) 691-6199 NCSinfo@bls.gov www.bls.gov/ect (202)
Reliably faster growth, consistently better profitability
 Reliably faster growth, consistently better profitability 1 Safe Harbor Statements Forward looking statements Certain of the statements in this presentation may constitute forward-looking statements within
ECONOMIC SUMMARY: NATIONAL, STATE AND LOCAL TRENDS
 ECONOMIC SUMMARY: NATIONAL, STATE AND LOCAL TRENDS This report is an overview of economic conditions for the United States, the State of Florida, the Tampa Metropolitan Statistical Area and Hillsborough
HIGH AND WIDE: INCOME INEQUALITY GAP IN THE DISTRICT ONE OF BIGGEST IN THE U.S. By Wes Rivers
 An Affiliate of the Center on Budget and Policy Priorities 820 First Street NE, Suite 510 Washington, DC 20002 (202) 408-1080 Fax (202) 325-8839 www.dcfpi.org March 13, 2014 HIGH AND WIDE: INCOME INEQUALITY
Zions Bank Economic Summit Economic Overview. November 3, 2016
 Zions Bank Economic Summit Economic Overview November 3, 2016 Uncertainty at the Na@onal and Interna@onal Level Readings on the U.S. economy since the turn of the year have been somewhat mixed. - Janet
Remarks on the 2018 U.S. Macroeconomic Outlook
 Remarks on the 2018 U.S. Macroeconomic Outlook James Bullard President and CEO 29th Annual Economic Outlook Conference Gatton College of Business and Economics University of Kentucky Feb. 6, 2018 Lexington,
The Dog Ate My Home. By: Anirban Basu Sage Policy Group, Inc. On Behalf of MCAA. May 3, 2012
 The Dog Ate My Home On Behalf of MCAA By: Anirban Basu Sage Policy Group, Inc. May 3, 2012 Penny wise, Euro foolish Annual % Change Historic and Projected World Output Growth 2004 through 2013* 6.0% 5.0%
After falling last month, the Tennessee
 T O T E N N E S S E E SAAR 10.0 7.5 5.0 2.5 0.0-2.5-5.0-7.5-10.0 E N N E S S E E E C O N O M I C V E R V I E W September 2004 Index as of November 2004 FIGURE 1 Monthly Percentage Change in the Tennessee
Economic Outlook. Charlie Dougherty, Vice President & Economist January 10, 2019
 Economic Outlook Charlie Dougherty, Vice President & Economist January 10, 2019 Economic Growth Will Remain Solid in 2019 1 8% U.S. Real GDP Bars = CAGR Line = Yr/Yr Percent Change GDP - CAGR: Q3 @ 3.5%
Leeds Business Confidence Index
 Third Quarter 2018 Volume 11, number 3 colorado.edu/business/brd Leeds Business Confidence Steady Ahead of Q3 2018 The Leeds Business Confidence Index (LBCI) captures Colorado business leaders expectations
AUSTIN: MOVING FORWARD
 AUSTIN: MOVING FORWARD Angelos Angelou 32 nd Annual Austin Forecast January 26 th, 2017 1 TODAY S AGENDA o2016: The Year in Review oaustin s Economic Drivers ochallenges to Overcome o2017-18 Forecast 2
The New Mexico Economy: Recent Developments and Outlook. 18 th Annual Data Users Conference Jeffrey Mitchell, BBER Director
 The New Mexico Economy: Recent Developments and Outlook 18 th Annual Data Users Conference Jeffrey Mitchell, BBER Director Rapid Post-election Analysis o Short and medium term tradeoff between heightened