FIBONACCI FORECASTER SHORT TERM UPDATE. November 16, Greetings:
|
|
|
- Janice Snow
- 5 years ago
- Views:
Transcription
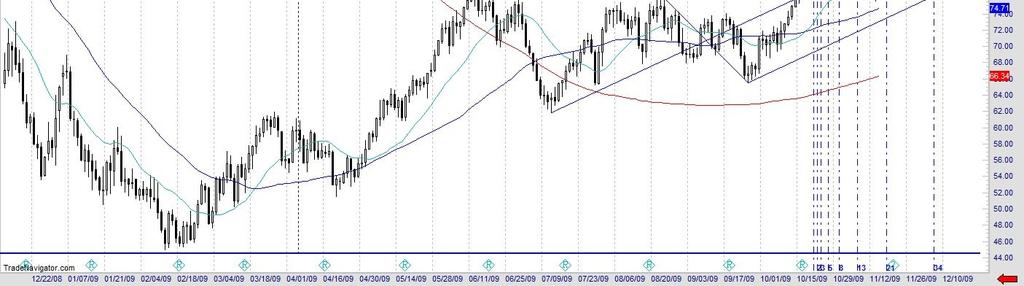
1 FIBONACCI FORECASTER SHORT TERM UPDATE November 16, 2009 Greetings: Its convention week, Thursday turned into a travel day and here we are. Come to think of it, next week is Thanksgiving so we ll be on this Monday/Wednesday schedule this week and next week. Every year I work at incorporating one important new component into my game plan. There s only a few short weeks left in this year. Early on, I incorporated candlesticks, then another year it was Merriman s timing books, then it was the Gann material. Those methods came after I mastered the Elliott game. All the while I ve kept at my universal timing compass which is the area of my expertise. I ve been a fan of Andrews work at a distance for a long time. With everything that I do I had to find the time to incorporate it. So you ll see that I m starting to sneak some median lines into these charts. While others are the definitive experts in the field I believe they can be very useful here and I m ready. I think this is the next logical progression in financial geometry as my work continues to evolve. They are interesting to follow and hopefully you ll like them. I believe they have a place here and if Babson and Andrews took a combined $60 million out of the markets, its time to add it to the arsenal. I m sure some of you are very good at this method. Keep in mind that any opening tutorials we may do next year will be a service of convenience for those of you who are new to this method. I m not nearly the last word on pitchforks. You can find a lot of good information in the search engine. What my contribution will be beyond using the lines is like I ve done with everything else, it s the synergy of my readings that should complement the lines and the lines should complement the readings. For the most part, today you ll see that it does. Whatever tutorials we do here will be geared toward the marriage of the two methodologies. STOCKS AND SECTORS FCX is not ready yet as it continues to wrestle with longer term resistance. Arch Coal is at a very interesting point in time where we have a series of readings and a retest of the high right near 61% and a decent looking median line. Since this is an inflection the only way to buy it HERE is if we get a surging wide range candle. IF not it still has a shot at failure. It weakened late in the day but is still above the gap. 1

2 AA is giving you that spike and now the question is whether the retest of 61% is the place to get short. Our theme last time for oil stocks was to be short only for scalping as I didn t suspect the down trend to last too long. Now many of these commodity names have gapped up so you need evidence of failure to short them. This is not a clear indication because we are at the target but sitting on a gap up. If you got short based on Friday s action you are still in the game. 2


3 I told you steel could be a buy in the new week. AKS looks like its going higher. It will hit resistance above 19 at 61% but the theme here was I thought the sector bottom at the end of the month. I also thought we could have a steeper retracement and sometimes what doesn t happen is as important as what does happen. The gap up needs to be defended and any entries need stops at


4 WHR is actually on the cusp of a swing play long. You can buy it in the morning if it holds this channel line. It s retesting the stop out point from last week and has a shot. It will go if the better market continues. 4
, this does look like it wants to go higher.")

5 CBK remains on a watch list as the new low has an interesting reading. Today it gapped out of the down trend and while it may test the line again (and the gap), this does look like it wants to go higher. A really good example of how median lines support the readings can be found on the MAR chart. Last week with a 44% time retracement and.0625 reading, it was at the upper end of a descending median line. It was a candidate for failure. Now it burst thru but you can see is just hanging on to the trend channel for this rise. Today s high is almost a 49 reading. So to short this you need to see violations first of the uptrend and then see it jump the line back into the down trend. On the other hand if it holds the base, it can become a longer term buy. 5

6 ROST is at a key inflection point. A larger down trend could start at around but if it jumps the line it could go on to set a new high. This one could go either way for you. JBLU is at a point where it could fail. Is it going to confirm an uptrend or not? It s really close. Same can be said for Brinker (EAT) which is testing resistance as well as trying to break the down trend line. It either fails or heads up to 16. 6

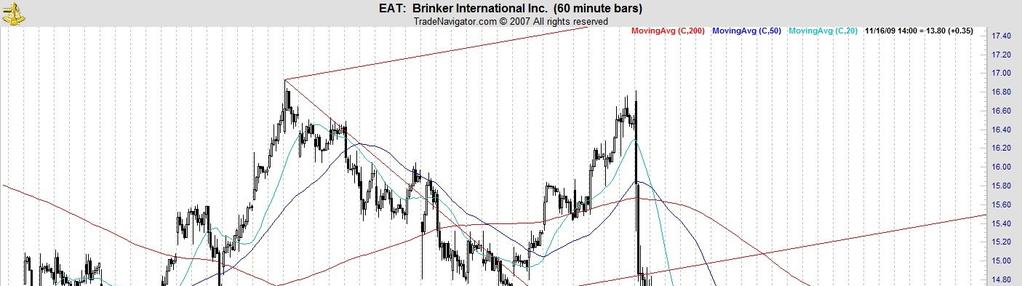
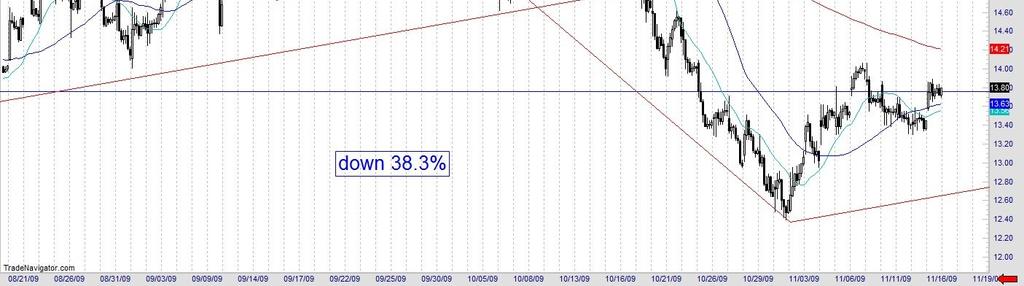
7 7


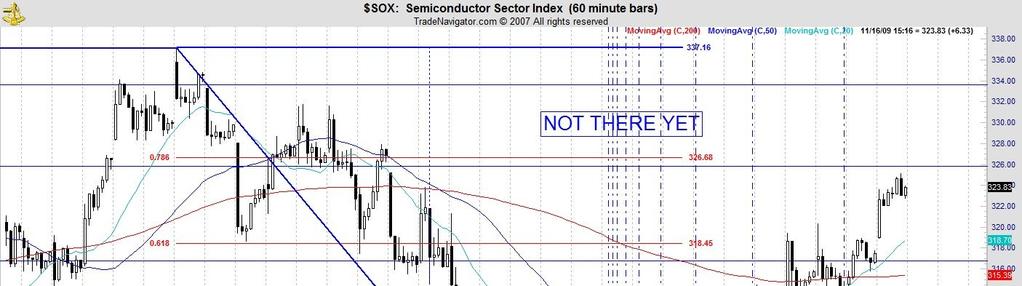
8 Vegas may be on sale, but SHFL gapped through the line which is one of the reactions you would expect and now has a shot at It has to hold the gap. Turning to tech, the SOX had a chance to top at 61% but did not and we are still looking for NTES to test 61%. I think EBAY, not showing weakness can end up at 26. It seems to be surviving and forming the base we like to see. The jury is out on biotech but that might be the sleeper play of the week if it holds a key line. You might need some patience with that. 8


9 The BKX absolutely had to hold or it was OVER. With no margin for error it responded in a bullish fashion. There was a divergence working with housing. For now, 9


10 both couldn t be right going in opposite directions, banks started up but weakened late in the day. There is still an underlying strength here and of everything I ve shown you, the one that is most intriguing is the biotechs. If that goes, everything else takes care of itself. 10

11 11

12 THE STOCK MARKET The area lagging the most had a chance to crack today but did not. While it s hit near term targets it still has the chance to go higher. We are talking about the Russell. The payoff to this condition still appears to be down the road BUT a new bull market would have small caps leading. I don t want to belabor that point, but it is true. You ll recall last time I told you that even though there was a bearish divergence in tech when we compared the NDX to the NASDAQ the readings suggested we did not see the high yet. The 6.13% reading was a smaller degree high as anticipated and how we have a NASDAQ that is setting new highs as well. Now the NASDAQ is up 8.9% but that is all we have. On the daily chart you can see the bigger picture which overall has seen a weakening of the trend but since the end of September a sudden strengthening again. As long as we stay at these levels which is 2160 and higher, we have a chance to go higher. In this case the lines do support the readings. Keep in mind the second pitchfork is of a short term nature. 12


13 On the Russell, it had a chance to start a new downtrend but didn t follow through and that is what the hourly chart is showing you. 13
.")

14 The NDX is now up 162 points but what I probably neglected to tell you last week is that gap is on the exact target I had for a potential high. The point is that was the important point on the chart. The NDX chart on the daily is also quite interesting. From March you ll see a gradual erosion of the price action (orange lines). But off the bottom prices have stayed consistent to the upper median line with a few exceptions. But the recent surge in the past week is almost like renaissance for this trend or Jason from Friday the 13 th. The near term has us heading up near Overall we are now up 78% and 3.21 points a day. Last week we were up about 3.16, much closer to Pi? If that didn t kill this trend, I don t think these readings will. While we are on the subject of Pi, the new high in the NASDAQ negates that relationship from October 21 and when you start to see those relationships go by the wayside, you know there is still some strong underlying strength. 14

15 Turning to the SPX, the situation is slightly different as we ve seen how the median lines. The mid line was supported during the summer until gradual erosion set in. The recent high was a failure at the lower line. Now the shorter term line is only at the midpoint. So if it doesn t get repelled here we could get as high as 1200ish. We are up 67% off the bottom and 2.51 points a day. 15


16 The Dow is up 61% but probably still has a little gas in the tank up to the orange line. 16
17 BOTTOM LINE: From all of these charts, we can see that tech is leading to the upside and probably should continue to do so until such time the banks get hit. You ll see below that the banks got a reprieve today and we ll see what the bulls can do with it. Coming into today we had divergences all over the place and it appears the charts got a second or third wind. If anything weakens here it will be the Dow and/or SPX. Then again, this could be a burst that only lasts the week as we are upon the one year anniversary of the NDX bottom. But a lot of action could happen in a very short time. All these people on television do is blabber on about fundamentals. This has nothing to do with fundamentals. It has everything to do with the Dollar. AUSTRALIA Figure 1 Financials Hourly We needed to watch this chart very carefully. Last time we were very close to a 1-1 relationship on the hourly at 319 points. See how that clustered with the median line? You can see we had a small degree failure at the middle line, which is a clue that it was drawn in the right place. I d look for it to head slightly lower as we are a little off another 1-1 relationship. But this is not a bullish chart simply because the action was repelled right near the area of the consolidation from late October. Think of this chart when we get to the ASX 200 down at the bottom. 17

18 Figure 2 Info Tech Hourly I ve drawn the same set of median lines here as I did for the Financials. Once again, the readings are being supported by the lines. It was my contention we had a probable 3 rd wave high with the 2.38 reading off the secondary pivot. This new sequence looks like a benign congestion area and this could be a small triangle en route to another high. Look for support to contain this move and it may consolidation until it hits the middle line. The Telecomm area did not back off but nevertheless we do have a larger degree sideways consolidation which has fulfilled our smaller degree calculations from a couple of weeks ago. We ve replaced our short term readings from Sept. 10 to Oct. 18 with a sideways move yet it still does have stiff resistance at But the fact that we now have NEW INFORMATION of the 1.46 low and 1.60 reading taken out last week means it has a shot finally at heading higher. Let s just say for now that 1160 is going to be a big inflection point. 18
19 Figure 3 Telecomm Hourly Figure 4 Consumer Discretionary Hourly Last time our Consumer Discretionary chart had a small degree reaction to the 1.89 reading but is now at the key decision point at 7.77% off the low. We ll see if it can break through but our smaller degree pullback tested a gap which held so we ve had small 19
20 polarity flip. Expect some testing at this line and a potential pullback if it hits 7.86 or 8.0%. Figure 5 Consumer Staples Daily This chart is interesting because when we draw these median lines off the triangle you ll see it stopped going down at exactly the right place. It was 6.75% down and I was looking for a stronger cluster. Nothing says these things have to confirm but it did. We are back at the key middle line once again. The readings are not quite there but could be by tomorrow so we ll see. The Materials chart below is still fairly complex. We ve got red lines, green lines and wedge lines. First of all the reading started weak but held on and now we are higher. The red is the longer term line, green off the March low. What you see is the new high candle from yesterday is smacking right into the green line. What you see in any event since late August is the price action taking place in the lower median area. What that means is a gradual erosion of the strength of the trend. An alternative view here is we just completed an expanding 4 th wave triangle but it is more likely the recent low completes a flat pattern and the wedge is still not complete. The bottom line is there is stiff overhead resistance at we get to the area. Another factor is we are up 88% at 361 calendar days. This is another of those charts hitting a one year anniversary to the low. So while this chart has healed, it still time to be cautious on it. 20
21 Figure 6 Materials Daily Figure 7 Energy Hourly Originally I was looking at a test of the horizontal line for Energy but prices started getting tired last week. As it turned out the readings from last week created a smaller degree pullback. Due to Dollar weakness oil is getting well this week so this one should 21
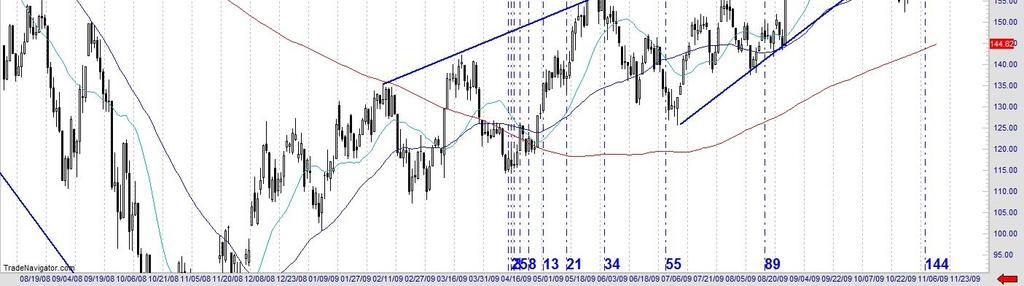
22 now have the strength to get up to the line. But I am concerned about crude oil s inability to set new highs in the face of new lows for the US Dollar. Figure 8 ASX 200 Daily Finally, we ll end where we started as the overall index is lagging likely due to a weaker Financial sector. This chart is similar to the Russell as it hit near a 61% retracement like other areas moved on to new highs. The story of the day here is the ASX 200 is not at new highs. From this chart you can see a consistently good move but not overpowering since the July low. It spent a lot of time riding the mid line. Finally we hit that 1-1 last week and find itself sitting on the lower rising median line. You can see we are all over the map from one sector to the next. Now we have to see how this test plays out. GOLD, SILVER AND THE XAU Our readings from last week were not even close to giving us a CAT 3. With the divergencnes we had there was the potential for more damage but we barely got a tropical depression. With all the readings taken out, especially on the XAU chart we do have the potential for a mini bubble forming here. Now the door is open to a move to 195. Going forward, the price target is largely going to depend on how fast we get there. We are right in the day window for the Dollar to last year s high and a week away from that 261 day window. I suppose we solved the problem as to whether the Dollar bounce from LAST WEEK is an inversion. There is really only one reason the metals are going higher and that goes without saying. 22

23 23
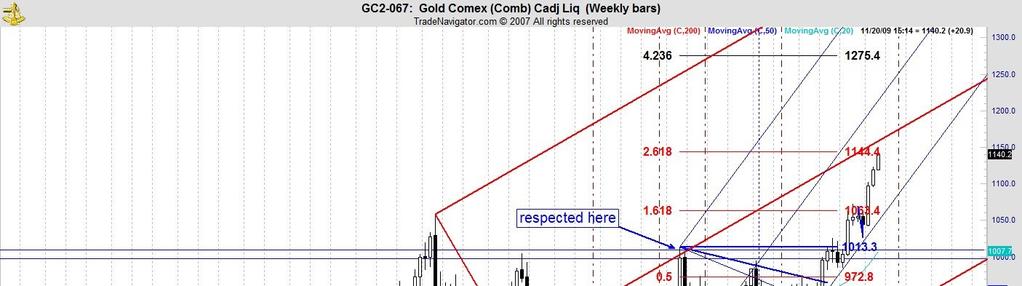
24 The Gold chart had a good bearish engulfing bar last time from the STANDARD TRIANGLE THRUST TAUGHT IN ELLIOTT WAVE SCHOOL. It had to be respected even if it did not work out. So here s what I ve done. I ve taken the daily chart and condensed it to a weekly so you can see a larger perspective. I ve drawn a long term median group from the 2007 breakout point and you can see how the Feb 09 high respected it. Will it respect it AGAIN? The one reason that it might is my next target which is the triangle extension (chapter 8 in my book). Then you have the EXTREMELY AGGRESSIVE view. That takes the bear correction low and draw the lines OFF THE TRIANGLE. You will see how THIS MOVE has respected THOSE LINES. So the question now is whether the 1144 area with its technical cluster is going to stop this move. If not, it rides that blue line up. That would be the bubble. Helicopter Ben said there is no misalignment in the US financial system. Excuse me, Mr. Ben but this would be it. I don t care, we just trade them here. But the truth of the matter is how you can you possibly have an inflation problem in the way our generation has known it with a U rate of 29% in Michigan? You look at inflation in our lifetime in the late 60 s and early 70 s and that came after what the Elliott people call a primary 3 rd wave from That was a once in a lifetime spurt for the American economy because we were the only country who did not have cities destroyed by the war. Along with the demand created by the baby boomers that will never happen again in our lifetime. What did we just have? A smoke and mirrors period of growth after an Internet bubble burst. While we are at it, the next divergence healed itself as well on the Silver chart. That one had a mild chance of topping out but with the new high we confirm the smaller degree pullback which came as a result of the 45% move from July. 24


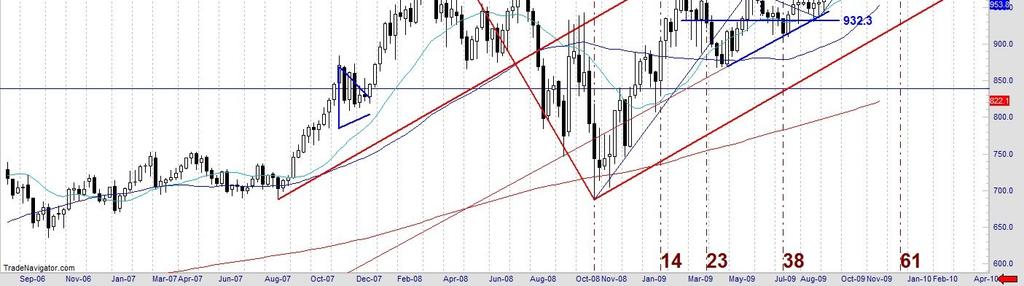
25 But with the new high we do have a 3.60 reading off the BOTTOM. One interpretation has weak price action even though it s been higher and now struggling to get back to the lower rising median line. So to compare this to the Gold chart, it has another chance to fail this week but I think this is the LAST CHANCE IT HAS TO FAIL before it could turn into a bubble. US DOLLAR For the second time in a week there was a failure at the test of the channel line. I see a tough market here on the hourly chart where there were numerous chances to reverse back up and now is riding a very narrow channel. If a picture told a thousand words you would need to see this steep channel broken and have it get back in that modest channel going to the upside. Short of that, there is really isn t anything to talk about. Keep in mind, this is just for today. We have a whole week to go before we get to the 261 day window off an important pivot and the 3 days to go to the one year anniversary. From where we were last week, a whole week s worth of price action can be a very long time. What I will say is from last week where it looked like this chart COULD CRASH we ve bought a lot of time to get us close to the next window. This bounce did materialize on day 179 off March so what it did was waste a week where it could have been accelerating down. Finally, the best that can be said is there isn t likely to be an inversion this time. 25

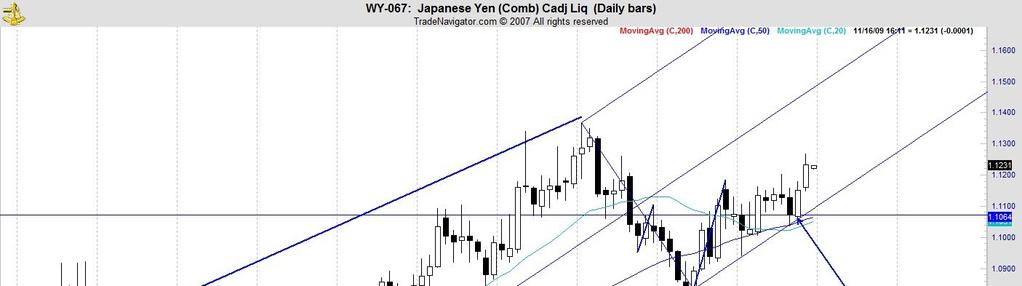
26 As far as the Yen goes, what looked like an unconfirmed top turned out to be interrupted by that reading. You can see from the daily median lines going back to July how close we came to breaking down. The other set of lines that seem to be respected by the action is of much smaller degree. That one has this chart potentially going to the mid 113 s at this stage of the game. There is a smaller degree reading at today s high and now holding the mid line. 26

27 27

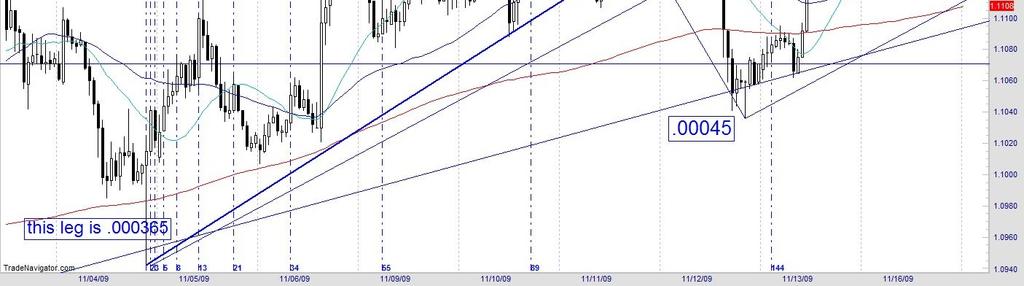
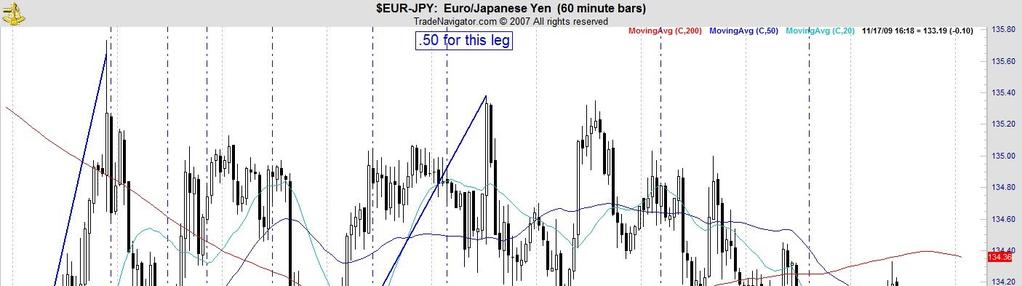
28 Against the Dollar, a great looking start totally fell apart. Now we are getting a test of the October low. The hourly lines look like this is a logical place for a bounce but even if it does, it s likely to be retested. Just like the Dollar chart, some promising setups failed. When that happens, there is a payoff to it as it s not always what happens but what doesn t. I wasn t exactly sure how the Euro situation would play out but it s been mildly bullish. If this is also the inverse Dollar play you still have a bearish intermarket divergence to the metals. The downtrend from last week has been broken but it s having trouble staying bullish. This may still end up as a larger sideways pattern. As the day wore on, price action had trouble holding on to the rising line as it hit a reading. Finally, the EUR-JPY stays at the lower end of the range and is trying to find a low right here. This still looks like a sideways pattern. 28

29 29


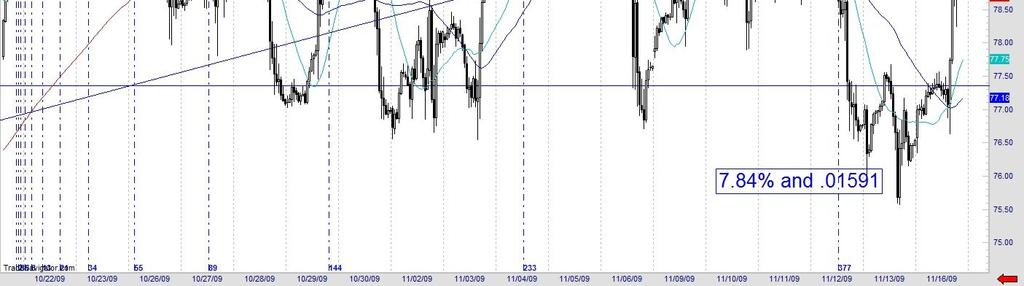
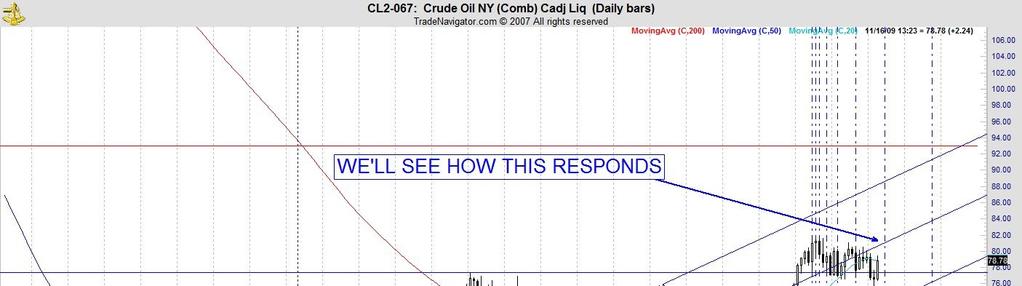
30 BONDS However, you slice it, lower rates means a lower Dollar. Today s bullish action once again breaks the down trend. Considering the early November low as the low, the price action has now violated the mid line which means it is likely to be retested but now prices look higher again. But they are parabolic and not likely to be sustained at this rate. When we combine the violation of the down trend and surge above the mid trend line what we are now looking for is a continuation of the trend on either side of that mid line. CRUDE OIL We knew we couldn t possibly get to a new high today. But this is more of the same. We have what looks like a consolidation in a potential new bull market. Next up we have to see what kind of power the move has when it hits the mid line. It certainly has a shot at going higher. That s bullish on 2 accounts. First of all, the readings for this entire congestion are now 7.84% and.0159 for each hour. But according to Andrews, when the action fails to hit the median line (leaving a space as he put it) prices will go up faster than when they went down. 30

31 31
Tommy s Revenge 2.0 Module 2 Part 2
 1 Mark Deaton here with your follow-up to Module 2. Going to cover a few things in this video and try to keep it short and sweet. We re going to look at Stock Fetcher and how we can use Stock Fetcher to
Market Observations as of Mar 2, 2018
 Market Observations as of Mar 2, 2018 By Carl Jorgensen - For Objective Traders - For educational purposes only. Not Financial Advice. The markets were mixed this week as volatility raised its head back
Test Your Chapter 1 Knowledge
 Self-Test Answers Test Your Chapter 1 Knowledge 1. Which is the preferred chart type in LOCKIT? The preferred chart type in LOCKIT is the candle chart because candle patterns are part of the decision-making
1 P a g e. Executive Summary
 Executive Summary Based on this week s deduction of observable facts, we continue to favor the major a at SPX 1867, major b at SPX 2021 and major c down to SPX 1830-1850ies around October 9-12. How exactly
10-Year Treasury Notes ($UST Price)
") 1 Weekly Inter-market Technical Report 10-Year Treasury Notes ($UST Price) Monthly Continuing from last week's report, bonds (notes) appear to be on a strong buy signal on the monthly chart, as price is
1 Weekly Inter-market Technical Report 10-Year Treasury Notes ($UST Price) Monthly Continuing from last week's report, bonds (notes) appear to be on a strong buy signal on the monthly chart, as price is
1 P a g e. Executive Summary
 Executive Summary Price finally reached our expect SPX2112-2120 and the negative divergences that started to creep in on the daily TIs finally also took their toll over the past 2 days. The weekly charts
Inter-market Technical Analysis for April 29, Summary Chart TheoTrade LLC. All rights reserved.
 1 Weekly Inter-market Technical Report Summary Chart 1 2018 TheoTrade LLC. All rights reserved. 2 Intraday Intermarket Volatility and even trend is back in our markets! The main movement recently came
Market Observations - as of Jul 27, 2018
 Market Observations - as of Jul 27, 2018 By Carl Jorgensen - For Objective Traders - For educational purposes only. Not Financial Advice. This week began with most markets continuing their bullish trends
Figure 3.6 Swing High
 Swing Highs and Lows A swing high is simply any turning point where rising price changes to falling price. I define a swing high (SH) as a price bar high, preceded by two lower highs (LH) and followed
Free signal generator for traders
 Free signal generator for traders Trader s Bulletin Pivot Point Trading Strategy 1. Just download the FREE tool 2. Key in a few numbers 3. And follow the simple techniques by Mark Rose To make money from
Market Update April 20, 2015
 SeattleTA provides investment managers with technical analysis of the equity, fixed-income, commodity, and The forecast for a high on April 15 was spot-on (there s no kill switch on awesome!). The monthly
Market Slipping Right On Schedule?
 Market Slipping Right On Schedule? Reminder- Broad markets typically a little soft in August and September. Good friend @RyanDetrick shared the chart below, which looks at the average monthly perfomance
13 April US Equity Indices: the land of the bearish rising wedge. Walter Zimmermann United ICAP. US Equity Indices 13 Apr
 - 1-13 April 2015 : the land of the bearish rising wedge Walter Zimmermann United ICAP The market commentary contained in this document represents the opinions of the author. Such opinions are subject
Market Update March 9, 2015
 SeattleTA provides investment managers with technical analysis of the equity, fixed-income, Stocks dropped and interest rates popped on Fridays payroll report as traders priced in a likely Fed rate hike
Market Observations as of Nov 17, 2017
 Market Observations as of Nov 17, 2017 By Carl Jorgensen - For Objective Traders - For educational purposes only. Not Financial Advice. This week we saw a variety of market moves. The daily charts for
2.0. Learning to Profit from Futures Trading with an Unfair Advantage! Income Generating Strategies Essential Trading Tips & Market Insights
 2.0 Learning to Profit from Futures Trading with an Unfair Advantage! Income Generating Strategies Essential Trading Tips & Market Insights Income Generating Strategies Essential Trading Tips & Market
Cycle Turn Indicator Direction and Swing Summary. of Select Markets as of the close on. February 9, Daily Swing
 Cycle Turn Indicator Direction and Swing Summary of Select Markets as of the close on February 9, 2018 Market Daily CTI Daily Swing Weekly CTI Weekly Swing Industrial Negative High Negative High Transports
Cycle Turn Indicator Direction and Swing Summary. of Select Markets as of the close on. October 5, 2017
 Cycle Turn Indicator Direction and Swing Summary of Select Markets as of the close on October 5, 2017 Market Daily CTI Daily Swing Weekly CTI Weekly Swing Industrial Positive Low Positive Low Transports
Sycamore Market Analysis
 Sycamore Market Analysis September 30, 2015 The third quarter came to an end with big gains for stocks. The rally did not quite reverse the effect of selling on Monday though with the S&P 500 still down
Last Gasp in the Dollar. Market Update May 18, Seattle Technical Advisors
 SeattleTA provides investment managers with technical analysis of the equity, fixed-income, commodity, and currency markets. While equities are expected to take a hit this week, the big news is expected
The Master Trader Counter-Trend Trade Set-Ups
 The Master Trader Counter-Trend Trade Set-Ups Trading Concepts, Inc. The Master Trader Counter-Trend Trade Set-Ups By Todd Mitchell Copyright 2014 by Trading Concepts, Inc. All Rights Reserved This training
Market Observations - as of Sep 7, 2018
 Market Observations - as of Sep 7, 2018 By Carl Jorgensen - For Objective Traders - For educational purposes only. Not Financial Advice. Last week we saw a strong and broad rally to new all time highs
Trends. Define the term Trend Explain why Trend is important Identify Primary, Secondary, and Short-Term trends
 Trends Define the term Trend Explain why Trend is important Identify Primary, Secondary, and Short-Term trends 1 What is a Trend? Uptrend Prices rise and fall in Trends Trend is defined as: Up (Rising)
What Came First... Fundamentals or the Technicals? By Jared Martinez
 What Came First... Fundamentals or the Technicals? By Jared Martinez I am honored to share my thoughts on our methodologies, focusing on the current technical movements and conditions of the FOREX Markets,
HARNESSING EXPLOSIVE MOVES USING GANN JEFF GREENBLATT MTA WEBINAR MARCH 30, 2011
 HARNESSING EXPLOSIVE MOVES USING GANN JEFF GREENBLATT MTA WEBINAR MARCH 30, 2011 TECHNICAL ANALYSIS Is Pattern recognition Traders lose money because they are emotional They get emotional because they
Trading EveryDay reserves the right to change this privacy statement at any time. Be sure to check this page periodically for updates.
 This content is provided by The Trading EveryDay Group, LLC. This site, including its contents, is provided "as educational content only" without warranty or guarantee of any kind, either expressed or
INTERMEDIATE EDUCATION GUIDE
 INTERMEDIATE EDUCATION GUIDE CONTENTS Key Chart Patterns That Every Trader Needs To Know Continution Patterns Reversal Patterns Statistical Indicators Support And Resistance Fibonacci Retracement Moving
Market Observations - as of Aug 24, 2018
 Market Observations - as of Aug 24, 2018 By Carl Jorgensen - For Objective Traders - For educational purposes only. Not Financial Advice. This week we mostly saw quiet changes in leadership as sector rotation
S&P 500 Update: Week ending May 11th 2018
 S&P 500 Update: Week ending May 11th 2018 1. Market Recap: The S&P 500 closed higher by 2.2% for week and broke out of some key resistance areas and a short term downtrend. There are 4 topics now setting
THE TREND RIDING STRATEGY
 THE TREND RIDING STRATEGY IMPORTANT : As an added bonus for downloading this report, you also received additional free training videos. To access your bonuses, go to: http://www.sublimeforexchampions.com/
Inter-market Technical Analysis for April 22, Summary Chart TheoTrade LLC. All rights reserved.
 1 Weekly Inter-market Technical Report Summary Chart 1 2018 TheoTrade LLC. All rights reserved. 2 Intraday Intermarket Volatility is returning to the markets, particularly with the collapse/sell-swing
Divergence and Momentum Trading
 presented by Thomas Wood MicroQuant SM Divergence Trading Workshop Day One Divergence and Momentum Trading Risk Disclaimer Trading or investing carries a high level of risk, and is not suitable for all
How To Read Charts Like A Pro Your guide to reading stock charts!
 How To Read Charts Like A Pro Your guide to reading stock charts! Courtesy of Swing-Trade-Stocks.com You may distribute this book FREELY or use it as part of a commercial package as long as this page and
presented by Thomas Wood MicroQuant SM Divergence Trading Workshop Day One Naked Trading Part 2
 presented by Thomas Wood MicroQuant SM Divergence Trading Workshop Day One Naked Trading Part 2 Risk Disclaimer Trading or investing carries a high level of risk, and is not suitable for all persons. Before
Before we get to all the details, we are going to look at a couple of trades in the first
 CHAPTER 1 Let s Get Started Before we get to all the details, we are going to look at a couple of trades in the first two chapters. From them you will get a good idea where we are heading, and how we are
3 Price Action Signals to Compliment ANY Approach to ANY Market
 3 Price Action Signals to Compliment ANY Approach to ANY Market Introduction: It is important to start this report by being clear that these signals and tactics for using Price Action are meant to compliment
1 December 2018 Volume 11, Issue 49. Summary for week of 3 December 2018
 1 December 2018 Volume 11, Issue 49 Summary for week of 3 December 2018 Stocks vulnerable to declines this week Dollar prone to downside pressure Crude oil could move significantly in both directions Gold
The Chart Buff. Australian Sharemarket Forecast. Technical Trading Ideas for the Active Investor
 . The Chart Buff Technical Trading Ideas for the Active Investor 21/11/11 Special Report Research by Gary Glover.. Australian Sharemarket - 2012 Forecast I normally do our yearly forecast at the start
Weekly outlook for April 30 May
 Weekly outlook for April 30 May 4 2018 Summary The S&P500 index is having trouble deciding if it will rally or decline. This indecision makes trading less profitable. Wait for a break-out direction to
Icoachtrader Consulting Service WELCOME TO. Trading Boot Camp. Day 5
 Icoachtrader Consulting Service www.icoachtrader.weebly.com WELCOME TO Trading Boot Camp Day 5 David Ha Ngo Trading Coach Phone: 1.650.899.1088 Email: icoachtrader@gmail.com The information presented is
Market Observations - as of Aug 17, 2018
 Market Observations - as of Aug 17, 2018 By Carl Jorgensen - For Objective Traders - For educational purposes only. Not Financial Advice. This week we saw a reversal of roles from the prior week. This
Market Observations - as of May 18, 2018
 Market Observations - as of May 18, 2018 By Carl Jorgensen - For Objective Traders - For educational purposes only. Not Financial Advice. After about 4 weeks of a relatively flat horizontal market (in
I Always Come Back To This One Method
 I Always Come Back To This One Method I can attribute my largest and most consistent gains to this very method of trading, It always work and never fails although I ve been known to still screw it up once
Training Workbook On Trends Analysis
 Training Workbook On Trends Analysis By Bill McLaren Copyright 2007 by McLaren Report. All Rights Reserved. www.mclarenreport.com.au Table of Contents Introduction 3 Chapter 1: Defining Trends 4 Chapter
Technical Analysis. Weekly Comment. Global. SPX Overbought Relief Rally in Europe!! Equities Sales Trading Commentary
 h Technical Analysis Equities Sales Trading Commentary Weekly Comment Global Michael Riesner Marc Müller 03/07/2012 michael.riesner@ubs.com marc.mueller@ubs.com +41-44-239 1676 +41-44-239 1789 SPX Overbought
Market Mastery Protégé Program Method 1 Part 1
 Method 1 Part 1 Slide 2: Welcome back to the Market Mastery Protégé Program. This is Method 1. Slide 3: Method 1: understand how to trade Method 1 including identifying set up conditions, when to enter
HOW THE DEAD CAT BOUNCE STOCK TRADING PATTERN WORKS by Michael Swanson
 HOW THE DEAD CAT BOUNCE STOCK TRADING PATTERN WORKS by Michael Swanson Hello my name is Michael Swanson and I m the author of Strategic Stock Trading and The Two Fold Formula, which is a book about the
WTI Crude Oil ($WTIC)
") 1 WTI Crude Oil ($WTIC) Monthly While gold is giving us mixed signals, Crude Oil is not (which actually could help in analyzing gold, assuming that Crude Oil and Gold share the same fate and are correlated
1 WTI Crude Oil ($WTIC) Monthly While gold is giving us mixed signals, Crude Oil is not (which actually could help in analyzing gold, assuming that Crude Oil and Gold share the same fate and are correlated
Cycle Turn Indicator Direction and Swing Summary. of Select Markets as of the close on. January 4, Daily Swing
 Cycle Turn Indicator Direction and Swing Summary of Select Markets as of the close on January 4, 2018 Market Daily CTI Daily Swing Weekly CTI Weekly Swing Industrial Positive Low Positive Low Transports
This is the complete: Fibonacci Golden Zone Strategy Guide
 This is the complete: Fibonacci Golden Zone Strategy Guide In this strategy report, we are going to share with you a simple Fibonacci Trading Strategy that uses the golden ratio which is a special mathematical
Trend Channels: How to Identify Easy Profit-Making Opportunities Using Simple Chart Analysis
 Trend Channels: How to Identify Easy Profit-Making Opportunities Using Simple Chart Analysis Trend channels produce a very powerful trading technique. They are very visible, which makes them easy to utilize
Cycle Turn Indicator Direction and Swing Summary. of Select Markets as of the close on. May 18, Daily Swing
 Cycle Turn Indicator Direction and Swing Summary of Select Markets as of the close on May 18, 2018 Market Daily CTI Daily Swing Weekly CTI Weekly Swing Industrial Neutral Low Positive Low Transports Positive
Now You Can Have These Trading Gems- Free!
 Presents Killer Patterns Now You Can Have These Trading Gems- Free! The Trading Info Revealed Here is not the Same as the Proven WizardTrader.com Methods But Works Well With Them 1 Copyright Information
Adding longs in the SPX zone will be well-rewarded longer term we believe.
 Executive Summary Last week we found, based on our analyses of the charts: Our SPX2146-2069 target zone remains and can now be narrowed down to SPX2117-2069, as the S&P500 closed at SPX2128 yesterday,
EZ Trade FOREX Day Trading System. by Beau Diamond
 EZ Trade FOREX Day Trading System by Beau Diamond The EZ Trade FOREX Day Trading System is mainly used with four different currency pairs; the EUR/USD, USD/CHF, GBP/USD and AUD/USD, but some trades are
With that, let s dive into the steps. Step 1 Identify range bound markets on Daily or 4 Hour Charts
 If you have been trading for any length of time, you have probably noticed that the markets are moving sideways A LOT. Consolidation is a huge part of the market s balance and so it makes sense to learn
The four year cycle revisited For members and families only, please do not forward as this tutorial will not be posted to the public.
 The four year cycle revisited 07-0421 For members and families only, please do not forward as this tutorial will not be posted to the public. A lot of my energy has been devoted to the gold sector these
EJ_4H Method Part III
 EJ_4H Method Part III Trailing price: Protecting your hard-earned money against reversals or even flurries is one of the most important parts of money management. Most of platforms have such feature that
Pattern Trader - April Trade Analysis, Trade Set-ups and Profit (Loss)
") Pattern Trader - April - 2016 - Trade Analysis, Trade Set-ups and Profit (Loss) Currency Pair: EURJPY Entry Order: SELL stop @ 126.94 Stop loss: 127.57 Take profit: 125.18 Analysis: EURJPY has been going
Pattern Trader - April - 2016 - Trade Analysis, Trade Set-ups and Profit (Loss) Currency Pair: EURJPY Entry Order: SELL stop @ 126.94 Stop loss: 127.57 Take profit: 125.18 Analysis: EURJPY has been going
Tuesday, June 30th, Gann Presentation for Bloomberg. Catapult Research by Jim Smith
 Tuesday, June 30th, 2009 Gann Presentation for Bloomberg Catapult Research by Jim Smith Dow Jones Industrials--Monthly Gann Cycles into High I showed this same chart on 8/13/07 at Bloomberg MTA seminar
Stocks, Bonds, U.S. Dollar Index, Precious Metals and Special Opportunities Updated Every Monday, Wednesday and Friday (except U.S.
 Stocks, Bonds, U.S. Dollar Index, Precious Metals and Special Opportunities Updated Every Monday, Wednesday and Friday (except U.S. Holidays) The SM is service marked and copyrighted by Elliott Wave International
Cycle Turn Indicator Direction and Swing Summary. of Select Markets as of the close on. January 25, Daily CTI. Swing
 Cycle Turn Indicator Direction and Swing Summary of Select Markets as of the close on January 25, 2019 Market Daily CTI Daily Swing Weekly CTI Weekly Swing Industrial Positive Low Positive Low Transports
Michael Riesner Marc Müller 23/05/2017. These are sales views based on Technical Analysis. They do not represent the UBS House View.
 h Equities Sales Trading Commentary Technical Analysis Weekly Comment Global Michael Riesner Marc Müller 23/05/2017 michael.riesner@ubs.com marc.mueller@ubs.com +41-44-239 1676 +41-44-239 1789 These are
Trade the Price Action By Laurentiu Damir. Copyright 2012 Laurentiu Damir
 Trade the Price Action By Laurentiu Damir Copyright 2012 Laurentiu Damir All rights reserved. No part of this book may be reproduced or transmitted in any form or by any means, electronic or mechanical,
14 th November General Outlook. Ian Copsey
 2006 General Outlook The Dollar is higher across the board and looks generally positive for one more rally to marginal new highs at least. The 1.2745 EURUSD, 1.2523 USDCHF and 1.8925-45 GBPUSD areas all
10-Year Treasury Notes ($UST Price)
") 1 Weekly Inter-market Technical Report 10-Year Treasury Notes ($UST Price) Monthly The 10-Year Note has developed a clear rising parallel trend channel that reaches now to the $128 level with confluence
1 Weekly Inter-market Technical Report 10-Year Treasury Notes ($UST Price) Monthly The 10-Year Note has developed a clear rising parallel trend channel that reaches now to the $128 level with confluence
Market Observations - as of Jun 8, 2018
 Market Observations - as of Jun 8, 2018 By Carl Jorgensen - For Objective Traders - For educational purposes only. Not Financial Advice. Over the past four months we have seen several examples of Consolidation
Technical Analysis. Used alone won't make you rich. Here is why
 Technical Analysis. Used alone won't make you rich. Here is why Roman sadowski The lesson to take away from this part is: Don t rely too much on your technical indicators Keep it simple and move beyond
Market Observations as of Dec 8, 2017
 Market Observations as of Dec 8, 2017 By Carl Jorgensen - For Objective Traders - For educational purposes only. Not Financial Advice. The Market Rotation we saw last week, with an exit from Tech into
Market Observations as of Aug 4, 2017
 Market Observations as of Aug 4, 2017 By Carl Jorgensen - For Objective Traders - For educational purposes only. Not Financial Advice. This week The mixed responses to earnings this week has resulted in
CHARTS. Bar Line Candlestick Charts are the basis of technical analysis They are a graphic display of price action. Notes:
 TECHNICAL ANALYSIS CHARTS Bar Line Candlestick Charts are the basis of technical analysis They are a graphic display of price action Candlestick charts have become the industry standard for technical traders.
Geometry in M and W Patterns: Bryce Gilmore s XABCD Tables
 Geometry in M and W Patterns: Bryce Gilmore s XABCD Tables XABCD Tables: Source: Bryce Gilmore, Price Action Manual [c] 2007, Chapter 19 These tables are designed to immediately highlight the internal
1 P a g e. Executive Summary
 Executive Summary Last week I was looking for SPX2455-2475 and the S&P500 gave us SPX2454 on Monday and then started to pullback and consolidate causing for many pundits to already start top calling. Close
Market Observations as of Oct 13, 2017
 Market Observations as of Oct 13, 2017 By Carl Jorgensen - For Objective Traders - For educational purposes only. Not Financial Advice. This week we saw the overall bullish trend continue upwards but with
DON T MISS OUT! Take advantage of this exclusive opportunity to reserve your copy of this highly-anticipated book and future bestseller.
 DON T MISS OUT! Take advantage of this exclusive opportunity to reserve your copy of this highly-anticipated book and future bestseller. Previewed from the upcoming trading book: BREAKTHROUGH STRATEGIES
Introduction to the Gann Analysis Techniques
 Introduction to the Gann Analysis Techniques A Member of the Investment Data Services group of companies Bank House Chambers 44 Stockport Road Romiley Stockport SK6 3AG Telephone: 0161 285 4488 Fax: 0161
Technicals & Time Frame
 Advanced Charting Neither Better Trades or any of its personnel are registered broker-dealers or investment advisers. I will mention that I consider certain securities or positions to be good candidates
US Dollar Struggles as Euro Gains Top Spot - A review of the Major Global Currencies
 US Dollar Struggles as Euro Gains Top Spot - A review of the Major Global Currencies 26 th November 2017 My colleagues have been urging me to write a weekly commentary on Bitcoin/Cryptocurrencies. However,
Daily Support & Resistance
 Daily Support & Resistance 30 th July 2010 USDJPY Price continued to decline as expected and stalled at the 85.96 support. The pullback has been firm but has not managed to penetrate both 4-hour & hourly
1 P a g e. Executive Summary
 Executive Summary My call two weeks ago to revoke the major-3 top for the S&P500 based on OEW downtrend confirmations on several indices including the S&P500. was the correct thing today as I was then
Submerging Markets. Market Update August 3, Seattle Technical Advisors
 SeattleTA provides investment managers with technical analysis of the equity, fixed-income, commodity, and currency markets. A cycle low is expected in emerging markets this week and is confirmed by a
Forex Range Trading With Price Action Forex Trading System By Laurentiu Damir
 Forex Range Trading With Price Action Forex Trading System By Laurentiu Damir Copyright 2012 by Laurentiu Damir All rights reserved. No part of this book may be reproduced or transmitted in any form or
Cycle Turn Indicator Direction and Swing Summary. of Select Markets as of the close on. December 6, Daily CTI. Swing
 Cycle Turn Indicator Direction and Swing Summary of Select Markets as of the close on December 6, 2018 Market Daily CTI Daily Swing Weekly CTI Weekly Swing Industrial Negative High Positive Low Transports
Market Maps. Bob Dickey, Technical Strategist, Portfolio Advisory Group. January RBC Capital Markets, LLC / Portfolio Advisory Group
 Market Maps Bob Dickey, Technical Strategist, Portfolio Advisory Group RBC Capital Markets, LLC / Portfolio Advisory Group All values in U.S. dollars and priced as of December 31, 2018, unless otherwise
Stacking Indicators Getting a GREAT entry! TWEEZERS Tweezer top/bottom at the band The stock is trending up Gap down (against the trend) Any moving
 Any moving") Dean Storholt I am not a registered broker-dealer or investment adviser. I will mention that I consider certain securities or positions to be good candidates for the types of strategies we are discussing
Dean Storholt I am not a registered broker-dealer or investment adviser. I will mention that I consider certain securities or positions to be good candidates for the types of strategies we are discussing
Market Technical Analysis REPORT
 Market Technical Analysis REPORT using Integrated Pitchfork Analysis by Dr Mircea Dologa, MD, CTA MORNING of May 21st 2007 The traders must progressively monitor the conditions of the market movements
Tradeciety s Price Action Guide
 Tradeciety s Price Action Guide Welcome... 3 Who am I?... 3 Some impressions from my trading & traveling lifestyle... 4 What Is Price Action?... 6 Candlesticks vs. Chart patterns... 7 Top 3 Candlestick
Cycle Turn Indicator Direction and Swing Summary. of Select Markets as of the close on. April 10, 2018
 Cycle Turn Indicator Direction and Swing Summary of Select Markets as of the close on April 10, 2018 Market Daily CTI Daily Swing Weekly CTI Weekly Swing Industrial Positive Low Negative High Transports
Market Observations - as of Oct 19, 2018
 Market Observations - as of Oct 19, 2018 By Carl Jorgensen - For Objective Traders - For educational purposes only. Not Financial Advice. Last week ended with a rather small bounce after a large volatile
FOREX LEARNING BY MADIBA MALEBO
 FOREX LEARNING BY MADIBA MALEBO INTRODUCTION TO TREND AND ANALYSIS TREND ANALYSIS. PEAKS AND TROUGHS. SPOTTING UPTRENDS. SPOTTING DOWNTRENDS. TAKING ADVANTAGE OF TRENDS. TAKING ADVANTAGE OF DOWNTREND.
DAILY DAY TRADING PLAN
 DAILY DAY TRADING PLAN Gatherplace will be used to place all of your trades. You will be using the 5 minute chart for the trade setup and the 1 minute chart for your entry, stop and trailing stop.you will
Technical Analysis. Used alone won't make you rich. Here is why
 Technical Analysis. Used alone won't make you rich. Here is why Roman Sadowski The lesson to take away from this part is: Don t rely too much on your technical indicators Keep it simple and move beyond
Weekly outlook for Nov. 27 Dec
 Weekly outlook for Nov. 27 Dec. 1 2017 Summary For the ES we expect a minor pullback in the early part of the week, followed by a rally into the weekly close. There are four option expirations this week
Market Observations as of Sept 22, 2017
 Market Observations as of Sept 22, 2017 By Carl Jorgensen - For Objective Traders - For educational purposes only. Not Financial Advice. We saw a mixed market this week, similar to the prior few weeks,
Market Technical Analysis REPORT : Europe
 1 Market Technical Analysis REPORT : Europe using Integrated Pitchfork Analysis by Dr Mircea Dologa, MD, CTA MORNING of April 30th 2007 The traders must progressively monitor the conditions of the market
Last Hurrah for the Dollar. Market Update June 15, Seattle Technical Advisors
 SeattleTA provides investment managers with technical analysis of the equity, fixed-income, commodity, and currency markets. This week should see the start of the final push upward by the US Dollar prior
Chapter 3. Price Action
 Chapter 3 Price Action The movement of price in any market is called Price Action. This movement is caused by the beliefs and trading systems of hundreds of thousands of worldwide traders that the market