WTI Crude Oil ($WTIC)
|
|
|
- Rosalind Bailey
- 5 years ago
- Views:
Transcription
.")
.")
1 1 WTI Crude Oil ($WTIC) Monthly While gold is giving us mixed signals, Crude Oil is not (which actually could help in analyzing gold, assuming that Crude Oil and Gold share the same fate and are correlated positively). The pathway appears to be clearly lower on the monthly chart, arguing - again similar to Gold - that a C Wave correction is underway after finding confluence resistance at the $75 level (both from a convergence of EMAs and the 38.2% Fibonacci retracement from the 2008 high to the 2009 low). The 2009 rally has 'felt' corrective all the way up, and since January/February in these reports, I have been calling for a target in Crude to rally to the $70 area which has materialized. Once a target is met, we will assess the structure and the structure is almost overwhelmingly in favor of lower crude oil prices yet to come which could take us over the next few months to the $40 level or lower. 1

2 2 Weekly We see a closer view of the same picture, and can now 'fractalize' the "B Wave into an expected three-wave (abc) structure which has completed again at the convergence of the 38.2% Fibonacci Retracement and now the 200 week SMA. The only major potential support on the weekly chart is the $61 level which reflects the 20 week EMA which could indeed provide a short-term bounce, but once broken, the target will become clear - a full retracement (if not lower prices) than the $40 level which was hit in early
, we could be ready to experience a pullback perhaps to the $64 level which would be a fractal Wave iv (4) move, but a break of $60 would")
3 3 Daily I am showing the internal Elliott primary count I have on Crude Oil. With the Doji at the $60 support (reference the weekly chart), we could be ready to experience a pullback perhaps to the $64 level which would be a fractal Wave iv (4) move, but a break of $60 would hint that price would move to challenge the $56 level. I would count on a slight bounce off this level (which could be bullish for stocks) but it might best be played off the intraday charts than trying to take a swing position to manage risk and take stops quicker should the move up fail to materialize. We see a triple-swing negative momentum divergence going into the highs of June (on each of the fractal impulse waves of "c") so that signals at least an intermediate if not long term top should be expected at the $72 levels. 3

4 4 Another reason I would be expecting a possible bounce would be due to the price achieving a 32.8% Fibonacci retracement of the December lows to the June highs. The doji at this level hints at a retracement up, though it would most likely only be a fourth-wave fractal of a 5-wave Elliott Move. Breaking beneath $60 would invalidate the 'bounce' view and would set-up $55/$57 as a minimum target. 4

5 5 US Dollar Index ($USD) Monthly The dollar here is similar to gold, in that interpretation is a little more difficult than normal so keep this in mind when trying to trade it or glean analysis from it - it's at a critical balance point and we need price to break from this level to get confident. For now, we're still in a long-term down-trend and price found resistance in early 2009 at the 38.2% retracement of the 2002 highs to the 2008 lows. Price is stair-stepping down off this level, but last month formed a 'spinning top' and so far we have a 'doji' so this isn't what we'd expect for a large downside bias. Price is beneath the 20 and 50 EMAs and is hugging the 20 for resistance. Let's drop to the lower frames for more insight. 5
.")
6 6 Weekly I'm showing that we're currently at the 50% Fibonacci level from the 2008 lows to the 2009 highs, and that multiple dojis have formed at this level (a deep consolidation and pause which is either a normal 4th wave retracement or a base for a higher move to form). A distinct negative momentum divergence formed on the March highs above $88 (as did a doji) which was the clearest sell-signal of the year. Now, we see a bullish engulfing hammer in early June which has resulted in a deep consolidation until now. The trend is down; price is beneath all EMAs, and there is a convergence of critical resistance at the $82 level. However, price could be pulled to this level as a counter-move so on any up-move, the $82 level would be an obvious resistance target. A break beneath $80 would trigger a possible down-move to test the 61.8% Fibonacci retracement which is situated at $ A fall in the dollar would be bullish for stocks and commodities, though if the Dollar held firm and rallied from these levels, it would result in a lower stock market and lower gold and crude prices. This is why understanding inter-market analysis is important. A movement in one market can either give you clues or directly influence another market. 6

7 7 Daily Zooming in, we see a closer glimpse of the structure of the possible Elliott fractal move down. The one thing that slightly disturbs me about this count is that we see a distinct positive momentum divergence going into the wave 3 lows - normally, we would want to see a divergence heading into the 5th wave to hint that the move was terminating, so this is a slight non-confirmation of the June price lows. That being said, we do see a consolidation in the dollar which has taken place since June. Part of this is likely because of the technical strength in the Japanese Yen ($XJY) which has offset the consolidation/weakness in the Euro ($XEU). The Euro makes up 56% of the Dollar Index, and a falling Euro is bullish for the Dollar and a Rising Yen (around 16% of the index) is bearish for the dollar. The bearish effect of the super-strength in the Yen has offset the bullish benefit of a falling Euro which - in part - has led to this consolidation in the US Dollar Index. That being said, watch $81 for overhead resistance and $79.50 for support - a break of either level will give us clues into the next move for the dollar. As always, a rising dollar (should we break above $81) would be bearish for the stock market and commodities and bullish for bonds; and vice versa should the dollar break beneath $79 (rise in stocks, fall in bonds, rise in commodities). 7

8 8 DAILY Color Comparisons 8

9 9 WEEKLY Color Comparisons 9
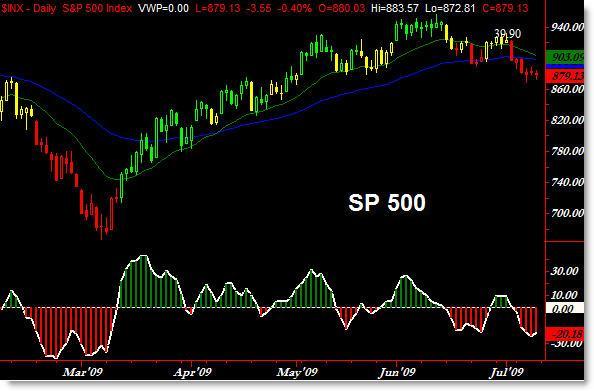
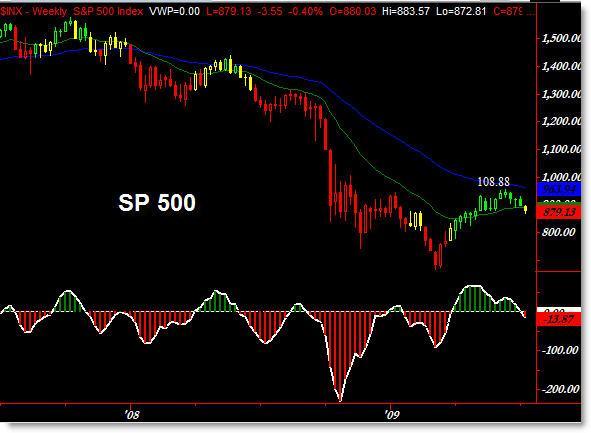
10 10 Summary Comments Ten-Year Notes: The Monthly and Daily frame hint at bullishness, yet the buyers will have to overcome "cradle" resistance in the weekly charts. Watch to see if buyers can push the index past $ which would argue for higher prices, particularly if the Stock Market fails to hold the 875 level. S&P 500: Buyers HAVE to hold the $875 level or else multi-timeframe charts will trigger a potentially strong sell-move in the Index. There are slight bullish signals on the daily chart which could hint at a retracement/inflection move up, but should 875 and particularly 870 be broken cleanly, it could trigger a massive wave of selling which is the expected play. Gold: Gold is the most difficult market to interpret this week, so refer back to the full text for analysis. Bulls need to defend $900 but it appears that structure could be cracking to the downside which would surprise many people. Crude Oil: Like the S&P 500, Crude Oil is sitting at a critical juncture and buyers need to hold it up. We could see a short retracement up but if buyers fail to do so, the larger timeframe charts will be dominant and could eventually lead to a retest of prior support about the $40 level. Short-term however, price has come into confluence support. US Dollar Index: The dollar has consolidated in a tight range for a month, with overhead resistance at the $81 level. Structure appears to be calling for a swing lower in an Elliott sense, but we appear to be in or completing a Wave 4 correction which might have a little further to go to the upside. Disclaimer: All information is from sources deemed to be reliable, but there is no guarantee to the accuracy. Information is for educational purposes only and is not intended to give specific trading advice. Past performance is no guarantee of future performance. Investment/ trading carries significant risk of loss and you should consult your financial professional before investing or trading. Your financial advisor can give you specific financial advice that is appropriate to your needs, risk-tolerance, and financial position. Neither Corey Rosenbloom nor Afraid to Trade was compensated in any way by any of the broad markets, stocks, or securities discussed in this report. Corey Rosenbloom is compensated by the sale of this report and not by any underwriter or dealer associated with these markets. Opinions are based on widely-accepted methods of technical analysis including the Elliott Wave Principle, Oscillators/Indicators, Candle-charting analysis, Volume, Fibonacci, and other methods of analysis. No specific recommendation is given to buy, hold, or sell any of these markets/securities or exchange traded funds related to these markets. Neither Corey Rosenbloom nor Afraid to Trade is a Registered Investment Advisor. Long-term investment success relies on recognizing probabilities in price action for possible future outcomes, rather than absolute certainty risk-management is critical for success. Error and uncertainty are part of any form of market analysis. 10
10-Year Treasury Notes ($UST Price)
") 1 Weekly Inter-market Technical Report 10-Year Treasury Notes ($UST Price) Monthly The 10-Year Note has developed a clear rising parallel trend channel that reaches now to the $128 level with confluence
1 Weekly Inter-market Technical Report 10-Year Treasury Notes ($UST Price) Monthly The 10-Year Note has developed a clear rising parallel trend channel that reaches now to the $128 level with confluence
10-Year Treasury Notes ($UST Price)
") 1 Weekly Inter-market Technical Report 10-Year Treasury Notes ($UST Price) Monthly Continuing from last week's report, bonds (notes) appear to be on a strong buy signal on the monthly chart, as price is
1 Weekly Inter-market Technical Report 10-Year Treasury Notes ($UST Price) Monthly Continuing from last week's report, bonds (notes) appear to be on a strong buy signal on the monthly chart, as price is
Inter-market Technical Analysis for April 22, Summary Chart TheoTrade LLC. All rights reserved.
 1 Weekly Inter-market Technical Report Summary Chart 1 2018 TheoTrade LLC. All rights reserved. 2 Intraday Intermarket Volatility is returning to the markets, particularly with the collapse/sell-swing
Inter-market Technical Analysis for April 29, Summary Chart TheoTrade LLC. All rights reserved.
 1 Weekly Inter-market Technical Report Summary Chart 1 2018 TheoTrade LLC. All rights reserved. 2 Intraday Intermarket Volatility and even trend is back in our markets! The main movement recently came
Weekly outlook for April 30 May
 Weekly outlook for April 30 May 4 2018 Summary The S&P500 index is having trouble deciding if it will rally or decline. This indecision makes trading less profitable. Wait for a break-out direction to
Multi-asset technical strategies Week of 20 th November Mark Sturdy. Authorised and regulated by the FSA. Summary. Currencies. Stocks.
 + Standard S&P 500 & Poors 500 + European EuroStoxx DJ 50 Stoxx 50 + Ten year Year US Treasury treasury TNote note Note + Ten year Year Euro German Bund Bund + Ten UK Gilt year Japanese Bond + Dollar Oil
Lara s Weekly. S&P500 + GOLD + USOIL Elliott Wave & Technical Analysis. Lara Iriarte CMT 23 February, 2018
 Lara s Weekly S&P500 + GOLD + USOIL Elliott Wave & Technical Analysis Lara Iriarte CMT 23 February, 2018 S&P 500 Contents S&P 500 GOLD USOIL About Disclaimer 3 18 36 48 48 S&P 500 S&P 500 Upwards movement
Forex Sentiment Report Q2 FORECAST WEAK AS LONG AS BELOW April
 Forex Sentiment Report 08 April 2015 www.ads-securities.com Q2 FORECAST WEAK AS LONG AS BELOW 1.1200 Targets on a break of 1.1534/35: 1.1740/50 1.1870/75 1.2230/35 Targets on a break of 1.0580/70: 1.0160
Weekly outlook for Nov. 27 Dec
 Weekly outlook for Nov. 27 Dec. 1 2017 Summary For the ES we expect a minor pullback in the early part of the week, followed by a rally into the weekly close. There are four option expirations this week
Quantitative/Technical Analysis January 8, 2015
 Quantitative/Technical Analysis January 8, 2015 2015 Macro/Technical Outlook SYMBOL NAME PAGE USD U.S. Dollar Index 2 XEU Euro Index 3 CDW Canadian Dollar Index 4 XAD Australian Dollar 6 XJY Japanese Yen
Weekly outlook for April 23, 2018
 Weekly outlook for April 23, 2018 Summary The S&P 500 index is expected to go down further if price stays below the 2700 level. A weekly doji candle formed on the intermediate-term chart, and the short-term
Walter Murphy s Insights Short Term Review
 Walter Murphy s Insights Short Term Review Strategic Analysis for the Serious Investor Walter G. Murphy, Jr., CFA WMinsights.com February 17, 2014 Plain English US Equities: It is entirely possible that
Trading Lessons from the Intraday Frame (study)
") 1 Daily "Idealized Trades" Report Trading Lessons from the Intraday Frame (study) 1 2018 TheoTrade LLC. All rights reserved. 2 Trading Lessons from the Intraday Frame (1-mi) Major Companies Reporting Earnings
1 Daily "Idealized Trades" Report Trading Lessons from the Intraday Frame (study) 1 2018 TheoTrade LLC. All rights reserved. 2 Trading Lessons from the Intraday Frame (1-mi) Major Companies Reporting Earnings
Weekly outlook for Mar
 Weekly outlook for Mar. 26 30 2018 Summary The S&P500 index is expected to test February's low first and bounce from it before the Good Friday holiday. The end of the month and the end of the quarter may
INTERMEDIATE EDUCATION GUIDE
 INTERMEDIATE EDUCATION GUIDE CONTENTS Key Chart Patterns That Every Trader Needs To Know Continution Patterns Reversal Patterns Statistical Indicators Support And Resistance Fibonacci Retracement Moving
EWF YEARLY FORECAST 2/7/2017
 WWW.ELLIOTTWAVE-FORECAST.COM EWF YEARLY FORECAST 2/7/2017 SPX should remain bullish against February 2016 low Cycle from 2.2016 low in SPX is mature but the Index still has scope to extend higher towards
Commodity Weekly Technicals
 Technical Analysis Research Commodity Weekly Technicals Tuesday, 17 December 2013 Technical Outlook Technical Outlook Market S&P GSCI TR Index: Short term view (1-3 weeks) Market has failed ahead of the
Figure 3.6 Swing High
 Swing Highs and Lows A swing high is simply any turning point where rising price changes to falling price. I define a swing high (SH) as a price bar high, preceded by two lower highs (LH) and followed
Weekly outlook for Aug. 27 Aug. 31, 2018
 Weekly outlook for Aug. 27 Aug. 31, 2018 Summary The S&P500 index is expected to have a monthly adjustment move this week, the volatility expected to be high, and price could have a big swing move. Oil
Trading Lessons from the Intraday Frame (study)
") 1 Daily "Idealized Trades" Report Trading Lessons from the Intraday Frame (study) 1 2018 TheoTrade LLC. All rights reserved. 2 Trading Lessons from the Intraday Frame (1-mi) 2 2018 TheoTrade LLC. All rights
1 Daily "Idealized Trades" Report Trading Lessons from the Intraday Frame (study) 1 2018 TheoTrade LLC. All rights reserved. 2 Trading Lessons from the Intraday Frame (1-mi) 2 2018 TheoTrade LLC. All rights
Technical Analysis. Weekly Comment. Global. SPX Overbought Relief Rally in Europe!! Equities Sales Trading Commentary
 h Technical Analysis Equities Sales Trading Commentary Weekly Comment Global Michael Riesner Marc Müller 03/07/2012 michael.riesner@ubs.com marc.mueller@ubs.com +41-44-239 1676 +41-44-239 1789 SPX Overbought
The Avalanche (Reverse for a Phoenix )
") The Avalanche (Reverse for a Phoenix ) The 6 Building Blocks of Price Development (Ideal Scenario): Momentum: Above average pace on the reversal from highs, followed by slower than average upside as support
The Avalanche (Reverse for a Phoenix ) The 6 Building Blocks of Price Development (Ideal Scenario): Momentum: Above average pace on the reversal from highs, followed by slower than average upside as support
TRADE ANALYSIS. August 2017 Performance
 EUR/AUD SHORT Entry Date 01/08/2017 Entry point 1.4930 Stop-Loss 1.4980 Risk-Reward Ratio 14 Target 1.4230 As indicated on the chart we can see that the pair previously reversed to the downside between
The Art & Science of Active Trend Trading
 Candlesticks Looking for U-Turns The Art & Science of Active Trend Trading Copywrite ATTS 2007-2015 1 Disclaimer U.S. Government Required Disclaimer Commodity Futures Trading Commission Futures and Options
Wave-to-Wave Trading Analysis June 1, 2012
 Trading Wave-to-Wave 1 Wave-to-Wave Trading Analysis June 1, 2012 S&P 500 Index ETF (SPY) Successful traders understand that there are waves within waves 5-minute waves inside of 60-minute waves inside
Trading Lessons from the Intraday Frame (study)
") 1 Daily "Idealized Trades" Report Trading Lessons from the Intraday Frame (study) 1 2018 TheoTrade LLC. All rights reserved. 2 Trading Lessons from the Intraday Frame (1-mi) 2 2018 TheoTrade LLC. All rights
1 Daily "Idealized Trades" Report Trading Lessons from the Intraday Frame (study) 1 2018 TheoTrade LLC. All rights reserved. 2 Trading Lessons from the Intraday Frame (1-mi) 2 2018 TheoTrade LLC. All rights
14 th November General Outlook. Ian Copsey
 2006 General Outlook The Dollar is higher across the board and looks generally positive for one more rally to marginal new highs at least. The 1.2745 EURUSD, 1.2523 USDCHF and 1.8925-45 GBPUSD areas all
Trading Lessons from the Intraday Frame (study)
") 1 Daily "Idealized Trades" Report Trading Lessons from the Intraday Frame (study) 1 2018 TheoTrade LLC. All rights reserved. 2 Trading Lessons from the Intraday Frame (1-mi) Major Companies Reporting Earnings
1 Daily "Idealized Trades" Report Trading Lessons from the Intraday Frame (study) 1 2018 TheoTrade LLC. All rights reserved. 2 Trading Lessons from the Intraday Frame (1-mi) Major Companies Reporting Earnings
The Art & Science of Active Trend Trading
 CONNECTING THE DOTS Candlesticks & Convergence of Clues The Art & Science of Active Trend Trading Copyright ATTS 2007-2015 1 Dennis W. Wilborn, P.E. Founder, President Active Trend Trading dww@activetrendtrading.com
the TFXT Members Guide to Risk and Money Management Guide to order types and Forex Terms
 15 December Morning Comment - No record highs for the first time this week and after registering two Doji type daily candles in recent days, the S&P has seen some follow through to the downside overnight.
How to perform accurate market analysis
 How to perform accurate market Roman Sadowski Good market combines the fundamental and the technical. This combination is essential to form a longer-term bias in the market. Good market needs to consider
Trading Lessons from the Intraday Frame (study)
") 1 Daily "Idealized Trades" Report Trading Lessons from the Intraday Frame (study) 1 2018 TheoTrade LLC. All rights reserved. 2 Trading Lessons from the Intraday Frame (1-mi) 2 2018 TheoTrade LLC. All rights
1 Daily "Idealized Trades" Report Trading Lessons from the Intraday Frame (study) 1 2018 TheoTrade LLC. All rights reserved. 2 Trading Lessons from the Intraday Frame (1-mi) 2 2018 TheoTrade LLC. All rights
Intermediate Outlook July 13-20, 2009 Jim Curry, Publisher
 Intermediate Outlook July 13-20, 2009 Jim Curry, Publisher S&P 500 CASH S&P 500 Cash Index - 07/17/09 Close - 940.38 SPX CASH: 5-Day Projected Support and Resistance levels: High - 976; Low - 908 SEPT
3 Price Action Signals to Compliment ANY Approach to ANY Market
 3 Price Action Signals to Compliment ANY Approach to ANY Market Introduction: It is important to start this report by being clear that these signals and tactics for using Price Action are meant to compliment
presented by Thomas Wood MicroQuant SM Divergence Trading Workshop Day One Naked Trading Part 2
 presented by Thomas Wood MicroQuant SM Divergence Trading Workshop Day One Naked Trading Part 2 Risk Disclaimer Trading or investing carries a high level of risk, and is not suitable for all persons. Before
2.0. Learning to Profit from Futures Trading with an Unfair Advantage! Income Generating Strategies Essential Trading Tips & Market Insights
 2.0 Learning to Profit from Futures Trading with an Unfair Advantage! Income Generating Strategies Essential Trading Tips & Market Insights Income Generating Strategies Essential Trading Tips & Market
Stocks, Bonds, U.S. Dollar Index, Precious Metals and Special Opportunities Updated Every Monday, Wednesday and Friday (except U.S.
 Stocks, Bonds, U.S. Dollar Index, Precious Metals and Special Opportunities Updated Every Monday, Wednesday and Friday (except U.S. Holidays) The SM is service marked and copyrighted by Elliott Wave International
Market Turning Points By Andre Gratian
 Market Turning Points By Andre Gratian June 21, 2015 Precision timing for all time frames through a multi-dimensional approach to forecasting using technical analysis: Cycles - Breadth - P&F and Fibonacci
Trading Lessons from the Intraday Frame (study)
") 1 Daily "Idealized Trades" Report Trading Lessons from the Intraday Frame (study) 1 2018 TheoTrade LLC. All rights reserved. 2 Trading Lessons from the Intraday Frame (1-mi) 2 2018 TheoTrade LLC. All rights
1 Daily "Idealized Trades" Report Trading Lessons from the Intraday Frame (study) 1 2018 TheoTrade LLC. All rights reserved. 2 Trading Lessons from the Intraday Frame (1-mi) 2 2018 TheoTrade LLC. All rights
Weekly outlook for May 21 - May 25, 2018
 Weekly outlook for May 21 - May 25, 2018 Summary The S&P500 index is expected to hold up for a higher level. The market broke to the upside from a symmetrical triangle pattern and is consolidating above
Forex Range Trading With Price Action Forex Trading System By Laurentiu Damir
 Forex Range Trading With Price Action Forex Trading System By Laurentiu Damir Copyright 2012 by Laurentiu Damir All rights reserved. No part of this book may be reproduced or transmitted in any form or
SPX for the smaller major-4 triangle or SPX to complete the double zigzag. Figure 1.
 Today s break -finally- below SPX2625 (and SPX2613) places the Ball now firmly in the Bears camp, albeit today s strong rally off the lows. And the two main bear counts remain the focus for now: SPX2579-2568
The 5-0 Pattern. 50% BC Projection Defines the Pattern s Completion Point:
 The 5-0 Pattern Although I have been aware of the structure for quite some time, the 5-0 Pattern is a relatively new discovery within the Harmonic Trading approach that I have refined immensely over the
Lighting the Way: Using Candlestick Patterns. The Art & Science of Active Trend Trading
 Lighting the Way: Using Candlestick Patterns The Art & Science of Active Trend Trading Disclaimer U.S. Government Required Disclaimer Commodity Futures Trading Commission Futures and Options trading has
Market Update March 9, 2015
 SeattleTA provides investment managers with technical analysis of the equity, fixed-income, Stocks dropped and interest rates popped on Fridays payroll report as traders priced in a likely Fed rate hike
The Art & Science of Active Trend Trading
 CONNECTING THE DOTS Candlesticks & Convergence of Clues The Art & Science of Active Trend Trading Copywrite ATTS 2007-2015 1 Dennis W. Wilborn, P.E. Founder, President Active Trend Trading dww@activetrendtrading.com
Trading Lessons from the Intraday Frame (study)
") 1 Daily "Idealized Trades" Report Trading Lessons from the Intraday Frame (study) 1 2018 TheoTrade LLC. All rights reserved. 2 Trading Lessons from the Intraday Frame (1-mi) 2 2018 TheoTrade LLC. All rights
1 Daily "Idealized Trades" Report Trading Lessons from the Intraday Frame (study) 1 2018 TheoTrade LLC. All rights reserved. 2 Trading Lessons from the Intraday Frame (1-mi) 2 2018 TheoTrade LLC. All rights
CONNECING THE DOTS Candlesticks & Convergence of Clues. The Art & Science of Active Trend Trading
 CONNECING THE DOTS Candlesticks & Convergence of Clues The Art & Science of Active Trend Trading Disclaimer U.S. Government Required Disclaimer Commodity Futures Trading Commission Futures and Options
Weekly MCX Research Report BULLIONS WEEKLY TECHNICAL LEVELS GOLD(APRIL) MCX WEEKLY CHART
 MCX WEEKLY CHART") Weekly MCX Research Report BULLIONS WEEKLY TECHNICAL LEVELS GOLD(APRIL) MCX WEEKLY CHART 26/02/2018-02/02/2018 S1 30336 S2 30167 PP 30564 R1 30733 R2 30961 TECHNICAL/FUNDAMENTAL VIEW - Gold market continue
Weekly MCX Research Report BULLIONS WEEKLY TECHNICAL LEVELS GOLD(APRIL) MCX WEEKLY CHART 26/02/2018-02/02/2018 S1 30336 S2 30167 PP 30564 R1 30733 R2 30961 TECHNICAL/FUNDAMENTAL VIEW - Gold market continue
Foreign Exchange Currency Pair Analysis: USD/JPY
 Figure 1.1: A Case Study of the Crash in USD/JPY in the First Half of October 2014 Figure 1.2: Monthly Chart of USD/JPY Figure 1.3: Weekly Chart of USD/JPY Figure 1.4: Daily Chart of USD/JPY Case Study
1. Introduction 2. Chart Basics 3. Trend Lines 4. Indicators 5. Putting It All Together
 Technical Analysis: A Beginners Guide 1. Introduction 2. Chart Basics 3. Trend Lines 4. Indicators 5. Putting It All Together Disclaimer: Neither these presentations, nor anything on Twitter, Cryptoscores.org,
Monthly Dairy Technical Commentary August 19, 2015
 Monthly Dairy Technical Commentary August 19, 2015 CME Class III Milk Futures Range contraction continues for Class III Milk as it continues to correct the September 2014 through January 2015 downdraft.
TRADING VIEW: A Break and close below support.7600c would be the catalyst to looking for short trade opportunities in the sessions ahead.
 06 April 2018 S&P 500 A 5 wave decline can be counted on the daily chart from the 2807.25 high of March to the low of 2552. This is the first indication that a trading low may be in place. Confidence that
Last Gasp in the Dollar. Market Update May 18, Seattle Technical Advisors
 SeattleTA provides investment managers with technical analysis of the equity, fixed-income, commodity, and currency markets. While equities are expected to take a hit this week, the big news is expected
DAILY DAY TRADING PLAN
 DAILY DAY TRADING PLAN Gatherplace will be used to place all of your trades. You will be using the 5 minute chart for the trade setup and the 1 minute chart for your entry, stop and trailing stop.you will
Weekly outlook for May 1 May
 Weekly outlook for May 1 May. 5 2017 TREND DIRECTION S&P 500 Oil Gold Short Term Intermediate-Term Long Term strong weak strong strong neutral Strong weak weak weak Summary The S&P500 index is expected
presented by Thomas Wood MicroQuant SM Divergence Trading Workshop Day One Bond Trading Success
 presented by Thomas Wood MicroQuant SM Divergence Trading Workshop Day One Bond Trading Success Risk Disclaimer Trading or investing carries a high level of risk, and is not suitable for all persons. Before
Forex Price Direction Analysis.
 Forex Price Direction Analysis. September 24 2010 1 Sign Up Now to Upshots forex trade signals disclaimer The information provided in this report is for educational purposes only. It is not a recommendation
Market Technical Analysis REPORT : Europe
 1 Market Technical Analysis REPORT : Europe using Integrated Pitchfork Analysis by Dr Mircea Dologa, MD, CTA MORNING of April 30th 2007 The traders must progressively monitor the conditions of the market
Trading Lessons from the Intraday Frame (study)
") 1 Daily "Idealized Trades" Report Trading Lessons from the Intraday Frame (study) 1 2018 TheoTrade LLC. All rights reserved. 2 Trading Lessons from the Intraday Frame (1-min) 2 2018 TheoTrade LLC. All
1 Daily "Idealized Trades" Report Trading Lessons from the Intraday Frame (study) 1 2018 TheoTrade LLC. All rights reserved. 2 Trading Lessons from the Intraday Frame (1-min) 2 2018 TheoTrade LLC. All
Pattern Trader - April Trade Analysis, Trade Set-ups and Profit (Loss)
") Pattern Trader - April - 2016 - Trade Analysis, Trade Set-ups and Profit (Loss) Currency Pair: EURJPY Entry Order: SELL stop @ 126.94 Stop loss: 127.57 Take profit: 125.18 Analysis: EURJPY has been going
Pattern Trader - April - 2016 - Trade Analysis, Trade Set-ups and Profit (Loss) Currency Pair: EURJPY Entry Order: SELL stop @ 126.94 Stop loss: 127.57 Take profit: 125.18 Analysis: EURJPY has been going
Trend Channels: How to Identify Easy Profit-Making Opportunities Using Simple Chart Analysis
 Trend Channels: How to Identify Easy Profit-Making Opportunities Using Simple Chart Analysis Trend channels produce a very powerful trading technique. They are very visible, which makes them easy to utilize
CMT LEVEL I CURRICULUM Self-Evaluation
 CMT LEVEL I CURRICULUM Self-Evaluation DEAR CFA CHARTERHOLDER, As a CFA charterholder, the requirement that you sit for the CMT Level I exam is waived. However, the content in the CMT Level I Curriculum
Technical Analysis Basics. Identifying Tops
 Technical Analysis Basics. Identifying Tops June 2011 1 Sign Up Now to Upshots forex trade signals disclaimer The information provided in this report is for educational purposes only. It is not a recommendation
Technicals & Time Frame
 Advanced Charting Neither Better Trades or any of its personnel are registered broker-dealers or investment advisers. I will mention that I consider certain securities or positions to be good candidates
Trading Lessons from the Intraday Frame (study)
") 1 Daily "Idealized Trades" Report Trading Lessons from the Intraday Frame (study) 1 2018 TheoTrade LLC. All rights reserved. 2 Trading Lessons from the Intraday Frame (1-min) 2 2018 TheoTrade LLC. All
1 Daily "Idealized Trades" Report Trading Lessons from the Intraday Frame (study) 1 2018 TheoTrade LLC. All rights reserved. 2 Trading Lessons from the Intraday Frame (1-min) 2 2018 TheoTrade LLC. All
Technical Strategy. Q1 Dollar top as the basis for a sharp correction
 2017 Chart 38. ) DXY with Advance/Decline Line (20 Key Dollar Pairs) Chart 39. ) US Dollar with Presidential Cycle Tactically, we have been bullish US dollar since the May 2016 bottom, which is the base
Market Technical Analysis REPORT
 Market Technical Analysis REPORT using Integrated Pitchfork Analysis by Dr Mircea Dologa, MD, CTA MORNING of May 21st 2007 The traders must progressively monitor the conditions of the market movements
WORKBOOK. The FX Trader s EDGE BLUEPRINT ENCORE EVENT. How to Capture Low Hanging Profits in the New Year Using 3 Simple Blueprints
 WORKBOOK The FX Trader s EDGE BLUEPRINT ENCORE EVENT How to Capture Low Hanging Profits in the New Year Using 3 Simple Blueprints Jody Samuels, Juan Maldonado and Neil Bradford Disclaimer This workbook
BONUS. www. candlecharts.com/special/swing-trading-2/
 BONUS www. candlecharts.com/special/swing-trading-2/ 1 www. candlecharts.com/special/swing-trading-2/ www. candlecharts.com/special/swing-trading-2/ www. candlecharts.com/special/swing-trading-2/ 2 www.
The Harmonic Trader Report Monthly
 The Harmonic Trader Report Monthly December 2017 December 31, 2017 In this report: NASDAQ 100 Index (NQ) Dow Jones Industrial Average Index (YM) German DAX Futures March 2018 (FDAX) Crude Oil December
Weekly outlook for June 12 June
 Weekly outlook for June 12 June 16 2017 TREND DIRECTION S&P 500 Oil Gold Short Term Intermediate-Term Long Term weak buy buy Weak neutral Strong sell buy buy buy Summary The S&P500 index is expected to
This article is taken from the notes of my trading log for a closed and open trade in the platinum
 Time, price and pattern by Robert Miner This article is taken from the notes of my trading log for a closed and open trade in the platinum market. My trading plan is three-dimensional. I look for coincidences
Icoachtrader Consulting Service WELCOME TO. Trading Boot Camp. Day 5
 Icoachtrader Consulting Service www.icoachtrader.weebly.com WELCOME TO Trading Boot Camp Day 5 David Ha Ngo Trading Coach Phone: 1.650.899.1088 Email: icoachtrader@gmail.com The information presented is
Market Update April 20, 2015
 SeattleTA provides investment managers with technical analysis of the equity, fixed-income, commodity, and The forecast for a high on April 15 was spot-on (there s no kill switch on awesome!). The monthly
In addition, a word of advice: when in a Bear market and my Elliot Wave Count suggests either down or a few more subdivisions marginally higher
 WOW, who would have known?! Price went from my upper target zone to my lower (see page 2) in just 11 trading hours: The S&P500 lost ~10p/hour Crazy. Big gap ups one day, followed by a 100p drop the next
Technical Analysis Workshop Series. Session Six 1, 2, 3 Price-Bars Patterns
 Technical Analysis Workshop Series Session Six 1, 2, 3 Price-Bars Patterns DISCLOSURES & DISCLAIMERS This research material has been prepared by NUS Invest. NUS Invest specifically prohibits the redistribution
C y c l e C a n d l e s T r a d i n g W o r k s h o p
 C y c l e C a n d l e s Trading Workshop Risk Disclaimer Trading or investing carries a high level of risk, and is not suitable for all persons. Before deciding to trade or invest you should carefully
Dynamic Trader Daily Report Comprehensive Analysis and Education For the Serious Trader and Investor
 Dynamic Trader Daily Report Comprehensive Analysis and Education For the Serious Trader and Investor Published By Monday, February 07, 2000 Dynamic Traders Group, Inc. DynamicTraders.com dt@dynamictraders.com
Technical Analysis. Weekly Comment. Global. Sell Signal in MSCI World EUR Testing Key Support! Equities Sales Trading Commentary
 h Technical Analysis Weekly Comment Equities Sales Trading Commentary Global Michael Riesner Marc Müller 10/04/2012 michael.riesner@ubs.com marc.mueller@ubs.com +41-44-239 1676 +41-44-239 1789 Sell Signal
DAILY TECHNICAL REPORT MA S-TERM. 27 June, 2012 L-TERM STRATEGY/ POSITION ENTRY LEVEL OBJECTIVES/COMMENTS MULTI-WEEK
 MA S-TERM MULTI-DAY Please note: None of the strategies below represent trading advice or trading recommendations of any kind. Please refer to our full disclaimer. L-TERM OBJECTIVES/COMMENTS STOP MULTI-WEEK
The sideways churn in the major U.S. Stock indexes since late March continues. We have a lot of new members that have
 May 17, 2016 Dear Members, The sideways churn in the major U.S. Stock indexes since late March continues. We have a lot of new members that have recently joined us in the past couple of months. For you
S&P Cash Long Term: Uptrend Intact. Monthly Log Chart
 Andy Dodd MSTA - +44 020 7031 4651 adodd@louiscapital.com Twitter : @louiscaptech S&P Cash Long Term: Uptrend Intact Despite an initial slowdown in momentum following the break above 2120 in July, which
I prefer to use the CCI indicator to trade divergences and it has worked well for me over the past 10 years.
 Make 100 pips Trading Divergences. There are several ways to trade divergences and several indicators that can help you identify the divergence between price and the indicator itself. I prefer to use the
Leavitt Brothers Weekly Sunday, February 28, 2016
 Leavitt Brothers Weekly Sunday, February 28, 2016 Join our email list and get reports just like this send directly to you. http://www.leavittbrothers.com/email-subscribe.cfm Overall the market did well
Bill Adlard s market review
 Bill Adlard s market review DJIA S&P 500 FTSE 100 Gold Cable Euro Brent Crude Sunday 30 th September 2012 To view full screen use Ctrl-L or View/Full Screen Mode from the Menu. Images are clearest at 108%
January 4th, 2018 CURRENCIES USD/CAD AUD/USD USD/CHF. Market Watch
 CURRENCIES USD/CAD I believe that this pair is going to continue to be rather choppy over the next couple of sessions, with the 1.25 level offering a bit of a floor. This is because we get jobs numbers
presented by Thomas Wood MicroQuant SM Divergence Trading Workshop Day One Black Gold
 presented by Thomas Wood MicroQuant SM Divergence Trading Workshop Day One Black Gold Risk Disclaimer Trading or investing carries a high level of risk, and is not suitable for all persons. Before deciding
 1 www.candlecharts.com 2 BONUS www. candlecharts.com/special/swing-trading-2/ 3 www. candlecharts.com/special/swing-trading-2/ 4 www. candlecharts.com/special/swing-trading-2/ 5 www. candlecharts.com/special/swing-trading-2/
Flash Report Silver. follow me October 29 th, Quantitative approach for asymmetric results. Silver: investors on a verge of a nerve crisis
 Flash Report Silver follow me October 29 th, 2014 Francesco Maggioni francesco.maggioni@gmail.com IT +39 393 70 40 234 UK +44 757 681 62 43 Quantitative approach for asymmetric results Silver: investors
Trading EveryDay reserves the right to change this privacy statement at any time. Be sure to check this page periodically for updates.
 This content is provided by The Trading EveryDay Group, LLC. This site, including its contents, is provided "as educational content only" without warranty or guarantee of any kind, either expressed or
Market Commentary. Weekly Technical Roundup. Oct 8, 2018
 Market Commentary Sector Wise Performance Indices Last Traded % Change NIFTY IT 15591.65-2.99 NIFTY BANK 24443.45-10.01 NIFTY REALTY 208.8-21.55 NIFTY INFRA 2845.4-12.30 INDIA VIX 19.7325 42.55 NIFTY ENERGY
DAILY TECHNICAL REPORT MA S-TERM. 16 December, 2011 L-TERM MULTI-WEEK OBJECTIVES/COMMENTS ENTRY LEVEL STRATEGY/ POSITION
 MA S-TERM MULTI-DAY Please note: None of the strategies below represent trading advice or trading recommendations of any kind. Please refer to our full disclaimer. L-TERM MULTI-WEEK STRATEGY/ POSITION
TECHFX TRADERS WEEKLY FX TECHNICAL REPORT
 04 February 2018 TECHFX TRADERS WEEKLY FX TECHNICAL REPORT Contents FX: AUDUSD Medium Term Page 3 AUDUSD Short Term Page 4 AUDUSD VS Interest Rates Page 5 AUDNZD Medium Term Page 6 AUDNZD Short Term Page
Raising Investment Standards TRADING SEMINAR
 Raising Investment Standards TRADING SEMINAR Raising Investment Standards DISCLAIMER Leveraged foreign exchange and options trading carries a significant level of risk, and may not be suitable for all
Trading Lessons from the Intraday Frame (study)
") 1 Daily "Idealized Trades" Report Trading Lessons from the Intraday Frame (study) 1 2018 TheoTrade LLC. All rights reserved. 2 Trading Lessons from the Intraday Frame (1-min) 2 2018 TheoTrade LLC. All
1 Daily "Idealized Trades" Report Trading Lessons from the Intraday Frame (study) 1 2018 TheoTrade LLC. All rights reserved. 2 Trading Lessons from the Intraday Frame (1-min) 2 2018 TheoTrade LLC. All
Trading Lessons from the Intraday Frame (study)
") 1 Daily "Idealized Trades" Report Trading Lessons from the Intraday Frame (study) 1 2018 TheoTrade LLC. All rights reserved. 2 Trading Lessons from the Intraday Frame (1-mi) 2 2018 TheoTrade LLC. All rights
1 Daily "Idealized Trades" Report Trading Lessons from the Intraday Frame (study) 1 2018 TheoTrade LLC. All rights reserved. 2 Trading Lessons from the Intraday Frame (1-mi) 2 2018 TheoTrade LLC. All rights
Figure 1. SPX 60 min & NAS 1-min chart.
 BINGO!? Today we reached the ideal SPX2625 target to the T (SPX2625.76) for wave-a. There s now negative divergence again on the hourly RSI5 and the hourly MACD (see Fig 1), while the daily indicators