FOREX LEARNING BY MADIBA MALEBO
|
|
|
- Lee Osborne
- 6 years ago
- Views:
Transcription
1 FOREX LEARNING BY MADIBA MALEBO
2 INTRODUCTION TO TREND AND ANALYSIS TREND ANALYSIS. PEAKS AND TROUGHS. SPOTTING UPTRENDS. SPOTTING DOWNTRENDS. TAKING ADVANTAGE OF TRENDS. TAKING ADVANTAGE OF DOWNTREND. TAKING ADVANTAGE OF UPTREND. DETERMINING CHANGES IN TRENDS WITHOUT USING INDICATORS
3 TRENDS AND ANALYSIS TREND DEFINITION: A pattern of gradual change in a condition, output, or process, or an average or general tendency of a series of data points to move in a certain direction over time, represented by a line or curve on a graph. An uptrend always has higher highs and higher lows, if there are non of the above then there is no uptrend. A higher high is also know as a peak and a higher low as a trough A downtrend always has lower lows and lower highs, if there are non of the above then there is no uptrend. A lower high is known as a peak and lower low as a trough
4 PEAKS & TROUGHS
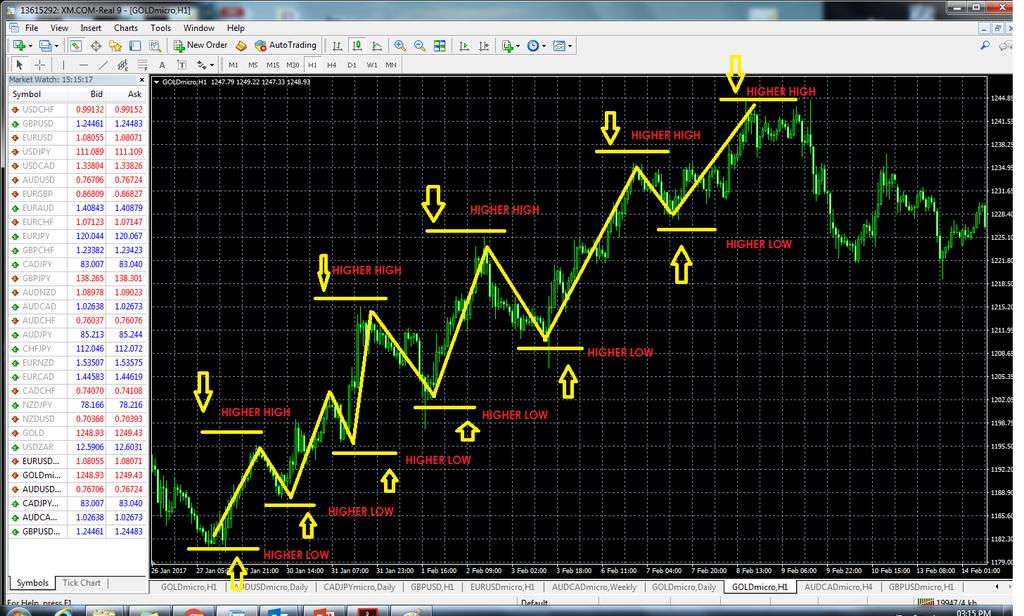
5 UPTREND
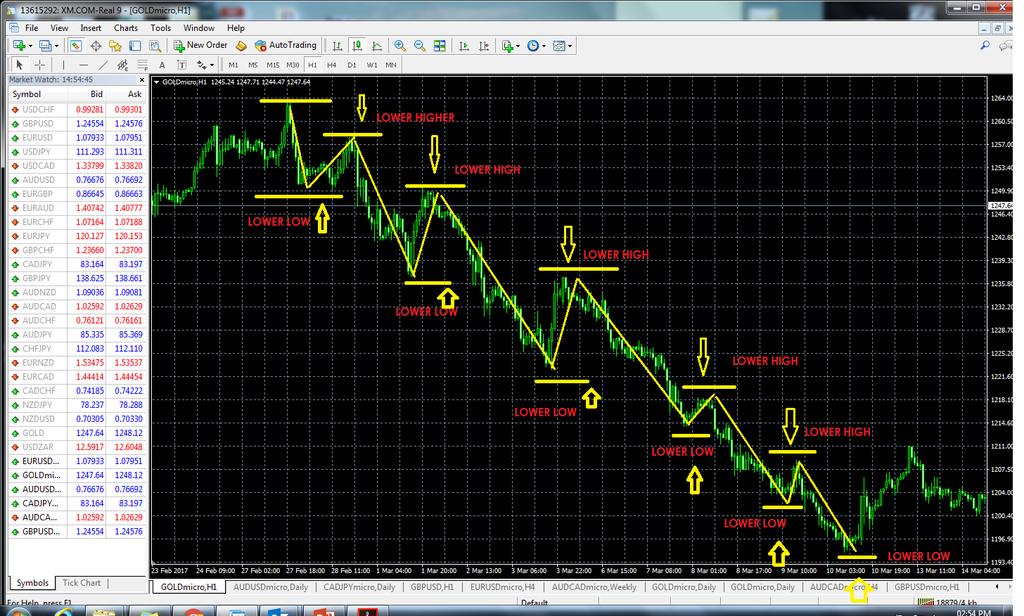
6 DOWNTREND
7 TAKING ADVANTAGE OF TRENDS "Buy low, sell high" is famous investing adage about taking advantage of the market's propensity to overshoot on the downside and upside. Although it is very simple, it is difficult to execute. It is easy to say whether a certain price is low or high in retrospect, but in the moment, it is monumentally difficult. Prices affect the psychology and emotions of market participants. For this reason, "buy low, sell high" can be challenging to implement consistently. By selling highest you get the advantage of selling with a profit even when you have bought also high. By buying real low, you get the profit of not having to sell at a certain margin. You can wait till profit goes really high. There are famous examples of the market being driven to extremes, whether it is high prices during market bubbles or low prices during market panics. These proved to be excellent opportunities to buy low and sell high. However, there have been countless times when the market keeps trending in one direction, punishing those looking to buy low or sell high. What look like high prices one day may look like low prices another day. Traders and investors must have a certain objective method to determine if prices are high or low. Humans are conditioned to follow the crowd. There is inherent difficulty in consistently buying low and selling high. When prices are low, sentiment tends to be overwhelmingly negative towards a stock. Many bullish holders are forced to dump their shares. Similarly, when price is high, it is difficult to conceive of letting go of a winner. "Buy low, sell high" is misleading in some ways, as lows and highs only become clear in retrospect. There is always a bull who considers a stock price to be low and a bear who considers it high. Often, both sides make compelling arguments. The challenge for investors and traders is to determine which stocks are being driven to extremes by fundamentals and which are being driven by emotions. Mean-reversion strategies are more likely to work when price moves are driven by emotions.
8 TAKING ADVANTAGE OF DOWNTRENDS ALWAYS SELL ON LOWER HIGHS
9 TAKING ADVANTAGE OF AN UPTREND ALWAYS BUY ON HIGHER LOWS
10 Determining change in trends without indicators 1. The Highs and Lows Tell the (Whole) Story we re only interested in using the swing highs and lows to identify a possible change in trend. In the chart below, the first higher high was the first sign that the downtrend was beginning to fatigue. But it wasn t until the first higher low that we had a telling indication that the current trend had reversed. Keep in mind that trend changes won t always be this obvious. But the signs are always there; you may just have to look a bit harder to find them in some instances. For that, we need the highs and lows to interact with a key level in a way that offers a favourable setup. In other words, we need to turn the price action you see in the chart above into actionable information. The trend shall only validate when price makes a higher low, our first higher high is just an indication but not a validation.

11 CHANGE IN TREND USING HIGHERS AND LOWS
12 HIGHS & LOWS EXAMPLE
13 Determining change in trends without indicators 2. Distance Between Subsequent Retests: A Killer Way to Determine Trend Strength Now that we have discussed how to use swing highs and lows to gauge the strength of a trend, let s add a key level into the mix. There is a common (and costly) misconception among traders in all markets where technical analysis is a traditional method of trading. Someone at some point in time came up with the notion that support and resistance levels become stronger with each additional retest. I hate to be the bearer of bad news, but that s a complete and utter fallacy. Multiple retests of the same level make that level more visible, they do not make it stronger. And visible and strong are by no means synonymous. Think about it, if this were true that a level became stronger with each additional retest it would theoretically never break. Because if it didn t break on the third retest, why would it break on the sixth when it s supposedly twice as strong? It doesn t add up. So if we can agree that multiple retests of a given level do not make it stronger, we can naturally conclude that it makes the level weaker, right? Well, not quite. While a market that continually revisits the same area can eventually break through, we don t have enough data to conclude that it is likely. For that, we turn to (you guessed it), highs and lows. More specifically, the relationship the highs and lows have with our key level. The illustration below shows a trending market that is respecting a trend line, however, the distance between each retest has become shorter over time. Why does this happen? In short, it s the market telling you that demand is drying up. When it comes to supply and demand, as prices move higher, demand naturally begins to run thin as traders a less willing to buy at higher prices. At the same time, supply increases as market participants unwind their positions to book profits. In the case of the illustrations below, that demand is drying up more quickly with each subsequent rally from trend line support. Thus, we get a market that begins spending more time trying to keep its head above water than making higher highs. Of course, this concept also applies to a bearish trend where demand increases and supply decreases as prices drop.

14 CHANGE IN TREND USING TREND LINE SUPPORT
15 TREND LINE SUPPORT EXAMPLE
16 Determining change in trends without indicators 3. Channel breakouts or Clustering Price Action: An Early Warning Sign Last but not least is when price action clusters near a key level I call this a channel breakout. In some ways, this is a combination of the two techniques we just discussed. It is when a market begins to put constant pressure on a key level over a short period. At any rate, the idea here is to watch how the market responds to support or resistance within a given period. The setup works best in strongly trending markets and occurs where price has consolidated within a clearly defined range sandwiched between both a support and resistance level. Finally price builds up enough energy to breakout of the channel, most often continuing in the direction from which it entered the channel to continue the dominant trend.

17 CHANGE IN TREND USING CHANNELS
18 CHANNEL EXAMPLE
19 CONCLUSION Determining the strength of a trend doesn t need to be a complex operation. Something as simple as the three techniques discussed above are all you need to gauge whether a trend is likely to continue or break down. Keep in mind that all three techniques above are as useful in bearish markets as they are in bullish markets. The charts and patterns above were only used to maintain a consistent theme throughout the lesson, but the techniques discussed above can be utilized in any market and on any time frame. The best thing any trader can do for themselves whether they are attempting to decipher trend strength or identify key levels is to get back to basics. Every market has its story to tell, and every story can be translated using swing highs and lows. As I often say, your job as a trader is not to know what will happen next. Rather, your job is to gather the clues the market leaves behind and assemble them in a way that stacks the odds in your favor; and every possible clue is born from the natural ebb and flow of the market.
20 WEBSITE
Figure 3.6 Swing High
 Swing Highs and Lows A swing high is simply any turning point where rising price changes to falling price. I define a swing high (SH) as a price bar high, preceded by two lower highs (LH) and followed
Naked Trading - Double Top Chart Pattern Strategy
 Naked Trading - Double Top Chart Pattern Strategy If you really want to learn a profitable way to trade then look no further, the Double Top chart pattern strategy uses simple and sound trading principles
TRADING STRATEGY SERIES LEARN HOW TO SPOT OPPORTUNITIES IN VOLATILE MARKETS fpmarkets.com.au
 1 TRADING STRATEGY SERIES LEARN HOW TO SPOT OPPORTUNITIES IN VOLATILE MARKETS This educational material does not constitute financial product advice and does not take into account your investment objectives,
Free signal generator for traders
 Free signal generator for traders Trader s Bulletin Pivot Point Trading Strategy 1. Just download the FREE tool 2. Key in a few numbers 3. And follow the simple techniques by Mark Rose To make money from
Wedge Pattern Breakouts: Explosive Winning Trades
 Wedge Pattern Breakouts: Explosive Winning Trades Prices move in patterns! This is due to one basic investment truism. Human nature exhibits the same habits when it comes to managing investment funds which
Monthly Dairy Technical Commentary Thursday September 5, 2013
 Monthly Dairy Technical Commentary Thursday September 5, 2013 CME Class III Milk Futures The weekly price trend for Class III Milk points down from its August 2011 high, and the latest breakdown below
6 TRADE SETUPS YOU CAN START USING RIGHT NOW. includes: Ryan's top charting patterns
 6 TRADE SETUPS YOU CAN START USING RIGHT NOW includes: Ryan's top charting patterns SharePlanner's Top Setups for TRADING LONG & SHORT Far too often we clutter our trading strategy with hundreds of different
Before we get to all the details, we are going to look at a couple of trades in the first
 CHAPTER 1 Let s Get Started Before we get to all the details, we are going to look at a couple of trades in the first two chapters. From them you will get a good idea where we are heading, and how we are
Tradeciety s Price Action Guide
 Tradeciety s Price Action Guide Welcome... 3 Who am I?... 3 Some impressions from my trading & traveling lifestyle... 4 What Is Price Action?... 6 Candlesticks vs. Chart patterns... 7 Top 3 Candlestick
Compiled by Timon Rossolimos
 Compiled by Timon Rossolimos - 2 - The Seven Best Forex Indicators -All yours! Dear new Forex trader, Everything we do in life, we do for a reason. Why have you taken time out of your day to read this
HOW THE DEAD CAT BOUNCE STOCK TRADING PATTERN WORKS by Michael Swanson
 HOW THE DEAD CAT BOUNCE STOCK TRADING PATTERN WORKS by Michael Swanson Hello my name is Michael Swanson and I m the author of Strategic Stock Trading and The Two Fold Formula, which is a book about the
How to perform accurate market analysis
 How to perform accurate market Roman Sadowski Good market combines the fundamental and the technical. This combination is essential to form a longer-term bias in the market. Good market needs to consider
Schwab Investing Insights Trading Edition Text Close Window Size: November 15, 2007
 Schwab Investing Insights Trading Edition Text Close Window Size: from TheStreet.com November 15, 2007 ON TECHNIQUES Two Indicators Are Better Than One The Relative Strength Index works well but it s better
Risk of Policy Error Clearly Rising Some Key Charts and Index Levels
 Risk of Policy Error Clearly Rising Some Key Charts and Index Levels 4 th March 2018 What a difference a few weeks make. At the end of January, financial markets were melting up, commentators were salivating
Trend Channels: How to Identify Easy Profit-Making Opportunities Using Simple Chart Analysis
 Trend Channels: How to Identify Easy Profit-Making Opportunities Using Simple Chart Analysis Trend channels produce a very powerful trading technique. They are very visible, which makes them easy to utilize
2.0. Learning to Profit from Futures Trading with an Unfair Advantage! Income Generating Strategies Essential Trading Tips & Market Insights
 2.0 Learning to Profit from Futures Trading with an Unfair Advantage! Income Generating Strategies Essential Trading Tips & Market Insights Income Generating Strategies Essential Trading Tips & Market
Commodity Chart Book
 Commodity Chart Book Cents / Bushel 920-0 Corn CORN - CBOT MONTHLY SELECTED FUTURES Chart Chart High: 843.75 on 08/10/2012 Chart Low 142.00 on 02/17/1987 Chart Low: 142.00 on 02/17/1987 Cents / Bushel
CHARTS. Bar Line Candlestick Charts are the basis of technical analysis They are a graphic display of price action. Notes:
 TECHNICAL ANALYSIS CHARTS Bar Line Candlestick Charts are the basis of technical analysis They are a graphic display of price action Candlestick charts have become the industry standard for technical traders.
Divergence and Momentum Trading
 presented by Thomas Wood MicroQuant SM Divergence Trading Workshop Day One Divergence and Momentum Trading Risk Disclaimer Trading or investing carries a high level of risk, and is not suitable for all
Resistance to support
 1 2 2.3.3.1 Resistance to support In this example price is clearly consolidated and we can expect a breakout at some time in the future. This breakout could be short or it could be long. 3 2.3.3.1 Resistance
Weekly Market Summary
 Weekly Market Summary August 18, 2015 by Urban Carmel of The Fat Pitch US equities had two opportunities to kick off a rally this week. Neither had much follow through. On Monday, positive breadth was
THE CYCLE TRADING PATTERN MANUAL
 TIMING IS EVERYTHING And the use of time cycles can greatly improve the accuracy and success of your trading and/or system. THE CYCLE TRADING PATTERN MANUAL By Walter Bressert There is no magic oscillator
1. Introduction 2. Chart Basics 3. Trend Lines 4. Indicators 5. Putting It All Together
 Technical Analysis: A Beginners Guide 1. Introduction 2. Chart Basics 3. Trend Lines 4. Indicators 5. Putting It All Together Disclaimer: Neither these presentations, nor anything on Twitter, Cryptoscores.org,
INTERMEDIATE EDUCATION GUIDE
 INTERMEDIATE EDUCATION GUIDE CONTENTS Key Chart Patterns That Every Trader Needs To Know Continution Patterns Reversal Patterns Statistical Indicators Support And Resistance Fibonacci Retracement Moving
The Synthetic Futures Position. Goal
 The Synthetic Futures Position Goal To try to profit from a trending market using an option strategy that allows entry at a reduced cost while offering the same potential for unlimited profit (and loss)
Trading Patterns For Stocks And Commodities
 Trading Patterns For Stocks And Commodities It doesn t matter if you are a long-term investor, short swing trader or day trader, you are always looking for an advantageous spot to enter your position.
Chapter 3.3. Trading Psychology
 1 Chapter 3.3 Trading Psychology 0 TRADING PSYCHOLOGY Forex traders have to not only compete with other traders in the forex market but also with themselves. Oftentimes as a Forex trader, you will be your
Bollinger Bands Forex Trading Strategy With 20 Period Moving Average
 Bollinger Bands Forex Trading Strategy With 20 Period Moving Average The bollinger bands forex trading strategy with 20 period moving average is a very simple forex strategy that works very well for all
Forex Seasonal Patterns:
 Forex Seasonal Patterns: The seasonal patterns of the EUR/USD, GBP/USD, USD/JPY, AUD/USD, USD/CAD and Dollar Index ~By Cory Mitchell, CMT~ Use seasonality to discover when forex pairs typically rally and
PART 3 - CHART PATTERNS & TECHNICAL INDICATORS
 Tyler Chianelli s EASYOPTIONTRADING by OPTION TRADING COACH PART 3 - CHART PATTERNS & TECHNICAL INDICATORS A SIMPLE SYSTEM FOR TRADING OPTIONS WORKS IN UP, DOWN, AND SIDEWAYS MARKETS PART 3.1 - PRIMARY
FX Trend Radar Manual
 C O D I N G T R A D E R. C O M FX Trend Radar Manual Version 1.00 Table of Contents FX Trend Radar... 1 What is FX Trend Radar?... 1 Installation... 2 Configurations... 9 How to use FX Trend Radar... 11
GOLDEN RULES FOR FUTURES TRADERS
 A Simple Guide to GOLDEN RULES FOR FUTURES TRADERS How to potentially improve your trading and get the results you really want Table of Contents 1. Adopt a definite trading plan. 2. If you're not sure,
US Dollar Struggles as Euro Gains Top Spot - A review of the Major Global Currencies
 US Dollar Struggles as Euro Gains Top Spot - A review of the Major Global Currencies 26 th November 2017 My colleagues have been urging me to write a weekly commentary on Bitcoin/Cryptocurrencies. However,
Tracking the Daily Market Averages
 Tracking the Daily Market Averages Your Most Important and Profitable Investing Skill Tracking the market s direction is a powerful key to successful investing. If you trade in sync with the market, take
The Gann Analysis Rule Book
 2006 Gann Managament Ltd. All Rights Reserved. Gann Management Limited is authorised and Regulated by the Financial Services Authority The Gann Analysis Rule Book A Man Who Never Changes His Mind Will
Erlanger Squeeze Play - Squeezeometer. Erlanger Squeeze Play
 Page 1 of 5 Indicator Focus: Squeezeometer by Phil Erlanger Erlanger Squeeze Play A core function of our research centers on the concept of advance phases and decline phases. Whether we're in a bull or
For Valued Subscribers Only..
 HIGH PROBABILITY FOREX PRICE PATTERNS For Valued Subscribers Only.. ( Profitable Forex Price Patterns Which Are Simple To Use & Proven To Deliver High Probability Results Even For Complete Newbies Starting
Thinking it s either going to Up or down on the price chart A supply zone or a demand zone
 1 Good peace, joy day.healing on moment at a time. We had a thought. We have all heard of a market. We have all heard of the stock market. All of a sudden when we say that, us humans say wow, that s about
Three Techniques for Spotting Market Twists and Turns. Riding the Roller
 Three Techniques for Spotting Market Twists and Turns Riding the Roller Coaster Learn to Spot the Twists and Turns Whether you re new to forex or you ve been trading a while, you know how the unexpected
The Master Trader Counter-Trend Trade Set-Ups
 The Master Trader Counter-Trend Trade Set-Ups Trading Concepts, Inc. The Master Trader Counter-Trend Trade Set-Ups By Todd Mitchell Copyright 2014 by Trading Concepts, Inc. All Rights Reserved This training
Technical Analysis for Options Trading. Fidelity Brokerage Services LLC, Member NYSE, SIPC, 900 Salem Street, Smithfield, RI
 Technical Analysis for Options Trading Fidelity Brokerage Services LLC, Member NYSE, SIPC, 900 Salem Street, Smithfield, RI 02917 747561.2.0 Disclosures Options trading entails significant risk and is
Test Your Chapter 1 Knowledge
 Self-Test Answers Test Your Chapter 1 Knowledge 1. Which is the preferred chart type in LOCKIT? The preferred chart type in LOCKIT is the candle chart because candle patterns are part of the decision-making
But putting it all together in a consistent manner will take effort, drive, and success will only come to those who put in the work.
 Introduction Trading is hard. The act of trading is simple. But putting it all together in a consistent manner will take effort, drive, and success will only come to those who put in the work. Methods
Seven Trading Mistakes to Say Goodbye To. By Mark Kelly KNISPO Solutions Inc.
 Seven Trading Mistakes to Say Goodbye To By Mark Kelly KNISPO Solutions Inc. www.knispo.com Bob Proctor asks people this question - What do you want, what do you really want? In regards to stock trading,
Many students of the Wyckoff method do not associate Wyckoff analysis with futures trading. A Wyckoff Approach To Futures
 A Wyckoff Approach To Futures by Craig F. Schroeder The Wyckoff approach, which has been a standard for decades, is as valid for futures as it is for stocks, but even students of the technique appear to
Forex Advantage Blueprint
 Forex Advantage Blueprint Complimentary Report!! www.forexadvantageblueprint.com Copyright Protected www.forexadvantageblueprint.com - 1 - Limits of liability/disclaimer of Warranty The author and publishers
Trading Guidelines. Why guidelines and not rules? Because there are no rules.
 Trading Guidelines Why guidelines and not rules? Because there are no rules. 1. Everything that you see is in a gray fog. Nothing is perfectly clear. Close is close enough. If something looks like a reliable
This is the complete: Fibonacci Golden Zone Strategy Guide
 This is the complete: Fibonacci Golden Zone Strategy Guide In this strategy report, we are going to share with you a simple Fibonacci Trading Strategy that uses the golden ratio which is a special mathematical
THE TREND RIDING STRATEGY
 THE TREND RIDING STRATEGY IMPORTANT : As an added bonus for downloading this report, you also received additional free training videos. To access your bonuses, go to: http://www.sublimeforexchampions.com/
PROFITING WITH FOREX: BONUS REPORT
 PROFITING WITH FOREX: BONUS REPORT PROFITING WITH FOREX: The Most Effective Tools and Techniques for Trading Currencies BIG PROFITS COME FROM LETTING YOUR WINNERS RUN S. Wade Hansen Two axioms pervade
PRICE ACTION TRADING COURSE
 PRICE ACTION TRADING COURSE forextradingstrategies4u.com P a g e 1 If you want to learn about Price Action Trading, then this forex price action trading course will really help you. There's a lot of practical
INVESTMENT WISDOM IN A NUTSHELL:
 INVESTMENT WISDOM IN A NUTSHELL: Here are some important investment techniques in a simple question-and-answer format, for those who may be first-time investors getting their feet wet, and to improve the
Balance Of Market Power. Who s The Boss? Stocks & Commodities V. 19:8 (18-32): Balance Of Power by Igor Livshin INDICATORS
: Balance Of Power by Igor Livshin INDICATORS") INDICATORS Who s The Boss? MIKE YAPPS Balance Of Market Power Who s in charge, bulls or bears? It doesn t take higher-order math to get a good reading. T by Igor Livshin he balance of market power (BMP)
INDICATORS Who s The Boss? MIKE YAPPS Balance Of Market Power Who s in charge, bulls or bears? It doesn t take higher-order math to get a good reading. T by Igor Livshin he balance of market power (BMP)
Rules for Drawing and Analyzing Trendlines
 Reprinted with permission from the American Association of Individual Investors, 625 N. Michigan Ave., Chicago, IL 60611; 800-428-2244; www.aaii.com. 2017. Rules for Drawing and Analyzing Trendlines By
How To Spot Contrarian Trading Opportunities Using Sentiment Analysis
 How To Spot Contrarian Trading Opportunities Using Sentiment Analysis oandamt4.com Forex Indices Commodities Precious Metals Bonds How to spot contrarian trading opportunities using sentiment analysis
 Jack Schwager s Planned Trading Approach 1.Define your trading philosophy or system 2. Choose your markets to be traded 3. Specify your risk parameters A. Minimum risk per trade B. Stop loss strategy C.
Convergence and Divergence
 Convergence and Divergence Momentum: The Verge of Success Momentum plays a key role in trend analysis. Trends are composed of a series of price swings. It is a trader s edge to know when a trend is slowing
Advanced Trading Systems Collection. 10/21/50 EMA Forex SCALPING SYSTEM
 10/21/50 EMA Forex SCALPING SYSTEM 1 This is a fairly simple method to squeeze money out of the market with short terms trades. With this one we trade the five minute charts, and we rarely hold a trade
The law of Supply and Demand
 The law of Supply and Demand I have been trading for more than 25 years. What I have discovered in that time span is one of the best and most actuate tools in trading is the relationship between price
How to Build your Trading Watchlist Table of Contents
 Table of Contents Risk Warning... 1 We ve All Been There... 2 Why Do you Need a watchlist?... 2 Starting Where you Have an Edge!... 2 Find the Dominant Psychology in a Pair... 3 Understanding Directional
Trading the Hidden Divergence. Presented by Sunil Mangwani
 Trading the Hidden Divergence Indicators in technical analysis. Indicators along with chart patterns, trend lines, resistance / support levels etc., are an essential part of technical analysis. But there
Methodology. Our team of analysts uses technical and chartist analysis to draw an opinion and make decisions. The preferred chartist elements are:
 Methodology Technical analysis is at the heart of TRADING CENTRAL's expertise. Our methodology is proven. Our chartist and quantitative approach allows us to intervene on different investment horizons.
Maybe you can see through my eyes well, maybe I can try to show you what I see through my eyes.
 Tips for Traders 12/8/2008 11:07:00 AM Seeing Through the Eyes of a Professional Trader I have been a professional trader now for more than 37 years. I think I have seen just about everything there is
Climb to Profits WITH AN OPTIONS LADDER
 Climb to Profits WITH AN OPTIONS LADDER We believe what matters most is the level of income your portfolio produces... Lattco uses many different factors and criteria to analyze, filter, and identify stocks
Chapter 1.4 Trends 0
 Chapter 1.4 Trends 0 TECHNICAL ANALYSIS: TRENDS, SUPPORT AND RESISTANCE Charts, charts, charts. When most people think about trading Forex, they think about watching price movements flash by them on the
BUY SELL PRO. Improve Profitability & Reduce Risk with BUY SELL Pro. Ultimate BUY SELL Indicator for All Time Frames
 BUY SELL PRO Improve Profitability & Reduce Risk with BUY SELL Pro Ultimate BUY SELL Indicator for All Time Frames Risk Disclosure DISCLAIMER: Crypto, futures, stocks and options trading involves substantial
Technicals & Time Frame
 Advanced Charting Neither Better Trades or any of its personnel are registered broker-dealers or investment advisers. I will mention that I consider certain securities or positions to be good candidates
Tommy s Revenge 2.0 Module 2 Part 2
 1 Mark Deaton here with your follow-up to Module 2. Going to cover a few things in this video and try to keep it short and sweet. We re going to look at Stock Fetcher and how we can use Stock Fetcher to
Content. A Note from Chris 3 Introduction 4 Overview 6
 1 Content A Note from Chris 3 Introduction 4 Overview 6 Solitary Candlesticks 7 Momentum 10 When Momentum Is Lost 17 Long Shadows 19 Rejection 20 Reverse Rejection 22 Summary 25 Relative Candlesticks 26
10.2 TMA SLOPE INDICATOR 1.4
 10.2 TMA SLOPE INDICATOR 1.4 Unfortunately, you cannot use TMA or any of its derivatives before some poster is going to yell, REPAINT, REPAINT, REPAINT It is like if you can say those words and you will
Candlestick Forum Boot Camp. High Profit Patterns. Why is it important to know the patterns? Eliminates emotions
 Candlestick Forum Boot Camp High Profit Patterns Why is it important to know the patterns? Eliminates emotions 1 Advanced Candlestick Patterns Fry Pan Bottom Dumpling Top Cradle Pattern Jay-Hook Scoop
Class 7: Moving Averages & Indicators. Quick Review
 Today s Class Moving Averages Class 7: Moving Averages & Indicators 3 Key Ways to use Moving Averages Intro To Indicators 2 Indicators Strength of Lines Quick Review Great for establishing point of Support
SUPPLEMENTARY LESSON 1 DISCOVER HOW THE WORLD REALLY WORKS ASX Schools Sharemarket Game THE ASX CHARTS
 SUPPLEMENTARY LESSON 1 THE ASX CHARTS DISCOVER HOW THE WORLD REALLY WORKS 2015 ASX Schools Sharemarket Game The ASX charts When you spend time discovering a company s story and looking at company numbers
Data-Driven Trading. Market Adaptation. Stocks & Commodities V. 29:12 (34-39): Data-Driven Trading by Steve Palmquist
: Data-Driven Trading by Steve Palmquist") be up by the end of the year, and about a quarter thought the market would be down. The second question was, How many of you do not care whether the market is up or down by the end of the year? In the
be up by the end of the year, and about a quarter thought the market would be down. The second question was, How many of you do not care whether the market is up or down by the end of the year? In the
The objective of Part One is to provide a knowledge base for learning about the key
 PART ONE Key Option Elements The objective of Part One is to provide a knowledge base for learning about the key elements of forex options. This includes a description of plain vanilla options and how
Attributes that will make me a better trader.
 Attributes that will make me a better trader. To always be prepared and be patient and thoughtful in review. Ability to operate in all conditions according to a plan. Acknowledge my emotions and not let
The Dollar is on the cusp of an important move - time to sit up and pay attention
 The Dollar is on the cusp of an important move - time to sit up and pay attention 22 nd April 2018 For weeks, we have been pretty neutral on the Dollar in a broad sense. We think this is about to change,
Introduction to the Gann Analysis Techniques
 Introduction to the Gann Analysis Techniques A Member of the Investment Data Services group of companies Bank House Chambers 44 Stockport Road Romiley Stockport SK6 3AG Telephone: 0161 285 4488 Fax: 0161
3 Price Action Signals to Compliment ANY Approach to ANY Market
 3 Price Action Signals to Compliment ANY Approach to ANY Market Introduction: It is important to start this report by being clear that these signals and tactics for using Price Action are meant to compliment
Trading Market Cycles. Adam Grimes Waverly Advisors, CIO
 Trading Market Cycles Adam Grimes Waverly Advisors, CIO Market Cycles The Wyckoff Cycle Behavioral and Psychological Cycles Cycles in prices Cycles in volatility Cycles in equilibrium/disequilibrium The
Swing Trading SMALL, MID & L ARGE CAPS STOCKS & OPTIONS
 Swing Trading SMALL, MID & L ARGE CAPS STOCKS & OPTIONS Warrior Trading I m a full time trader and help run a live trading room where we trade in real time and teach people how to trade stocks. My primary
The 8 biggest mistakes investors make
 The 8 biggest mistakes investors make Dario Michalek Vision Capital Management We are confident that the information that follows can provide compelling reasons to look hard at your investments and propel
How I Trade Profitably Every Single Month without Fail
 How I Trade Profitably Every Single Month without Fail First of all, let me take some time to introduce myself to you. I am Koon Hwee (KH Lee) and I am a full time currency trader. I have a passion for
TRADING ADDICTS. Lesson 3: Timing and Technical Indicators. Timing the Market. Copyright 2010, Trading Addicts, LLC. All Rights Reserved
 Lesson 3: Timing and Technical Indicators In this chapter, we will be focusing on the timing of the trade, from each individual angle. Timing plays a critical role in a Covered Call strategy, as it can
The AB=CD Secret Pattern
 The AB=CD Secret Pattern Author: Sundeep Bilkhu www.fibonacciprofits.com Published By: Instant Marketplace Ltd Copyright 2006 www.fibonacciprofits.com All rights reserved www.fibonacciprofits.com is owned
Is This Type of Stock Market For You? - Mike Swanson
 Stock Market Barometer Quote of the month: Investors should recognize that Euroland s problems are global and secular in nature; it will be years before Euroland and developed nations in total can constructively
Lighting the Way: Using Candlestick Patterns. The Art & Science of Active Trend Trading
 Lighting the Way: Using Candlestick Patterns The Art & Science of Active Trend Trading Disclaimer U.S. Government Required Disclaimer Commodity Futures Trading Commission Futures and Options trading has
Supercharge your trading strategy with sentiment analysis
 Supercharge your trading strategy oandamt4.com Forex Indices Commodities Precious Metals Bonds One reason many traders struggle is the lack of clear guidelines that assist in decision making. Frequent
In the book Candlesticks, Fibonacci,
 TRADING Strategies T h e THREE RISING VA L L E Y S p a t t e r n A series of three lows with specific characteristics marks bullish trend changes. Find out how the pattern has performed in the past and
10-Year Treasury Notes ($UST Price)
") 1 Weekly Inter-market Technical Report 10-Year Treasury Notes ($UST Price) Monthly Continuing from last week's report, bonds (notes) appear to be on a strong buy signal on the monthly chart, as price is
1 Weekly Inter-market Technical Report 10-Year Treasury Notes ($UST Price) Monthly Continuing from last week's report, bonds (notes) appear to be on a strong buy signal on the monthly chart, as price is
SPX for the smaller major-4 triangle or SPX to complete the double zigzag. Figure 1.
 Today s break -finally- below SPX2625 (and SPX2613) places the Ball now firmly in the Bears camp, albeit today s strong rally off the lows. And the two main bear counts remain the focus for now: SPX2579-2568
Stay on the Right Side & Finishing the Year Strong! From the Active Trend Trader
 Stay on the Right Side & Finishing the Year Strong! From the Active Trend Trader Disclaimer U.S. GOVERNMENT REQUIRED DISCLAIMER COMMODITY FUTURES TRADING COMMISSION FUTURES AND OPTIONS TRADING HAS LARGE
Short Selling Stocks For Large And Fast Profits. By Jack Carter
 Short Selling Stocks For Large And Fast Profits By Jack Carter 2017 Disclaimer: No financial advice is given or implied. Publisher is not registered investment advisor or stockbroker. Information provided
Naked Trading and Price Action
 presented by Thomas Wood MicroQuant SM Divergence Trading Workshop Day One Naked Trading and Price Action Risk Disclaimer Trading or investing carries a high level of risk, and is not suitable for all
Now You Can Have These Trading Gems- Free!
 Presents Killer Patterns Now You Can Have These Trading Gems- Free! The Trading Info Revealed Here is not the Same as the Proven WizardTrader.com Methods But Works Well With Them 1 Copyright Information
4.25 ¾ 4.19 FG March 2018 Wheat ¾ Pivotal new Contract Low 4.02 ½ 5 day chart. Down from last week same day Daily chart... Down Weekly
 s 9:50 pm Chicago time 12/11/17 December 12, 2017 March 2018 Corn 3.56 3.52 ¾ FG --------------3.48 ¼ Pivotal new Contract Low 3.43 ¾ 5 day chart. Down from last week same day Daily chart. Down Weekly