Nampak 2013 Interim Results
|
|
|
- Julian Butler
- 6 years ago
- Views:
Transcription

1 Nampak 2013 Interim Results May
2 Agenda Salient features Group results Operational review Strategic update Outlook 2
3 Salient Features Revenue up 7%, Africa up 19% Trading profit up 6% Profits from Africa Up 39% 21% of Group 28% if exports included Africa growth strategy gaining momentum SA trading profits lower Upfront price reductions to secure long-term contracts HEPS up 3% ROE 24% Dividend up 4% to 42 cents per share 3
4 Group Results May
5 Group Income Statement Rm % Revenue Operating profit Net finance costs Income from investments/profit from assoc Profit before tax Taxation Profit for the period HEPS 108.8c 106.0c 3 5
6 Operating and Trading Profit Rm 2013 TRADING PROFIT 951 Abnormal items 107 Retrenchment and restructuring 4 Gain on revaluation of joint venture 23 Gain on reconsolidation of Zimbabwe 88 OPERATING PROFIT
7 Tax Rate Rm 2013 Profit before tax 980 Tax 201 Effective tax rate 20.5% Capital items 4.5% Government incentive 1.4% Other 1.6% Standard tax rate 28.0% 7


8 cents Headline Earnings per Share
9 cents Dividends per Share
10 Abridged Balance Sheet Rm Non-current assets Bank balances, deposits and cash Current assets TOTAL ASSETS Total equity Loans and borrowings Retirement benefit obligations Other non-current liabilities Current liabilities TOTAL EQUITY AND LIABILITIES
11 Group Condensed Cash Flow Rm Cash generated from operations before working capital Working capital changes 720 Cash generated from operations 608 Net interest paid 106 Tax paid 165 Dividends paid 528 Capex 631 Acquisition of businesses 110 Other 84 Cash outflow before financing activities 848 Net borrowings raised 823 Net cash outflow 25 11
12 Working Capital Movement Rm Inventories 41 Receivables 204 Payables 557 Total increase in working capital
13 Capex Rm Aluminium conversion 325 Diaper expansion 47 6 th Aerosol can line 30 Clover Clayville in-plant Other projects 206 TOTAL CAPEX


14 Net Debt Rm ,000-1,500-2,000-2,500-3,000 Sep-09 Sep-10 Sep-11 Sep-12 Mar-13 14


15 Net Debt : Equity 60% 50% 40% 30% 20% 10% 0% Sep-09 Sep-10 Sep-11 Sep-12 Mar-13 15


16 Key Ratios RONA % ROE % Interest Cover X Net debt:ebitda X
17 17 Operational Review


18 Geographical Revenue 9% 10% 22% 69% South Africa Africa + exports UK 23% 67%
19 Rm 800 Trading Profit and Margin % % % 13.7% 7.6% 7.7% South Africa Rest of Africa UK Note: exports profits included in South Africa
20 Rm % Trading Profit and Margin 9.3% excluding price reductions for long-term contracts % % 13.7% 7.6% 7.7% South Africa Rest of Africa UK Note: exports profits included in South Africa
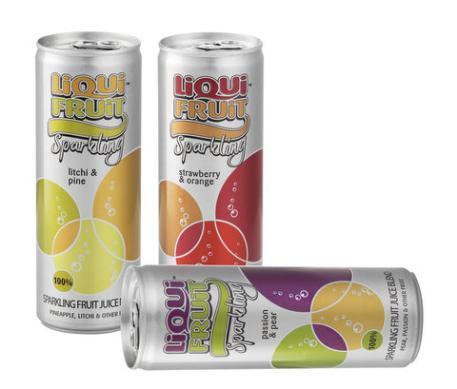
21 Rm 3,500 3,000 2,500 2,000 1,500 1, Revenue South Africa: Metals & Glass Good demand for beverage cans but lower average selling prices as a consequence of securing long-term contracts Fish can sales up but fruit and vegetables, aerosol and paint lower DivFood margins impacted by expensive mix of imported and local tinplate Lower demand for glass bottles and reduced prices to secure long-term contracts Rm Trading Profit/Margin 14.2% 14.2% 11.0% 21
22 South Africa: Plastics Rm 1,500 1,250 1,000 Revenue Rm Trading Profit/Margin % 13.3% Demand for milk and juice bottles flat Weak domestic demand for sorghum beer cartons Sorghum beer carton exports to Botswana affected by new legislation Good demand for CSD PET closures Reduced sales of drums moderate demand for crates 22

23 South Africa: Paper & Flexibles Rm 2,500 Revenue Rm 100 Trading Profit/Margin 2,000 1,500 1, % % Strong demand for agricultural boxes Commercial sector demand under pressure Flexible packaging affected by weak consumer demand Cartons and labels impacted by integration costs and weak demand Sacks impacted by subdued infrastructure spend and lower exports 23

24 South Africa: Tissue Rm Revenue Rm Trading Profit/Margin 1, % 5.3% Moderate growth in volumes of toilet tissue Diaper volumes lower and margins under pressure Highly competitive market 24

25 Rest of Africa: Metals & Glass Rm Revenue Rm Trading Profit/Margin % % Continued high demand for beverage cans in Angola Higher sales of pineapple cans in Kenya 25

26 Rest of Africa: Paper & Flexibles Rm 500 Revenue Rm 100 Trading Profit/Margin % 22.0% Customer destocking affected cigarette carton sales in Nigeria Zambia continued to perform well Recovery by Malawi Zimbabwe satisfactory 26

27 United Kingdom: Plastics Rm 1,000 Revenue Rm 75 Trading Profit/Margin % 7.7% Sales in s in line with last year Rand translation benefit Infini lightweight-bottle increased market penetration Market leader in the use of recycled HDPE 27
28 Summary of Results HEPS up 3% EPS up 19% Operating profit up 13% Africa profit up 39% EBITDA R1.4 billion ROE 24% Dividend up 4% 28
29 29 Strategic Update Rest of Africa Beverage cans Glass
30 Nampak in the Rest of Africa 12 countries Revenue +/- R2.5bn pa Trading margin >15% 30


31 Rest of Africa Rm Trading Profit : 6 months

32 Angola and Mozambique New production facility/warehouse for various expansion projects 2 nd can line Expansion of product range Flexibles Closures Food cans Rigid Plastics Plastics acquisition 32

 Rigid plastics, closures, crates and sorghum")
33 West Africa Nigeria New beverage can manufacture Glass facility New metal lines in existing operation Aerosols, paint cans, plate lacquering Rigid plastics and closures Sorghum beer cartons Ghana (seeking acquisition) Rigid plastics, closures, crates and sorghum beer cartons 33
 Paper sacks facility Tanzania Metal drums")
 (2013)")
34 East Africa Kenya Closures manufacture for CSD and water ROPP closures line (2013) Paper sacks facility Tanzania Metal drums (2013) Sorghum beer cartons in Uganda and Tanzania (2013) Ethiopia Acquisition in Ethiopia (currently 25% equity) (2013) Crates (2013) 34

35 35 New Drum Line in Tanzania
36 36 Crates in Ethiopia

 New S/O bag")


 New")
37 Southern Africa Zambia Liquid carton printer (2013) PET jar line (2013) New S/O bag line for sugar (2013) Zimbabwe Consolidation of businesses into one company Additional rigid plastics capacity (2013) New crown line (2013) 37

38 Sorghum Beer Cartons & Fillers 2013 Ghana X Nigeria X Uganda X Mozambique Tanzania Kenya X X X 38 38
39 Nampak Products Manufactured in Rest of Africa Country Bev cans Food & other cans/ drum Crown Carton & Paper Labels Corr Sack Liquid Carton Plastic Bottles & Jars Closure Crate Glass Flex Angola X X X X X Botswana X Kenya X X X X(fill) X X Malawi X X X Moz X Namibia X Nigeria X X X X(fill) X X X Swaziland X Tanzania X X X(fill) Zambia X X X X X X X X Zimbabwe X X X X X X(fill) X X X Ghana Uganda X (fill) X (fill) Ethiopia X X X Existing : Proposed: X X 39
40 Funding for Expansion $175 million raised in the United States Private Placement market Tenure of loan ranges between 7 and 10 years Fixed at extremely competitive rates Proceeds will be used the fund African expansion strategy 40
41 Rest of Africa Revenue Rm 2013 (March) 2012 (March) Growth Manufacturing Operations % Exports (4%) TOTAL % % of Group revenue 21.1% 20.5% 41
42 Rest of Africa Trading Profit Rm 2013 (March) 2012 (March) Growth Manufacturing Operations % Exports (19%) TOTAL % % of Group trading profit 27.7% 25.1% 42
 Source: published results")
43 Rest of Africa vs Listed Competitors Rm Trading Profit (last 6 months) Mpact Nampak Rest of Africa Transpaco Bowler Metcalf Astrapak Winhold (Gundle) Source: published results 43
44 44 Beverage Cans

45 Rm % Trading Profit and Margin 9.3% excluding price reductions for long-term contracts % % 13.7% 7.6% 7.7% South Africa Rest of Africa UK Note: exports profits included in South Africa
46 Long-term Contracts Short-term pain for long-term gain Why we ve sacrificed margin short-term to secure long-term supply contacts and guaranteed volumes in beverage cans and glass 46
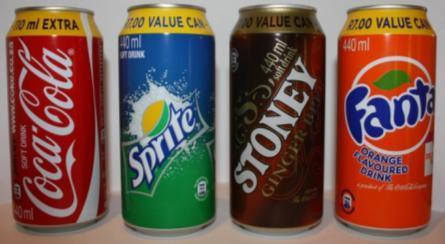
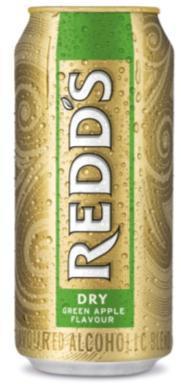
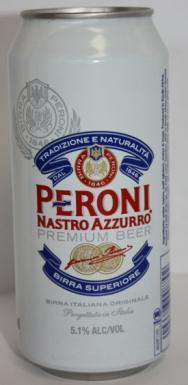
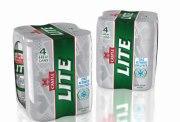
47 Beverage Cans South Africa Volumes Consumer perceptions of cans Major customer support/conversion to cans Long-term supply contracts Angola Nigeria 47
48 Beverage Cans South Africa Volumes Consumer perceptions of cans Major customer support/conversion to cans Long-term supply contracts Angola Nigeria 48


49 index 170 Growth - Alcoholic Drinks May 2011 Aug 2011 Nov 2012 Feb 2012 May 2012 Aug 2012 Nov 2013 Feb 49


50 index 130 Growth - Speciality Cans May 2011 Aug 2011 Nov 2012 Feb 2012 May 2012 Aug 2012 Nov 2013 Feb 50

51 Growth Value Packs 440 ml index May 2011 Aug 2011 Nov 2012 Feb 2012 May 2012 Aug 2012 Nov 2013 Feb 51
52 Beverage Cans South Africa Volumes Consumer perceptions of cans Major customer support/conversion to cans Long-term supply contracts Angola Nigeria 52

53 Outlet Research Summary Outlet Research Summary Feedback from 536 owners and managers of outlets LSM 7+


54 Outlet Research - Campaign Response


55 Mogale City Beerfest April 2013


56 The CAN is king in Soweto! (Beerfest 2012)
57 Beverage Cans South Africa Volumes Consumer perceptions of cans Major customer support/conversion to cans Long-term supply contracts Angola Nigeria 57
58 Recent Can Filling Line Investments (SA) Upgrades approximately R100m New installations 8 Can lines Currently in progress 2 high speed lines


59 SAB: ATL spend on TV and billboards

60 60 Heineken Can Outdoor Advertising

61 Savanna Can Launch The underlining thought is that you can Go more places with the Savanna can. This is being brought to life by playing in the functional benefit space i.e. Benefits of it being more portable, less breakable, chills faster, stays chilled for longer, sealed in freshness, can pack more cans in a cooler, can open it immediately i.e. instant refreshment... Hence, Savanna is now more CONVENIENT... in a CAN. In Store: 01 May
62 Beverage Cans South Africa Volumes Consumer perceptions of cans Major customer support/conversion to cans Long-term supply contracts Angola Nigeria 62
63 Long-term Contracts Short-term pain for long-term gain Why we ve sacrificed margin short-term to secure long-term supply contacts and guaranteed volumes in beverage cans and glass 63
64 Beverage Cans South Africa Volumes Consumer perceptions of cans Major customer support/conversion to cans Long-term supply contracts Angola Nigeria 64

65 Angola Existing line almost at full capacity 2 nd line decision pending 65
66 Beverage Cans South Africa Volumes Consumer perceptions of cans Major customer support/conversion to cans Long-term supply contracts Angola Nigeria 66

67 Nigeria Investigations ongoing 67


68
69 Overall Outlook for Beverage Cans Beverage can outlook in South Africa, Angola and Nigeria very promising 69
70 70 Glass


71 3 rd Furnace Investment of almost R1 billion Improved flexibility colour mix Cost savings Additional capacity +/ tpa Contracts secured for most of output Commissioning expected mid
72 Nampak Glass Year prior to rebuild 2010 Year Total market volumes tonnes Consol Nampak 72
73 Nampak Glass Rebuild Year 2011/12 Supply Year Total market volumes tonnes Consol Nampak 73
74 Nampak Glass Recovery Period 2012/13 Project Recovery Consol Total market volumes tonnes Nampak forecast contract Nampak forecast supply Required upfront price sacrifice to secure long term contracts and a commitment to a 3 rd furnace Investment with consequent savings 74

75 Future 3 rd furnace volume contracts 2014 onwards Nampak Glass Consol Total market volumes tonnes Nampak contracted Nampak supply 75

76 Nampak Glass 1,000,000 Total market t Total market t Total market t Total market t 750, ,000 Consol Nampak 250, / / / /onward 76 Front loading of benefits to secure contracts and volume for 3 rd furnace
77 Nampak Glass New contracts secured Majority of 3 rd furnace capacity loaded New furnace adds many benefits Commissioning of 3 rd furnace postponed to mid
78 78 Conclusion and Outlook
79 Conclusion Rest of Africa growth strategy delivering results Major opportunities in rest of Africa being explored Growth in beverage cans in South Africa Long-term contracts and volumes for beverage cans and glass secured UK Plastics steady 79
80 Outlook Rest of Africa expected to continue generating good results South Africa profit and cash flow expected to remain resilient Market position in beverage cans and glass secured United Kingdom steady Strategically well positioned for ongoing growth especially in rest of Africa 80
81 81 Thank You
Nampak 2013 Annual Results
 Nampak 2013 Annual Results November 2013 Summary of Results HEPS up 8% EPS up 13% Operating profit up 8% Africa trading profit up 60% Improvement in working capital management ROE 22% Dividend up 8% to
Nampak 2012 Annual Results
 Nampak 2012 Annual Results November 2012 1 Highlights cents 250 Headline Earnings per Share continuing operations 200 150 142.3 172.4 200.8 100 73.9 50 0 2009 2010 2011 2012 2 Highlights Rm 1,800 1,600
2011 Annual Results. November 2011
 2011 Annual Results November 2011 1 Agenda Highlights Group results Operational review Strategic review 2 Highlights HEPS from continuing operations up 21% Dividend increased by 30% to 108 cents per share
2010 Annual Results. November 2010
 2010 Annual Results November 2010 1 Agenda Highlights Group results Operational review Strategic Update 2 Highlights Operating profit up 126% Trading margin improved from 5.8% to 8.3% Sale/closure of under-performers
Interim Results May 2006
 Interim Results May 2006 Agenda Group results Segmental performance Growth prospects Income Statement Rm 2006 2005 % Comments Revenue 7 845 7 910-1 + 4% ex Peters Papers Profit before abnormal items 798
Agenda. Salient features. Group financial results. Operational review. The way forward
 2009 Group Results Agenda Salient features Group financial results Operational review The way forward 2 Salient Features Turnover up 6% Volumes down 6% Trading income down 27% Cash from operations R2.2bn
Welcome to Nampak s Investor Day
 Welcome to Nampak s Investor Day Durban: 11 September 2013 1 Programme for the Day Beverage Cans and Glass - Charles Bromley Africa growth Rob Morris Nampak Flexible Clinton Farndell Aerosol investment
+13% Nampak enriches peoples lives every day through the provision of. HEPS from continuing operations. EPS from continuing operations +17%
 Interim report and dividend declaration for the six months ended 31 March 2012 Nampak enriches peoples lives every day through the provision of wine bottles flavoured alcoholic beverages tissue products
Interim Results May 2007
 Interim Results May 2007 Salient Features Volume growth in South Africa up 4% Revenue up 11% Costs well-controlled Trading income up 15% HEPS before fair value adjustment up 17% Income Statement Rm 2007
Nampak Limited Audited Group results and dividend declaration for the year ended 30 September 2013
 AUDITED GROUP RESULTS AND DIVIDEND DECLARATION FOR THE YEAR ENDED 30 SEPTEMBER 2013 Nampak Limited Audited Group results and dividend declaration for the year ended 30 September 2013 1 Highlights Trading
Annual Results November 2015
 Annual Results 2015 November 2015 Forward looking statements We may make statements that are not historical facts and relate to analyses and other information based on forecasts of future results and estimates
Nampak Overview March 2016
 Nampak Overview March 2016 Forward looking statements We may make statements that are not historical facts and relate to analyses and other information based on forecasts of future results and estimates
AUDITED GROUP RESULTS AND DIVIDEND DECLARATION. For the year ended 30 September 2015
 AUDITED GROUP RESULTS AND DIVIDEND DECLARATION For the year ended 30 September 2015 GROUP REVENUE FROM CONTINUING OPERATIONS UP 13% GROUP TRADING PROFIT FROM CONTINUING OPERATIONS UP 10%, IN SPITE OF A
AUDITED GROUP RESULTS FOR THE YEAR ENDED 30 SEPTEMBER 2007
 AUDITED GROUP RESULTS FOR THE YEAR ENDED 30 SEPTEMBER 2007 Revenue up 12% Trading income up 18% Headline earnings per share up 22% Cash distribution up 20% CONDENSED GROUP INCOME STATEMENT 2007 2006 Change
Annual Results November 2016
 Annual Results 2016 November 2016 Forward looking statements We may make statements that are not historical facts and relate to analyses and other information based on forecasts of future results and estimates
INTERIM REPORT and. cash DISTRIBUTION
 INTERIM REPORT and cash DISTRIBUTION FOR THE SIX MONTHS ENDED 31 MARCH 2008 nampak limited (Registration number 1968/008070/06) (Incorporated in the Republic of South Africa) Share code: NPK ISIN: ZAE
UNAUDITED GROUP RESULTS AND DIVIDEND DECLARATION
 UNAUDITED GROUP RESULTS AND DIVIDEND DECLARATION For the half year ended 31 March 2015 GROUP REVENUE FROM CONTINUING OPERATIONS UP 16% GROUP OPERATING PROFIT FROM CONTINUING OPERATIONS DOWN 9%, FOLLOWING
Nampak (NPKJ.J) Share fully priced with growth dependent on Africa CREDIT SUISSE SECURITIES RESEARCH & ANALYTICS
 Share fully priced with growth dependent on Africa CREDIT SUISSE SECURITIES RESEARCH & ANALYTICS") EEMEA/South Africa Equity Research Containers & Packaging Rating UNDERPERFORM* Price (27 Jun 12, R) 25.50 Target price (R) 23.00¹ Market cap. (R m) 15,070.55 Enterprise value (R m) 16,798.2 *Stock ratings
EEMEA/South Africa Equity Research Containers & Packaging Rating UNDERPERFORM* Price (27 Jun 12, R) 25.50 Target price (R) 23.00¹ Market cap. (R m) 15,070.55 Enterprise value (R m) 16,798.2 *Stock ratings
Interim Results 2018
 Interim Results 2018 Forward looking statements We may make statements that are not historical facts and relate to analyses and other information based on forecasts of future results and estimates of amounts
First-half Results June 2016
 First-half Results 2016 June 2016 Forward looking statements We may make statements that are not historical facts and relate to analyses and other information based on forecasts of future results and estimates
Summarised consolidated financial results
 Summarised consolidated financial results For the six months ended 31 March 2018 Revenue increased to Trading profit increased to HEPS increased by R8.8 bn R1.2 bn 10% up by 2 % up by 7% to 132.0 cents
Group Results Presentation for the six months ended 31 March 2016
 Group Results Presentation for the six months ended 31 March 2016 Index Overview Financial performance Operational performance Outlook 2 Overview Noel Doyle Chief Operating Officer Disclaimer Forward-looking
Interim Results Presentation Hulamin Limited. For the half-year ended 30 June 2007
 Interim Results Presentation Hulamin Limited For the half-year ended 30 June 2007 Salient features Continuing volume growth Sustained improvement in underlying performance by Rolled Products Operating
AUDITED RESULTS FOR THE YEAR ENDED 31 DECEMBER 2016
 AUDITED RESULTS FOR THE YEAR ENDED 31 DECEMBER 2016 AGENDA 2 1 Opening remarks / market update 2 Financial results 3 Operational review 4 Strategy update 5 Outlook 1 2 3 4 5 OPENING REMARKS / MARKET UPDATE
VOLUNTARY TRADING UPDATE FOR THE FIVE MONTHS TO 28 FEBRUARY 2018
 SENS ANNOUNCEMENT - Nampak Limited (Incorporated in the Republic of South Africa) Registration Number: 1968/008070/06 Share Code: NPK ISIN: ZAE 000071676 ( Nampak or the "Group") VOLUNTARY TRADING UPDATE
Mpact Limited Annual Results. 31 December 2013
 Mpact Limited Annual Results 31 December 2013 2013 in context and financial highlights Operating review Financial review Strategy and outlook Appendices 2 2013 in context Muted GDP and consumer spending
31/05/2017 SENS Article
 NAMPAK LIMITED Unaudited group results and ordin 30 May 2017 Close NPK 201705300042A Unaudited group results and ordinary dividend announcement for the half year ended 31 March 2017 Nampak Limited (Registration
AUDITED RESULTS FOR THE YEAR ENDED 31 DECEMBER 2015
 AUDITED RESULTS FOR THE YEAR ENDED 31 DECEMBER 2015 AGENDA 2 1 Opening remarks / market update Richard 2 Financial results David 3 Operational review Richard 4 Strategy update Richard 5 Outlook Richard
9/22/2010. Growing outside South Africa Clive Tasker, Chief Executive: Standard Bank Africa. Strategy
 Standard d Bank Group Growing outside South Africa Clive Tasker, Chief Executive: Standard Bank Africa Strategy 1 What is our strategy? To build a leading emerging markets financial services organisation
INTERIM RESULTS PRESENTATION FOR THE SIX MONTHS ENDED 31 AUGUST 2017
 INTERIM RESULTS PRESENTATION FOR THE SIX MONTHS ENDED 31 AUGUST 2017 AGENDA BUSINESS TRENDS AND STRATEGY Zak Calisto SEGMENTAL PERFORMANCE Zak Calisto FINANCIAL REVIEW John Edmeston OUTLOOK AND QUESTIONS
TRELLIDOR HOLDINGS LIMITED AUDITED RESULTS FOR THE YEAR ENDED 30 JUNE 2016
 TRELLIDOR HOLDINGS LIMITED AUDITED RESULTS FOR THE YEAR ENDED 30 JUNE 2016 OVERVIEW Trellidor is the market leading manufacturer of custom made barrier security products Distribution through dedicated
Results presentation. for the 26 weeks ended 26 August 2018
 Results presentation for the 26 weeks ended 26 August 2018 Agenda Chairman s introduction Gareth Ackerman Chairman Results overview Bakar Jakoet Chief Finance Officer Progress on our plan Richard Brasher
EABL F08 Investor Group Briefing
 EABL F08 Investor Group Briefing outperforming in a challenging environment... Gerald Mahinda - Group Managing Director Peter Ndegwa - Group Finance Director 29 August 2008, 16h00 Agenda > Business Review
Financial results presentation For the period ended 30 June External structural and cyclical impacts on results
 212 Financial results presentation For the period ended 3 June 212 External structural and cyclical impacts on results Macro factor Developing versus developed world Consequence SA and Africa relatively
Summarised consolidated financial results
 Summarised consolidated financial results For the year ended 30 September 2017 Group revenue of Trading profit increased to R18.8 bn R2.0 bn HEPS increased by 15% to 123.8 cents per share down by 2 % up
Nampak Annual Report 2003
 Nampak Annual Report 2003 Nampak Limited, PO Box 784324 Sandton 2146, South Africa Nampak Annual Report 2003 It s all part of the package! Nampak contents Packaging solutions 2 Global growth 4 Income statements
Investor Presentation First Half 2011 Financial Results 6 th Annual Greek Roadshow September 8&9, London
 www.frigoglass.com Investor Presentation First Half 2011 Financial Results 6 th Annual Greek Roadshow September 8&9, London www.frigoglass.com 2 What we do Ice-Cold Merchandisers First Half 2011: Sales
Mr Price Group Limited Interim Results September 2009
 Interim Results September 2009 Total consumer spending contracted sharply Decline in retail sales in real terms for seven consecutive months Household debt to disposable income at historically high levels
RESULTS PRESENTATION. Creating a Future, Enhancing Life
 RESULTS PRESENTATION Creating a Future, Enhancing Life PRESENTATION AGENDA MILESTONES FOR 2017 Wessie van der Westhuizen VISION 2019 Wessie van der Westhuizen FINANCIAL RESULTS 2017 Graeme Mouton OUTLOOK
HY17 RESULTS PRESENTATION
 1 HY17 RESULTS PRESENTATION TABLE OF CONTENTS About Cartrack 3 Business trends 4 Strategy overview 6 Segmental performance 13 Financial review 19 Outlook 28 Annexures 32 ABOUT CARTRACK A leading global
Update: Interim Economic Partnership Agreements
 TRADE POLICY in PRACTICE GLOBAL EUROPE 13 December 2007 Update: Interim Economic Partnership Agreements The EU and the African, Caribbean and Pacific countries (ACP) have been working to put in place new
Nampak Limited (Registration number 1968/008070/06) (Incorporated in the Republic of South Africa) Share code: NPK SIN: ZAE
 (Incorporated in the Republic of South Africa) Share code: NPK SIN: ZAE") Nampak Limited (Registration number 1968/008070/06) (Incorporated in the Republic of South Africa) Share code: NPK SIN: ZAE 000071676 Summarised consolidated financial results for the year ended 30 September
Nampak Limited (Registration number 1968/008070/06) (Incorporated in the Republic of South Africa) Share code: NPK SIN: ZAE 000071676 Summarised consolidated financial results for the year ended 30 September
SABMiller plc. Interim results Half year ended 30 September November 2005 also available on website
 SABMiller plc Interim results Half year ended 30 September 2005 10 November 2005 also available on website www.sabmiller.com Forward-looking statements This presentation includes forward-looking statements.
Exports under Preferential Trade Agreements
 Exports under Preferential Trade Agreements Presenter: Mr R. NABEE- Team Leader Origin Unit Date: 17-18 July 2017 Overview Preferential Trade Agreements How to determine Rules of Origin Registration of
Interim Results Presentation For six months to June Saving our customers money so they can live better
 Interim Results Presentation For six months to June 2017 Saving our customers money so they can live better Agenda 1 Financial review 2 Operational review 3 Strategy & prospects Financial Review Hans van
Hulamin Limited Interim Results Presentation
 Hulamin Limited Interim Results Presentation For the half-year ended 30 June 2009 Abnormal Market Conditions Sharpest fall in global consumption of aluminium since 1975 oil shock Rolled products and extrusions
KAP INDUSTRIAL HOLDINGS LIMITED UNAUDITED RESULTS FOR THE SIX MONTHS ENDED 31 DECEMBER 2018
 KAP INDUSTRIAL HOLDINGS LIMITED INTEGRATED INTO EVERY DAY INTRODUCTION JAAP DU TOIT CHAIRMAN AGENDA INTRODUCTION JAAP DU TOIT UNAUDITED INTERIM RESULTS FOR THE SIX STRATEGY MONTHS IMPLEMENTATION ENDED
qualities INNOVATIVE DIVERSE RESPONSIVE FLEXIBLE PROACTIVE
 qualities INNOVATIVE DIVERSE RESPONSIVE FLEXIBLE PROACTIVE 1 Nampak Limited Profile 2 Goals 2 Values 3 Financial Summary 5 The Group at a Glance 8Group Structure 9 Chairman s Statement 16 Group Managing
3 Operational Review. Strategic Review and Objectives
 UNAUDITED INTERIM RESULTS FOR THE HALF YEAR ENDED 30 JUNE 2012 1 Agenda 1 Introduction 2 Financial Review 3 Operational Review 4 Strategic Review and Objectives 5 Outlook 2 Key Points for H1 2012 Performance
About this report. Scope and boundary of the report. Nampak s management structure. Nampak s reporting approach
 Integrated Annual Report 2011 About this report Nampak s management structure The Nampak group is managed according to raw material and product type in South Africa and according to geography in the rest
Main heading continued
 2 Main heading continued INTEGRATED ANNUAL REPORT 2012 Nampak s sustainability is highly dependent on its ability to produce packaging that benefits all its stakeholders. As Africa s largest packaging
ADVANCED MANUFACTURING
 INTEGRATED REPORT 2017 ADVANCED MANUFACTURING Contents 1 About our report WHO WE ARE 2 This is Nampak 4 How we define value and the stakeholders who help us create it 5 Our operating context 6 How we performed
Interim Results March Paul Stuiver - CEO
 Interim Results March 2012 Paul Stuiver - CEO 1 Agenda Context Financial Overview Divisional Overview Outlook Questions 2 Context For the six months from October 2011 to March 2012 The positive trend in
Standard Bank Group financial results presentation for the year ended 31 December 2015
 Standard Bank Group financial results presentation for the year ended 31 December 215 standardbank.com Financial results presentation Standard Bank Group 215 Macroeconomic environment 17 16 15 14 13 12
Unaudited results for the 6 months ended 30 September H Investor Booklet November 2016
 H1 2017 Investor Booklet November 2016 Agenda Overview of Results Financial Review Outlook 2 Overview In the F2016 results presentation (14 July 2016) we said: Dawn board had approved a plan to stop losses
Annual Results Presentation. for the year ended 30 September 2014
 Annual Results Presentation for the year ended 30 September 2014 AGENDA Business Overview Poultry Industry Trends Financial Overview Industry Matters Prospects Q & A 2 2 BUSINESS OVERVIEW 3 THE PERIOD
Financial Results for the 6 months ended 31 March Nick Wentzel, CEO
 Financial Results for the 6 months ended 31 March 2011 Nick Wentzel, CEO Salient features Revenue 2% R5,1bn to R5,2bn Operating profit 4% R582m to R604m EBITDA margin 2% 12,4% to 12,7% HEPS 18% 223 cents
ANALYST PRESENTATION FOR THE YEAR ENDED 31 MARCH 2012
 ANALYST PRESENTATION FOR THE YEAR ENDED 31 MARCH 2012 1 TFG ANALYST PRESENTATION MARCH 2012 AGENDA Overview of the economy and retail environment Review of the year Financial review Divisional review Financial
MR PRICE GROUP LIMITED
 MR PRICE GROUP LIMITED OPERATING REPORT 26 WEEKS ENDED 28 SEPTEMBER 2013 1 Registration number 1933/004418/06 Incorporated in the Republic of South Africa ISIN: ZAE 000026951 JSE share code: MPC ( Mr Price
International Monetary and Financial Committee
 International Monetary and Financial Committee Thirty-Third Meeting April 16, 2016 IMFC Statement by Pravin Jamnadas Gordhan Minister of Finance, South Africa On behalf of Angola, Botswana, Burundi, Eritrea,
INTERNATIONAL TRADE ARRANGEMENTS
 INTERNATIONAL TRADE ARRANGEMENTS SA TRADE AGREEMENTS Agriculture DIRECTORATE: INTERNATIONAL TRADE NOVEMBER 2009 1 CONTENT Americas AGOA TIDCA MERCOSUR Africa SACU SADC Europe TDCA EFTA 2 Africa Growth
nampak limited annual report 2010
 nampak limited annual report 2010 , 1 Financial highlights 2 Segments at a glance 4 Directorate 6 Group executive committee 10 Chairman s review 12 Chief executive s report 18 Operational review 26 Chief
Southern Africa regional superpower in the making. Dr Roelof Botha
 Southern Africa regional superpower in the making Dr Roelof Botha Health sector focus Composition of Gauteng health budget FY 01 by programme (total R5. billion) R b Central Hospitals: 6.5 Facilities Management:.
Unaudited group results for the six months ended 31 March 2018
 Unaudited group results for the six months ended 31 March 2018 Index Listeria update Results overview Financial & operational performance Outlook & conclusion 2 Disclaimer Forward-looking statement This
Huhtamaki roadshow presentation. Investor Relations Copenhagen Jan 8, 2010
 Huhtamaki roadshow presentation Investor Relations Copenhagen Jan 8, 2010 Huhtamaki in brief A leading manufacturer of consumer and specialty packaging with head office in Espoo, Finland Net sales EUR
SABMiller plc. Full year results Twelve months ended 31 March Graham Mackay, Chief Executive Jamie Wilson, Chief Financial Officer.
 SABMiller plc Full year results Twelve months ended 31 March 2012 Graham Mackay, Chief Executive Jamie Wilson, Chief Financial Officer 24 May 2012 Forward looking statements This presentation includes
OVERVIEW. Comparable HEPS up 4.5% Restaurant sales up 10.4% Comparable profit before tax up 5.0% Interim dividend per share up 6.
 OVERVIEW Restaurant sales up 10.4% (from continuing operations) Comparable HEPS up 4.5% (from continuing operations) Comparable profit before tax up 5.0% (from continuing operations) Interim dividend per
Thai Beverage PLC. FY17 Financial Results. (Full Year Ended 30 September 2017) FY17 (Full Year Ended 30 September 2017) Thai Beverage PLC
 FY17 (Full Year Ended 30 September 2017) Thai Beverage PLC") Thai Beverage PLC FY17 Financial Results (Full Year Ended 30 September 2017) FY17 (Full Year Ended 30 September 2017) Thai Beverage PLC 1 Note on Forward Looking Statements The following presentation may
Thai Beverage PLC FY17 Financial Results (Full Year Ended 30 September 2017) FY17 (Full Year Ended 30 September 2017) Thai Beverage PLC 1 Note on Forward Looking Statements The following presentation may
SABMiller plc. F 12 first half results US call Six months ended September 30, November 17, 2011
 SABMiller plc F 12 first half results US call Six months ended September 30, 2011 November 17, 2011 Jamie Wilson, Chief Financial Officer Gary Leibowitz, Senior Vice President, IR Forward looking statements
SABMiller plc. Full year results Twelve months ended 31 March Jamie Wilson, Chief Financial Officer Gary Leibowitz, SVP, Investor Relations
 SABMiller plc Full year results Twelve months ended 31 March 2012 Jamie Wilson, Chief Financial Officer Gary Leibowitz, SVP, Investor Relations 24 May 2012 Forward looking statements This presentation
SABMiller plc Preliminary results Year ended 31 March 2015
 SABMiller plc Preliminary results Year ended 31 March 2015 Presented by Alan Clark, Chief Executive Domenic De Lorenzo, Acting Chief Financial Officer Forward looking statements This presentation includes
FINAL RESULTS ANNOUNCEMENT. Year ended 28 February 2013
 FINAL RESULTS ANNOUNCEMENT Year ended 28 February 2013 WILDERNESS HOLDINGS AUDITED YEAR END RESULTS Agenda Welcome & board changes Parks Tafa, Chairman Review of the period to Feb 2013 Keith Vincent, Acting
2011 FINAL RESULTS PRESENTATION
 2011 FINAL RESULTS PRESENTATION FEBRUARY 2012 1 Agenda 1 Market Conditions 2011 2 Financial Review 3 Operational Review 4 Key Strategic Priorities 5 Outlook for 2012 and Beyond 2 MARKET CONDITIONS 2011
How global megatrends could change tax in Africa
 How global megatrends could change tax in Africa Panel Moderator Panel Mark Goulding George Trollope Mark Kingon Michael Lalor EY Tax market segment leader Southern region Vice President Tax Sasol South
investment case sustainable value creation Insurance Financial Planning Retirement Investments Wealth
 investment case sustainable value creation Insurance Financial Planning Retirement Investments Wealth agenda Overview Strategic positioning Strategic delivery Financial performance 2014 interim results
Period overview Operational Overview Financial Results Conclusion
 Interim Results Six months ended 31 ust 2015 Bridging y expectations Agenda Period overview Operational Overview Financial Results Conclusion Bridging y expectations 2 1 Six month overview Satisfactory
AVI Limited presentation to shareholders & analysts for the six months ended 31 December 2017
 AVI Limited presentation to shareholders & analysts for the six months ended 31 December 2017 AGENDA Key features and results history Group financial results Performance and prospects Questions and answers
SABMiller plc. First half results. 19 November Graham Mackay, Chief Executive Malcolm Wyman, CFO. Six months ended 30 September 2009
 SABMiller plc First half results Six months ended 30 September 2009 19 November 2009 Graham Mackay, Chief Executive Malcolm Wyman, CFO Forward looking statements This presentation includes forward-looking
KAP INDUSTRIAL HOLDINGS LIMITED (KAP) UNAUDITED INTERIM RESULTS FOR THE SIX MONTHS ENDED 31 DECEMBER 2017
 UNAUDITED INTERIM RESULTS FOR THE SIX MONTHS ENDED 31 DECEMBER 2017") KAP INDUSTRIAL HOLDINGS LIMITED (KAP) UNAUDITED INTERIM RESULTS FOR THE SIX MONTHS ENDED 31 DECEMBER 2017 WELCOME JAAP DU TOIT CHAIRMAN AGENDA WELCOME UNAUDITED INTERIM RESULTS FOR THE SIX STRATEGY MONTHS
KAP INDUSTRIAL HOLDINGS LIMITED (KAP) UNAUDITED INTERIM RESULTS FOR THE SIX MONTHS ENDED 31 DECEMBER 2017 WELCOME JAAP DU TOIT CHAIRMAN AGENDA WELCOME UNAUDITED INTERIM RESULTS FOR THE SIX STRATEGY MONTHS
Management discussion and analysis
 Management discussion and analysis Global economy The global economy expected a growth of 1.7% in 2008 followed by growth deceleration by 2.2% in 2009. The developing countries showcased a notable growth
RESULTS PRESENTATION FOR THE 52 WEEKS ENDED 25 FEBRUARY 2018
 RESULTS PRESENTATION FOR THE 52 WEEKS ENDED 25 FEBRUARY 2018 1 Chairman s introduction Gareth Ackerman Chairman 2 3 Results overview Bakar Jakoet Chief Finance Officer Progress on our plan Richard Brasher
Letshego Holdings Limited
 Letshego Holdings Limited Building a leading African financial services group Agenda 1H 2015 Results Presentation strong performance, growth, and returns to shareholders Strategic update Diversification
Electrocomponents 2017 half-year financial results. 18 November 2016
 Electrocomponents 2017 half-year financial results 18 November 2016 Agenda Overview of results Lindsley Ruth Financial results and performance update David Egan Performance Improvement Plan Lindsley Ruth
Leading global banking practices Emilio Pera, May 2013
 Leading global banking practices Emilio Pera, May 203!@# Agenda Banking in Africa 2 Global Banking Outlook 3 Questions/discussion 2 Africa Attractiveness Getting down to business!@# How Infrastructure
FY16 YEAR END RESULTS 5 APRIL 2016
 FY16 YEAR END RESULTS 5 APRIL 2016 DEFINITIONS AND IMPORTANT NOTICE The following definitions apply throughout Trading EBITDA (earnings before interest, tax, depreciation and amortisation): excludes exceptional
AVI Limited presentation to shareholders & analysts for the year ended June 2018
 AVI Limited presentation to shareholders & analysts for the year ended June 2018 AGENDA Key features and results history Group financial results Business unit performance Prospects Questions and answers
Group finance director s report
 Group finance director s report Revenue increased by 9,2% on subscriber growth of 28% to 116 million users... Had there been no change in currency rates during the year, revenue growth would have been
Investor Presentation Second Quarter and First Half 2012 Financial Results
 What we do Ice-Cold Merchandisers xxx Investor Presentation Second Quarter and First Half 2012 Financial Results Glass Operations xxx Disclaimer This presentation contains forward-looking statements which
Standard Bank Group : J' :ź? WN ī 5' :Tź :TJ' ī ' 'T 55i : 5 ':T J T ': : ' 5 N?5WT'?:N HJ?b' J Ąā 1W: ăāăĉ
 Standard Bank Group OVERVIEW OF STANDARD BANK GROUP AFRICA IS OUR HOME, WE DRIVE HER GROWTH ON-THE-GROUND PRESENCE IN 2 SUB-SAHARAN COUNTRIES OFFICES IN SIX KEY CENTRES 1 216 Branches 9 173 ATMs South
AVI Limited presentation to shareholders & analysts for the year ended 30 June 2014
 AVI Limited presentation to shareholders & analysts for the year ended 30 June 2014 AGENDA Key features and results history Group financial results Performance and prospects Questions and answers KEY FEATURES
TRELLIDOR HOLDINGS LIMITED UNAUDITED INTERIM RESULTS FOR THE SIX MONTHS ENDED 31 DECEMBER 2017
 TRELLIDOR HOLDINGS LIMITED UNAUDITED INTERIM RESULTS FOR THE SIX MONTHS ENDED 31 DECEMBER 2017 GROUP HIGHLIGHTS 5% Revenue 5% PAT 5% HEPS 35.2c 5% Interim dividend declared 11.0 cents per share Slide 2
Nampak Annual Report annual report 2004
 Nampak Annual Report 2004 annual report 2004 IFC NAMPAK LIMITED ANNUAL REPORT CONTENTS 1 Nampak profile 2 Chairman s review 8 Group directorate 10 Chief executive s report 30 Chief financial officer s
Results Presentation. for 26 weeks ended 28 June 2015
 Results Presentation for 26 weeks ended 28 June 2015 The Environment It s tough out there! South Africa: Consumer confidence at 14-year low CPI range-bound but Food inflation soon to increase Manufacturing
Results for the Fourth Quarter ended 31 December 2017
 Results for the Fourth Quarter ended 31 December 2017 Athens, Greece, 25 April 2018 Frigoglass SAIC ( Frigoglass or we or the Group ) announces results for the quarter and full year ended 31 December 2017
Annual Results Presentation FOR THE 52 WEEKS ENDED DECEMBER 2018
 Annual Results Presentation FOR THE 52 WEEKS ENDED DECEMBER 2018 HANS VAN LIEROP Financial review Sales R90.9bn h 2.9% 2017: R88.4 billion* Gross profit margin 19.45% 2017: 19.63%* Financial summary Trading
Earnings Release FY May 2015
 Earnings Release FY2014 04 May 2015 Results highlights Financial overview Region overview Final remarks 1 Overview 12 THOUSAND EMPLOYEES TURNOVER 1,048 Mn 1.4 Bn BACKLOG 73 Mn NET INCOME EBITDA 261 Mn
Group results and dividend declaration for the six months ended 31 March 2011
 Tiger Brands Limited Registration number 1944/017881/06 (Incorporated in the Republic of South Africa) Share code: TBS ISIN: ZAE000071080 Group results and dividend declaration for the six months ended
Huhtamaki roadshow presentation. Investor Relations Q1 2009
 Huhtamaki roadshow presentation Investor Relations 2009 Huhtamaki in brief A leading manufacturer of consumer and specialty packaging with head office in Espoo, Finland Net sales EUR 2.3 billion in 65
H1 16 interim results. 22 September 2015
 H1 16 interim results 22 September 2015 Important notice 2 This presentation may include certain forward-looking statements, beliefs or opinions, including statements with respect to the Company s business,
Interim Results. Six months ended 31 August 2016
 Interim Results Six months ended 31 August 2016 Stefanutti Stocks City A multi-disciplinary construction group (Vision) (Mission) 2 www.stefanuttistocks.com y 2 Agenda Six month overview Operational Overview