2010 Annual Results. November 2010
|
|
|
- Shanon Perkins
- 6 years ago
- Views:
Transcription

1 2010 Annual Results November
2 Agenda Highlights Group results Operational review Strategic Update 2
3 Highlights Operating profit up 126% Trading margin improved from 5.8% to 8.3% Sale/closure of under-performers Turnaround of Corrugated and Leeds RONA increased from 6% to 15% HEPS up 79% and EPS up 303% Net debt and gearing down Dividend increased by 98% to 83 cents per share 3
4 4 GROUP RESULTS
5 Group Income Statement Rm % Revenue Operating profit Net finance costs & income from investments Share of profit from associates 1 4 Profit before tax Taxation Profit for the year HEPS 83.8c 149.7c 79 5
6 Significant Abnormal Items Rm Impairment of goodwill, plant, property & investments Cartons & Labels, Interpak Books, L & CP, Tubes & Tubs Retrenchment and restructuring Cartons & Labels, Tubes & Tubs Share based payment expense on BEE transaction Fair value of financial instruments Net profit on disposal of property 2 39 South Africa and Europe TOTAL (all items)
7 Tax Rate Rm 2010 Profit before tax Tax 316 Effective tax rate 27.4 Government incentives 3.9 Exempt income 2.0 Other 0.3 Impairment of goodwill 0.8 Disallowable expenses 1.9 Secondary tax on companies 2.9 Standard tax rate

8 HEPS/Dividends per Share cents % 149.7c c 42c +98% 83c 0 HEPS Dividends per share
9 Abridged Balance Sheet Rm Non-current assets Current assets TOTAL ASSETS Total equity Loans and borrowings Retirement benefit obligations Current liabilities Other TOTAL EQUITY AND LIABILITIES
10 Group Condensed Cash Flow Rm Cash generated from operations before working capital Working capital changes 212 Cash generated from operations Net interest paid 262 Tax paid 93 Dividends paid 289 Capex 674 Other 42 Cash inflow before financing activities Net borrowings repaid and other Net cash outflow 93 10
11 Working Capital Movement Rm Inventories 260 Receivables 44 Payables 92 Total decrease in working capital 212 Net working capital to sales 10.6% 11
12 Major Capex Division Project Rm Bevcan Angola 195 Glass Cullet plant *109 DivFood 2-pce food can 67 Tissue 2-ply expansion 64 Plastics Europe Dale Farm in-plant 37 * 100% 12

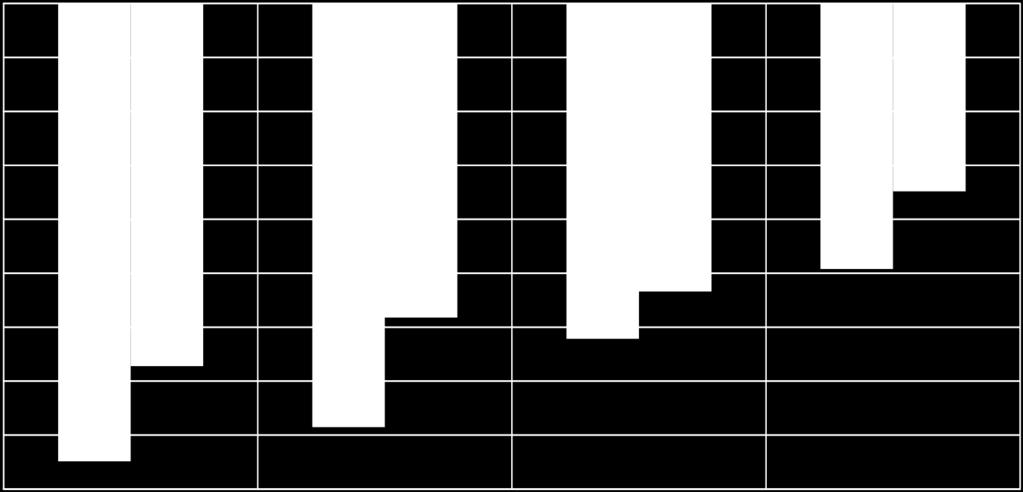
13 Capex % of Depreciation %
14 Debt Rm ,000-1,500-2,000-2,500-3,000-3,500-4,000-4,500 Mar 09 Sep 09 Mar 10 Sep 10 Total Debt Net Debt 14
15 Oct-09 Nov-09 Dec-09 Jan-10 Feb-10 Mar-10 Apr-10 May-10 Jun-10 Jul-10 Aug-10 Sep-10 Rbn 2,900 Trend in Net Borrowings 2,700 2,500 2,300 2,100 1,900 1,700 1,500 15


16 Key Ratios RONA % NAV per Share cents ,050 1, Interest Cover X Net debt:ebitda X
17 17 OPERATIONAL REVIEW
18 Segmentation Rm Revenue Trading profit* Margin % Metals and Glass Paper and Flexibles Plastics Tissue Other * Operating profit before abnormal items 18
19 Metals & Glass Rm Revenue Trading profit Margin % South Africa Rest of Africa Beverage can volumes down 6% Food can volumes down 12% Paint, polish and aerosol cans up Good performance from Nampak Wiegand Glass Kenya and Nigeria performed well Start-up costs of R15m in Angola 19
20 Paper and Flexibles Rm Revenue Trading profit Margin % South Africa Rest of Africa Europe Turnaround in Corrugated Weak demand for folding cartons Improvement at Flexibles exit from loss-making Flexpak and Foam Excellent result from Nigeria offset by poor performance in Zambia Turnaround at Leeds 20
21 Plastics Revenue Trading profit Margin % Rm South Africa Europe Marginal growth of milk and juice bottles in South Africa Good demand for crates Lower PET bottle sales Loss in Tubes & Tubs Europe sales affected by liquidation of major customer Europe profit improvement programme 21
22 Tissue Rm Revenue Trading profit Margin % South Africa Toilet tissue volumes down 2-ply expansion R80m Diaper volumes under pressure Good cost management Improved profitability in Sancella joint venture 22
23 Geographical Segmentation Rm Revenue Trading profit* Margin % South Africa Rest of Africa Europe Other * Operating profit before abnormal items 23
24 Rest of Africa and Europe in Local Currency Revenue Trading profit* Rest of Africa $m Rm inc fees earned offshore Europe m * Operating profit before abnormal items Rm
25 25 STRATEGIC UPDATE
26 Agenda Nampak position in January 2009 March 2009 strategic review November 2010 strategic update Outlook 26
27 index 600 Nampak vs Alsi 500 ALSI Nampak
28 Nampak vs INDI 25 index INDI Nampak
29 Media Perception in 2009 Nampak never fails to disappoint, it always disappoints, Moneyweb October 2009 If there was a prize for disappointing, Nampak would be right up there, Moneyweb October 2009 The perpetually underperforming packaging company, Nampak, Sunday Times, November

30 Market Cap Ranking Rm 35,000 30,000 25,000 20,000 15,000 10,000 JSE 30th 5, th 38th 60th Sep 99 Sep 04 Mar Nampak market cap 30
31 March 2009 Strategic Review 80% of businesses were profitable 20% were underperforming High capex R1.4bn on underperformers High debt peaked at R3.9bn Lack of operational focus Underperforming share price Poor investor perceptions Costs too high especially head office 31
32 Strategic Update 80% of Nampak operations are profitable and have sustainable competitive advantages in markets in which they operate Need to grow these core businesses 32


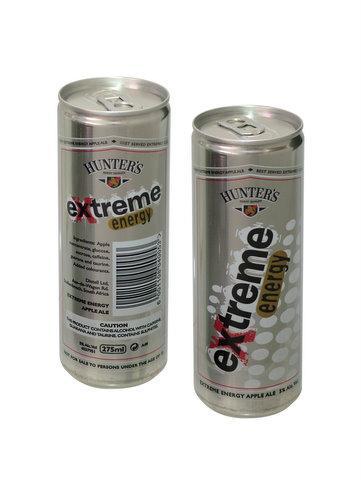
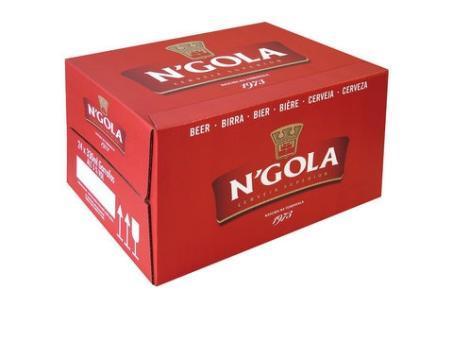
33 33 New Range of Beverage Cans

34 Angola 34 34


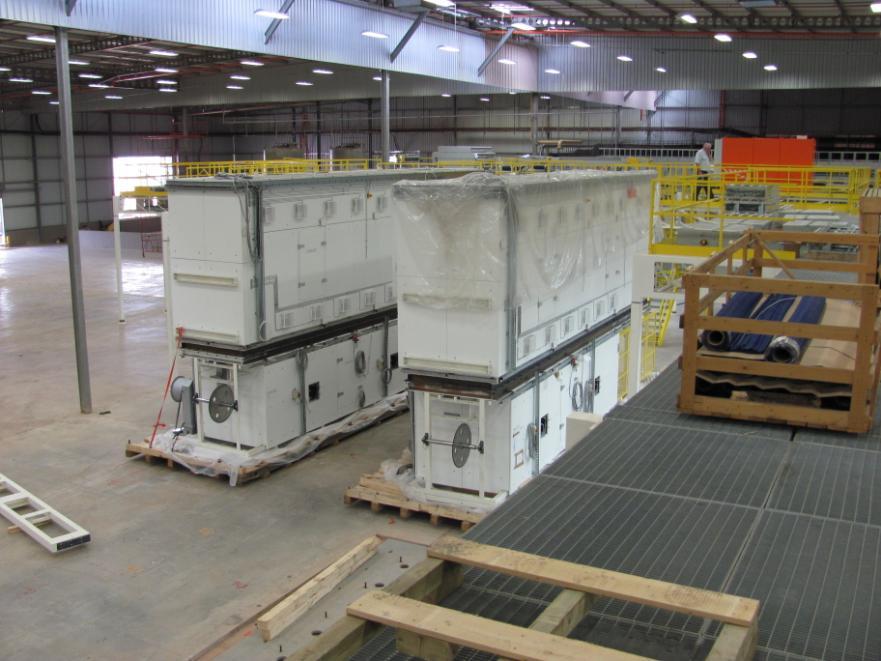
35 35 2-Piece Food Can Expansion


36 36 DivFood Aluminium Cans

37 37 Shaped Aerosol Cans

38 38 Range of New Aerosol Cans

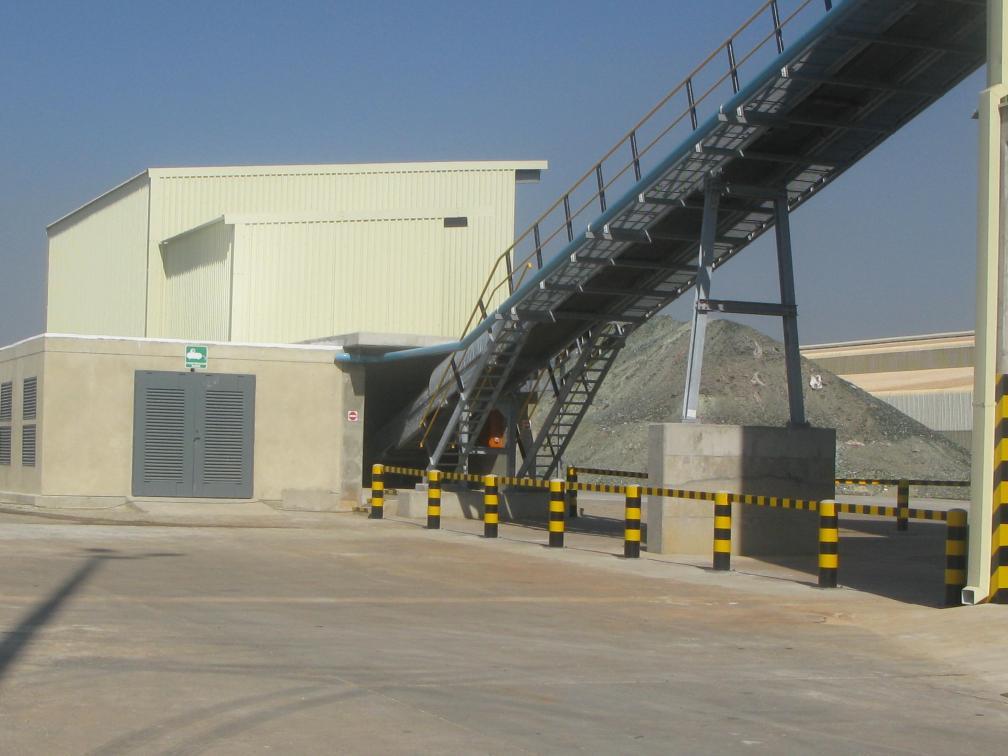
39 39 Glass Cullet Project

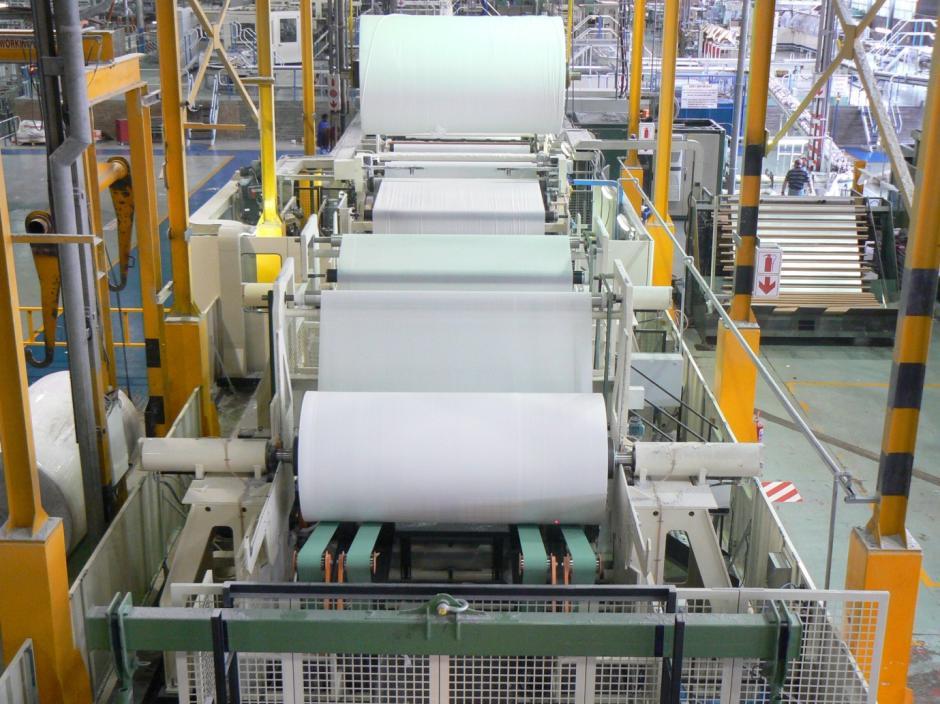
40 40 2-ply Tissue Expansion


41 41 Twinsaver Luxury

42 42 Tena Range
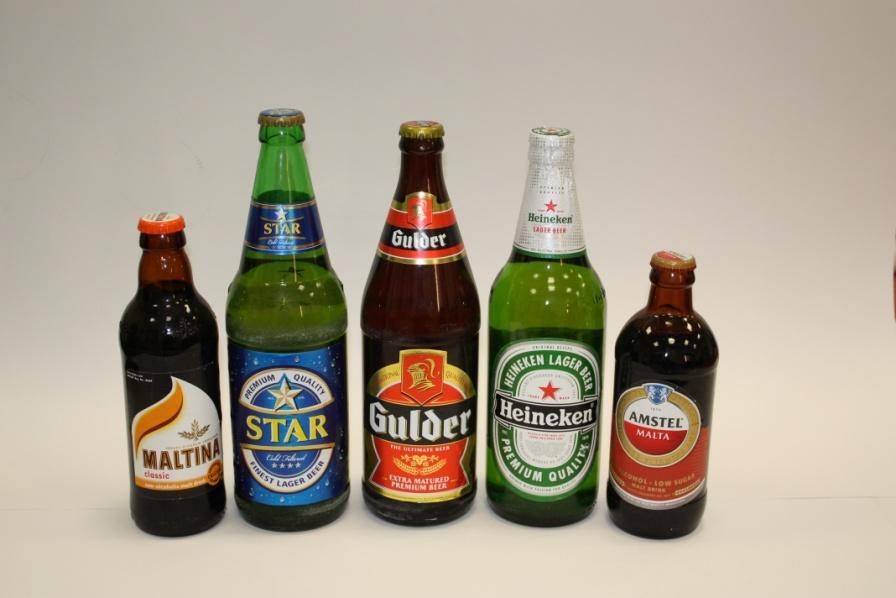
43 43 New Crates and Bottles for Heineken


44 New Crates Collapsible crate Live bird crate Crates for SAB Botswana and Lesotho 44
45 45 Super Shorty Beverage Closure

46 46 Rice Packaging for SPAR


47 47 Innovative Corrugated Boxes
48 48 Sugar Bags for Zambia


49 49 New Packs from Cartons & Labels


50 50 New Flexible Packaging

51 51 Long-Life Milk Bottles


52 52 New Business in Nigeria

53 53 Beer Labels in Zambia


54 54 Dale Farm Dairy In-Plant: Northern Ireland
55 Strategic Update 80% of Nampak operations are profitable and have sustainable competitive advantages in markets in which they operate Need to grow these core businesses 20% of Nampak operations are loss-making or earning returns less than hurdle rates, have been in this position for a number of years and have no sustainable competitive advantages Need to fix/sell/close these operations 55
56 Being Fixed Corrugated loss of R242m in 2009, loss of R63m in 2010 Leeds loss of 2.2m in 2009, profit of 1.4m in 2010 more to be done 56
57 Closed or Sold Foam Flexpak Redibox Disaki Carmoc Mozambique L & CP Containers Tubs Interpak Books 57
58 Renewal of Cautionary Announcement Shareholders are referred to the cautionary announcement published on 4 October 2010 when the company advised that it was is in discussions which, if successfully concluded, could have an effect on the price of the company s securities. Shareholders are advised that discussions are at an advanced stage in regard to the sale of the company s Cartons and Healthcare businesses in Europe. Accordingly, shareholders are advised to continue to exercise caution when dealing in the company s securities until a further announcement is made. 58
59 Strategic Update 80% of Nampak operations are profitable and have sustainable competitive advantages in markets in which they operate 20% of Nampak operations are loss-making or earning returns less than hurdle rates and have been in this position for a number of years and have no sustainable competitive advantages Need to fix/sell/close these operations Very high capex 59

60 Rm 1,600 Total Group Capex 1,400 1,200 1,
61 Strategic Review 80% of Nampak operations are profitable and have sustainable competitive advantages in markets in which they operate 20% of Nampak operations are loss-making or earning returns less than hurdle rates and have been in this position for a number of years and have no sustainable competitive advantages Need to fix/sell/close these operations Very high capex High debt levels 61

62 Debt Rm ,000-1,500-2,000-2,500-3,000-3,500-4,000-4,500 Mar 09 Sep 09 Mar 10 Sep 10 Total Debt Net Debt 62
63 Oct-09 Nov-09 Dec-09 Jan-10 Feb-10 Mar-10 Apr-10 May-10 Jun-10 Jul-10 Aug-10 Sep-10 Oct-10 Rbn 2,900 Trend in Net Borrowings 2,700 2,500 2,300 2,100 1,900 1,700 1,500 63


64 Net Debt Rm , X 1.3X 1.6X 0.8X Net debt: ebitda -1,500-2,000-2,500-3,
65 Strategic Review 80% of Nampak operations are profitable and have sustainable competitive advantages in markets in which they operate 20% of Nampak operations are loss-making or earning returns less than hurdle rates and have been in this position for a number of years and have no sustainable competitive advantages Need to fix/sell/close these operations Very high capex High debt levels High overhead costs 65


66 Overhead Costs (change on 2009) 8.0% 6.0% 4.0% 2.0% 0.0% -2.0% -4.0% -6.0% -8.0% -10.0% -12.0% Empl costs IT costs Depn & Amort R & M Energy Total 66
67 Transformation Improve Empowerdex rating from level 6 to level 5 by end 2010 and to level 4 by end 2011 Level 4 rating achieved in mid
68 2010 Achievements Operating profit up 126% Trading margin improved from 5.8% to 8.3% Sale/closure of under-performers Turnaround of Corrugated and Leeds RONA increased from 6% to 15% HEPS up 79% and EPS up 303% Net debt and gearing down Dividend increased by 98% to 83 cents per share 68
69 Mar-09 Apr-09 May-09 Jun-09 Jul-09 Aug-09 Sep-09 Oct-09 Nov-09 Dec-09 Jan-10 Feb-10 Mar-10 Apr-10 May-10 Jun-10 Jul-10 Aug-10 Sep-10 Oct-10 Nov-10 Nampak Share Price cents
70 Media Perceptions 2010 Following years of operational and management challenges, Nampak appears to have turned the corner, Business Day Investors Monthly, August 2010 This share has disappointed in recent years because the earnings growth has been anaemic and inconsistent. The company has been run by a new management team for almost 19 months and has a rejuvenated board. It could now produce stronger long-term returns, Financial Mail, October
71 71 OUTLOOK
72 Nampak Strategy Focus and invest in core divisions where we have a sustainable competitive advantage Continue with disposal of divisions with no competitive advantage Develop opportunities in core operations in South Africa, rest of Africa and Europe Ongoing focus on working capital and capex to reduce debt and improve dividend yield 72
73 Nampak Strategy Overall aim is to: deliver a more focused group, that is: more profitable has improved margins and RONA with significantly reduced debt, and a higher dividend yield 73
74 74 THANK YOU
75 75 Disclaimer We may make statements that are not historical facts and relate to analyses and other information based on forecasts of future results and estimates of amounts not yet determinable. These are forward-looking statements as defined in the U.S. Private Securities Litigation Reform Act of Words such as believe, anticipate, expect, intend, seek, will, plan, could, may, endeavour and project and similar expressions are intended to identify such forward-looking statements, but are not the exclusive means of identifying such statements. By their very nature, forward-looking statements involve inherent risks and uncertainties, both general and specific, and there are risks that predictions, forecasts, projections and other forward-looking statements will not be achieved. If one or more of these risks materialise, or should underlying assumptions prove incorrect, actual results may be very different from those anticipated. The factors that could cause our actual results to differ materially from the plans, objectives, expectations, estimates and intentions in such forward-looking statements are discussed in each year s annual report. Forward-looking statements apply only as of the date on which they are made, and we do not undertake other than in terms of the Listings Requirements of the JSE Limited, to update or revise any statement, whether as a result of new information, future events or otherwise. All profit forecasts published in this report are unaudited. Investors are cautioned not to place undue reliance on any forward-looking statements contained herein.
2011 Annual Results. November 2011
 2011 Annual Results November 2011 1 Agenda Highlights Group results Operational review Strategic review 2 Highlights HEPS from continuing operations up 21% Dividend increased by 30% to 108 cents per share
Agenda. Salient features. Group financial results. Operational review. The way forward
 2009 Group Results Agenda Salient features Group financial results Operational review The way forward 2 Salient Features Turnover up 6% Volumes down 6% Trading income down 27% Cash from operations R2.2bn
Nampak 2012 Annual Results
 Nampak 2012 Annual Results November 2012 1 Highlights cents 250 Headline Earnings per Share continuing operations 200 150 142.3 172.4 200.8 100 73.9 50 0 2009 2010 2011 2012 2 Highlights Rm 1,800 1,600
Interim Results May 2006
 Interim Results May 2006 Agenda Group results Segmental performance Growth prospects Income Statement Rm 2006 2005 % Comments Revenue 7 845 7 910-1 + 4% ex Peters Papers Profit before abnormal items 798
Nampak 2013 Interim Results
 Nampak 2013 Interim Results May 2013 1 Agenda Salient features Group results Operational review Strategic update Outlook 2 Salient Features Revenue up 7%, Africa up 19% Trading profit up 6% Profits from
Nampak 2013 Annual Results
 Nampak 2013 Annual Results November 2013 Summary of Results HEPS up 8% EPS up 13% Operating profit up 8% Africa trading profit up 60% Improvement in working capital management ROE 22% Dividend up 8% to
Annual Results November 2016
 Annual Results 2016 November 2016 Forward looking statements We may make statements that are not historical facts and relate to analyses and other information based on forecasts of future results and estimates
Annual Results November 2015
 Annual Results 2015 November 2015 Forward looking statements We may make statements that are not historical facts and relate to analyses and other information based on forecasts of future results and estimates
+13% Nampak enriches peoples lives every day through the provision of. HEPS from continuing operations. EPS from continuing operations +17%
 Interim report and dividend declaration for the six months ended 31 March 2012 Nampak enriches peoples lives every day through the provision of wine bottles flavoured alcoholic beverages tissue products
Interim Results May 2007
 Interim Results May 2007 Salient Features Volume growth in South Africa up 4% Revenue up 11% Costs well-controlled Trading income up 15% HEPS before fair value adjustment up 17% Income Statement Rm 2007
Nampak Limited Audited Group results and dividend declaration for the year ended 30 September 2013
 AUDITED GROUP RESULTS AND DIVIDEND DECLARATION FOR THE YEAR ENDED 30 SEPTEMBER 2013 Nampak Limited Audited Group results and dividend declaration for the year ended 30 September 2013 1 Highlights Trading
Interim Results 2018
 Interim Results 2018 Forward looking statements We may make statements that are not historical facts and relate to analyses and other information based on forecasts of future results and estimates of amounts
AUDITED GROUP RESULTS FOR THE YEAR ENDED 30 SEPTEMBER 2007
 AUDITED GROUP RESULTS FOR THE YEAR ENDED 30 SEPTEMBER 2007 Revenue up 12% Trading income up 18% Headline earnings per share up 22% Cash distribution up 20% CONDENSED GROUP INCOME STATEMENT 2007 2006 Change
First-half Results June 2016
 First-half Results 2016 June 2016 Forward looking statements We may make statements that are not historical facts and relate to analyses and other information based on forecasts of future results and estimates
DATATEC GROUP UNAUDITED INTERIM RESULTS FOR THE 6 MONTHS ENDED 31 AUGUST 2016
 Technology Distribution Integration & Managed Services Consulting & Research UNAUDITED INTERIM RESULTS FOR THE 6 MONTHS ENDED 31 AUGUST 2016 AGENDA Results summary, market conditions & operational strategy
Nampak Overview March 2016
 Nampak Overview March 2016 Forward looking statements We may make statements that are not historical facts and relate to analyses and other information based on forecasts of future results and estimates
INTERIM REPORT and. cash DISTRIBUTION
 INTERIM REPORT and cash DISTRIBUTION FOR THE SIX MONTHS ENDED 31 MARCH 2008 nampak limited (Registration number 1968/008070/06) (Incorporated in the Republic of South Africa) Share code: NPK ISIN: ZAE
Group Results Presentation for the six months ended 31 March 2016
 Group Results Presentation for the six months ended 31 March 2016 Index Overview Financial performance Operational performance Outlook 2 Overview Noel Doyle Chief Operating Officer Disclaimer Forward-looking
UNAUDITED GROUP RESULTS AND DIVIDEND DECLARATION
 UNAUDITED GROUP RESULTS AND DIVIDEND DECLARATION For the half year ended 31 March 2015 GROUP REVENUE FROM CONTINUING OPERATIONS UP 16% GROUP OPERATING PROFIT FROM CONTINUING OPERATIONS DOWN 9%, FOLLOWING
AUDITED RESULTS FOR THE YEAR ENDED 31 DECEMBER 2016
 AUDITED RESULTS FOR THE YEAR ENDED 31 DECEMBER 2016 AGENDA 2 1 Opening remarks / market update 2 Financial results 3 Operational review 4 Strategy update 5 Outlook 1 2 3 4 5 OPENING REMARKS / MARKET UPDATE
VOLUNTARY TRADING UPDATE FOR THE FIVE MONTHS TO 28 FEBRUARY 2018
 SENS ANNOUNCEMENT - Nampak Limited (Incorporated in the Republic of South Africa) Registration Number: 1968/008070/06 Share Code: NPK ISIN: ZAE 000071676 ( Nampak or the "Group") VOLUNTARY TRADING UPDATE
nampak limited annual report 2010
 nampak limited annual report 2010 , 1 Financial highlights 2 Segments at a glance 4 Directorate 6 Group executive committee 10 Chairman s review 12 Chief executive s report 18 Operational review 26 Chief
AUDITED GROUP RESULTS AND DIVIDEND DECLARATION. For the year ended 30 September 2015
 AUDITED GROUP RESULTS AND DIVIDEND DECLARATION For the year ended 30 September 2015 GROUP REVENUE FROM CONTINUING OPERATIONS UP 13% GROUP TRADING PROFIT FROM CONTINUING OPERATIONS UP 10%, IN SPITE OF A
Unaudited results for the 6 months ended 30 September H Investor Booklet November 2016
 H1 2017 Investor Booklet November 2016 Agenda Overview of Results Financial Review Outlook 2 Overview In the F2016 results presentation (14 July 2016) we said: Dawn board had approved a plan to stop losses
AUDITED RESULTS FOR THE YEAR ENDED 31 DECEMBER 2015
 AUDITED RESULTS FOR THE YEAR ENDED 31 DECEMBER 2015 AGENDA 2 1 Opening remarks / market update Richard 2 Financial results David 3 Operational review Richard 4 Strategy update Richard 5 Outlook Richard
Summarised consolidated financial results
 Summarised consolidated financial results For the six months ended 31 March 2018 Revenue increased to Trading profit increased to HEPS increased by R8.8 bn R1.2 bn 10% up by 2 % up by 7% to 132.0 cents
XML Publisher Balance Sheet Vision Operations (USA) Feb-02
 Feb-02") Page:1 Apr-01 May-01 Jun-01 Jul-01 ASSETS Current Assets Cash and Short Term Investments 15,862,304 51,998,607 9,198,226 Accounts Receivable - Net of Allowance 2,560,786
Page:1 Apr-01 May-01 Jun-01 Jul-01 ASSETS Current Assets Cash and Short Term Investments 15,862,304 51,998,607 9,198,226 Accounts Receivable - Net of Allowance 2,560,786
31/05/2017 SENS Article
 NAMPAK LIMITED Unaudited group results and ordin 30 May 2017 Close NPK 201705300042A Unaudited group results and ordinary dividend announcement for the half year ended 31 March 2017 Nampak Limited (Registration
Welcome to Nampak s Investor Day
 Welcome to Nampak s Investor Day Durban: 11 September 2013 1 Programme for the Day Beverage Cans and Glass - Charles Bromley Africa growth Rob Morris Nampak Flexible Clinton Farndell Aerosol investment
About this report. Scope and boundary of the report. Nampak s management structure. Nampak s reporting approach
 Integrated Annual Report 2011 About this report Nampak s management structure The Nampak group is managed according to raw material and product type in South Africa and according to geography in the rest
PT Ultrajaya Milk Industry & Trading Company Tbk. FY 2013 results update
 PT Ultrajaya Milk Industry & Trading Company Tbk. FY 2013 results update April 2014 0 Disclaimer These materials are not intended to be a public offering document under Law of the Republic of Indonesia
SIX MONTHS ENDED 30 SEPTEMBER 2018
 PRESENTATION TUESDAY, 20 NOVEMBER 2018 SIX MONTHS ENDED 30 SEPTEMBER 2018 CONTENTS PRESENTED BY Neil Birch Chief Executive Officer Harry Todd Chief Financial Officer 2 EXECUTIVE OVERVIEW 3 RESULTS SUMMARY
ANALYST PRESENTATION FOR THE YEAR ENDED 31 MARCH 2012
 ANALYST PRESENTATION FOR THE YEAR ENDED 31 MARCH 2012 1 TFG ANALYST PRESENTATION MARCH 2012 AGENDA Overview of the economy and retail environment Review of the year Financial review Divisional review Financial
CorpBanca. First Quarter 2015 Financial Results
 CorpBanca First Quarter 2015 Financial Results Disclaimer 2 This Presentation contains forward-looking statements, including statements related to the planned acquisition of Helm Bank and the timing thereof.
Dean Foods. Earnings Report. February 11, 2009
 Dean Foods Fourth Quarter and Year End 2008 Earnings Report February 11, 2009 Forward Looking Statements The following statements made in this presentation are forward looking and are made pursuant to
Financial & Business Highlights For the Year Ended June 30, 2017
 Financial & Business Highlights For the Year Ended June, 17 17 16 15 14 13 12 Profit and Loss Account Operating Revenue 858 590 648 415 172 174 Investment gains net 5 162 909 825 322 516 Other 262 146
Mr Price Group Limited Interim Results September 2009
 Interim Results September 2009 Total consumer spending contracted sharply Decline in retail sales in real terms for seven consecutive months Household debt to disposable income at historically high levels
Nampak Limited (Registration number 1968/008070/06) (Incorporated in the Republic of South Africa) Share code: NPK SIN: ZAE
 (Incorporated in the Republic of South Africa) Share code: NPK SIN: ZAE") Nampak Limited (Registration number 1968/008070/06) (Incorporated in the Republic of South Africa) Share code: NPK SIN: ZAE 000071676 Summarised consolidated financial results for the year ended 30 September
Nampak Limited (Registration number 1968/008070/06) (Incorporated in the Republic of South Africa) Share code: NPK SIN: ZAE 000071676 Summarised consolidated financial results for the year ended 30 September
2002 Interim Results. 10 September 2002
 2002 Interim Results 10 September 2002 Introduction Interim results summary First Half 2002 2001 Turnover + m 449.5 520.7 Operating profit + * m 16.0 45.4 Net finance charge m (6.6) (9.9) Profit before
Summarised consolidated financial results
 Summarised consolidated financial results For the year ended 30 September 2017 Group revenue of Trading profit increased to R18.8 bn R2.0 bn HEPS increased by 15% to 123.8 cents per share down by 2 % up
2011 Interim Results. Keith Gordon, Managing Director & Chief Executive Officer Stephen Gobby, Chief Financial Officer
 2011 Interim Results Keith Gordon, Managing Director & Chief Executive Officer Stephen Gobby, Chief Financial Officer Emeco 2011 Interim Results Overview Financials Strategy & Outlook Questions Appendices
Standard Bank Group : J' :ź? WN ī 5' :Tź :TJ' ī ' 'T 55i : 5 ':T J T ': : ' 5 N?5WT'?:N HJ?b' J Ąā 1W: ăāăĉ
 Standard Bank Group OVERVIEW OF STANDARD BANK GROUP AFRICA IS OUR HOME, WE DRIVE HER GROWTH ON-THE-GROUND PRESENCE IN 2 SUB-SAHARAN COUNTRIES OFFICES IN SIX KEY CENTRES 1 216 Branches 9 173 ATMs South
Fourth Quarter & Full Year 2016 Earnings Call
 Fourth Quarter & Full Year 2016 Earnings Call February 23, 2017 Rob Wagman President & Chief Executive Officer Nick Zarcone Executive Vice President & Chief Financial Officer Joe Boutross Director, Investor
2018 SECOND QUARTER FINANCIAL RESULTS
 2018 SECOND QUARTER FINANCIAL RESULTS July 30, 2018 0 SAFE HARBOR STATEMENT The 2018 second quarter news release, conference call webcast, and the following slides contain forward-looking statements. The
Presentation of Half Year Results 13 February
 Presentation of Half Year Results 13 February 2001 www.commbank.com.au Disclaimer The material that follows is a presentation of general background information about the Bank s activities current at the
Nampak Limited profile. Contents
 Annual Report 2009 Nampak Limited profile Contents ifc corporate profi le 1 key features of the year 2 group at a glance 4 directorate 6 group executive committee 8 chairman s review 12 chief executive
Spheria Australian Smaller Companies Fund
 29-Jun-18 $ 2.7686 $ 2.7603 $ 2.7520 28-Jun-18 $ 2.7764 $ 2.7681 $ 2.7598 27-Jun-18 $ 2.7804 $ 2.7721 $ 2.7638 26-Jun-18 $ 2.7857 $ 2.7774 $ 2.7690 25-Jun-18 $ 2.7931 $ 2.7848 $ 2.7764 22-Jun-18 $ 2.7771
SUMMARISED CONSOLIDATED RESULTS For the year ended 30 June 2016 STRATEGIC & OPERATIONAL OVERVIEW. Canal Walk (Cape Town, Western Cape)
") SUMMARISED CONSOLIDATED RESULTS For the year ended 30 June 2016 STRATEGIC & OPERATIONAL OVERVIEW Canal Walk (Cape Town, Western Cape) 1 STRATEGY & OVERVIEW South African REIT Focused on emerging markets
SUMMARISED CONSOLIDATED RESULTS For the year ended 30 June 2016 STRATEGIC & OPERATIONAL OVERVIEW Canal Walk (Cape Town, Western Cape) 1 STRATEGY & OVERVIEW South African REIT Focused on emerging markets
Annual Results Presentation. for the year ended 30 September 2014
 Annual Results Presentation for the year ended 30 September 2014 AGENDA Business Overview Poultry Industry Trends Financial Overview Industry Matters Prospects Q & A 2 2 BUSINESS OVERVIEW 3 THE PERIOD
H1 16 interim results. 22 September 2015
 H1 16 interim results 22 September 2015 Important notice 2 This presentation may include certain forward-looking statements, beliefs or opinions, including statements with respect to the Company s business,
Barloworld Limited. Audited results for the year ended 30 September 2003
 Barloworld Limited Audited results for the year ended 30 September 2003 Barloworld is an international industrial brand management company 23 000 people... in 32 countries providing business solutions
Interim Report. For the three and six month periods ended 30 June Ardagh Packaging Holdings Limited
 Interim Report For the three and six month periods ended Ardagh Holdings Limited TABLE OF CONTENTS Selected Financial Information 2 Operating and Financial Review 3 Page UNAUDITED CONDENSED CONSOLIDATED
Preliminary Results Announcement
 Preliminary Results Announcement JIM SUTCLIFFE Chief Executive Introduction 23 rd February Day s agenda UK 09:00 10:00 10:30 11:00 12:00 12:45 SA 11:00 12:00 12:30 13:00 14:00 14:45 OM analyst presentation
RESULTS PRESENTATION FOR THE SIX MONTHS ENDED 30 JUNE 2018 PRESENTED BY ZANELE MATLALA (CEO) AND KAJAL BISSESSOR (FD)
 AND KAJAL BISSESSOR (FD)") RESULTS PRESENTATION FOR THE SIX MONTHS ENDED 30 JUNE 2018 i PRESENTED BY ZANELE MATLALA (CEO) AND KAJAL BISSESSOR (FD) Merafe Resources Ltd Results presentation for the year ended 31 December 2017 LEGAL
RESULTS PRESENTATION FOR THE SIX MONTHS ENDED 30 JUNE 2018 i PRESENTED BY ZANELE MATLALA (CEO) AND KAJAL BISSESSOR (FD) Merafe Resources Ltd Results presentation for the year ended 31 December 2017 LEGAL
BELL EQUIPMENT LTD Final Results Announcement & Business Review. March Prepared for the Challenging Year ahead.
 BELL EQUIPMENT LTD 2008 Final Results Announcement & Business Review March 2009 Agenda Synopsis 2008 Financial Results 2008 Understanding BELL EQUIPMENT Market View 2009-2010 Strategy Cash Flow Initiatives
Investor Teleconference Presentation Third Quarter October 25, 2006
 Investor Teleconference Presentation October 25, 10/25/06 2 Earnings Teleconference Forward Looking Statements This document contains forward-looking statements within the meaning of the Private Securities
Fourth Quarter 2016 Performance Summary
 Fourth Quarter 2016 Performance Summary Operational and Financial Highlights - 2016 Net profit rises by +2.5% to Euros 545.5 million Recurring sales (excluding Raw Materials and Others) rise by +4.5% (+4.6%
Mpact Limited Annual Results. 31 December 2013
 Mpact Limited Annual Results 31 December 2013 2013 in context and financial highlights Operating review Financial review Strategy and outlook Appendices 2 2013 in context Muted GDP and consumer spending
Financial Data Report IBL Limited (THE GROUP) for the period ending 31.Mar.2017
 for the period ending 31.Mar.2017") Financial Data Report IBL Limited (THE GROUP) for the period ending 31.Mar.2017 Equity Statistics Particulars Units 31-Mar-17 Current Market Price MUR 39.65 52 week H/L* MUR 125.00 / 27.20 Market Capitalisation
Financial Data Report IBL Limited (THE GROUP) for the period ending 31.Mar.2017 Equity Statistics Particulars Units 31-Mar-17 Current Market Price MUR 39.65 52 week H/L* MUR 125.00 / 27.20 Market Capitalisation
Liberty Holdings Limited Financial results presentation for the year ended 31 December
 Liberty Holdings Limited Financial results presentation 2016 for the year ended 31 December Results agenda Annual results 2016 Group financial Operational activities Conclusion preview and strategic performance
Nampak (NPKJ.J) Share fully priced with growth dependent on Africa CREDIT SUISSE SECURITIES RESEARCH & ANALYTICS
 Share fully priced with growth dependent on Africa CREDIT SUISSE SECURITIES RESEARCH & ANALYTICS") EEMEA/South Africa Equity Research Containers & Packaging Rating UNDERPERFORM* Price (27 Jun 12, R) 25.50 Target price (R) 23.00¹ Market cap. (R m) 15,070.55 Enterprise value (R m) 16,798.2 *Stock ratings
EEMEA/South Africa Equity Research Containers & Packaging Rating UNDERPERFORM* Price (27 Jun 12, R) 25.50 Target price (R) 23.00¹ Market cap. (R m) 15,070.55 Enterprise value (R m) 16,798.2 *Stock ratings
Q Earnings Summary August 5, 2015
 Q2 2015 Earnings Summary August 5, 2015 Trademark of Trinseo S.A. or its affiliates Introductions & Disclosure Rules Introductions Chris Pappas, President & CEO John Feenan, Executive Vice President &
INTERIM FINANCIAL RESULTS FOR THE PERIOD ENDED 30 SEPTEMBER NOVEMBER 2018
 INTERIM FINANCIAL RESULTS FOR THE PERIOD ENDED 30 SEPTEMBER 2018 13 NOVEMBER 2018 Disclaimer The information contained in this presentation has not been subject to any independent audit or review and may
Nampak Annual Report 2003
 Nampak Annual Report 2003 Nampak Limited, PO Box 784324 Sandton 2146, South Africa Nampak Annual Report 2003 It s all part of the package! Nampak contents Packaging solutions 2 Global growth 4 Income statements
FY 2018 FIRST QUARTER EARNINGS. Adient s Q1 results impacted by headwinds in Seat Structures & Mechanisms (SS&M) business $4,204M $102M
 business $4,204M $102M") FY 2018 FIRST QUARTER EARNINGS Adient s Q1 results impacted by headwinds in Seat Structures & Mechanisms (SS&M) business > > Q1 GAAP net income and EPS diluted of $(216)M and $(2.32), respectively; Q1
FY 2018 FIRST QUARTER EARNINGS Adient s Q1 results impacted by headwinds in Seat Structures & Mechanisms (SS&M) business > > Q1 GAAP net income and EPS diluted of $(216)M and $(2.32), respectively; Q1
Financial Data Report CIEL LTD (THE GROUP) for the period ending 31.Dec.2017
 for the period ending 31.Dec.2017") Financial Data Report CIEL LTD (THE GROUP) for the period ending 31.Dec.2017 Equity Statistics Particulars Units 29-Dec-17 Current Market Price MUR 7.14 52 week H/L* MUR 7.94 / 6.26 Market Capitalisation
Financial Data Report CIEL LTD (THE GROUP) for the period ending 31.Dec.2017 Equity Statistics Particulars Units 29-Dec-17 Current Market Price MUR 7.14 52 week H/L* MUR 7.94 / 6.26 Market Capitalisation
Agenda. Results Presentation 27 February Appendices 1 to
 Results Presentation 27 February 2018 51 Agenda Results Presentation 27 February 2018 Page Presented by Overview 1 Jeff Fairburn Review of operations 3 Jeff Fairburn Outlook 13 Jeff Fairburn Financial
Financial Data Report LOTTOTECH LIMITED. for the period ending 30.Jun.2017
 Financial Data Report LOTTOTECH LIMITED for the period ending 30.Jun.2017 Equity Statistics Particulars Units 31-Jul-17 Current Market Price MUR 5.90 52 week H/L* MUR 6.50 / 4.02 Market Capitalisation
Financial Data Report LOTTOTECH LIMITED. for the period ending 31.Dec.2017
 Financial Data Report LOTTOTECH LIMITED for the period ending 31.Dec.2017 Equity Statistics Particulars Units 29-Dec-17 Current Market Price MUR 7.30 52 week H/L* MUR 9.12 / 5.28 Market Capitalisation
Financial Data Report LOTTOTECH LIMITED. for the period ending 30.Jun.2018
 Financial Data Report LOTTOTECH LIMITED for the period ending 30.Jun.2018 Equity Statistics Particulars Units 29-Jun-18 Current Market Price MUR 9.72 52 week H/L* MUR 9.88 / 5.66 Market Capitalisation
Development of Economy and Financial Markets of Kazakhstan
 Development of Economy and Financial Markets of Kazakhstan National Bank of Kazakhstan Macroeconomic development GDP, real growth, % 116 112 18 14 1 113,5 11,7 216,7223,8226,5 19,8 19,8 19,3 19,619,7 199,
2018 Half Year Results
 A GLOBAL LEADER IN METAL FLOW ENGINEERING 2018 Half Year Results 26 July 2018 Patrick André Chief Executive 1 Disclaimer This presentation, which has been prepared by Vesuvius plc (the Company ), includes
Huhtamaki roadshow presentation. Investor Relations Copenhagen Jan 8, 2010
 Huhtamaki roadshow presentation Investor Relations Copenhagen Jan 8, 2010 Huhtamaki in brief A leading manufacturer of consumer and specialty packaging with head office in Espoo, Finland Net sales EUR
EABL F08 Investor Group Briefing
 EABL F08 Investor Group Briefing outperforming in a challenging environment... Gerald Mahinda - Group Managing Director Peter Ndegwa - Group Finance Director 29 August 2008, 16h00 Agenda > Business Review
Financial Data Report SUN LIMITED (THE GROUP) for the period ending 31.Mar.2017
 for the period ending 31.Mar.2017") Financial Data Report SUN LIMITED (THE GROUP) for the period ending 31.Mar.2017 Equity Statistics Particulars Units 31-Mar-17 Current Market Price MUR 40.00 52 week H/L* MUR 40.00 / 32.80 Market Capitalisation
Financial Data Report SUN LIMITED (THE GROUP) for the period ending 31.Mar.2017 Equity Statistics Particulars Units 31-Mar-17 Current Market Price MUR 40.00 52 week H/L* MUR 40.00 / 32.80 Market Capitalisation
Interim Results Presentation. For the six months ended 31 December 2018
 Interim Results Presentation For the six months ended 31 December 2018 1 STEEL & TUBE IS One of New Zealand s leading providers of steel solutions, and a proud New Zealand company, with over 65 years of
Looking to the medium term
 Looking to the medium term Issued: 4 September 2013 Legal notice This presentation has been prepared to inform investors and prospective investors in the secondary markets about the Group and does not
Interim Results. Six months ended 31 August 2016
 Interim Results Six months ended 31 August 2016 Stefanutti Stocks City A multi-disciplinary construction group (Vision) (Mission) 2 www.stefanuttistocks.com y 2 Agenda Six month overview Operational Overview
Period overview Operational Overview Financial Results Conclusion
 Interim Results Six months ended 31 ust 2015 Bridging y expectations Agenda Period overview Operational Overview Financial Results Conclusion Bridging y expectations 2 1 Six month overview Satisfactory
INTERIM RESULTS PRESENTATION
 INTERIM RESULTS PRESENTATION for the six months ended 31 March 2016 Agenda Strategic Update Financial Performance Divisional Performance Outlook and Imperatives 1 Strategic Update Phil Roux CEO 2 Environmental
PHOENIX ENERGY MARKETING CONSULTANTS INC. HISTORICAL NATURAL GAS & CRUDE OIL PRICES UPDATED TO July, 2018
 Jan-01 $12.9112 $10.4754 $9.7870 $1.5032 $29.2595 $275.39 $43.78 $159.32 $25.33 Feb-01 $10.4670 $7.8378 $6.9397 $1.5218 $29.6447 $279.78 $44.48 $165.68 $26.34 Mar-01 $7.6303 $7.3271 $5.0903 $1.5585 $27.2714
1Q 2017 EARNINGS PRESENTATION MAY 10, 2017
 1Q 2017 EARNINGS PRESENTATION MAY 10, 2017 Real Industry, Inc. 17 State Street, Suite 3811, New York, NY 10004 www.realindustryinc.com Real Alloy, Inc. 3700 Park East Dr., Suite 300, Beachwood, OH 44122
Nampak Annual Report annual report 2004
 Nampak Annual Report 2004 annual report 2004 IFC NAMPAK LIMITED ANNUAL REPORT CONTENTS 1 Nampak profile 2 Chairman s review 8 Group directorate 10 Chief executive s report 30 Chief financial officer s
Interim Results for the 6 months to 30 September NOVEMBER 2010
 Interim Results for the 6 months to 30 September 2010 8 NOVEMBER 2010 Nick Robertson Introduction Strong H1 Retail sales up 50%, group revenues up 45% Strong UK and international retail sales, up 26% and
QUESTION 2. QUESTION 3 Which one of the following is most indicative of a flexible short-term financial policy?
 QUESTION 1 Compute the cash cycle based on the following information: Average Collection Period = 47 Accounts Payable Period = 40 Average Age of Inventory = 55 QUESTION 2 Jan 41,700 July 39,182 Feb 18,921
Statkraft Investor Update. March 2014
 Statkraft Investor Update March 2014 Disclaimer This presentation has been prepared by, and the information contained herein (unless otherwise indicated) has been provided by Statkraft AS (the "Company").
Financial Data Report CIEL LTD (THE GROUP) for the period ending 31.Dec.2016
 for the period ending 31.Dec.2016") Financial Data Report CIEL LTD (THE GROUP) for the period ending 31.Dec.2016 Equity Statistics Particulars Units 30-Dec-16 Current Market Price MUR 6.30 52 week H/L* MUR 6.60 / 5.86 Market Capitalisation
Financial Data Report CIEL LTD (THE GROUP) for the period ending 31.Dec.2016 Equity Statistics Particulars Units 30-Dec-16 Current Market Price MUR 6.30 52 week H/L* MUR 6.60 / 5.86 Market Capitalisation
PROPOSED COMBINATION OF KRATON PERFORMANCE POLYMERS, INC. WITH THE SBC BUSINESS OF LCY CHEMICAL CORP.
 UPDATE CALL PROPOSED COMBINATION OF KRATON PERFORMANCE POLYMERS, INC. WITH THE SBC BUSINESS OF LCY CHEMICAL CORP. KRATON PERFORMANCE POLYMERS, INC. KEVIN M. FOGARTY, PRESIDENT AND CHIEF EXECUTIVE OFFICER
Electrocomponents 2017 half-year financial results. 18 November 2016
 Electrocomponents 2017 half-year financial results 18 November 2016 Agenda Overview of results Lindsley Ruth Financial results and performance update David Egan Performance Improvement Plan Lindsley Ruth
Revenue Estimating Conference Tobacco Tax and Surcharge Executive Summary
 Revenue Estimating Conference Tobacco Tax and Surcharge Executive Summary February 12, 2014 The Revenue Estimating Conference reviewed Tobacco Tax and Surcharge revenues on February 12, 2014. The forecasts
Tiger Brands Limited. Group Results Presentation. for the year ended 30 September 2015
 Tiger Brands Limited Group Results Presentation for the year ended 30 September 2015 2 Index Strategic review 3 Strategic review Peter Matlare Chief Executive Officer 4 Key strategic deliverables 1 Improve
Results Presentation. For the year ended
 Results Presentation For the year ended 31 3 213 1 The year in review 2 Mixed operating environment Strong equity markets but a weak Rand Equity markets Interest rates 13 12 11 1 9 +18.8% +12.7% +12.6%
REPORT TO STAKEHOLDERS
 REPORT TO STAKEHOLDERS FOR THE YEAR ENDED 30 JUNE 2011 RECOVERY & GROWTH MEDUPI POWER STATION 2 Salient points FY2011 Summarised financial results Hot topics Group financials Purpose, values and vision
Hulamin Limited Interim Results Presentation
 Hulamin Limited Interim Results Presentation For the half-year ended 30 June 2009 Abnormal Market Conditions Sharpest fall in global consumption of aluminium since 1975 oil shock Rolled products and extrusions
Integrated Dental Holdings. Q4 FY2018 and year-end results - investor presentation 27 June 2018
 Integrated Dental Holdings Q4 FY2018 and year-end results - investor presentation 27 June 2018 DISCLAIMER THIS PRESENTATION IS NOT AN OFFER OR SOLICITATION OF AN OFFER TO BUY OR SELL SECURITIES IN THE
Financial Data Report Cim Financial Services Limited (THE GROUP) for the period ending 31.Dec.2017
 for the period ending 31.Dec.2017") Financial Data Report Cim Financial Services Limited (THE GROUP) for the period ending 31.Dec.2017 Equity Statistics Particulars Units 29-Dec-17 Current Market Price MUR 10.05 52 week H/L* MUR 10.50 /
Financial Data Report Cim Financial Services Limited (THE GROUP) for the period ending 31.Dec.2017 Equity Statistics Particulars Units 29-Dec-17 Current Market Price MUR 10.05 52 week H/L* MUR 10.50 /
Agenda. Results Presentation 27 February Appendices 1 to
 Results Presentation 27 February 2017 55 Agenda Results Presentation 27 February 2017 Page Presented by Chairman s overview 1 Nicholas Wrigley Review of operations 3 Jeff Fairburn Outlook 13 Jeff Fairburn
Financial Data Report ROGERS AND COMPANY LIMITED (THE GROUP) for the period ending 31.Dec.2017
 for the period ending 31.Dec.2017") Financial Data Report ROGERS AND COMPANY LIMITED (THE GROUP) for the period ending 31.Dec.2017 Equity Statistics Particulars Units 29-Dec-17 Current Market Price MUR 31.30 52 week H/L* MUR 33.00 / 27.00
Financial Data Report ROGERS AND COMPANY LIMITED (THE GROUP) for the period ending 31.Dec.2017 Equity Statistics Particulars Units 29-Dec-17 Current Market Price MUR 31.30 52 week H/L* MUR 33.00 / 27.00
TRELLIDOR HOLDINGS LIMITED AUDITED RESULTS FOR THE YEAR ENDED 30 JUNE 2016
 TRELLIDOR HOLDINGS LIMITED AUDITED RESULTS FOR THE YEAR ENDED 30 JUNE 2016 OVERVIEW Trellidor is the market leading manufacturer of custom made barrier security products Distribution through dedicated
Financial Data Report LUX ISLAND RESORTS LIMITED (THE GROUP) for the period ending 30.Jun.2015
 for the period ending 30.Jun.2015") Financial Data Report LUX ISLAND RESORTS LIMITED (THE GROUP) for the period ending 30.Jun.2015 Equity Statistics Particulars Units 15-Sep-15 Current Market Price MUR 62.50 52 week H/L* MUR 63.50 / 51.00
Financial Data Report LUX ISLAND RESORTS LIMITED (THE GROUP) for the period ending 30.Jun.2015 Equity Statistics Particulars Units 15-Sep-15 Current Market Price MUR 62.50 52 week H/L* MUR 63.50 / 51.00