2002 Interim Results. 10 September 2002
|
|
|
- Randolph Lamb
- 6 years ago
- Views:
Transcription
1 2002 Interim Results 10 September 2002
2 Introduction
3 Interim results summary First Half Turnover + m Operating profit + * m Net finance charge m (6.6) (9.9) Profit before taxation ** m Underlying EPS ** p 2.2p 10.9p Dividend per share p - 7.4p + On a continuing basis *Before goodwill amortisation of 3.9m ( m) and operating exceptionals of 28.3m ( nil) **Before the above items and corporate exceptional losses of 9.7m ( m)
4 1 st Half 2002 geographic sales Americas 42% Rest of World 15% Europe 43% Morgan s broad geographic spread
5 Organisation 5 Businesses Electrical Carbon Engineered Carbon Magnetics Technical Ceramics Insulating Ceramics Combined strength - Global strength
6 1 st Half 2002 sales by business Insulating Ceramic 28% Electrical Carbon 23% Magnetics 21% Technical Ceramics 15% Engineered Carbon 13%
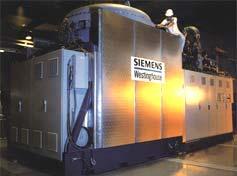
7 1 st Half 2002 operating profit by business Insulating Ceramic 36% Magnetics -7 % Technical Ceramics 11% Engineered Carbon 12% Electrical Carbon 48%
8 Automotive Consumer Goods Industrial Equipment Chemical and Petrochem. Power Generation Non Ferrous Metals Defence / Aerospace Steel Telecommunications Railway & Marine Electronics Mechanical Engineering Biomedical & Health Ceramics & Glass Construction 1 st Half 2002 market sector sales Strong sector spread
9 1 st Half 2002 operating cash flow by business Insulating Ceramic 43% Magnetics 11 % Technical Ceramics -2% Engineered Carbon 12% Electrical Carbon 36%
10 'm 120 Cash generation profile st Half 2nd Half Full Year Operating profit (before goodwill) Operating cash flow Profit Impact high but cash achievement excellent
11 Cash generation profile 'm st Half 2002 Operating profit (before goodwill) Operating cash flow Continued emphasis on cash generation
12 Financial Review Nigel Young
13 Summary Profit and Loss Account First Half m Turnover (continuing) Underlying operating profit (continuing) (discontinued) (0.3) 2.1 Goodwill amortisation (3.9) (3.7) Exceptional items (38.0) (2.3) Net finance charge (6.6) (9.9) Pre-tax (loss)/profit (32.8) 31.6 Tax charge (2.3) (10.3) (Loss)/Profit after tax (35.1) 21.3
14 EPS and order book outlook First Half ** Underlying EPS* p Dividend per share p *Before goodwill amortisation of 3.9m ( m) and operating and corporate exceptional costs of 38.0m (2001: 2.3m loss) - **2001 figures are restated
15 Cost reduction programme Increased efficiency & simplicity of operating structure Original overall plan Current overall position Annualised improvement in costs within 2 years
16 Operating cash flow First half m Inflow/(outflow) Operating profit (16.5) 43.8 Depreciation and amortisation Reorganisation costs/ write offs 13.7 (0.1) Increase in working capital (3.6) (35.5) Other Operating cash flow
17 Free cash flow First Half m Inflow/(outflow) Operating cash flow Net interest (7.0) (9.4) Taxation (3.7) (9.0) Cash earnings Dividends (18.2) (18.2) Net cash flow before capex Net capital spend (17.4) (29.3) Free cash flow (16.6) (27.1)
18 Borrowings and gearing Half year m Inflow/(outflow) Opening net borrowings (276.1) (220.0) Free cash flow (16.6) (27.1) Acquisitions/disposals (3.4) (47.1) Other 1.0 (2.0) Closing net borrowings (295.1) (296.2) Net assets Gearing 78.0% 67.0%
19 Funding Strong banking relationships Reduce predominance of bank finance Increase proportion of alternative funding sources Targeted net debt reduction to 200m commitment to non-core corporate disposals (T/O 70m+) disposal of surplus property (proceeds c 20m over years 02-04) tight control of working capital and capex invest in cost reduction programme
20 Increasing competitiveness and reducing net debt Cost reduction programme is on track Strong cash management in place Good first half free cash flow performance Substantial reduction in net debt targeted through portfolio adjustment and disposals Interim dividend reinvested in the cost reduction programme Disposals programme for surplus land and buildings through to 2004 well underway
21 First half key areas
22 Cost reduction programme Significant reduction in total employee cost. Headcount reduction of 1,000 employees. Transfer of an additional 1,000 jobs to low cost countries. Announced impact Operating cost base reduced by 30m per annum from 2004 Exceptional costs of 70m during Net cash cost of redundancy and reorganisations 40m Total number of projects + 70
23 Cost reduction programme current position Of the total of 71 projects 26 completed Est. 10m annualised saving by end of Total Costs 70m Total Cash effect 40m Full year savings (mid 2004) 33m 2002 Costs 45m 2002 Cash Outflow 19m
24 Mill s Cost reduction programme Cumulative effect Cumluative OP Benefit Cumulative cash "cost" Cumulative asset write off
25 Large Size of benefit Closure of US ferrites Small Restructuring progress Major Priorities IFB/ Castables restructuring Early wins Thermal Inc. cost restructuring Transfer of US Carbon site Restructure of UK Thermal site Increase Competitiveness Restructure EU Adv. Ceramics site Magnetic Dev. Slovakia USA Crucible EU Industrial Traction \Re org. Strategic Wins Area to avoid Mechanical Carbon Rationalisation Quick Payback Partially completed Commencing 2003 Long Term
26 Business analysis Operating profit First Half m Turnover before goodwill Magnetics (1.2) 7.6 Electrical Engineered Technical Insulating Continuing businesses Discontinued (0.3) 2.1 Total
27 Business Highlights Operating profit First Half m Turnover before goodwill Electrical Carbon Industrial replacement market strengthening Industrial and Automotive Gross Margin recovering Automotive - record new business contracts won Opportunities in Fuel injection systems Consolidation of our Auto manufacturing facilities in progress
28 Business Highlights Operating profit First Half m Turnover before goodwill Magnetics (1.2) 7.6 Sales down 18.7% on first half 2001 Major fixed cost reduction programme on target Focus on working capital reduction Good growth in sales and profit in Superconductors Detailed product analysis completed Article surveillance market recovering well Disc drive orders in place for Q4 No immediate recovery anticipated in Telecom Organisational changes in progress
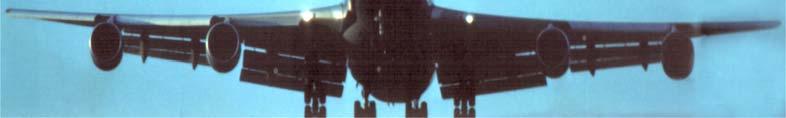
29 Business Highlights Operating profit First Half m Turnover before goodwill Engineered Carbon US and Asian markets for OEM s are weak Commercial aero weakness over last 12 months Business focusing on cost and cash control Specialty Margins increased despite lower sales Fuel cell development progress excellent Coatings overheads significantly reduced Closure of UK site announced
30 Business Highlights Operating profit First Half m Turnover before goodwill Technical Ceramics Consolidation of US Advanced Ceramic sites Move to low cost countries progressing Consolidation proposals within Europe nearing completion Further approvals gained at Applied Materials Electro Ceramics weaker in short term but exciting pipeline of major growth opportunities established Transfer of labour intensive manufacture on certain new products to Magnetics site in Slovakia
31 Business Highlights Operating profit First Half m Turnover before goodwill Insulating Ceramics US Crucible site closure in progress and on target UK site consolidation delivering cost and efficiency target Increasing demand for soluble Superwool All Insulating restructuring programmes on plan Good order input on after-market products Insulating portfolio rationalisation continuing
32 Jun-02 43% 42% 41% 40% 39% 38% Morgan Group Aug-01 Sep-01 Oct-01 Nov-01 Dec-01 Jan-02 Feb-02 Mar-02 Apr-02 May-02 Quarterly Moving Average Gross Margin % Note: Information extracted from management accounts Jul-01
33 Jun-02 53% 51% 49% 47% 45% Industrial Railway Traction Aug-01 Sep-01 Oct-01 Nov-01 Dec-01 Jan-02 Feb-02 Mar-02 Apr-02 May-02 Quarterly Moving Average Gross Margin % Note: Information extracted from management accounts Jul-01
34 Jun-02 43% 41% 39% 37% 35% Thermal Ceramics Aug-01 Sep-01 Oct-01 Nov-01 Dec-01 Jan-02 Feb-02 Mar-02 Apr-02 May-02 Quarterly Moving Average Gross Margin % Note: Information extracted from management accounts Jul-01
35 General manufacturing environment: Order visibility has shortened Variability of customer delivery schedules increased Rapid lead time requirement is a norm Morgan response Rapid delivery units established Focus on working capital reduction Cost cutting initiatives (6 sigma) now ongoing From a much more competitive base With Less sites Trading Environment Increased facilities in emerging economies Lower cost manufacture Considerable advancements in our technical product capability Continued drive for lowest cost manufacture
36 Trading Environment Need to strategically transform ourselves from - an acquisition led company to a company capable of self funded organic growth Never an easy task in good market conditions - Investment in your product development is required order books are developed Pipelines of future products have to be established This has been achieved - The portfolio has changed Customer approvals increased on enhanced technical capability Pipelines of future products are established In 2000 we saw organic growth in every business Trading recovery will be built on an increasingly competitive base
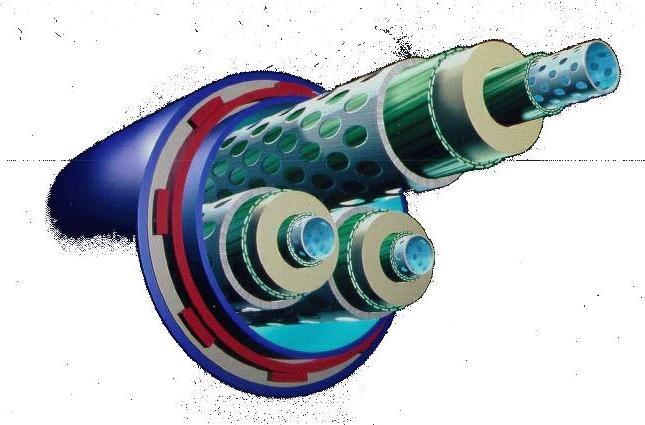
37 Applied Technology Investment has continued in our technology Customers have also been focussing on new innovations during the downturn They demand materials and products which are :- Stronger Lighter Smaller Smarter And of the highest purity. We continue to meet that requirement Developing opportunities utilising cross Morgan expertise to provide some unique solutions
38 Applied Technology Technology only makes return when properly applied to our markets Our market development focus now expanded by Bill Macfarlane to cover all 5 Morgan businesses provides Cross business market data (e.g. Medical, Aerospace, Defence.Automotive,e.t.c.) Merging of materials & products to provide innovative systems Powerful joint customer approaches Design partnership with customers Bill Macfarlane and Alan Begg are identifying considerable additional opportunities
39 Debt reduction Disposals The detailed analysis which we are conducting within all 5 businesses, identified further portfolio rationalisation Turnover approx. 70 Million Working capital reduction Real focus and continuing reductions anticipated Property disposals Site reduction and consolidation will continue Those currently available are valued at circa 20 Million Cost Reductions Clear cash generating opportunities Debt will reduce substantially
40 Outlook Timing of significant recovery remains uncertain Improved demand in second quarter Given normal seasonal order patterns, the strength of our replacement and after-sales demand positions us to achieve progress during the remainder of the year Positioned to resume profitable organic growth


41
Half-year results Six months ended 30 th June The Trusted Partner. Adrian Ringrose, Chief Executive Tim Jones, Group Finance Director
 Half-year results Six months ended 30 th June 2010 The Trusted Partner Adrian Ringrose, Chief Executive Tim Jones, Group Finance Director 10 August 2010 Overview H1 2010: trading in line with expectations
Financial & Business Highlights For the Year Ended June 30, 2017
 Financial & Business Highlights For the Year Ended June, 17 17 16 15 14 13 12 Profit and Loss Account Operating Revenue 858 590 648 415 172 174 Investment gains net 5 162 909 825 322 516 Other 262 146
2012 Full Year Results. 27 February 2013
 2012 Full Year Results 27 February 2013 Introduction Stephen Harris Chief Executive Induction hardening Used to obtain a hard case for wear resistance or to increase fatigue strength. The induction process
The Morgan Crucible Company plc Preliminary Results 20 th February 2007
 The Morgan Crucible Company plc 2006 Preliminary Results 20 th February 2007 Agenda Introduction Tim Stevenson 2006 preliminary financial results Kevin Dangerfield Our continuing progress in 2006 Mark
Investor Conference Call Q Results
 Science For A Better Life Investor Conference Call Q1 2009 Results Werner Wenning, CEO April 29 2009 Q1 2009 Investor Conference Call Werner Wenning Disclaimer This presentation may contain forward-looking
Today s presentation
 1 Today s presentation Implats Overview of results Market review Financial analysis Review of operations and expansion projects Corporate issues Prospects Barplats Review of operations 2 1 OVERVIEW OF
The Morgan Crucible Company plc 2004 Interim Results 4 August 2004
 The Morgan Crucible Company plc 2004 Interim Results 4 August 2004 Introduction Warren Knowlton 2 Agenda Introduction Interim 2004 Results Strategy and Operations 8Introduction to Magnetics Division 8Introduction
Investor Teleconference Presentation Third Quarter October 25, 2006
 Investor Teleconference Presentation October 25, 10/25/06 2 Earnings Teleconference Forward Looking Statements This document contains forward-looking statements within the meaning of the Private Securities
Domino s Pizza UK & IRL plc. Preliminary Results for the 52 weeks ended 30 December 2007
 Domino s Pizza UK & IRL plc Preliminary Results for the 52 weeks ended 30 December 2007 The Team Stephen Hemsley Executive Chairman Chris Moore Chief Executive Officer Lee Ginsberg Chief Financial Officer
Electrocomponents 2017 half-year financial results. 18 November 2016
 Electrocomponents 2017 half-year financial results 18 November 2016 Agenda Overview of results Lindsley Ruth Financial results and performance update David Egan Performance Improvement Plan Lindsley Ruth
Agenda. Results Presentation 27 February Appendices 1 to
 Results Presentation 27 February 2017 55 Agenda Results Presentation 27 February 2017 Page Presented by Chairman s overview 1 Nicholas Wrigley Review of operations 3 Jeff Fairburn Outlook 13 Jeff Fairburn
Elementis plc Preliminary Results. Year ended 31 December 2014
 Elementis plc Preliminary Results Year ended 31 December 2014 Preliminary Results $ millions 2014 2013 % change Sales 790.4 776.8 +2% Operating profit* 150.1 146.6 +2% Operating margin* 19.0% 18.9% Profit
Annual Accounts February 1, 2007 Juha Rantanen, CEO.
 Annual Accounts 2006 February 1, 2007 Juha Rantanen, CEO www.outokumpu.com Highlights in 2006 Market development Improvement actions update and strategic direction Annual Accounts 2006 Outlook 2 February
E Johnson Matthey. Presentation of Results for the year ended 31 st March rd June 2004
 Johnson Matthey Presentation of Results for the year ended 31 st March 2004 3 rd June 2004 Johnson Matthey Overview Operating profit up 9% to 206.0 million despite adverse currency effects Catalysts well
Q1 Q Q3 Q EUR million Jan-Mar 2018 Jan-Mar 2017 Change, % EUR million Jan-Dec 2017
 Stockholm, Sweden, 4 May Eltel Group Interim report January March January March Group net sales decreased 10.5% to EUR 266.6 million (297.8), mainly as a result of divestments and on-going discontinuation
Q2 FY2014 Earnings Presentation November 8, 2013
 Q2 FY2014 Earnings Presentation November 8, 2013 Important Notice Forward Looking Statements This presentation contains statements that contain forward looking statements including, but without limitation,
INTERIM RESULTS 2009
 AGENDA Overview & Operating Environment Performance Long Haul Airline Short Haul Airline Domestic Tasman & Pacific Islands Other businesses Strategy Financial Management Outlook 2 OVERVIEW Normalised earnings*
China Economic Outlook 2018 Feb 13, 2018
 Feb 13, Key Developments in Brief Economic Development Drivers of Growth Risks Predicted GDP growth of 6.5% in In 2017 growth exceeded the official target Service and modern production grow faster than
QUESTION 2. QUESTION 3 Which one of the following is most indicative of a flexible short-term financial policy?
 QUESTION 1 Compute the cash cycle based on the following information: Average Collection Period = 47 Accounts Payable Period = 40 Average Age of Inventory = 55 QUESTION 2 Jan 41,700 July 39,182 Feb 18,921
ANNOUNCEMENT OF PRELIMINARY RESULTS
 The leading high service distributor to engineers worldwide ANNOUNCEMENT OF PRELIMINARY RESULTS YEAR ENDED 31 MARCH 2009 29 May 2009 Agenda Overview and current trading Ian Mason Financial performance
AUDITED RESULTS FOR THE YEAR ENDED 31 DECEMBER 2016
 AUDITED RESULTS FOR THE YEAR ENDED 31 DECEMBER 2016 AGENDA 2 1 Opening remarks / market update 2 Financial results 3 Operational review 4 Strategy update 5 Outlook 1 2 3 4 5 OPENING REMARKS / MARKET UPDATE
Preliminary Results. 22nd February 2018
 Preliminary Results 22nd February 2018 Mark Lewis Chief Executive Officer Matthew Price Chief Financial Officer Full year themes Diversified business delivering stable returns Doing a great job for our
Half Year Results. for the six months ended 30 November January Chairman Chris Stone CEO Adam Palser CFO Brian Tenner
 Half Year Results for the six months ended 30 November 2017 16 January 2018 Chairman Chris Stone CEO Adam Palser CFO Brian Tenner Agenda Overview and strategy update Financial highlights Financial performance
HIGHLIGHTS. Normalised earnings* $96m, up $70m. Net cash position of $1.1bn. Gearing stable at 46.0% ATW Airline of the Year
 1 HIGHLIGHTS Normalised earnings* $96m, up $70m Net cash position of $1.1bn Gearing stable at 46.0% ATW Airline of the Year Unveiling of new long haul product Airpoints developments 2 * Normalised earnings
2018 Interim Presentation
 2018 Interim Presentation 26th July 2018 www.morganadvancedmaterials.com Agenda Introduction and key highlights Pete Raby 2018 interim results Peter Turner Operational and strategic update Pete Raby 2
Performance Report October 2018
 Structured Investments Indicative Report October 2018 This report illustrates the indicative performance of all Structured Investment Strategies from inception to 31 October 2018 Matured Investment Strategies
FY18 Results Presentation 31 July Thomas Beregi, CEO Michael Eadie, CFO
 FY18 Results Presentation 31 July 2018 Thomas Beregi, CEO Michael Eadie, CFO Leadership in the credit impaired consumer segment ANALYTICS & DISCIPLINE OPERATIONAL EXCELLENCE SUSTAINABILITY & COMPLIANCE
Income Statement + 3.5% + 6.7% + 7.1% EPS 187.1p 173.3p + 8.0% Ordinary interim dividend 53.0p 50.0p + 6.0% Full Price
 Income Statement m July 2015 July 2014 Total sales 1,907 1,856 Operating profit 362 339 Interest (15) (15) Profit before tax 347 324 Taxation (70) (66) Profit after tax 277 258 + 2.7% + 6.7% + 7.1% EPS
Domino s Pizza UK & IRL plc. Interim Results for the 26 weeks ended 28 June 2009
 Domino s Pizza UK & IRL plc Interim Results for the 26 weeks ended 28 June 2009 m System sales momentum 210 System sales have doubled since 2005 196.4 190 170.2 170 150 130 110 97.1 114.8 142.5 +24.1%
February Industrial Production
 Japan's Economy February Industrial Production 30 March 2018 (No. of pages: 5) Japanese report: 30 Mar 2018 Jan-Mar period expected to end in decline; production in temporary lull Economic Research Dept.
RHI Group >> Quarterly Report III/2006
 RHI Group >> Key Figures RHI Group Q1 - Q3 Change in million 2006 2005 in % Revenue 998.6 893.9 11.7 EBITDA 130.5 108.1 20.7 EBITDA margin 13.1% 12.1% 8.1 EBIT 97.5 78.3 24.5 EBIT margin 9.8% 8.8% 11.5
Results for half year ended 30 September 2018
 CARCLO PLC Results for half year ended 30 September 2018 13 November 2018 Introduction 2 Financial highlights Revenue flat at constant currency Underlying PBT down 22% due to CTP underperformance and production
FLETCHER BUILDING HALF YEAR RESULTS TO 31 DECEMBER 2012
 FLETCHER BUILDING HALF YEAR RESULTS TO 31 DECEMBER 2012 20 February 2013 Mark Adamson Chief Executive Officer Bill Roest Chief Financial Officer Page 2 Disclaimer This half year results presentation dated
2012 Preliminary Results For the year ended 31 December Proven strategy adds value to customers, delivers growth and increases resilience
 2012 Preliminary Results For the year ended 31 December 2012 Proven strategy adds value to customers, delivers growth and increases resilience Agenda Overview Financial highlights Growth Strategy Market
ITV plc Final Results th March 2009
 ITV plc Final Results 2008 4th March 2009 1 Introduction Michael Grade Executive Chairman 2 Agenda Introduction and overview Financial review Current trading and strategic update Michael Grade Ian Griffiths
Preliminary Results to March 2013 Paul Hamer, Chief Executive Officer Sean Cummins, Finance Director
 Preliminary Results to March 2013 Paul Hamer, Chief Executive Officer Sean Cummins, Finance Director Crown Copyright Group overview Strategic definition Preparation Concept design Navigate local regulations
NKT Holding. Interim Report Q Audiocast presentation 8 November 2012 at 10:00 am CET
 NKT Holding Interim Report Q3 2012 Audiocast presentation 8 November 2012 at 10:00 am CET Agenda Page Page 2 2 NKT Group Highlights Q3 2012 Financial results Q3 2012 Companies NKT Cables Nilfisk-Advance
Availability, Reliability, Ease. 11 September 2018
 Availability, Reliability, Ease 11 September 2018 LEGAL NOTICE This presentation has been prepared to inform investors and prospective investors in the secondary markets about the Group and does not constitute
AGENDA. 1. Introductory Comments. 2. Group Financial Results. 3. Business Performance. 4. Initial Impressions
 AGENDA 1. Introductory Comments 2. Group Financial Results 3. Business Performance 4. Initial Impressions 2 STRONG FUNDAMENTALS, SIGNIFICANT CHANGE, REAL OPPORTUNITY Strong fundamentals - Safety is solid
Foxtons Interim results presentation For the period ended 30 June 2018
 Foxtons Interim results presentation For the period ended 30 June 2018 Important information This presentation includes statements that are, or may be deemed to be, forward-looking statements. These forward-looking
Preliminary Results 25th February 2002
 Preliminary Results 25th February 2002 agenda Introduction - Mike Harris Operational Review - Paul Gratton Financial Results - Stacey Cartwright Outlook & Summary - Paul Gratton Slide 1 agenda Introduction
The Property Franchise Group. Half Year Results September 2016
 The Property Franchise Group Half Year Results September 2016 Agenda 2 Overview Ian Wilson, Chief Executive Officer Financial performance David Raggett, Chief Financial Officer Operational performance
XML Publisher Balance Sheet Vision Operations (USA) Feb-02
 Feb-02") Page:1 Apr-01 May-01 Jun-01 Jul-01 ASSETS Current Assets Cash and Short Term Investments 15,862,304 51,998,607 9,198,226 Accounts Receivable - Net of Allowance 2,560,786
Page:1 Apr-01 May-01 Jun-01 Jul-01 ASSETS Current Assets Cash and Short Term Investments 15,862,304 51,998,607 9,198,226 Accounts Receivable - Net of Allowance 2,560,786
Performance in January-June August 2010
 Performance in January-June 2010 12 August 2010 Jyri Luomakoski President and CEO Uponor Corporation Summary of Q2/2010 Financial turmoil after Q1 rocked the stabilising development in the market-place
2016 Full Year Results. 28 February 2017
 2016 Full Year Results 28 February 2017 Introduction Stephen Harris Group Chief Executive 2 Agenda Overview Financial review Business review Summary & Outlook 3 Overview Revenue Headline operating margin
2017 Full Year Results. Tuesday 21 November 2017
 2017 Full Year Results Tuesday 21 November 2017 Disclaimer Certain information included in the following presentation is forward looking and involves risks, assumptions and uncertainties that could cause
Credit Suisse 5 th Annual Industrials Conference November 29, 2017
 Credit Suisse 5 th Annual Industrials Conference November 29, 2017 Cindy C. Earhart Executive Vice President and Chief Financial Officer 1 / Norfolk Southern Corporation Forward-Looking Statements Certain
Parity Group PLC Interim results for the six months ended 30 June 2009
 Parity Group PLC Interim results for the six months ended 30 June 2009 Parity Group plc ( Parity or the Group ), the UK IT Services Company, is pleased to announce interim results for the six months ended
AUDITED RESULTS FOR THE YEAR ENDED 31 DECEMBER 2015
 AUDITED RESULTS FOR THE YEAR ENDED 31 DECEMBER 2015 AGENDA 2 1 Opening remarks / market update Richard 2 Financial results David 3 Operational review Richard 4 Strategy update Richard 5 Outlook Richard
Interim Report 2008/2009
 Interim Report 2008/2009 Key Points Turnover from continuing operations up 24% to 19.4 million as a result of acquiring Sifam Instruments last year (2007: 15.6 million) Gross margin fell by 3% on higher
FY16 Results Presentation
 FY16 Results Presentation 2 August 2016 Thomas Beregi, CEO Michael Eadie, CFO Competitive leadership in the credit impaired consumer segment FY16 Results Presentation 2 delivers 20% growth in 2016 FY16
Review of Membership Developments
 RIPE Network Coordination Centre Review of Membership Developments 7 October 2009/ GM / Lisbon http://www.ripe.net 1 Applications development RIPE Network Coordination Centre 140 120 100 80 60 2007 2008
Preliminary Results. *before restructuring costs, intangible amortisation, share based charges and interest rate swap charge
 Preliminary Results Tricorn Group plc (the Group ), the AIM listed tube manipulation specialist, today announces its preliminary results for the year ended 31 March 2009. Summary of results 2009 2008 change
Review of Registered Charites Compliance Rates with Annual Reporting Requirements 2016
 Review of Registered Charites Compliance Rates with Annual Reporting Requirements 2016 October 2017 The Charities Regulator, in accordance with the provisions of section 14 of the Charities Act 2009, carried
1. Executive Summary Chairman s Message Steel Industry Overview Steel Industry Outlook Standalone Financial Performance 7
 Table of Contents 1. Executive Summary 3 2. Chairman s Message 4 3. Steel Industry Overview 5 4. Steel Industry Outlook 6 5. Standalone Financial Performance 7 6. Quarterly Performance Trends 12 7. Graphite
Revenue 167.5m 177.2m EBITDA 18.1m 22.9m Operating profit 9.5m 13.7m Profit before tax 7.6m 12.2m
 HALF-YEARLY REPORT 2012 Financial Highlights Continuing operations before operational restructuring costs and asset impairments: Half year ended Half year ended 30 June 2012 30 June 2011 Revenue 167.5m
Phil Brierley, Chief Executive Chris Kelly, Group Finance Director. Preliminary Results for the year ended 30 September 2016
 Phil Brierley, Chief Executive Chris Kelly, Group Finance Director Preliminary Results for the year ended 30 September 2016 December 2016 Agenda Full year overview Strategic update Financial review Outlook
Kerry Preliminary Results Presentation
 Kerry - 2005 Preliminary Results Presentation Review of Business Hugh Friel Financial Review Brian Mehigan Business Growth Prospects Hugh Friel Q&A 2005 Performance: Key Accomplishments Good top-line and
Responsible investment in growth
 Responsible investment in growth Issued: 17 June 2014 Legal notice This presentation has been prepared to inform investors and prospective investors in the secondary markets about the Group and does not
Financial Statements Release 2017
 Financial Statements Release 217 CEO Roeland Baan CFO Chris de la Camp January 31, 218 Disclaimer This presentation contains, or may be deemed to contain, statements that are not historical facts but forward-looking
2010 Annual Results. November 2010
 2010 Annual Results November 2010 1 Agenda Highlights Group results Operational review Strategic Update 2 Highlights Operating profit up 126% Trading margin improved from 5.8% to 8.3% Sale/closure of under-performers
Lindab Group presentation Q3 2010
 lindab group presentation Lindab Group presentation Q3 2010 David Brodetsky, CEO Nils-Johan Andersson, CFO Agenda Highlights Group Business Areas Strategy Trends and outlook Q & A 2 Lindab Group Highlights
E Johnson Matthey. Presentation of Results for the half year ended 30 th September rd November 2005
 Johnson Matthey Presentation of Results for the half year ended 30 th September 2005 23 rd November 2005 Cautionary Statement This presentation contains forward looking statements that are subject to risk
Kerry Preliminary Results Presentation
 Kerry - 2006 Preliminary Results Presentation Review of Business Hugh Friel Financial Review Brian Mehigan Business Growth Prospects Hugh Friel Q&A 2006 Performance Highlights Revenue growth of 4.9% to
Rising to the challenge. PA Consulting Group Limited Highlights of PA Consulting Group s financial statements 2009
 Rising to the challenge PA Consulting Group Limited Highlights of PA Consulting Group s financial statements 2009 Report and Accounts 2009 Rising to the challenge This document is an extract from the Report
Spheria Australian Smaller Companies Fund
 29-Jun-18 $ 2.7686 $ 2.7603 $ 2.7520 28-Jun-18 $ 2.7764 $ 2.7681 $ 2.7598 27-Jun-18 $ 2.7804 $ 2.7721 $ 2.7638 26-Jun-18 $ 2.7857 $ 2.7774 $ 2.7690 25-Jun-18 $ 2.7931 $ 2.7848 $ 2.7764 22-Jun-18 $ 2.7771
FINAL RESULTS ANNOUNCEMENT. Year ended 28 February 2013
 FINAL RESULTS ANNOUNCEMENT Year ended 28 February 2013 WILDERNESS HOLDINGS AUDITED YEAR END RESULTS Agenda Welcome & board changes Parks Tafa, Chairman Review of the period to Feb 2013 Keith Vincent, Acting
News Release. Corus Group plc 2004 Interim Results. Highlights. Substantial improvement in financial performance
 News Release 16 September Ref: 242 Corus Group plc Interim Results Highlights Substantial improvement in financial performance Group operating profit improved by 204m to 147m, with the rate of progress
Paragon Banking Group PLC. Financial Results for twelve months ended 30 September 2018
 Paragon Banking Group PLC Financial Results for twelve months ended 3 September 218 218 results highlights 2 Strong financial performance and further strategic progress Strong operational performance New
Singapore Exchange Limited Building Tomorrow s Market, Today
 Singapore Exchange Limited Building Tomorrow s Market, Today Singapore Exchange SGX: Building Tomorrow s Market, Today SGX: Our Fundamentals FY2002 Half Year Results Going Forward SGX: Building Tomorrow
2017 Results Presentation
 2017 Results Presentation 27th February 2018 www.morganadvancedmaterials.com Agenda Introduction and key highlights Pete Raby 2017 results Peter Turner Operational and strategic update Pete Raby 2 Key
Interim results briefing. Jyri Luomakoski President and CEO Riitta Palomäki CFO 1 9 / 2016
 Interim results briefing Jyri Luomakoski President and CEO Riitta Palomäki CFO 1 9 / 2016 Q3/2016: Performance in Europe improved, supply issues impacted North American business July - September, M Net
Citigroup Building Materials Conference November Myles Lee Finance Director Chief Executive Designate
 Citigroup Building Materials Conference November 2008 Myles Lee Finance Director Chief Executive Designate Contents CRH Overview 2 Current Climate - Intensified Focus on Business Fundamentals 12 November
Review of the six months to 31 December 2008
 Review of the six months to 31 December 2008 Charles Brady, Chief Executive Officer Basil Brookes, Finance Director 26 th February 2009 Contents 1 Overview 2 Financial Highlights 3 4 5 Future Outlook 2
2009 Half Year Results. Analyst and shareholder briefing 18 February 2009
 2009 Half Year Results Analyst and shareholder briefing 18 February 2009 Agenda Group highlights David Deverall Financial results Roger Burrows Outlook David Deverall 1 Agenda Group highlights David Deverall
Fourth Quarter 2018 Conference Call January 22, ATI. All rights reserved.
 Fourth Quarter 2018 Conference Call January 22, 2019 Forward Looking Statements This presentation contains forward-looking statements. Actual results may differ materially from results anticipated in the
Preliminary Results for the year ended 31st December 2011
 Preliminary Results for the year ended 31 st December 2011 2011 Preliminary Results Highlights Strong organic growth of 7% Increased contribution from high growth economies Benefits from investing for
FDD FIRM STORAGE SERVICE NORTHERN NATURAL GAS COMPANY
 FDD FIRM STORAGE SERVICE NORTHERN NATURAL GAS COMPANY FIRM STORAGE SERVICE OPTIONS Northern s firm storage service is provided pursuant to the FDD Rate Schedule located in Northern s FERC Gas Tariff. The
ANGLO AMERICAN PLATINUM 2015 ANNUAL RESULTS PRESENTATION 8 FEBRUARY 2016 PLATINUM
 ANGLO AMERICAN PLATINUM 2015 ANNUAL RESULTS PRESENTATION 8 FEBRUARY 2016 PLATINUM CAUTIONARY STATEMENT Disclaimer: This presentation has been prepared by Anglo American Platinum Limited ( Anglo American
3 ABOUT CARCLO 4 HIGHLIGHTS 6 OVERVIEW OF RESULTS 10 CONDENSED CONSOLIDATED INCOME STATEMENT 11 CONDENSED CONSOLIDATED STATEMENT OF COMPREHENSIVE
 Interim 1 2018 3 ABOUT CARCLO 4 HIGHLIGHTS 6 OVERVIEW OF RESULTS 10 CONDENSED CONSOLIDATED INCOME STATEMENT 11 CONDENSED CONSOLIDATED STATEMENT OF COMPREHENSIVE INCOME 12 CONDENSED CONSOLIDATED STATEMENT
Operating earnings (EBIT) were SEK 118 million (95), which corresponds to an operating margin of 5.8% (5.3).
 were SEK 118 million (95), which corresponds to an operating margin of 5.8% (5.3).") JANUARY SEPTEMBER 2015 INTERIM REPORT Growth, improved earnings and strong order bookings third quarter Net sales reached SEK 618 million (593), up 4.1% on the same period last year. Operating earnings
JANUARY SEPTEMBER 2015 INTERIM REPORT Growth, improved earnings and strong order bookings third quarter Net sales reached SEK 618 million (593), up 4.1% on the same period last year. Operating earnings
2018 Half Year Results Presentation
 2018 Half Year Results Presentation OUR INVESTMENT PROPOSITION Fulcrum is the UK s leading design, build, own and operate utility connection services provider: National position with fully branded operating
ELECTROCOMPONENTS 2019 half-year financial results
 ELECTROCOMPONENTS 2019 half-year financial results 20 November 2018 SAFE HARBOUR This presentation contains certain statements, statistics and projections that are or may be forward-looking. The accuracy
INTERIM REPORT 1 JANUARY 31 MARCH 2015
 INTERIM REPORT 1 JANUARY 31 MARCH 2015 Quarterly period January-March, continuing Reported revenue, earnings, cash flow and financial ratios relate to continuing, and do not include Poolia UK. Revenue
1. Executive Summary Chairman s Message Steel Industry Overview Standalone Financial Performance 7
 Table of Contents 1. Executive Summary 3 2. Chairman s Message 4 3. Steel Industry Overview 5 4. Standalone Financial Performance 7 5. Consolidated Financial Performance 12 6. Segment Performance 13 7.
Availability, Reliability, Ease. 11 December 2018
 Availability, Reliability, Ease 11 December 2018 LEGAL NOTICE This presentation has been prepared to inform investors and prospective investors in the secondary markets about the Group and does not constitute
1. Executive Summary Chairman s Message Steel Industry Overview Steel Industry Outlook Standalone Financial Performance 7
 Table of Contents 1. Executive Summary 3 2. Chairman s Message 4 3. Steel Industry Overview 5 4. Steel Industry Outlook 6 5. Standalone Financial Performance 7 6. Quarterly Performance Trends 12 7. Graphite
Carclo plc ( Carclo or the Group ) Half year results for the six months ended 30 September 2018
 Half year results for the six months ended 30 September 2018") Carclo plc ( Carclo or the Group ) Half year results for the six months ended Carclo plc announces its interim results for the six months ended. Highlights Half year ended Half year ended 2017 000 000
Carclo plc ( Carclo or the Group ) Half year results for the six months ended Carclo plc announces its interim results for the six months ended. Highlights Half year ended Half year ended 2017 000 000
Fourth Quarter & Full Year 2016 Earnings Call
 Fourth Quarter & Full Year 2016 Earnings Call February 23, 2017 Rob Wagman President & Chief Executive Officer Nick Zarcone Executive Vice President & Chief Financial Officer Joe Boutross Director, Investor
FIRST HALF HIGHLIGHTS
 FIRST HALF HIGHLIGHTS Revenue at 54.6m (2006: 54.6m) Pre-exceptional gross margin at 69.9% (2006: 70.9%) Exceptional items cost reduction programme (0.6)m (2006: nil) Pre-exceptional operating profit up
Interim Results 2014
 Interim Results 2014 Ralph Findlay Chief Executive Officer Highlights 1. Good trading performance, in line with our expectations Growth in core profits in each trading segment Earnings per share up 10.8%
Looking to the medium term
 Looking to the medium term Issued: 4 September 2013 Legal notice This presentation has been prepared to inform investors and prospective investors in the secondary markets about the Group and does not
Introduction Stephen Harris
 Introduction Stephen Harris Group Chief Executive 2 Agenda Highlights Financial review Business review Summary and Outlook 3 Highlights Results 8.7% revenue growth to 368.0m 5% growth in headline operating
Key Principles Leading the Zumtobel Group as a Global Player in Professional Lighting
 Key Principles Leading the Zumtobel Group as a Global Player in Professional Lighting Introduction of the new CEO of Zumtobel Group, Ulrich Schumacher November 2013 1 AGENDA Personal introduction Positioning
Buad 195 Chapter 4 Example Solutions, Pre-Midterm Page 1 of 9
 Buad 195 Chapter 4 Example Solutions, Pre-Midterm Page 1 of 9 Example 1 4-5 page 116 Ross Pro s Sports Equipment + Projected sales... 4,800 units + Desired ending inventory... 480 (10% 4,800) Beginning
2012 Interim Results August 2012
 2012 Interim Results August 2012 Further progress despite short-term challenges... *ex de-icing and FBO exits Growth Flight Support down 2%*, Aftermarket up 11% Growth despite short-term challenges Operational
(Internet version) Financial & Statistical Report November 2018
 Financial & Statistical Report November 2018") (Internet version) Financial & Statistical Report November 2018 12/17/2018 Statement of Operations For the Period Ended November 30, 2018 (in millions) Current Month Year-to-Date Operating Revenue $ 31.4
(Internet version) Financial & Statistical Report November 2018 12/17/2018 Statement of Operations For the Period Ended November 30, 2018 (in millions) Current Month Year-to-Date Operating Revenue $ 31.4
For personal use only
 FY16 FULL YEAR RESULTS REVIEW Agenda GROUP RESULTS OVERVIEW BUSINESS UNIT REVIEW OUTLOOK Eastlands Shopping Centre BSA completed the mechanical services upgrade and extension to one 29/08/2016 BSA Limited
2016 Spring Conference And Training Seminar. Cash Planning and Forecasting
 Cash Planning and Forecasting A different world! Cash forecasting starts with expectations about future flows Uses history to identify beginning balances.and to understand patterns of how things interact
MPI Corporation (6223.TT)
") MPI Corporation (6223.TT) Credit Suisse 17th Annual Asian Technology Conference Presentation Disclaimer The information herein contains forward-looking statements. We have based these forward-looking statements
MPI Corporation (6223.TT) Credit Suisse 17th Annual Asian Technology Conference Presentation Disclaimer The information herein contains forward-looking statements. We have based these forward-looking statements