PT Ultrajaya Milk Industry & Trading Company Tbk. FY 2013 results update
|
|
|
- Erica Hodge
- 5 years ago
- Views:
Transcription


1 PT Ultrajaya Milk Industry & Trading Company Tbk. FY 2013 results update April
2 Disclaimer These materials are not intended to be a public offering document under Law of the Republic of Indonesia No.8 of 1995 on Capital Markets and its implementing regulations. Persons into whose possession these materials come are required to inform themselves about and to observe, any restrictions in distributing these materials. These materials may not be used for the purpose of an offer or an invitation in any circumstances in which such offer or invitation is not authorized. This information does not constitute and is not an offer to sell or the solicitation of an offer to buy securities (the Securities") of PT Ultrajaya Milk Industry & Trading Company Tbk (the Ultrajaya ) in the United States or elsewhere. Ultrajaya has not registered and does not intend to register the Securities under the U.S. Securities Act of 1933, as amended (the Securities Act ) and the Securities may not be offered or sold in the United States absent registration under the Securities Act or pursuant to an exemption from, or in a transaction not subject to, registration. Ultrajaya does not intend to make any public offering of the Securities in the United States or elsewhere. This document includes forward-looking statements. These statements contain the words "anticipate", "believe", "intend", "estimate", "expect, plan and words of similar meaning. All statements other than statements of historical facts included in this document, including, without limitation, those regarding Ultrajaya's financial position, business strategy, plans and objectives of management for future operations (including development plans and objectives relating to Ultrajaya's business and services) are forward-looking statements. Such forward-looking statements involve known and unknown risks, uncertainties and other important factors that could cause the actual results, performance or achievements of Ultrajaya to be materially different from results, performance or achievements expressed or implied by such forward-looking statements. Such forward-looking statements are based on numerous assumptions regarding Ultrajaya's present and future business strategies and the environment in which Ultrajaya will operate, and must be read together with those assumptions. These forward-looking statements speak only as at the date of this document. Predictions, projections or forecasts of the economy or economic trends of the markets are not necessarily indicative of the future or likely performance of Ultrajaya. Past performance is not necessarily indicative of future performance. The future financial performance of Ultrajaya is not guaranteed. You are cautioned not to place undue reliance on these forward-looking statements, which are based on the current views of Ultrajaya on future events. Ultrajaya expressly disclaims any obligation or undertaking to disseminate any updates or revisions, except as required by law, to any forward-looking statements contained herein to reflect any change in Ultrajaya's expectations with regard thereto or any change in events, conditions or circumstances on which any such statement is based. 1


")


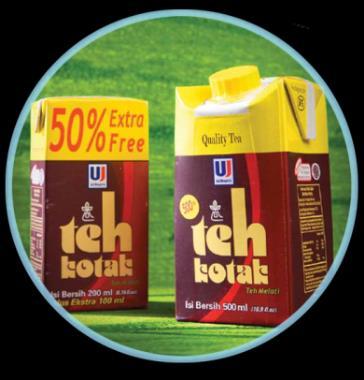
3 Key highlights Q Year on year quarterly net sales up 24.8% to Rp. 931bn Price increase of approx. 10% implemented commencing December with full effect only visible in 2014 Achieved 48% market share in UHT milk and 58% market share in RTD Tea carton pack (Nielsen, Dec 2013) Year on year quarterly gross margins declined to 25.7% due to macroeconomic pressures Steady development of recently announced dairy farm project in Sumatera (PT Ultra Sumatera Dairy Farm ("USDF")) 2
4 Key highlights FY 2013 Net sales up 23.1% to Rp. 3,460bn with strong demand for our products across the range EBITDA growth of 2.7% to Rp. 596bn despite increasing inflation levels and macroeconomic pressures Depreciation of IDR against the USD Considerable increases in international milk powder prices Mitigated by sales prices increases approx. 5% starting April and approx. 10% starting December Lower year on year contribution from associated companies (mainly Kraft / Mondelez) New initiatives with joint venture with leading Japanese Tea company Ito-En to enter the PET-bottle tea segment Announced new venture to build the country s largest dairy farm with approx. 23,000 cows, situated in North Sumatera in the Indonesian milk-belt 3


5 Section 1 Key Highlights FY
6 Financial snapshot for 4Q 2013 Sales and growth (IDR bn, %) Gross profit and margin (IDR bn, %) YoY quarter growth: 24.8% YoY quarter growth: (4.7)% 33,7% 31,5% 32,3% 28,0% 25,7% Q12 1Q13 2Q13 3Q13 4Q13 EBITDA 1 and margin (IDR bn, %) YoY quarter growth: (25.8)% 4Q12 1Q13 2Q13 3Q13 4Q13 Net income and margin (IDR bn, %) YoY quarter growth: (53.1)% 20,1% 16,8% 23,9% 15,6% 11,9% 13,4% 14,3% 11,8% 6,9% 5,0% Q12 1Q13 2Q13 3Q13 4Q13 4Q12 1Q13 2Q13 3Q13 4Q13 Note: 1 EBITDA = gross profit less selling and general & administrative expenses plus depreciation and amortization 5
7 Financial snapshot for FY 2013 Sales and growth (IDR bn, %) Gross profit and margin (IDR bn, %) Growth: 23.1% Growth: 12.4% ,1% 29,3% EBITDA 1 and margin (IDR bn, %) Growth: 2.7% Net income and margin (IDR bn, %) Growth: (7.9%) 20,6% 17,2% 12,6% 9,4% Note: 1 EBITDA = gross profit less selling and general & administrative expenses plus depreciation and amortization 6

 UHT Ultra Bendera Indomilk Milo Clevo 0 14,000,000 JUL12 AUG12 SEP12 OCT12 NOV12 DEC12 JAN13 FEB13 MAR13 APR13 MAY13")

8 Ultrajaya Maintains its Leading Market Position with award-winning brands Competitive landscape and market share 1 UHT milk volume share Market Share : LIQUID MILK UHT Nielsen Retail Audit : Period Ending DEC13 48% 2 RTD tea in carton pack volume share 58% 2 18,500,000 18,000,000 Market Share (%) ,500,000 17,000,000 16,500,000 16,000,000 15,500,000 15,000,000 14,500,000 Market Volume (L) UHT Ultra Bendera Indomilk Milo Clevo 0 14,000,000 JUL12 AUG12 SEP12 OCT12 NOV12 DEC12 JAN13 FEB13 MAR13 APR13 MAY13 JUN13 JUL13 AUG13 SEP13 OCT13 NOV13 DEC13 Volume market growth CAGR 1 Ultrajaya continues its award winning streak 32,3% 19,0% 5,3% RTD tea Liquid milk Powder milk "Ultra Milk" Top Brand 2012 Hai Youth Brand Awards 2013 for Tek Kotak Notes: 1. Source: Nielsen 2. As of Dec
9 Section 2 Key Financials 8
10 We delivered 25% sales growth for Q4 and 23% for FY 2013 Sales (IDR bn) and growth (%) Q12 4Q
11 Our segments continue to demonstrate strong growth momentum in sales Sales (IDR bn) and growth (%) Dairy Tea and Health drinks Other Q12 4Q Q12 4Q Q12 4Q
12 Gross margins decline for FY 2013 a result of a depreciation in the rupiah and increase in milk powder prices COGS breakdown (IDR bn) 1, , COGS breakdown as a % of sales As % of net sales Q12 4Q13 Direct Materials 56.0% 59.5% 53.5% 62.8% Direct Labour 0.8% 0.7% 0.7% 0.6% Depreciation 3.9% 3.3% 3.9% 3.1% Electricity and Energy 2.3% 2.2% 2.3% 2.3% Repair and Maintenance 1.4% 1.5% 1.3% 1.5% Salary and Wages 1.0% 1.0% 0.7% 0.6% Q12 4Q Others 2.4% 2.5% 3.9% 3.4% Other COGS (excl direct materials) 11.9% 11.2% 12.9% 11.5% Total COGS 67.9% 70.7% 66.3% 74.3% 2013 saw an unprecedented cost increase with raw materials up 9.3% as a % of sales Others Salary and Wages Repair and Maintenance Electricity and Energy Depreciation Direct Labour Direct Materials 11
13 Operating expenses remain under control despite a significant increase in volumes Selling expense breakdown (IDR bn, %) General and administrative expense breakdown (IDR bn, %) 15,1% 14,1% 13,0% 12,5% ,9% 3,3% 2,9% 3,4% Q12 4Q Others Logistics- Freight Out A&P % of sales Q12 4Q Others Salary % of sales 12
14 EBITDA margin under pressure given significant depreciation of FX and cost increases EBITDA (IDR bn), margins and growth (%) Growth: 2.7% Growth: (25.8%) 20.6% 17.2% % % 4Q12 Margins as a % of net sales 4Q
15 Net profit also impacted by FX and cost increases Net profits (IDR bn), margins and growth (%) Growth: (7.9%) Growth: (53.1%) 12.6% 9.4% % % 4Q12 Margins as a % of net sales 4Q
16 Financial summary Financial year ending December 31, Fourth quarter, (IDR million) Revenue 2,102,384 2,809,851 3,460, , ,649 COGS (1,476,677) (1,908,109) (2,446,448) (494,502) (691,575) Gross profit 625, ,742 1,013, , ,074 Selling expenses (361,472) (366,413) (433,577) (112,719) (130,795) General & administrative expenses (82,176) (82,695) (117,578) (21,869) (30,889) EBIT 182, , , ,392 77,391 Finance income 16,417 12,085 22,439 (6,055) (5,754) Finance cost (27,644) (11,949) (7,955) (3,088) (2,530) Other expenses (14,014) 5,200 (40,392) 23,524 (4,680) Profit before income tax 156, , , ,772 64,426 Income tax expenses (28,369) (104,538) (111,593) (30,342) (17,182) Profit after tax 128, , , ,430 47,244 Minority interest (119) (475) (290) Net income attributable to owners of the company 128, , , ,905 47,534 EBITDA 298, , , , ,342 Note: 1 EBITDA = gross profit less selling and general & administrative expenses plus depreciation and amortization 15
17 Outlook for 2014 Ultrajaya anticipates robust industry fundamentals, with a large population and increasing urbanisation driving consumer demand in the medium term Macroeconomic pressures on margins expected to ease with a stabilising IDR and gradual effect of recent sales price increases We will continue to leverage on our key strengths a leading market position with strong product development track record, and stringent quality standards to capture demand in our core UHT products Delivering on our 2014 strategies, we aim to further enhance our product development, expand our distribution platform and increase our distribution and supply capacity through further capex investments and operational efficiency initiatives 16
PT EXCELCOMINDO PRATAMA Tbk. (XL)
") PT EXCELCOMINDO PRATAMA Tbk. (XL) 1H08 Corporate Presentation July 2008 1 Agenda 1. Management team and performance highlights 2. Our strategy XL Core business XL Tower business 3. Results to date 4. Summary
PT EXCELCOMINDO PRATAMA Tbk. (XL) 1H08 Corporate Presentation July 2008 1 Agenda 1. Management team and performance highlights 2. Our strategy XL Core business XL Tower business 3. Results to date 4. Summary
October 3Q 2018/ 9M 2018 COMPANY AND FINANCIAL UPDATES 1
 October 2018 3Q 2018/ 9M 2018 COMPANY AND FINANCIAL UPDATES 1 TABLE OF CONTENT Indonesia Macro Overview 4 Q3 2018/ 9M 2018 Key Financial Highlights 6 Sales and DP/CV Mix 7 Same Store Sales Growth 8 Regional
Q Results presentation
 Q1 2016 Results presentation 12 May 2016 1 Disclaimer This presentation (the "Presentation") has been prepared and is issued by, and is the sole responsibility of Telepizza Group, S.A. ( Telepizza" or
Q Earnings Call. 30 April 2018
 Q1 2018 Earnings Call 30 April 2018 1 Table of Content Indonesia Macro Overview 4 Q1 2018 Key Financial Highlights 6 Sales and DP/CV Mix 7 Same Store Sales Growth 8 Regional GDP, Sales and SSSG 9 Gross
(Registration no C) (Registration no C) Financial Results. (unaudited) 11 November 2009
 (Registration no C) Financial Results. (unaudited) 11 November 2009") 3 rd Quarter and 9-Month 9 2009 Financial Results (unaudited) 11 November 2009 1 Important note on forward looking statements The presentation herein may contain forward looking statements by the management
3 rd Quarter and 9-Month 9 2009 Financial Results (unaudited) 11 November 2009 1 Important note on forward looking statements The presentation herein may contain forward looking statements by the management
1 Q R E S U L T S B R I E F I N G
 1 1 Q 2 0 1 7 R E S U L T S B R I E F I N G T U N G KUM H O N CEO/ D I R E C T O R 2 3 M A Y 2 0 1 7 2 Forward looking statements This document contains statements that are, or may be deemed to be, forward
Turkey s Largest Food Company
 Turkey s Largest Food Company F i r s t H a l f 2017 F i n a n c i a l R e s u l t s A u g 16, 2 0 1 7 Borsa Istanbul: ULKER ULKER.TI (Bloomberg) ULKER IS (Reuters) www.ulkerbiskuvi.com.tr Disclaimer This
XML Publisher Balance Sheet Vision Operations (USA) Feb-02
 Feb-02") Page:1 Apr-01 May-01 Jun-01 Jul-01 ASSETS Current Assets Cash and Short Term Investments 15,862,304 51,998,607 9,198,226 Accounts Receivable - Net of Allowance 2,560,786
Page:1 Apr-01 May-01 Jun-01 Jul-01 ASSETS Current Assets Cash and Short Term Investments 15,862,304 51,998,607 9,198,226 Accounts Receivable - Net of Allowance 2,560,786
Financial & Business Highlights For the Year Ended June 30, 2017
 Financial & Business Highlights For the Year Ended June, 17 17 16 15 14 13 12 Profit and Loss Account Operating Revenue 858 590 648 415 172 174 Investment gains net 5 162 909 825 322 516 Other 262 146
BOARD OF DIRECTORS. James Flude Chief Financial Officer. Peter Cheung Executive Chairman. Steve Crossley Chief Executive Officer
 ANNUAL GENERAL MEETING YEAR ENDED 30 APRIL 2016 SEPTEMBER 2016 BOARD OF DIRECTORS Peter Cheung Executive Chairman Steve Crossley Chief Executive Officer James Flude Chief Financial Officer Joanne Lake
PROTELINDO PT. SARANA MENARA NUSANTARA, Tbk. (TOWR) Indonesia s Premier Tower Company 2Q 2014 Results Presentation
 Indonesia s Premier Tower Company 2Q 2014 Results Presentation") PROTELINDO PT. SARANA MENARA NUSANTARA, Tbk. (TOWR) Indonesia s Premier Tower Company 2Q 2014 Results Presentation Disclaimer These materials have been prepared by PT Sarana Menara Nusantara, Tbk. (the
PROTELINDO PT. SARANA MENARA NUSANTARA, Tbk. (TOWR) Indonesia s Premier Tower Company 2Q 2014 Results Presentation Disclaimer These materials have been prepared by PT Sarana Menara Nusantara, Tbk. (the
Interim Results for the 6 months to 30 September NOVEMBER 2010
 Interim Results for the 6 months to 30 September 2010 8 NOVEMBER 2010 Nick Robertson Introduction Strong H1 Retail sales up 50%, group revenues up 45% Strong UK and international retail sales, up 26% and
Jakarta, 28 October M16 Results Presentation
 Jakarta, 28 October 2016 Results Presentation Highlights Inflation rate increased from 3.35% YoY (FY15) to 3.07% () Rupiah strengthened from 13,795 (FY15) to closing at 12,998 () CPO prices (CIF Rotterdam)
Indofood Sukses Makmur(INDF IJ)
") Equity Research Company Update Thursday,27 September 2018 BUY MAINTAIN Last price (IDR) 5,975 Target Price (IDR) 8,200 Upside/Downside +37.2% Previous Target Price (IDR) 8,000 Stock Statistics Sector Bloomberg
Equity Research Company Update Thursday,27 September 2018 BUY MAINTAIN Last price (IDR) 5,975 Target Price (IDR) 8,200 Upside/Downside +37.2% Previous Target Price (IDR) 8,000 Stock Statistics Sector Bloomberg
Financial Results for 1H Fiscal Year Ending December 31, August 6, 2013 Suntory Beverage & Food Limited
 Financial Results for 1H Fiscal Year Ending December 31, 2013 August 6, 2013 Suntory Beverage & Food Limited Financial Results for 1H, FY2013 Sales increased YoY due to favorable sales of core brands in
Looking to the medium term
 Looking to the medium term Issued: 4 September 2013 Legal notice This presentation has been prepared to inform investors and prospective investors in the secondary markets about the Group and does not
P r e s e n t a t i o n
 Earnings P r e s e n t a t i o n January 2018 Disclaimer Information contained in this presentation is subject to change without prior notice. Its accuracy is not guaranteed and it may not contain all
Analyst Meeting. Q3 18 and 9M18 Financial Performance
 Analyst Meeting Q3 18 and Financial Performance Disclaimer Statements included or incorporated in these materials that use the word believes, anticipate, estimate, target, or hope, or that otherwise relate
FONTERRA INTERIM RESULTS 2014
 FONTERRA INTERIM RESULTS 2014 Market Briefing FONTERRA CO-OPERATIVE GROUP LIMITED Overview John Wilson Chairman 2 Working Area Safee Copy Frame. This denotes working area and must be deleted before final
Fourth Quarter 2016 Performance Summary
 Fourth Quarter 2016 Performance Summary Operational and Financial Highlights - 2016 Net profit rises by +2.5% to Euros 545.5 million Recurring sales (excluding Raw Materials and Others) rise by +4.5% (+4.6%
Dean Foods. Earnings Report. February 11, 2009
 Dean Foods Fourth Quarter and Year End 2008 Earnings Report February 11, 2009 Forward Looking Statements The following statements made in this presentation are forward looking and are made pursuant to
Financial Industry Solutions. Second Quarter Financial Results AUGUST 9, 2018
 Financial Industry Solutions Second Quarter Financial Results AUGUST 9, Disclaimer Certain information in this presentation is forward-looking and related to anticipated financial performance, events and
Corral Q May 2017
 Corral Q1 2017 May 2017 Disclaimer This presentation has been prepared by Corral Petroleum Holdings AB (publ) and/or its subsidiaries and affiliates ( Corral ). The information contained in this presentation
Adhi Karya Company Focus
 Dec 9, 14 Adhi Karya Company Focus Maria Renata (maria.renata@trimegah.com) Cheapest infra proxy A story of the fallen angel Backed by disappointment from several default projects in the past, investors
BUY Target Price, Rp 4,350 Upside 11,9%
 Friday, 9 May 214 BUY Target Price, Rp 4,350 Upside 11,9% SMSM IJ/SMSM.JK Last Price, Rp 3,885 No. of shares (bn) 1,439 Market Cap, Rp bn 5,591 (US$ mn) 484 3M T/O, US$mn 0.2 Last Recommendation 09Jan14
Responsible investment in growth
 Responsible investment in growth Issued: 1 March 2016 Legal notice This presentation has been prepared to inform investors and prospective investors in the secondary markets about the Group and does not
The Competition Clash of Titans February - April, 2014
 The Competition Clash of Titans February - April, 2014 Goals and objectives of the Competition Clash of Titans Goal: to improve the quality of the order book for derivative instruments. Objectives: o to
Equity Research PT Eagle High Plantations Tbk
 27-May-16 27-Jun-16 27-Jul-16 27-Aug-16 27-Sep-16 27-Oct-16 27-Nov-16 27-Dec-16 27-Jan-17 27-Feb-17 27-Mar-17 27-Apr-17 Equity Research PT Eagle High Plantations Tbk 3 May 217 Plantation, Equity Price
Investor Roadshow December 2010
 Investor Roadshow December 2010 1 A Spreading Geography OPERATING TERRITORIES KEY EXPORT MARKETS 2 A Strategy For Growth Market Volume Growth 2-3% Organic Growth Developing Cold-Drink Distribution Innovation
Financial Results H1/2013
 Financial Results H1/ August 6, SHW AG pleasing Q2 results Highlights Q2/ Group sales*: 91.8m (+7.3%) Adj. EBITDA*: 11.0m (+17.1%) Adj. EBIT*: 7.7m (+19.4%) Net income from continued operations*: 4.7m
Schroder Asian Income Monthly Fund Update
 Schroder Asian Income Monthly Fund Update Fund Performance As at 30 September 2014, SGD 1 month Year to date Since launch* Schroder Asian Income Fund (Bid-Bid) (%) -1.7 8.4 35.2 Schroder Asian Income Fund
P r e s e n t a t i o n
 Earnings P r e s e n t a t i o n October 2017 Disclaimer Information contained in this presentation is subject to change without prior notice. Its accuracy is not guaranteed and it may not contain all
rhipe Limited (ASX code RHP) FY16 Full Year Results Presentation & FY 2017 Outlook
 FY16 Full Year Results Presentation & FY 2017 Outlook") rhipe Limited (ASX code RHP) FY16 Full Year Results Presentation & FY 2017 Outlook Dominic O Hanlon, CEO & Managing Director Mike Hill, Executive Chairman 1 This presentation has been prepared by rhipe
rhipe Limited (ASX code RHP) FY16 Full Year Results Presentation & FY 2017 Outlook Dominic O Hanlon, CEO & Managing Director Mike Hill, Executive Chairman 1 This presentation has been prepared by rhipe
Performance and Outlook. December 2015
 Performance and Outlook December 2015 Agenda Macro Picture Performance Highlights Q&A 2 Agenda Macro Picture Performance Highlights Fundamentals (IIP) Output conditions Inflation Rates Credit and Deposit
P r e s e n t a t i o n
 Earnings P r e s e n t a t i o n October, 2016 Disclaimer Information contained in this presentation is subject to change without prior notice. Its accuracy is not guaranteed and it may not contain all
1. Macroeconomic Highlights
 1. Macroeconomic Highlights ht Macroeconomic Highlights Resilient growth over the last 2 years, despite the global economic slowdown Banking industry robust with high level of CAR and low NPLN. In 2008
NATIONAL ALUMINIUM COMPANY LTD RESEARCH
 RESULTS REVIEW Share Data Market Cap Rs. 234.4 bn Price Rs. 363.80 BSE Sensex 16,886.43 Reuters Bloomberg Avg. Volume (52 Week) NALU.BO NACL IN 0.1 mn 52-Week High/Low Rs. 425/108.35 Shares Outstanding
1H18 Results Presentation Sid Takla Interim Chief Executive Officer Lyndal York Chief Financial Officer
 1H18 Results Presentation Sid Takla Interim Chief Executive Officer Lyndal York Chief Financial Officer 21 August 2018 Important Notice and Disclaimer This presentation has been prepared by Asaleo Care
HARNESSING STRENGTHS, DRIVING GROWTH
 HARNESSING STRENGTHS, DRIVING GROWTH ANALYST BRIEFING 22 November 2016 KH Tung Chief Executive Officer Caution Forward looking statements This document contains statements that are, or may be deemed to
Managing Global Shocks: The Case of Indonesia
 Managing Global Shocks: The Case of Indonesia Dr. Hartadi A. Sarwono Deputy Governor IIF Asian Regional Economic Forum Singapore, March 5, 2009 Outline 2 1. Crisis highlights 2. Macroconomic Condition
It s made for Sleep. It s a Sealy.
 TM It s made for Sleep. It s a Sealy. Forward-Looking Statements This document contains forward-looking statements within the meaning of the safe harbor provisions of the Securities Litigation Reform Act
INTERIM RESULTS 2009
 AGENDA Overview & Operating Environment Performance Long Haul Airline Short Haul Airline Domestic Tasman & Pacific Islands Other businesses Strategy Financial Management Outlook 2 OVERVIEW Normalised earnings*
TATA POWER COMPANY LTD RESEARCH
 RESULTS REVIEW Share Data Market Cap Rs. 239.30 bn Price Rs. 1080.50 BSE Sensex 13,769.15 Reuters TTPW.BO Bloomberg TPWR IN Avg. Volume (52 Week) 0.17 mn 52-Week High/Low Rs.1230 / 530.10 Shares Outstanding
Investors and Analysts Presentation: 9M 2010 Financial Results
 Investors and Analysts Presentation: 9M 2010 Financial Results Moscow, 30 November 2010 Disclaimer This presentation contains "forward-looking statements" which include all statements other than statements
Investor Highlight. October 2016
 Investor Highlight October 2016 Company Disclaimer Company Disclaimer This confidential document (the Presentation ) and the information contained herein do not constitute or form part of and should not
H1 16 interim results. 22 September 2015
 H1 16 interim results 22 September 2015 Important notice 2 This presentation may include certain forward-looking statements, beliefs or opinions, including statements with respect to the Company s business,
9M 2014 Results Presentation November 13, 2014
 9M 2014 Results Presentation November 13, 2014 9M 2014 key facts Sales: Euro 668.4 million +8.1% (+8.8% constant FX) Directly Operated Stores Same Store Sales: +9.4% (vs -5.7% in 9M 13) EBITDA: Euro 46.3
CTT Correios de Portugal 1H17. Results Roadshows. CTT Correios de Portugal, S.A. September
 CTT Correios de Portugal Results Roadshows CTT Correios de Portugal, S.A. September 2017 1 Disclaimer DISCLAIMER This document has been prepared by CTT Correios de Portugal, S.A. (the Company or CTT )
Corral Q August 2017
 Corral Q2 2017 August 2017 Disclaimer This presentation has been prepared by Corral Petroleum Holdings AB (publ) and/or its subsidiaries and affiliates ( Corral ). The information contained in this presentation
Flow Traders N.V. 1Q 2016 AMSTERDA M - NEW YORK - SINGAP O R E - CLUJ
 Flow Traders N.V. 1Q 2016 AMSTERDA M - NEW YORK - SINGAP O R E - CLUJ Disclaimer This presentation is prepared by Flow Traders N.V. and is for information purposes only. It is not a recommendation to engage
Financial Results for FY2017 and Strategy
 Financial Results for FY2017 and Strategy Recruit Holdings Co., Ltd. Masumi Minegishi President, CEO, and Representative Director Keiichi Sagawa CFO and Senior Managing Corporate Executive Officer May
Wika Beton (WTON IJ) BUY (Unchanged) Equity Indonesia Construction. In-line result with increased capacity. Results Note.
 BUY (Unchanged) Equity Indonesia Construction. In-line result with increased capacity. Results Note.") Wika Beton (WTON IJ) BUY (Unchanged) 03 May 2018 Results Note Equity Indonesia Construction Stock Data Target price (Rp) Rp750 Prior TP (Rp) Rp750 Shareprice (Rp) Rp464 Upside/downside (%) +61.6 Sharesoutstanding
Wika Beton (WTON IJ) BUY (Unchanged) 03 May 2018 Results Note Equity Indonesia Construction Stock Data Target price (Rp) Rp750 Prior TP (Rp) Rp750 Shareprice (Rp) Rp464 Upside/downside (%) +61.6 Sharesoutstanding
Eurozone Economic Watch. November 2017
 Eurozone Economic Watch November 2017 Eurozone: improved outlook, still subdued inflation Our MICA-BBVA model for growth estimates for the moment a quarterly GDP figure of around -0.7% in, after % QoQ
Year-end Report January December 2014
 Year-end Report January December 2014 Johan Dennelind President & CEO 4 4G population coverage now exceeds 99 percent in Sweden 4G traffic now surpasses 3G traffic in Sweden 4 new villas per hour connected
ANALYST MEETING. PT Bank Tabungan Negara (Persero) Tbk. Business & Financial Performances as of December 31, Jakarta, February 26 th 2015
 Tbk. Business & Financial Performances as of December 31, Jakarta, February 26 th 2015") ANALYST MEETING PT Bank Tabungan Negara (Persero) Tbk. Business & Financial Performances as of December 31, 2014 Jakarta, February 26 th 2015 Disclaimer IMPORTANT: The following forms part of, and should
ANALYST MEETING PT Bank Tabungan Negara (Persero) Tbk. Business & Financial Performances as of December 31, 2014 Jakarta, February 26 th 2015 Disclaimer IMPORTANT: The following forms part of, and should
2011 Interim Results. Keith Gordon, Managing Director & Chief Executive Officer Stephen Gobby, Chief Financial Officer
 2011 Interim Results Keith Gordon, Managing Director & Chief Executive Officer Stephen Gobby, Chief Financial Officer Emeco 2011 Interim Results Overview Financials Strategy & Outlook Questions Appendices
THE CURRENCY- IRANIAN RIAL (IRR)
") THE CURRENCY- IRANIAN RIAL (IRR) THE VIEW ON FX JANUARY 2018 ASSET MANAGEMENT AND PRIVATE EQUITY 1978 1979 1980 1981 1982 1983 1984 1985 1986 1987 1988 1989 1990 1991 1992 1993 1994 1995 1996 1997 1998
THE CURRENCY- IRANIAN RIAL (IRR) THE VIEW ON FX JANUARY 2018 ASSET MANAGEMENT AND PRIVATE EQUITY 1978 1979 1980 1981 1982 1983 1984 1985 1986 1987 1988 1989 1990 1991 1992 1993 1994 1995 1996 1997 1998
Algo Trading System RTM
 Year Return 2016 15,17% 2015 29,57% 2014 18,57% 2013 15,64% 2012 13,97% 2011 55,41% 2010 50,98% 2009 48,29% Algo Trading System RTM 89000 79000 69000 59000 49000 39000 29000 19000 9000 2-Jan-09 2-Jan-10
Spheria Australian Smaller Companies Fund
 29-Jun-18 $ 2.7686 $ 2.7603 $ 2.7520 28-Jun-18 $ 2.7764 $ 2.7681 $ 2.7598 27-Jun-18 $ 2.7804 $ 2.7721 $ 2.7638 26-Jun-18 $ 2.7857 $ 2.7774 $ 2.7690 25-Jun-18 $ 2.7931 $ 2.7848 $ 2.7764 22-Jun-18 $ 2.7771
Six months of FY ending December 31, (0.4) (1.9) 22.5 (0.4) (0.3) (0.4) (0.1) (0.4) (0.7) (2.0) 0.9 (1.
 (1.9) 22.5 (0.4) (0.3) (0.4) (0.1) (0.4) (0.7) (2.0) 0.9 (1.") November 11, ISEKI & CO., LTD. Supplementary Information to Consolidated Financial Results (April 1, September 30, ) I. Consolidated business results for the six months ended September 30, (Billions of
November 11, ISEKI & CO., LTD. Supplementary Information to Consolidated Financial Results (April 1, September 30, ) I. Consolidated business results for the six months ended September 30, (Billions of
ANNOUNCEMENT OF PRELIMINARY RESULTS
 The leading high service distributor to engineers worldwide ANNOUNCEMENT OF PRELIMINARY RESULTS YEAR ENDED 31 MARCH 2009 29 May 2009 Agenda Overview and current trading Ian Mason Financial performance
Big Walnut Local School District
 Big Walnut Local School District Monthly Financial Report for the month ended September 30, 2013 Prepared By: Felicia Drummey Treasurer BIG WALNUT LOCAL SCHOOL DISTRICT SUMMARY OF YEAR TO DATE FINANCIAL
Group Results Presentation for the six months ended 31 March 2016
 Group Results Presentation for the six months ended 31 March 2016 Index Overview Financial performance Operational performance Outlook 2 Overview Noel Doyle Chief Operating Officer Disclaimer Forward-looking
UBS Global Financial Services Conference May 14, Joseph Saunders, Chief Executive Officer. Byron Pollitt, Chief Financial Officer
 UBS Global Financial Services Conference May 14, 2008 Joseph Saunders, Chief Executive Officer Byron Pollitt, Chief Financial Officer Safe Harbor Reminder The following materials and management s discussion
Overview of Earnings for Q3 FY2017
 Overview of Earnings for Q3 FY217 Japan Exchange Group, Inc. January 31, 218 I. Business Developments * This document is not subject to the audit procedures required under the Financial Instruments and
2017 1Q Results. May 2017
 217 1Q Results May 217 Agenda 1. Financials 2. Market Fundamental 3. Industry Outlook 4. Plant Operation 5.Expansion 2 Financial Status (Unit: NTD Million) 4Q16 1Q17 QoQ 1Q16 YoY Revenues 152,287 164,486
Earnings Presentation FIRST QUARTER 2016
 Earnings Presentation FIRST QUARTER 2016 Agenda 1 Highlights of the period 2 Consolidated overview 3 Overview by Business Units 4 Overview by Country 5 Balance Sheet Financials 6 Q&A First Quarter Highlights
F r a s e r a n d N e a v e, L i m i t e d
 F r a s e r a n d N e a v e, L i m i t e d Important notice Certain statements in this Presentation constitute forward-looking statements, including forward-looking financial information. Such forward-looking
Economic Activity Index ( GDB-EAI ) For the month of May 2013 G O V E R N M E N T D E V E L O P M E N T B A N K F O R P U E R T O R I C O
 For the month of May 2013 G O V E R N M E N T D E V E L O P M E N T B A N K F O R P U E R T O R I C O") Economic Activity Index ( GDB-EAI ) For the month of May 2013 General Commentary May 2013 GDB-EAI for the month of May registered a 3.4% year-over-year ( YOY ) reduction May 2013 EAI was 126.7, a 3.4%
Economic Activity Index ( GDB-EAI ) For the month of May 2013 General Commentary May 2013 GDB-EAI for the month of May registered a 3.4% year-over-year ( YOY ) reduction May 2013 EAI was 126.7, a 3.4%
Performance Report October 2018
 Structured Investments Indicative Report October 2018 This report illustrates the indicative performance of all Structured Investment Strategies from inception to 31 October 2018 Matured Investment Strategies
PROTELINDO PT. SARANA MENARA NUSANTARA, TBK. (TOWR) Indonesia s Premier Telecommunication Infrastructure Company 3Q 2017 Results Presentation
 Indonesia s Premier Telecommunication Infrastructure Company 3Q 2017 Results Presentation") PROTELINDO PT. SARANA MENARA NUSANTARA, TBK. (TOWR) Indonesia s Premier Telecommunication Infrastructure Company 3Q 2017 Results Presentation Disclaimer These materials have been prepared by PT Sarana
PROTELINDO PT. SARANA MENARA NUSANTARA, TBK. (TOWR) Indonesia s Premier Telecommunication Infrastructure Company 3Q 2017 Results Presentation Disclaimer These materials have been prepared by PT Sarana
Key estimate revision. Financial summary. Year FY16E 29, % 3,583 2, FY17E 26, % 3,478 2,
 : price: EPS: How does our one year outlook change? We maintain our negative stance on SKF India due to the absence of significant growth momentum drivers over the medium term. While railways could be
Short-term indicators and Updated Forecasts. Eurozone NOVEMBER 2016
 Short-term indicators and Updated Forecasts Eurozone NOVEMBER 2016 EUROZONE WATCH NOVEMBER 2016 Key messages: resilience and unchanged projections The moderate pace of economic growth continued in the
This presentation contains forward-looking statements, which are based on current expectations and projections about future events, and include all
 This presentation contains forward-looking statements, which are based on current expectations and projections about future events, and include all statements other than statements of historical facts,
Dean Foods Third Quarter 2008 Earnings Report. November 4, 2008
 Dean Foods Third Quarter 2008 Earnings Report November 4, 2008 Forward Looking Statements The following statements made in this presentation are forward looking and are made pursuant to the safe harbor
Financial results & business update. Quarter ended 30 September October 2016
 Financial results & business update Quarter ended 30 September 2016 19 October 2016 Disclaimer 3 Any remarks that we may make about future expectations, plans and prospects for the company constitute forward-looking
Board of Directors Zurich, 24 March, 2009 Dufry Presentation - Full Year 2009 Results
 Dufry Presentation - Full Year 2009 Results March 2010 1 Legal Disclaimer Information in this presentation may involve guidance, expectations, beliefs, plans, intentions or strategies regarding the future.
2010 Annual Results. November 2010
 2010 Annual Results November 2010 1 Agenda Highlights Group results Operational review Strategic Update 2 Highlights Operating profit up 126% Trading margin improved from 5.8% to 8.3% Sale/closure of under-performers
P r e s e n t a t i o n
 Earnings P r e s e n t a t i o n April 2018 Disclaimer Information contained in this presentation is subject to change without prior notice. Its accuracy is not guaranteed and it may not contain all material
For personal use only. Investor Update. January
 1 Investor Update January 2019 www.aspermont.com The leading media services provider to the global resources industry 2 Aspermont is ASX listed with offices in Australia, UK, Brazil, North America and
Telkom (TLKM IJ) HOLD (from Buy) Recovery mostly priced-in. Equity Indonesia Telecommunication. Company Update. 28 November 2018
 HOLD (from Buy) Recovery mostly priced-in. Equity Indonesia Telecommunication. Company Update. 28 November 2018") Equity Indonesia Telecommunication Telkom (TLKM IJ) HOLD (from Buy) Stock Data Target price (Rp) Prior TP (Rp) Shareprice (Rp) Rp4, Rp4,1 Rp3,72 Upside/downside (%) +7.5 Sharesoutstanding (m) 99,62 Marketcap.
Equity Indonesia Telecommunication Telkom (TLKM IJ) HOLD (from Buy) Stock Data Target price (Rp) Prior TP (Rp) Shareprice (Rp) Rp4, Rp4,1 Rp3,72 Upside/downside (%) +7.5 Sharesoutstanding (m) 99,62 Marketcap.
AUDITED RESULTS FOR THE YEAR ENDED 31 DECEMBER 2016
 AUDITED RESULTS FOR THE YEAR ENDED 31 DECEMBER 2016 AGENDA 2 1 Opening remarks / market update 2 Financial results 3 Operational review 4 Strategy update 5 Outlook 1 2 3 4 5 OPENING REMARKS / MARKET UPDATE
Financial Data Report ROGERS AND COMPANY LIMITED (THE GROUP) for the period ending 31.Dec.2017
 for the period ending 31.Dec.2017") Financial Data Report ROGERS AND COMPANY LIMITED (THE GROUP) for the period ending 31.Dec.2017 Equity Statistics Particulars Units 29-Dec-17 Current Market Price MUR 31.30 52 week H/L* MUR 33.00 / 27.00
Financial Data Report ROGERS AND COMPANY LIMITED (THE GROUP) for the period ending 31.Dec.2017 Equity Statistics Particulars Units 29-Dec-17 Current Market Price MUR 31.30 52 week H/L* MUR 33.00 / 27.00
Earnings Call. December 19, 2017
 Earnings Call December 19, Safe Harbor This document contains forward-looking statements made pursuant to the safe harbor provisions of the Private Securities Litigation Reform Act of 1995, including forward-looking
KION UPDATE CALL Q Gordon Riske, CEO Thomas Toepfer, CFO Wiesbaden, 7 May 2015
 KION UPDATE CALL 2015 Gordon Riske, CEO Thomas Toepfer, CFO Wiesbaden, 7 May 2015 AGENDA 1 Highlights Gordon Riske 2 Market update Gordon Riske 3 Financial update Thomas Toepfer 4 Outlook Gordon Riske
PT EXCELCOMINDO PRATAMA, TBK. (XL) FY 2008
 FY 2008") PT EXCELCOMINDO PRATAMA, TBK. (XL) FY 2008 Disclaimer This document contains certain financial information and results of operation, and may also contain certain projections, plans, strategies and objectives
PT EXCELCOMINDO PRATAMA, TBK. (XL) FY 2008 Disclaimer This document contains certain financial information and results of operation, and may also contain certain projections, plans, strategies and objectives
Bendigo and Adelaide Bank
 Bendigo and Adelaide Bank FY 2009 Results August 10, 2009 This document is a presentation of general background information about the Group s activities current at the date of the presentation. It is information
Interim Report January September 2014
 Interim Report January September 2014 Johan Dennelind President & CEO Capital Markets Day summary 2018 2013 2014 2015 2016 2017 The New TeliaSonera Big changes Stabilize & shape Transform & perform Transform
Results 2Q18. August 2, 2018
 Results August 2, 2018 Highlights Indicators Var. x 2Q17 Operating Income (R$ MM) 42.8 +92.7% Operating Margin 1.8% +0.8 p.p. Net operating revenues: R$2.4 billion (+9.0% vs. 2Q17) ASK (BN) 10.7 +2.2%
PRESS RELEASE. Securities issued by Hungarian residents and breakdown by holding sectors. October 2017
 11 December 2017 PRESS RELEASE Securities issued by Hungarian residents and breakdown by holding sectors October 2017 According to securities statistics, the amount outstanding of equity securities and
JTG Consolidated financial results for 2014 and forecasts for fiscal year Naohiro Minami. CFO and Senior Vice President
 JTG Consolidated financial results for 2014 and forecasts for fiscal year 2015 Naohiro Minami CFO and Senior Vice President *Please be reminded that the figures shown on these slides may differ from those
FULL YEAR REPORT, 2017 TELEPHONE/AUDIO CONFERENCE 8 FEBRUARY 2018, AT CET TOMMY ANDERSSON, PRESIDENT AND CEO HELENA WENNERSTRÖM, EVP AND CFO
 TELEPHONE/AUDIO CONFERENCE 8 FEBRUARY 2018, AT 15.30 CET TOMMY ANDERSSON, PRESIDENT AND CEO HELENA WENNERSTRÖM, EVP AND CFO DIRECT LINK AUDIOCAST: HTTPS://TV.STREAMFABRIKEN.COM/BULTEN Q4 2017 TELECONFERENCE:
Ziggo N.V. Q Results. October 19, 2012
 Ziggo N.V. Q3 2012 Results October 19, 2012 Disclaimer This document does not constitute or form a part of any offer or solicitation to purchase or subscribe for securities in the United States or any
2016 Fourth-Quarter and Fiscal Year Performance
 206 Fourth-Quarter and Fiscal Year Performance Financial Results and Company Highlights March 4, 207 Disclaimers Forward-Looking Statements and Preliminary Results This presentation includes forward-looking
First Quarter 2018 Financial Results May 2, 2018
 First Quarter 2018 Financial Results May 2, 2018 Trademark of Trinseo S.A. or its affiliates Introductions & Disclosure Rules Introductions Chris Pappas, President & CEO Barry Niziolek, Executive Vice
Dividend Report. December 2018
 Warning: Aberdeen Global has the discretion to determine the and rate of dividend to be distributed. The dividends are not guaranteed and may be investment income, gains or at the discretion of the Board
Buad 195 Chapter 4 Example Solutions, Pre-Midterm Page 1 of 9
 Buad 195 Chapter 4 Example Solutions, Pre-Midterm Page 1 of 9 Example 1 4-5 page 116 Ross Pro s Sports Equipment + Projected sales... 4,800 units + Desired ending inventory... 480 (10% 4,800) Beginning
CorpBanca. First Quarter 2015 Financial Results
 CorpBanca First Quarter 2015 Financial Results Disclaimer 2 This Presentation contains forward-looking statements, including statements related to the planned acquisition of Helm Bank and the timing thereof.
FINANCIAL RESULTS AND COMPANY OVERVIEW Second-Quarter Performance
 FINANCIAL RESULTS AND COMPANY OVERVIEW 08 Second-Quarter Performance September 5 th, 08 Disclaimer Forward-Looking Statements and Preliminary Results This presentation includes forward-looking statements
Investor update Q3 2018
 Investor update Q3 2018 October 17, 2018 Spiced Honey has been unveiled by AkzoNobel as the Color of the Year for 2019. It was selected following expert research into global trends, insights and consumer