F r a s e r a n d N e a v e, L i m i t e d
|
|
|
- Malcolm Quinn
- 5 years ago
- Views:
Transcription


1 F r a s e r a n d N e a v e, L i m i t e d
2 Important notice Certain statements in this Presentation constitute forward-looking statements, including forward-looking financial information. Such forward-looking statements and financial information involve known and unknown risks, uncertainties and other factors which may cause the actual results, performance or achievements of F&NL, or industry results, to be materially different from any future results, performance or achievements expressed or implied by such forward-looking statements and financial information. Such forward-looking statements and financial information are based on numerous assumptions regarding F&NL s present and future business strategies and the environment in which F&NL will operate in the future. Because these statements and financial information reflect F&NL s current views concerning future events, these statements and financial information necessarily involve risks, uncertainties and assumptions. Actual future performance could differ materially from these forward-looking statements and financial information. F&NL expressly disclaims any obligation or undertaking to release publicly any updates or revisions to any forward-looking statement or financial information contained in this Presentation to reflect any change in F&NL s expectations with regard thereto or any change in events, conditions or circumstances on which any such statement or information is based, subject to compliance with all applicable laws and regulations and/or the rules of the SGX-ST and/or any other regulatory or supervisory body or agency. This Presentation includes market and industry data and forecast that have been obtained from internal survey, reports and studies, where appropriate, as well as market research, publicly available information and industry publications. Industry publications, surveys and forecasts generally state that the information they contain has been obtained from sources believed to be reliable, but there can be no assurance as to the accuracy or completeness of such included information. While F&NL has taken reasonable steps to ensure that the information is extracted accurately and in its proper context, F&NL has not independently verified any of the data from third party sources or ascertained the underlying economic assumptions relied upon therein. 2


3 Introducing F&N F&N is a leading F&B player in Southeast Asia Leading soft drinks player in Singapore and Malaysia Leading dairy player in Singapore, Malaysia and Thailand Dairies 54% FY2015 Sales Others 16% Soft Drinks Dairies Others S$2,104m Soft Drinks 30% S$639m S$1,123m S$342m FY2015 EBIT Others 19% S$132m Dairies 52% Soft Drinks Dairies Others A diverse portfolio of powerful brands Own Brands Soft Drinks 29% S$38m S$69m S$25m FY2015 Revenue by Market Others 5% Other ASEAN 26% Third Party Brands S$2,104m Singapore 22% Malaysia 47% Well-balanced and diverse beverage portfolio across multiple geographies Listed on SGX-ST; market cap of S$3.1 billion As at 13 Sep Excludes sales and revenue from Myanmar Brewery Limited which the Group divested on 19 Aug 2015 for US$560m
4 TO BE A LEADING F&B PLAYER IN SOUTHEAST ASIA STRENGTHEN MARKET POSITIONS IN CORE MARKETS OVERSEAS EXPANSION Strategy Strategy Strategy Strategy Maximise organic growth opportunity with Power Brands in Southeast Asia Drive commercial excellence and operational effectiveness Leverage strengths of strategic partners Accelerate growth through targeted acquisitions 4 Strengthen Power Brands by focusing our resources Market and sales excellence Enhance returns through value-added solutions - Getting right with pricing, go-to-market approach, communication, commercial design, etc Establish new pillars and brands Build on our strong alliances with international brands ThaiBev, Nestle, Sunkist Focus on Soft Drinks, Dairies and Beer Focus on Myanmar, Indonesia and Vietnam
5 Strengthening market positions in primary markets Retained Market Leadership Positions in Multiple Categories and Markets Business Key Brands Region Position (1) Soft Drinks Malaysia Singapore Leading beverage player No.1 in isotonic, water and soya segments; No. 2 beverage player Dairies Malaysia Singapore Thailand No.1 canned milk No.1 in pasteurised juice and canned milk; No. 2 in liquid milk No.1 canned milk Carbonated soft drinks + Isotonic market share by volume Total F&N = 48% Total F&N = 57% Total F&N = 49% Total F&N = 74% Others F&N Others Others 28% 16% 12% 17% Brand B 5% Brand A 19% 100PLUS 32% 5 1 As at YTD March 2016 (Nielsen) Canned milk market share by volume Brand B 15% Brand A 16% F&N 57% Canned milk market share by volume Brand B 10% Brand A 24% F&N 49% Isotonic market share by volume Others 10% Brand B 4% Brand A 12% 100PLUS 74%


6 Strengthening market positions in primary markets Strengthen core brands Put our resources to increase brand value and build brand loyalty of core brands 6


7 Strengthening market positions in primary markets 7
8 Regional expansion on track Considerable untapped growth potential in Southeast Asia FOCUS ON CORE MARKETS: Population of ~600M Successfully seeded products in new markets: THAILAND: Via ThaiBev s distribution network MYANMAR: Set up rep office; focusing on marketing core brands VIETNAM: Incorporated F&N Vietnam LLC; distribution and trading of nonalcoholic beverages and beer INDONESIA & PHILIPPINES: Export Malaysia Thailand Myanmar Vietnam Indonesia Philippines Population 30m 69m 54m 92m 250m 100m N5Y CAGR +1.3% +0.4% +0.8% +0.9% +0.9% +1.7% F&B Expenditure Per Capita US$1,204 US$841 N/A US$453 US$675 US$865 N5Y CAGR +2.4% +3.8% % +3.9% +3.2% 8 Source : Euromonitor. Current = Per capita consumer expenditure on food and non-alcoholic beverages Data on F&B Exp Per Cap is not available for Myanmar


9 Strengthening market positions in primary markets THB 300 MILLION RM 100 MILLION MILLION NEW FILLING AND PACKAGING LINE In Rojana, Thailand; operational in March 2016 MILLION MALAYSIA, THAILAND : INVESTING FOR FUTURE GROWTH NEW SOFT DRINKS PLANT Expansion in East Malaysia; doubling capacity; operational by Rojana dairy plant in Thailand

10 Strengthening market positions in primary markets RM 180 MILLION NEW ASEPTIC COLD-FILLING PET BOTTLE LINE Offers new formulations and packaging formats Reduces PET resin packaging material by 40% Produces 6.5 million cases per year STATE-OF-THE-ART FACILITY, Shah Alam Offers a four-fold increase in storage capacity Achieves cost efficiencies Artist s impression of the facility OPERATIONAL BY 2018 RM 30 MILLION NEW UHT LINE, Kuching Produces 3.4 million cases per year OPERATIONAL BY END
11 Strengthening market positions in primary markets EXPAND AND DEEPEN ROUTE-TO-MARKET S$ ACQUIRED VENDING MACHINE NETWORK Increased brand visibility and product availability in Singapore 29 MILLION 11 #2 vending player in Singapore Integrated vending businesses Completed in July 2016 INTEGRATION OF SOFT DRINKS AND DAIRIES OPERATIONS IN MALAYSIA Extract synergies Protect and strengthen market position Achieve critical mass Ongoing
12 Strong alliance with international brands and a strategic partner to the ThaiBev Group > > ThaiBev Group FY2015 Annual Sales S$6.7b F&N Group FY2015 Annual Sales S$2.1b > > >>>>>> NESTLE Rights to manufacture and distribute Carnation, Bear brand, Bear Brand Gold, Ideal Milk and Milkmaid in the ASEAN region THAILAND: Enhanced route-to-market and improved segment exposure ThaiBev Group One of the largest F&B players in SEA Businesses in Soft Drinks, Spirits, and Beer F&N Group Top 3 dairy player Business limited to dairy Strengthened route-to-market (supply chain and distribution) Able to capitalise on ThaiBev s strong distribution network of over 400,000 points of sale, largest in Thailand > > > > > > > SINGAPORE AND MALAYSIA: Enhanced brand portfolio ThaiBev Group One of the largest F&B players in SEA Businesses in Soft Drinks, Spirits, and Beer Enhanced brand and product offerings Launched Oishi, Thailand s leading RTD tea brand, in Malaysia and Singapore F&N Group Leading Soft Drinks and Dairy player in Singapore and Malaysia REST OF SOUTHEAST ASIA: ThaiBev Group and F&N Group - Company size matters Combined presence in over 90 countries globally >>> Strong distribution platform with 138 distributors, 80,000 outlets, 64,000 cooler units and 4,000 vending machines in Malaysia Wider portfolio; economies of scale innovation and reduce procurement costs; explore further cost synergies and cross-selling opportunities 12


13 SUMMARY 100PLUS Limited Edition Cans
14 Summary Remains a formidable and leading F&B player in SEA Comprehensive portfolio of heritage brands and innovative products A strategic partner to the ThaiBev Group Focus on Strengthening our portfolio: marketing and product innovation, and M&A Allocating resources: ensure capacities and capabilities Building on/identifying strategic partnerships and extracting synergistic opportunities 14


15 Analyst and media contact: Jennifer Yu Head, Investor Relations T: (65) E: Fraser and Neave, Limited
16 9M2016 Performance Highlights 43% 1 Profit After Tax Growth Strong operating performance in the nine-month ended 30 June 2016 ( 9M2016 ) Impacted by adverse foreign exchange effect Food & Beverage EBIT up 31%; margin improved to 10%, from 7% Dairies growth momentum continued unabated; EBIT up 66% Marketing investments in new product and market launches 16 Nine-month ended 30 June Continuing Operations; In August 2015, the Group completed the sale of its brewery in Myanmar. Upon its divestment, the operating results of this brewery were reclassified as Discontinued Operations
17 9M2016 Group Financial Highlights Revenue (millions) $1, % Profit after tax 1 (millions) $ % Dividend per share (interim) (cents) Earnings before interest and tax ( EBIT ) (millions) $ % Gearing (millions) $835.0 (net cash) 3.5% 3 Earnings per share (basic) 1,2 (cents) % 17 Nine-month ended 30 June % 1 Continuing Operations 2 Before Exceptional Items 3 As at 30 September Interim dividend was declared on 10 May 2016 and paid on 9 June 2016
18 $1m $0m $252m $226m $490m $447m $853m $814m $ 1, m $ 1, m 9M2016 Revenue Down 6.8% due to negative translation effects and competitive pricing, despite volume growth Revenue by Business Segment ($) 9M2016 Revenue by Business Segment (%) -6.8% Dairies 55% Publg & Print 15% $1,487m -4.6% -8.7% Beverages 30% -10.4% - nm - 9M15 9M16 9M15 9M16 BEVERAGES D A IRIES PUBLG & PRINT OTHERS TOTAL 9M2016 Revenue by Geography(%) Malaysia 45% Other ASEAN 28% $1,487m Others 4% 18 Nine-month ended 30 June Beverages comprises Soft Drinks and Beer 2 Publg & Print denotes Publishing & Printing Singapore 23%
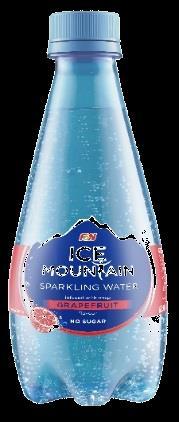
19 $ m $ m $ m -5% +24% +51% + 8% % + 18% + 9% 9M2016 Revenue Beverages Revenue declined 9% on weaker Ringgit, competitive pricing in Malaysia and loss of Red Bull sales Beverages Malaysia (-15%; -5% in constant currency) - Volume increased 7%, despite lost sales from Red Bull, due to effective execution of consumer and trade marketing programmes centred around the Lunar New Year period - Revenue impacted by weaker Ringgit, endconsumer related competitive pricing pressures and loss of Red Bull sales - Retained leadership positions in key categories Volume Growth (Key Brands) (%) 100PLUS F&N CSD ICE MOUNTAIN TOTAL Beverages Singapore and New Markets 9M2016 Revenue - Revenue grew 24%, driven by new products F&N Ice Mountain Sparkling Water, OISHI and COCO LIFE in Singapore, and 100PLUS and OISHI in Indonesia, Myanmar and Vietnam +0% -9% - Revenue growth also supported by brand building activities and channel penetration 19 Nine-month ended 30 June M2015 MSIA SIN Others 9M2016 (constant currency) FX impact 9M2016
20 +0% +3% -4% - 2% + 3% + 1% 9M2016 Revenue Dairies Revenue fell 5%, impacted by negative translation effects and higher tactical discounts Dairies Malaysia (-10%; flat in constant currency) - Impacted by weaker Ringgit and higher trade discounts given (in view of lower input costs) - Consolidated its market leadership positions for sweetened condensed milk and evaporated milk segments - Higher export sales have offset impact of lower domestic sales from cautious spending Volume Growth (%) MSIA THAI TOTAL Dairies Thailand (-1%; +3% in constant currency) - Despite lost sales from Bear and Milo UHT, revenue grew 3% in constant currency, on 3% volume growth - Supported by strong demand for its brands, strong network, increased distribution points and effective execution of trade and consumer marketing campaigns 20 Nine-month ended 30 June M2016 Revenue $180m Others $174m $397m $276m +1% $860m 9 M M S I A T H A I OTHERS 9 M FX im pact ( constant currency) -5% Thai $391m Msia $248m 9M2016
21 $252m $226m 9M2016 Revenue Publishing & Printing Retail and Distribution divisions recorded revenue gains Strong sales performance in airport retail and high street stores Higher partwork sales in Hong Kong and Singapore Publishing and Printing divisions revenue fell Slow-down in demand in Education Publishing s key markets of Latin America, USA and Singapore Lower domestic and export print volumes - 10% 9M15 9M16 21 Nine-month ended 30 June 2016
22 ($3m) ($6m) $17m $18m $38m $29m $60m $99m $112m $141m $82m 9M2016 EBIT Grew 26.0% Profit growth supported by Dairies, despite negative translation impact EBIT by Business Segment ($) 7.7% 6.5% 7.0% 9M15 EBIT Margin 9M16 EBIT Margin 12.2% 9M15 EBIT Margin 7.0% 9M16 EBIT Margin 9.5% +26.0% 9M2016 EBIT by Business Segment (%) Dairies 71% $141m Publg & Print -4% Others 13% Beverages 20% -23.1% 9M2016 EBIT by Geography (%) +65.6% 9M15 9M16 -nm- +8.6% 9M15 9M16 Malaysia 55% $141m Other ASEAN 49% 22 BEVERAGES D A IRIES PUBLG & PRINT OTHERS TOTAL Nine-month ended 30 June Beverages comprises Soft Drinks and Beer 2 Publg & Print denotes Publishing & Printing Singapore 0% Others -4%
23 9% 7% 6% 8% 8% 9% $ 3 8 m $ 3 1 m $ 2 9 m -4% -18% +36% 9M2016 EBIT Beverages Weaker Ringgit, increased pricing pressures and lost contribution from Red Bull impacted earnings Beverages Malaysia (-26%; -18% in constant currency) EBIT dropped from loss of contribution from Red Bull, increased pricing pressures and higher marketing spend on new product launches EBIT -18% -23% Beverages Singapore EBIT fell 4% due to higher marketing spend on new product launches of F&N ICE MOUNTAIN Sparkling Water, OISHI, COCO LIFE and CHANG beer 9M2015 MSIA SIN 9M2016 (organic) Others/New mkts FX impact 9M2016 Others / New Markets Strong revenue and EBIT contribution from Indonesia more than offset additional brand investment cost in new markets of Vietnam, Myanmar, Thailand and Indonesia EBIT Margin 9M15 9M16 9M15 9M16 MSIA SIN TOTAL BEVERAGES 23 Nine-month ended 30 June 2016
24 1% 3% 9% 8% 7% 16% 14% 12% % % - nm- 9M2016 EBIT Dairies Earnings surged 66%; margin expansion on the back of higher contribution from Malaysia and Thailand Dairies Malaysia (+62%; +81% in constant currency) - Driven by lower input costs - Weaker Ringgit affected extent of earnings growth - EBIT margin improved to 16%, from 9% EBIT $1m $34m $25m +66% Others $5m Thai $54m Msia $41m 9M2015 Msia T hai Others 9M2016 Dairies Thailand (+60%; +67% in constant currency) EBIT Margin - Strong profit growth supported by significant savings from input costs, lower trade discounting, increased manufacturing utilisation and efficiency and one-off cost recovery - EBIT margin improved to 14%, from 8% 24 Nine-month ended 30 June M15 9M16 9M15 9M16 M S I A T H A I O T H E R S D A I R I E S
25 ( $ 6 m ) ( $ 3 m ) 9M2016 EBIT Publishing & Printing Losses before interest and taxation increased to $5.6m on lower revenue, investments made in an e-commerce project and foreign exchange losses EBIT 9M2015 9M Nine-month ended 30 June 2016
26 Maintained a strong financial position Focused on prudent balance sheet management Reflects the Group s underlying operational results following sale of brewery in Myanmar Takes into account Group s capital position and near-term capital needs Dividend policy unchanged; an interim dividend of 1.5 cents per share was declared Dividends 39.4% 54.2% Lower dividend reflected loss of contribution from APB Capital distribution of $3.28 per share 41.0% 50.0% Key Financial Ratios 9M2016 FY2015 Total Equity 1 $2,879m $2,556m Total Assets $3,487m $3,143m Net cash $835m $865m 63.0% Capital distribution of $0.42 per share FY2011 FY2012 FY2013 FY2014 FY2015 1H2016 Interim (cents) Final (cents) Payout Ratio (%) 26 Nine-month ended 30 June Includes non-controlling interest
F&N HALF-YEAR FINANCIAL HIGHLIGHTS
 F&N HALF-YEAR FINANCIAL HIGHLIGHTS Important notice Certain statements in this Presentation constitute forward-looking statements, including forward-looking financial information. Such forward-looking
F&N Full-Year FINANCIAL HIGHLIGHTS
 F&N Full-Year FINANCIAL HIGHLIGHTS Important notice Certain statements in this Presentation constitute forward-looking statements, including forward-looking financial information. Such forward-looking
FY2018 Performance Highlights Earnings before interest and tax ( EBIT ) surged 26% to $213.5 million underpinned by broad-based growth
 surged 26% to $213.5 million underpinned by broad-based growth") F & N FY2018 Financial Highlights Important notice Certain statements in this Presentation constitute forward-looking statements, including forward-looking financial information. Such forward-looking statements
F & N FY2018 Financial Highlights Important notice Certain statements in this Presentation constitute forward-looking statements, including forward-looking financial information. Such forward-looking statements
F&N 1Q2018 Financial Highlights
 F&N Financial Highlights Important notice Certain statements in this Presentation constitute forward-looking statements, including forward-looking financial information. Such forward-looking statements
1H2018 Performance Highlights Attributable profit rose 58% to $41 million
 F & N 1 H2018 Financial Highlights Important notice Certain statements in this Presentation constitute forward-looking statements, including forward-looking financial information. Such forward-looking
Fraser & Neave, Limited Sharpening Our Focus on F&B. 27 August 2013
 Fraser & Neave, Limited Sharpening Our Focus on F&B 27 August 2013 Content Page 2 Certain statements in this Presentation constitute forward-looking statements, including forward-looking financial information.
Fraser and Neave delivers strong results in FY2014
 Fraser and Neave delivers strong results in FY2014 Revenue increased 5.5 per cent to $2,421.1 million, from $2,294.1 million PBIT 2 was $276.5 million, up 29.3 per cent from $213.9 million Attributable
Fraser and Neave posts a 26% increase in profit before interest and tax to $213m for FY2018
 Fraser and Neave posts a 26% increase in profit before interest and tax to $213m for FY2018 FY2018 revenue increased 2 per cent to $1,926.5 million FY2018 PBIT 1 rose 26 per cent to $213.5 million, underpinned
Thai Beverage PLC. FY2015 Financial Results
 Financial Results 1 Note on Forward Looking Statements The following presentation may contain forward looking statements by the management of Thai Beverage Public Company Limited ( ThaiBev"), relating
FRASER AND NEAVE, LIMITED
 FRASER AND NEAVE, LIMITED (Company Registration No. 189800001R) (Incorporated in the Republic of Singapore) FIRST QUARTER FINANCIAL STATEMENTS FOR THE PERIOD ENDED 31 DECEMBER 2015 The Directors are pleased
FRASER AND NEAVE, LIMITED
 FRASER AND NEAVE, LIMITED (Company Registration No. 189800001R) (Incorporated in the Republic of Singapore) RESULTS FOR THE YEAR ENDED 30 SEPTEMBER 2015 Financial Statements and Dividend Announcement The
THAI BEVERAGE PLC CORPORATES. No. 183/ November 2018 RATIONALE
 THAI BEVERAGE PLC No. 183/ 16 November CORPORATES Company Rating: Issue Ratings: Senior unsecured Outlook: Last Review Date : Date Rating Outlook/Alert 15/02/18 Stable Company Rating History: Date Rating
Thai Beverage PLC. 1H13 Financial Results
 Financial Results 14 Aug 2013 Note on Forward Looking Statements The following presentation may contain forward looking statements by the management of Thai Beverage Public Company Limited ( ThaiBev"),
Thai Beverage PLC. 1Q13 Financial Results
 Financial Results 14 May 2013 Note on Forward Looking Statements The following presentation may contain forward looking statements by the management of Thai Beverage Public Company Limited ( ThaiBev"),
Thai Beverage PLC. 1Q2015 Financial Results
 1Q2015 Financial Results 1 Note on Forward Looking Statements The following presentation may contain forward looking statements by the management of Thai Beverage Public Company Limited ( ThaiBev"), relating
Thai Beverage PLC. 9M 12 Financial Results
 Thai Beverage PLC 9M 12 Financial Results 20 Nov 2012 Note on Forward Looking Statements The following presentation may contain forward looking statements by the management of Thai Beverage Public Company
Thai Beverage Public Company Limited
 Thai Beverage Public Company Limited Financial Statements and Dividend Announcement for the Year Ended 30 September 2017. PART I Information Required for Full Year Announcements. 1. (a) ( i ) An income
Osotspa Public Company Limited
 Financial Highlights - Q4 18 Net profit* was at THB 789 million, +269.6% YoY. 2018 Net profit* was at THB 3,005 million, +6.1% YoY. 2018 Net profit* margin was at 12.0%, compared to 11.2% in 2017. - 2018
Thai Beverage PLC. FY18 Financial Results. (Full Year ended 30 September 2018) FY18 (Full Year ended 30 September 2018) Thai Beverage PLC
 FY18 (Full Year ended 30 September 2018) Thai Beverage PLC") Thai Beverage PLC FY18 Financial Results (Full Year ended 30 September 2018) FY18 (Full Year ended 30 September 2018) Thai Beverage PLC 1 Note on Forward Looking Statements The following presentation may
Thai Beverage PLC FY18 Financial Results (Full Year ended 30 September 2018) FY18 (Full Year ended 30 September 2018) Thai Beverage PLC 1 Note on Forward Looking Statements The following presentation may
Thai Beverage PLC. FY17 Financial Results. (Full Year Ended 30 September 2017) FY17 (Full Year Ended 30 September 2017) Thai Beverage PLC
 FY17 (Full Year Ended 30 September 2017) Thai Beverage PLC") Thai Beverage PLC FY17 Financial Results (Full Year Ended 30 September 2017) FY17 (Full Year Ended 30 September 2017) Thai Beverage PLC 1 Note on Forward Looking Statements The following presentation may
Thai Beverage PLC FY17 Financial Results (Full Year Ended 30 September 2017) FY17 (Full Year Ended 30 September 2017) Thai Beverage PLC 1 Note on Forward Looking Statements The following presentation may
Thai Beverage PLC. FY13 Financial Results
 Financial Results 27 FEB 2014 Note on Forward Looking Statements The following presentation may contain forward looking statements by the management of Thai Beverage Public Company Limited ( ThaiBev"),
Thai Beverage PLC. 9M18 Financial Results. (Nine-month ended 30 June 2018) 9M18 (Nine-month ended 30 June 2018) Thai Beverage PLC
 9M18 (Nine-month ended 30 June 2018) Thai Beverage PLC") Thai Beverage PLC 9M18 Financial Results (Nine-month ended 30 June 2018) 9M18 (Nine-month ended 30 June 2018) Thai Beverage PLC 1 Note on Forward Looking Statements The following presentation may contain
Thai Beverage PLC 9M18 Financial Results (Nine-month ended 30 June 2018) 9M18 (Nine-month ended 30 June 2018) Thai Beverage PLC 1 Note on Forward Looking Statements The following presentation may contain
Thai Beverage PLC. 1H18 Financial Results. (First Half Ended 31 March 2018) 1H18 (First Half Ended 31 March 2018) Thai Beverage PLC
 1H18 (First Half Ended 31 March 2018) Thai Beverage PLC") Thai Beverage PLC 1H18 Financial Results (First Half Ended 31 March 2018) 1H18 (First Half Ended 31 March 2018) Thai Beverage PLC 1 Note on Forward Looking Statements The following presentation may contain
Thai Beverage PLC 1H18 Financial Results (First Half Ended 31 March 2018) 1H18 (First Half Ended 31 March 2018) Thai Beverage PLC 1 Note on Forward Looking Statements The following presentation may contain
Corporate Presentation Investor Relations Third Quarter 2017
 Corporate Presentation Investor Relations Third Quarter 2017 Disclaimer Statements made in this presentation relate to CCU s future performance or financial results are forward-looking statements within
Corporate Presentation Investor Relations Fourth Quarter 2016
 Corporate Presentation Investor Relations Fourth Quarter 2016 Disclaimer Statements made in this presentation relate to CCU s future performance or financial results are forward-looking statements within
Corporate Presentation Investor Relations Second Quarter 2017
 Corporate Presentation Investor Relations Second Quarter 2017 Disclaimer Statements made in this presentation relate to CCU s future performance or financial results are forward-looking statements within
Thai Beverage PLC. 9M13 Financial Results
 Financial Results 14 Nov 2013 Note on Forward Looking Statements The following presentation may contain forward looking statements by the management of Thai Beverage Public Company Limited ( ThaiBev"),
Thai Beverage PLC. 1H16 Financial Results
 Financial Results 1 Note on Forward Looking Statements The following presentation may contain forward looking statements by the management of Thai Beverage Public Company Limited ( ThaiBev"), relating
Thai Beverage PLC. 1H17 Financial Results. (First Half Ended 31 March 2017) 1H17 (First Half Ended 31 March 2017) Thai Beverage PLC
 1H17 (First Half Ended 31 March 2017) Thai Beverage PLC") Thai Beverage PLC 1H17 Financial Results (First Half Ended 31 March 2017) 1H17 (First Half Ended 31 March 2017) Thai Beverage PLC 1 Note on Forward Looking Statements The following presentation may contain
Thai Beverage PLC 1H17 Financial Results (First Half Ended 31 March 2017) 1H17 (First Half Ended 31 March 2017) Thai Beverage PLC 1 Note on Forward Looking Statements The following presentation may contain
Dean Foods. May 2015
 Dean Foods May 2015 1 Forward-Looking Statements Some of the statements made in this presentation are forward-looking and are made pursuant to the safe harbor provision of the Private Securities Litigation
Thai Beverage PLC. 1Q16 Financial Results
 Financial Results 1 Note on Forward Looking Statements The following presentation may contain forward looking statements by the management of Thai Beverage Public Company Limited ( ThaiBev"), relating
Fraser & Neave Holdings Bhd. Analysts Briefing 9 Nov 2012
 Fraser & Neave Holdings Bhd Analysts Briefing 9 Nov 212 Financial highlights Group revenue & PBIT down 17% & % respectively due to : Coca-Cola business cessation Thai floods Timing of property launch Higher
Corporate Presentation
 Corporate Presentation The presentation herein may contain forward looking statements by the management of Best World International Ltd (BWI) that pertain to expectations for financial performance of future
PT Ultrajaya Milk Industry & Trading Company Tbk. FY 2013 results update
 PT Ultrajaya Milk Industry & Trading Company Tbk. FY 2013 results update April 2014 0 Disclaimer These materials are not intended to be a public offering document under Law of the Republic of Indonesia
1.0 Introduction on two selected companies
 1.0 Introduction on two selected companies In this subject of Financial Management 2, I will go to choose two companies which are from difference industries. The consumer product company will be selected
Etika International Holdings Ltd
 2QFY13 Results Update 17 May 2013 Outperform Current Price S$0.415 Fair Value S$0.465 Up / (downside) +12.0% Stock Statistics Market cap S$254.2m 52-low S$0.175 52-high S$0.505 Avg daily vol 2,183,012
Thai Beverage Public Company Limited
 Thai Beverage Public Company Limited Financial Statements For The Three-Month Period Ended 31 December 2017. PART I INFORMATION REQUIRED FOR THE THREE-MONTH PERIOD ENDED 31 DECEMBER (Q1) ANNOUNCEMENTS.
% Change. Revenue 24,957 13, ,265 41, Gross Profit 19,241 10, ,990 31,
 MEDIA RELEASE - FOR IMMEDIATE RELEASE Best World earnings grew 183.7 to $4.1 million Revenue increased to $75.3 million in due to higher contributions from Taiwan, Philippines, China and Singapore Strong
Varun Beverages Limited
 February 20, 2017 Varun Beverages Limited Q4 & 2016 Results Presentation Fizzy Juicy Packaged Water Disclaimer Certain statements in this communication may be forward looking statements within the meaning
Kirin Holdings. Nomura Investment Forum Tokyo - November, 2011
 Kirin Holdings Nomura Investment Forum 2011 Tokyo - November, 2011 1 Vision for an ambitious new growth trajectory KV2015 Group Vision Nurture close links with customers through products that provide the
Thai Beverage PLC. 1Q17 Financial Results. (First Quarter Ended 31 December 2016) 1Q17 (First Quarter Ended 31 December 2016) Thai Beverage PLC
 1Q17 (First Quarter Ended 31 December 2016) Thai Beverage PLC") Thai Beverage PLC 1Q17 Financial Results (First Quarter Ended 31 December 2016) 1Q17 (First Quarter Ended 31 December 2016) Thai Beverage PLC 1 Note on Forward Looking Statements The following presentation
Thai Beverage PLC 1Q17 Financial Results (First Quarter Ended 31 December 2016) 1Q17 (First Quarter Ended 31 December 2016) Thai Beverage PLC 1 Note on Forward Looking Statements The following presentation
Corporate Presentation Investor Relations Fourth Quarter 2017
 Corporate Presentation Investor Relations Fourth Quarter 2017 Disclaimer Statements made in this presentation relate to CCU s future performance or financial results are forward-looking statements within
Corporate Presentation. Investor Relations Second Quarter 2018
 Corporate Presentation Investor Relations Second Quarter 2018 Disclaimer Statements made in this presentation relate to CCU s future performance or financial results are forward-looking statements within
Reasons to Believe IR OVERVIEW 2014
 Reasons to Believe IR OVERVIEW 2014 2 Forward-Looking Statements This presentation may contain statements, estimates or projections that constitute forward-looking statements as defined under U.S. federal
John F. Brock CHAIRMAN & CEO. Nik Jhangiani SVP & CFO
 John F. Brock CHAIRMAN & CEO Nik Jhangiani SVP & CFO Forward-Looking Statements Included in this presentation are forward-looking management comments and other statements that reflect management s current
Thai Beverage Public Company Limited
 Thai Beverage Public Company Limited Financial Statements For The Three-Month Period Ended 31 December 2016. PART I INFORMATION REQUIRED FOR THE THREE-MONTH PERIOD ENDED 31 DECEMBER (Q1) ANNOUNCEMENTS.
Shaping our future. René Hooft Graafland. Member of the Executive Board/ CFO
 New York 6 March 2012 Disclaimer This presentation contains forward-looking statements with regard to the financial position and results of HEINEKEN s activities. These forward-looking statements are subject
PROPOSED DISPOSAL OF THE DAIRIES AND PACKAGING BUSINESS AND THE RELEVANT INTELLECTUAL PROPERTY
 ETIKA INTERNATIONAL HOLDINGS LIMITED (Company Registration No: 200313131Z) PROPOSED DISPOSAL OF THE DAIRIES AND PACKAGING BUSINESS AND THE RELEVANT INTELLECTUAL PROPERTY 1. INTRODUCTION The board of directors
2009 Financial Results
 Thai Beverage PLC. 2009 Financial Results 26 February 2010 Note on Forward Looking Statements The following presentation may contain forward looking statements by the management of Thai Beverage Public
Corporate Presentation. Investor Relations Third Quarter 2018
 Corporate Presentation Investor Relations Third Quarter 2018 Disclaimer Statements made in this presentation relate to CCU s future performance or financial results are forward-looking statements within
EQUITY NOTE PERFORMANCE OVERVIEW 100,000 90,000 80,000 70,000 60,000. Euro ('000) 50,000 40,000 30,000 20,000 10,000 MARKET TRENDS AND DEVELOPMENTS
 50,000 40,000 30,000 20,000 10,000 MARKET TRENDS AND DEVELOPMENTS") EQUITY NOTE 3 August 2018 COMPANY DATA Sector Ticker ISIN Food and Beverage SFC MV MT0000070103 Last Price ( ) 7.50 Market Cap. ( 000) Net Dividend Yield Price/Earnings Ratio 225,000 1.60% 16x Free-Float
EQUITY NOTE 3 August 2018 COMPANY DATA Sector Ticker ISIN Food and Beverage SFC MV MT0000070103 Last Price ( ) 7.50 Market Cap. ( 000) Net Dividend Yield Price/Earnings Ratio 225,000 1.60% 16x Free-Float
Presentation 22 August 2018
 Presentation 22 August 2018 Exceeded 3YP targets in 2017, but 2018 is challenging due to continued destocking, store closures and bankruptcies Profit attributable to shareholders (like-for-like) down 19%
FRASER AND NEAVE, LIMITED
 FRASER AND NEAVE, LIMITED (Company Registration No. 189800001R) (Incorporated in the Republic of Singapore) THIRD QUARTER FINANCIAL STATEMENTS FOR THE PERIOD ENDED 30 JUNE 2018 The Directors are pleased
4 th Quarter 2015 Financial Results
 4 th Quarter 2015 Financial Results 23 rd February 2016 Disclaimer The presentation is prepared by Super Group Ltd ( Super or the Group ) and is solely for the purpose of corporate communication and general
Analyst Meeting. Q3 18 and 9M18 Financial Performance
 Analyst Meeting Q3 18 and Financial Performance Disclaimer Statements included or incorporated in these materials that use the word believes, anticipate, estimate, target, or hope, or that otherwise relate
Half year result. 26 August 2016
 2016 Half year result 26 August 2016 Alison Watkins Group Managing Director Martyn Roberts Group Chief Financial Officer Barry O Connell MD Australian Beverages Agenda Group Result Summary Shareholder
FY10/11 Half Year Results Briefing
 Fraser & Neave Holdings Bhd FY10/11 Half Year Results Briefing 6 May 2011 Presented by : Dato Ng Jui Sia, CEO Group results Financial highlights Strong double digit growth from core F&B business Revenue
Thai Beverage PLC. 1Q18 Financial Results. (First Quarter Ended 31 December 2017) 1Q18 (First Quarter Ended 31 December 2017) Thai Beverage PLC
 1Q18 (First Quarter Ended 31 December 2017) Thai Beverage PLC") Thai Beverage PLC 1Q18 Financial Results (First Quarter Ended 31 December 2017) 1Q18 (First Quarter Ended 31 December 2017) Thai Beverage PLC 1 Note on Forward Looking Statements The following presentation
Thai Beverage PLC 1Q18 Financial Results (First Quarter Ended 31 December 2017) 1Q18 (First Quarter Ended 31 December 2017) Thai Beverage PLC 1 Note on Forward Looking Statements The following presentation
Vitasoy Announces 15% Growth in Net Sales Revenue to HK$2,783 million for FY2008/09
 For Immediate Release Vitasoy Announces 15% Growth in Net Sales Revenue to HK$2,783 million for FY2008/09 Positive Sales Growth Recorded in All Major Markets Financial Highlights For the year ended 31st
Thai Beverage Public Company Limited
 Thai Beverage Public Company Limited Financial Statements For The Three-Month Period Ended 31 December 2018. PART I INFORMATION REQUIRED FOR THE THREE-MONTH PERIOD ENDED 31 DECEMBER (Q1) ANNOUNCEMENTS.
Important Notice. The sum totals throughout this presentation may not add exactly due to rounding differences.
 Important Notice This presentation contains general information about Reliance Worldwide Corporation Limited s activities at the date of presentation (26 February 2018). It is information given in summary
Bernstein Strategic Decisions Conference John Murphy President, Asia Pacific. September 26, 2018
 Bernstein Strategic Decisions Conference John Murphy President, Asia Pacific September 26, 2018 FORWARD-LOOKING STATEMENTS This presentation may contain statements, estimates or projections that constitute
NET INCOME INCREASED 15% WITH EBITDA MARGIN GROWTH OF 70BPS IN 3Q13
 NET INCOME INCREASED 15% WITH EBITDA MARGIN GROWTH OF 70BPS IN 3Q13 Monterrey, Mexico, October 28, 2013 Arca Continental, S.A.B. de C.V. (BMV: AC*), the second-largest Coca-Cola bottler in Latin America
FULL-YEAR RESULTS 2007 & OUTLOOK
 FULL-YEAR RESULTS 2007 & OUTLOOK Presentation by: President & CEO Niels Henrik Jensen Group CFO Michael Østerlund Madsen 28 February 2008 Copenhagen AGENDA Group highlights 2007 Performance Foods Industrial
- supplement 1 - FY2017 Consolidated Financial Results Highlight. Summary of Statement of Profit or Loss. Reference data
 FY2017 Consolidated Financial Results Highlight Summary of Statement of Profit or Loss Revenue 2,084.9 1,706.9 378.0 22.1% Domestic Business 1,072.2 1,058.2 14.0 1.3% Overseas Business 517.2 222.9 294.3
Petra Foods reports PATMI of US$15.2 million in 1H 2015
 FOR IMMEDIATE RELEASE Petra Foods reports PATMI of US$15.2 million in 1H Own Brands sales continue to form more than 60% of revenue, underlining the success of the Group s product innovation and extension
FRASER AND NEAVE, LIMITED
 FRASER AND NEAVE, LIMITED (Company Registration No. 189800001R) (Incorporated in the Republic of Singapore) RESULTS FOR THE YEAR ENDED 30 SEPTEMBER 2018 Financial Statements and Dividend Announcement The
Corporate Presentation
 Corporate Presentation 1 Disclaimer During this presentation management may discuss certain forwardlooking statements concerning Arca Continental s future performance that should be considered as good-faith
SABMiller plc US annual results presentation Year ended March 31, 2014
 SABMiller plc US annual results presentation Year ended March 31, 2014 Presented by Jamie Wilson, Chief Financial Officer Gary Leibowitz, SVP Internal & Investor Engagement Forward looking statements This
SABMiller plc. Interim results Half year ended 30 September November 2005 also available on website
 SABMiller plc Interim results Half year ended 30 September 2005 10 November 2005 also available on website www.sabmiller.com Forward-looking statements This presentation includes forward-looking statements.
Etika International Holdings Ltd
 1QFY13 Results Update 14 February 2013 Outperform Current Price Fair Value Stock Statistics S$0.415 S$0.475 Market cap S$253.8m 52-low S$0.175 52-high S$0.505 Avg daily vol 1,720,764 No. of share 611.7mil
JOHN F. BROCK CHAIRMAN & CEO NIK JHANGIANI SVP & CFO
 JOHN F. BROCK CHAIRMAN & CEO NIK JHANGIANI SVP & CFO Forward-Looking Statements Included in this presentation are forward-looking management comments and other statements that reflect management s current
THAI BEVERAGE. 1Q19 Financial Results. 1Q19 (First Quarter Ended 31 December 2018)
") THAI BEVERAGE 1Q19 Financial Results (First Quarter ended 31 December 2018) 1Q19 (First Quarter Ended 31 December 2018) Note on Forward Looking Statements The following presentation may contain forward
THAI BEVERAGE 1Q19 Financial Results (First Quarter ended 31 December 2018) 1Q19 (First Quarter Ended 31 December 2018) Note on Forward Looking Statements The following presentation may contain forward
2016 Results. 28 February Analyst Briefing
 2016 Results 28 February 2017 Analyst Briefing 1 FORWARD-LOOKING STATEMENTS Certain statements contained in this presentation maybe viewed as forward-looking statements. Such forwardlooking statements
Bank of America Merrill Lynch 2015 Paper, Packaging and Builders Conference Owens-Illinois, Inc. December 10, 2015
 Bank of America Merrill Lynch 2015 Paper, Packaging and Builders Conference Owens-Illinois, Inc. December 10, 2015 Safe harbor comments Regulation G The information presented here regarding adjusted net
The Directors are pleased to release the unaudited quarterly financial report for the quarter and six months ended 31 March 2017.
 . (Company No: 004205-V, Incorporated in Malaysia) Level 3A, F&N Point, No. 3 Jalan Metro Pudu 1, Fraser Business Park, Off Jalan Yew, 55100 Kuala Lumpur, Malaysia Tel: 03-92352288 Fax: 03-92227878 For
2015 Full Year Results Presentation
 2015 Full Year Results Presentation 17 February 2016 Disclaimer: This material should be read as an overview of OCBC s current business activities and operating environment. It should not be solely relied
The J.M. Smucker Company
 The J.M. Smucker Company CONSUMER ANALYST GROUP OF NEW YORK CONFERENCE February 21, 2018 Strategy and Business Update Mark Smucker President and Chief Executive Officer Financial Update Mark Belgya Vice
The Directors are pleased to release the unaudited quarterly financial report for the quarter and financial year ended 30 September 2017.
 . (Company No: 004205-V, Incorporated in Malaysia) Level 3A, F&N Point, No. 3 Jalan Metro Pudu 1, Fraser Business Park, Off Jalan Yew, 55100 Kuala Lumpur, Malaysia Tel: 03-92352288 Fax: 03-92227878 For
BreadTalk Group delivers strong year-end performance Records 91.0% year-on-year net profit increase
 Key Highlights: BreadTalk Group delivers strong year-end performance Records 91.0% year-on-year net profit increase Group FY2017 PATMI increased 91.0% Y/Y to $21.8m Net profit margin rose from 1.9% to
Strategic Investment in Bank Danamon. December 26, 2017
 Strategic Investment in Bank Danamon December 26, 2017 This document contains forward-looking statements in regard to forecasts, targets and plans of PT Bank Danamon Indonesia, Tbk. and its group companies
Etika International Holdings Ltd
 Results Update Neutral Current Price 5 December 2011 Fair Value Source: Bloomberg S$0.265 S$0.28 Angelia Phua 65-62366-802 angelia.phua@nracapital.com Historical Chart Source : Bloomberg Stock Statistics
FRASER AND NEAVE, LIMITED
 FRASER AND NEAVE, LIMITED (Company Registration No. 189800001R) (Incorporated in the Republic of Singapore) RESULTS FOR THE 2ND QUARTER ENDED 31 MARCH 2018 Financial Statements and Dividend Announcement
Fraser and Neave, Limited. CLSA Investors Forum 2012 (Hong Kong) September, 2012
 September, 2012") Fraser and Neave, Limited CLSA Investors Forum 2012 (Hong Kong) 13 14 September, 2012 Important notice Certain statements in this Presentation constitute forward-looking statements, including forward-looking
Fraser and Neave, Limited CLSA Investors Forum 2012 (Hong Kong) 13 14 September, 2012 Important notice Certain statements in this Presentation constitute forward-looking statements, including forward-looking
FRASER AND NEAVE, LIMITED
 FRASER AND NEAVE, LIMITED (Company Registration No. 189800001R) (Incorporated in the Republic of Singapore) FIRST QUARTER FINANCIAL STATEMENTS FOR THE PERIOD ENDED 31 DECEMBER 2017 The Directors are pleased
Company Overview 2008
 Company Overview 2008 Safe Harbor Statement During this presentation management may discuss certain forwardlooking statements concerning FEMSA s future performance that should be considered as good faith
RESULTS FOR THE QUARTER ENDED
 RESULTS FOR THE QUARTER ENDED 30 SEPTEMBER 2011 1. BUSINESS OVERVIEW BUSINESS SEGMENTS ARA ASSET MANAGEMENT LIMITED Business Segments REITs Private Real Estate Funds Real Estate Management Services Corporate
Safe harbor statement
 Safe harbor statement During this presentation management may discuss certain forwardlooking statements concerning FEMSA s future performance that should be considered as good faith estimates made by the
FORWARD-LOOKING STATEMENTS
 1 FORWARD-LOOKING STATEMENTS This document may contain statements, estimates or projections that constitute forward-looking statements concerning the financial condition, performance, results, strategy
Kirin Group Medium-term Business Plan. Restructure and revitalize Kirin, groupwide. February, Kirin Holdings Company Limited
 Kirin Group 2016-2018 Medium-term Business Plan Restructure and revitalize Kirin, groupwide February, 2016 Kirin Holdings Company Limited Current situation Started reforms, 2015 set as year zero of the
Corporate Presentation Nov 2017
 Corporate Presentation Nov 2017 Forward Looking Statements The material that follows presents general background information about Organización Cultiba, S.A.B. de C.V. ( CULTIBA or the Company ) as of
SABMiller plc. Full year results Twelve months ended 31 March Jamie Wilson, Chief Financial Officer Gary Leibowitz, SVP, Investor Relations
 SABMiller plc Full year results Twelve months ended 31 March 2012 Jamie Wilson, Chief Financial Officer Gary Leibowitz, SVP, Investor Relations 24 May 2012 Forward looking statements This presentation
Britvic plc. Preliminary Results 2011
 Britvic plc Preliminary Results 2011 Gerald Corbett Chairman John Gibney Group Finance Director Agenda Financial performance John Gibney Britvic and the market review Paul Moody Group performance +14.6%
Results for the Fourth Quarter ended 31 December 2017
 Results for the Fourth Quarter ended 31 December 2017 Athens, Greece, 25 April 2018 Frigoglass SAIC ( Frigoglass or we or the Group ) announces results for the quarter and full year ended 31 December 2017
United Overseas Bank Investor Roadshow November 2006
 United Overseas Bank Investor Roadshow November 2006 Disclaimer : This material that follows is a presentation of general background information about the Bank s activities current at the date of the presentation.
ANADOLU EFES - FY2014 Results Conference Call Presentation. Damian Gammell - CEO Onur Çevikel - CFO
 ANADOLU EFES - FY2014 Results Conference Call Presentation Damian Gammell - CEO Onur Çevikel - CFO March 6, 2015 Forward-Looking Statements This presentation may contain certain forward-looking statements
The Directors are pleased to release the unaudited quarterly financial report for the three months ended 31 December 2015.
 . (Company No: 004205-V, Incorporated in Malaysia) Level 8, F&N Point, No. 3 Jalan Metro Pudu 1, Fraser Business Park, Off Jalan Yew, 55100 Kuala Lumpur, Malaysia Tel: 03-92352288 Fax: 03-92227878 For
Standard Chartered PLC - Interim management statement
 1 November 2017 Standard Chartered PLC - Interim management statement Standard Chartered PLC (the Group) today releases its Interim Management Statement for the three months 30 September 2017. All figures
PRESENTATION ON 2018 INTERIM RESULTS
 Hong Kong Exchanges and Clearing Limited and The Stock Exchange of Hong Kong Limited takes no responsibility for the contents of this announcement, makes no representation as to its accuracy or completeness
REVISED PRESENTATION ON 2016 THIRD QUARTERLY RESULTS
 Hong Kong Exchanges and Clearing Limited and The Stock Exchange of Hong Kong Limited takes no responsibility for the contents of this announcement, makes no representation as to its accuracy or completeness