Presentation 22 August 2018
|
|
|
- Maryann Berry
- 5 years ago
- Views:
Transcription

1 Presentation 22 August 2018
2 Exceeded 3YP targets in 2017, but 2018 is challenging due to continued destocking, store closures and bankruptcies Profit attributable to shareholders (like-for-like) down 19% Highlights Divestment of Product Verticals brought in US$1.1B of cash Trade war has minimal impact on our business and mitigated by our 50+ countries of production Announced an aggressive plan to bring greater focus on customers, business development, production platform and digital initiatives Seeking IPO for Logistics business to enhance its growth 2018 Interim Results I LI & FUNG 1
3 Three-Year Plan Goal 2
4 Three-Year Plan Goal Our goal is to create the supply chain of the future to help our customers navigate the digital economy and to improve the lives of one billion people in the supply chain Interim Results I LI & FUNG 3
5 Mid-way through the 3YP 3YP Financial Targets Announced in Mar 2017 The Group Target Top Line Stabilize Growth Low double-digit by 2019 (1) COP Stabilize Growth Low double-digit CAGR COP Margin Stabilize Growth 50+ bps by 2019 Additional Capex $150M for Digitalization over 3 years (1) Low double-digit total growth from 2016 to 2019 period; single-digit CAGR 2018 Interim Results I LI & FUNG 4
6 Simplifying Our Business Asia Consumer & Healthcare Distribution Business Product Verticals Spin-off Strategic Divestment Strategic Divestment Distribution in Specie US$350m US$1.1B 2018 Interim Results I LI & FUNG 5
7 Business Simplification & Turnover Evolution US$ Li & Fung Today 20.7B 13.5B 1.2B 1.9B 1.2B 6.4B Divestment + Spin off 3.3B 3.3B 3.3B GBG Spin off Strategic Divestment: Asia Consumer & Healthcare Distribution Strategic Divestment: Product Verticals 2018 Interim Results I LI & FUNG 6
8 2018 Interim Financial Results 7
9 2018 Interim Results Highlights 1H 2018 US$m 1H 2017 US$m (restated) 1 Change % Turnover 5,850 6,471 (9.6%) Total Margin (4.4%) As % of Turnover 10.5% 9.9% Operating Costs (0.2%) As % of Turnover 8.4% 7.6% Core Operating Profit (18.0%) As % of Turnover 2.1% 2.3% Adjusted Profit Attributable to Shareholders (like-for-like) (2) (19.2%) Turnover fell by 9.6% due to continued destocking, retail store closures, & bankruptcies Low single digit deflation Total margin percentage up 60 basis points to 10.5% Operating costs flat despite investment in Logistics business growth Core operating profit (COP) fell by 18% Profit attributable to shareholders (like-for-like) decreased by 19% (1) Restated historical financials to reflect the three Product Verticals presented as discontinued operations (2) Profit Attributable to Shareholders - Continuing Operations excluding write-back of Acquisition Payable 2018 Interim Results I LI & FUNG 8
10 2018 Interim Results Net Profit Analysis 1H2018 US$m 1H2017 US$m (Restated) 1 Change % Core Operating Profit (18.0%) Continuing Operations w/o Product Verticals Profit for the Year Perpetual distributions (29) (32) Profit Attributable to Shareholders excl.: Write-back of Acquisition Payable - 30 Adjusted Profit Attributable to Shareholders (19.2%) Discontinued Operations - Profit/(loss) Attributable to Shareholders (135) 10 Adjusted Profit attributable to shareholders decreased by 19% from US$62m to US$50m on a likefor-like basis o 1H17 included US$30m gains on write-back Discontinued Operations loss of US$135m in 2018 includes: o o US$21m operating loss from Product Verticals during first 3 months of 2018 US$114m disposal loss primarily triggered by non-cash foreign exchange reserve translation 2 (1) Restated historical financials to reflect the three Product Verticals presented as discontinued operations (2) The losses were mainly triggered by the realization of prior period foreign exchange non-cash translation losses in the the Group equity account at the time of closing in Interim Results I LI & FUNG 9
11 Supply Chain Solutions 1H H 2017 Change US$m US$m % Turnover 4,560 5,326 (14.4%) Total Margin (15.5%) As % of Turnover 6.5% 6.6% Operating Costs (9.8%) As % of Turnover 4.9% 4.6% Core Operating Profit (29.1%) As % of Turnover 1.6% 2.0% Turnover fell by 14.4% due to continued destocking, retail store closures and bankruptcies Low single digit deflation Strong growth in off-price segment and hard goods categories Customers starting to embrace our speed and digital modules Operating costs decreased by 10% COP fell by 29% and COP margin declined 40 basis points to 1.6% 2018 Interim Results I LI & FUNG 10
12 Logistics 1H H 2017 Change US$m US$m % Turnover % Total Margin % As % of Turnover 35.0% 34.0% Operating Costs % As % of Turnover 28.1% 27.3% Core Operating Profit % As % of Turnover 6.9% 6.7% Turnover increased by 11% driven by market share gains, geographical expansion and success in new markets Market weakness in freight rates impacted turnover Robust consumption growth in Asia provided strong impetus to in-country logistics, particularly e- logistics COP increased by 15% and COP margin improved 20 basis points to 6.9% 2018 Interim Results I LI & FUNG 11
13 Onshore Wholesale 1H H 2017 Change US$m US$m % Turnover % Total Margin % As % of Turnover 16.6% 18.4% Operating Costs % As % of Turnover 15.0% 16.3% Core Operating Profit (12.9%) As % of Turnover 1.6% 2.1% Turnover increased by 13% due to recovery from selected customers and ramp of Asia business Total margin percentage declined by 180 basis points to 16.6% due to highly promotional retail and weak UK consumer sentiment COP fell by 13% and COP margin declined 50 basis points to 1.6% 2018 Interim Results I LI & FUNG 12
14 Capital Structure Jun 2018 US$m Dec 2017 US$m Bonds Bank Loans Total Debt Cash Net Debt Total Equity 1,843 2,914 Total Capital 1 2,304 3,342 Gearing Ratio 2 20% 13% Maintained strong balance sheet and similar net debt level of US$462m Redeemed US$500m perpetual capital securities in May 2018 Conservative gearing ratio of 20% despite reduction of US$1b in total capital due to special dividend and perpetual securities redemption Total available bank facilities was US$1.6b with US$1.56b undrawn, of which US$827m was committed lines (1) Sum of net debt and total equity (2) Net debt divided by total capital 2018 Interim Results I LI & FUNG 13
15 Dividend Policy Dividend payout ratio tied to Profit to Shareholders Target 50-70% payout ratio Declared interim dividend per share of 3 HK cents 2018 Interim Results I LI & FUNG 14
16 Our Response to The Changing Environment 15
17 Aggressive Plan to Respond to Changing Environment Challenges What s Needed Responses Customer needs are changing Bring greater focus on core customers Reorganized account management teams Production base shifting Improve global KPIs & productivity Chief Operating Officer to lead global production platform End-to-End Digital Supply Chain Speed up development Chief Digital Officer to accelerate digitalization 2018 Interim Results I LI & FUNG 16
18 Focused Reorganization Customers Focus Front End Account Management Business Development Digital Platform Back End Production Platform (Operational Excellence) 2018 Interim Results I LI & FUNG 17


19 Business Development Progress New Customers $1 Billion+ Prospective Potential Customers Speed Innovation Digitalization Data Analytics Productivity Supply Chain Solutions Global Business Development LF Ecosystem 2018 Interim Results I LI & FUNG 18

20 Diversified Sourcing Strategy Global network of 50+ production countries to mitigate US-China trade war Americas Europe Africa Asia years of long term relationships with local vendors and business community Proven ability to move quickly between countries of production Brazil Canada El Salvador Guatemala Haiti Mexico Nicaragua USA Venezuela Austria France Germany Italy Latvia Luxembourg Macedonia Poland Portugal Romania Spain Switzerland Turkey Ukraine UK Egypt Kenya Lesotho Madagascar Mauritius Tunisia Australia Bangladesh Cambodia China Hong Kong India Indonesia Israel Japan Jordan Macau Malaysia Myanmar Pakistan Philippines Korea Singapore Sri Lanka Taiwan Thailand Vietnam 2018 Interim Results I LI & FUNG 19

21 Diversification away from China Total Sourcing Business from China 2016: 54% 2017: 53% 2018: 49% Apparel Footwear Hardgoods From China to these countries: Bangladesh Vietnam India Pakistan Central America Jordan Philippines Turkey Vietnam India Indonesia Italy Spain Eastern Europe Cambodia Indonesia Philippines Taiwan 2018 Interim Results I LI & FUNG 20

22 US-China Trade War The US announced plans to raise tariffs of up to 25% on a range of products made in China worth US$200B. could take effect on Jul 6 Aug 7 Aug 31 No. of tariff Lines: ,031 Amount Impacted: US$34B US$16B US$200B Additional Tariff %: 25% 25% 10% or 25% Impact to LF Turnover: 0 0 < 2% 2018 Interim Results I LI & FUNG 21


23 Case Study Production Migration Over a 5-year horizon, lower China dependency to offset cost pressure Continue to expand in Vietnam, India, Bangladesh and Indonesia 2018 Interim Results I LI & FUNG 22
24 Three-Year Plan Themes 23
25 Our 3YP Core Themes Speed Innovation Digitalization Data Analytics Productivity Supply Chain Solutions Global Business Development LF Ecosystem 2018 Interim Results I LI & FUNG 24


26 Speed GOAL 12/2019 6/2018 1/ weeks 30 weeks 40 weeks Stabilize Lead time 10 weeks 50% achieved Speed Innovation Digitalization Data Analytics Productivity Supply Chain Solutions Global Business Development LF Ecosystem 2018 Interim Results I LI & FUNG 25
27 Destocking Illustration Customer Turnover Inventory Replenishment (Customer Order) Year 1 Year 2 Year 3 Year 4 Year 5 Year 6 Year 7 Destocking 2018 Interim Results I LI & FUNG 26
28 Destocking I Customers at Different Stages Customer A Customer B Customer C Customer D Year Year Year Year Year Year Year Customer Turnover Customer Order 2018 Interim Results I LI & FUNG 27


29 3D Virtual Design Team size: 5X Customers: 10X No. of Design Style: 40X Speed Innovation Digitalization Data Analytics Productivity Supply Chain Solutions Global Business Development LF Ecosystem 2018 Interim Results I LI & FUNG 28


30 LF Ecosystem Our ecosystem of partners reaches more than $2 Trillion dollars of retail sales Areas of focus 3D Virtual Design Automation Blockchain Supply Chain Solutions Types of partnership Licenses Strategic Alliances Joint Ventures Investments Speed Innovation Digitalization Data Analytics Productivity Supply Chain Solutions Global Business Development LF Ecosystem 2018 Interim Results I LI & FUNG 29
31 LF Logistics 30
32 Li & Fung Logistics IPO Enhance growth of the Logistics business 494.HK Further strengthen the Group s capital structure Controlling shareholder LF Logistics (To be listed on HKEx) 1 Public Float 494 HK will remain controlling shareholder and consolidate Logistics results Already engaged third-party advisors for the spin-off and listing applications Expect listing in 1H Spin-off and listing are subject to HKEx approval 2018 Interim Results I LI & FUNG 31
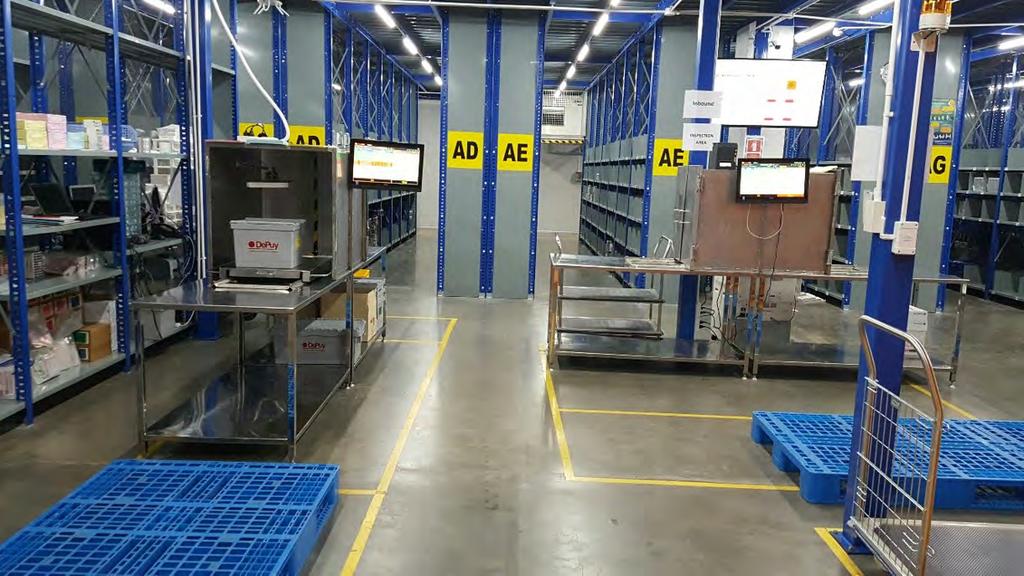
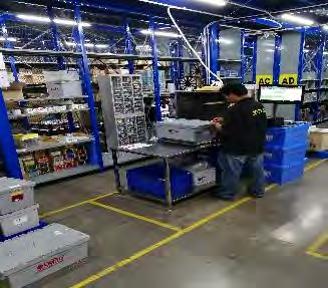
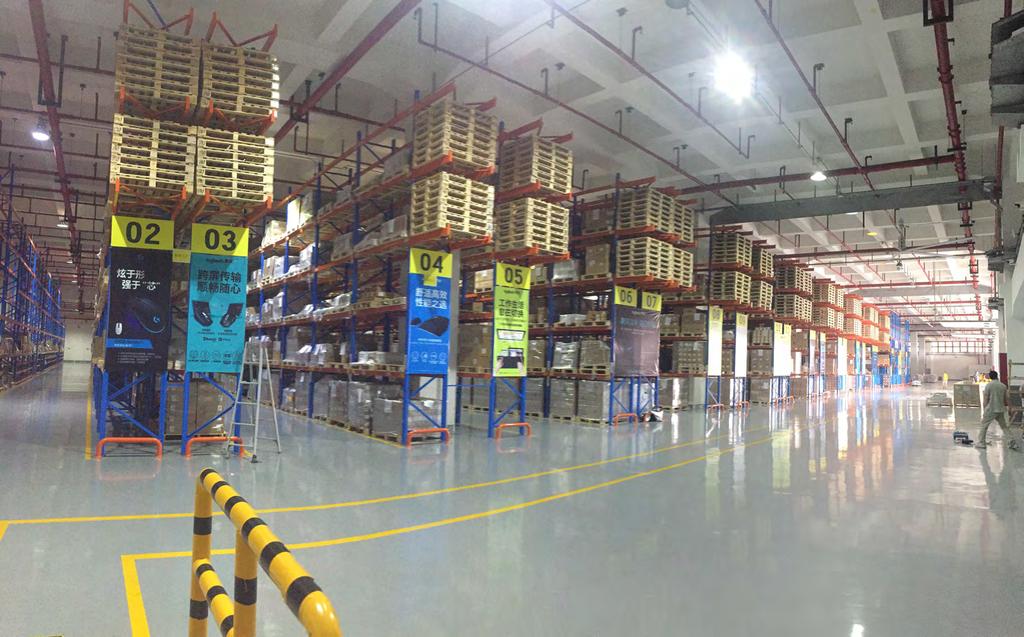
33 Our Network 17 jurisdictions (incl. US and UK) Korea Japan 235 Distribution centers China >26 million square feet DC space >16 billion units shipped per annum >500,000 TEUs handled per annum >8,000 staff Pakistan India Bangladesh Thailand Taiwan Hong Kong Philippines Cambodia Vietnam Malaysia Singapore Indonesia 2018 Interim Results I LI & FUNG 32


34 Our Sandbox E-commerce Footwear & Apparel Channels Trade Partner Retail Core industry categories Core industry verticals FMCG Food & Beverage Healthcare Electronics 2018 Interim Results I LI & FUNG 33
35 Growth Drivers E-commerce New Categories Healthcare, Electronics Freight Forwarding Productivity Improvement New Markets India, Korea, Japan & Vietnam 2018 Interim Results I LI & FUNG 34


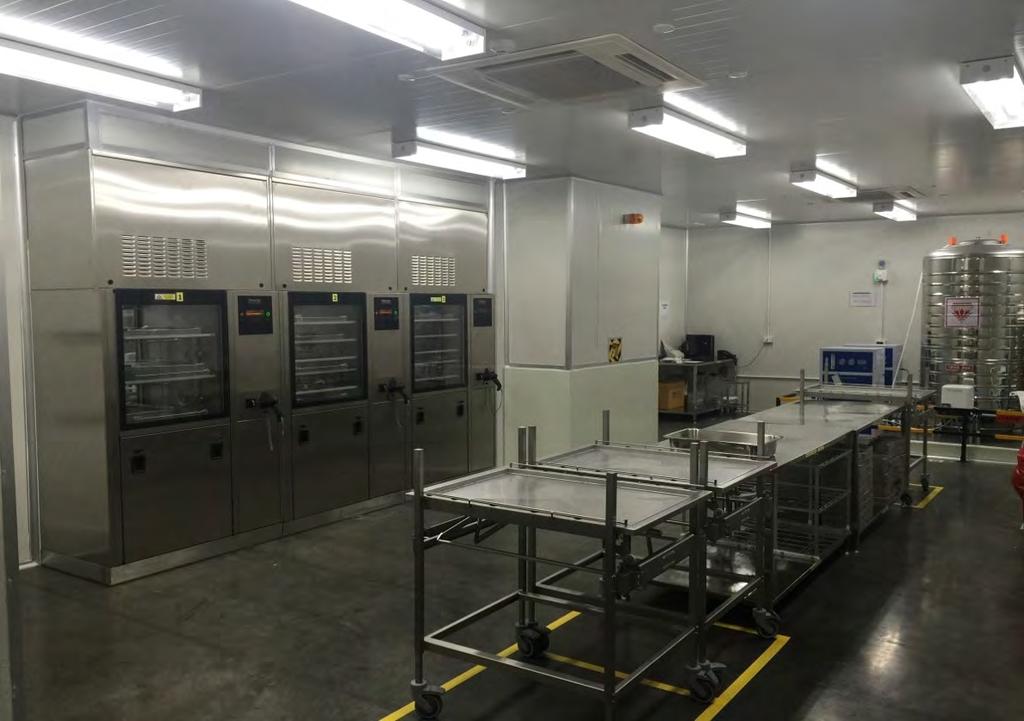
36 Healthcare Thailand 2018 Interim Results I LI & FUNG 35


37 Electronics China & Singapore 2018 Interim Results I LI & FUNG 36

 2013 2014 2015 2016 2018")
38 2017 Singles Day 32 customers 13 locations 48M messages 8.48M units 5.81M orders LF Logistics Single s Day Volume (Unit: million units) Interim Results I LI & FUNG
39 Freight Forwarding Over 500,000 TEUs shipped annually Europe China North America Leading freight forwarder in Ningbo, one of the largest ports in the world South Asia Leading C&F freight forwarder in China ASEAN Australia Top 15 freight forwarder on the Trans Pacific lane Continued cross selling with In Country 2018 Interim Results I LI & FUNG 38
40 Performance Trends Turnover COP US$m CAGR 20% US$m CAGR 27% 1, Interim Results I LI & FUNG 39
41 Exceeded 3YP targets in 2017, but 2018 is challenging due to continued destocking, store closures and bankruptcies Profit attributable to shareholders (like-for-like) down 19% Summary Divestment of Product Verticals brought in US$1.1B of cash Trade war has minimal impact on our business and mitigated by our 50+ countries of production Announced an aggressive plan to bring greater focus on customers, business development, production platform and digital initiatives Seeking IPO for Logistics business to enhance its growth 2018 Interim Results I LI & FUNG 40
42 Disclaimer The information contained in this presentation is intended solely for your personal reference. Such information is subject to change without notice and no representation or warranty express or implied is made as to, and no reliance, should be placed on, the fairness, accuracy, completeness or correctness of the information contained in this presentation. This presentation does not intend to provide, and you may not rely on this presentation as providing, a complete or comprehensive analysis of the Company s financial or trading position or prospects. None of the Company nor any of its respective affiliates, advisors or representatives shall have any liability (in negligence or otherwise) whatsoever for any loss or damage howsoever arising from any use of this presentation or its contents or otherwise arising in connection with this presentation. This presentation contains projections and forward looking statements that may reflect the Company s current views with respect to future events and financial performance. Readers are cautioned not to place undue reliance on these forward-looking statements which are subject to various risks and uncertainties and no assurance can be given that actual results will be consistent with these forwardlooking statements. The Company undertakes no obligation to publicly update or revise any forward-looking statements, whether as a result of new information, future events or otherwise. This presentation does not constitute an offer or invitation to purchase or subscribe for any securities or financial instruments or the provision of any investment advice, and no part of it shall form the basis of or be relied upon in connection with any contract, commitment or investment decision in relation thereto, nor does this presentation constitute a recommendation regarding the securities or financial instruments of the Company Interim Results I LI & FUNG 41
Highlights. Core Operating Profit decreased 20% to US$285 million due to challenges in Supply Chain Solutions business
 Core Operating Profit decreased 20% to US$285 million due to challenges in Supply Chain Solutions business New management team in place to accelerate Highlights turnaround and digital transformation Leadership
Strategic Divestment of Product Verticals. December 14, 2017
 Strategic Divestment of Product Verticals December 14, 2017 Disclaimer Important notice The information contained in this presentation is intended solely for your information. Such information is subject
2009 Half Year Results. August 25, 2009
 1 2009 Half Year Results August 25, 2009 2 Caution statement This presentation may contain forward looking statements, which are subject to risk and uncertainty. A variety of factors could cause our actual
Announcement of Results for the Year Ended 31 December 2018
 Hong Kong Exchanges and Clearing Limited and The Stock Exchange of Hong Kong Limited take no responsibility for the contents of this document, make no representation as to its accuracy or completeness
Announcement of Results for the Year Ended 31 December 2017
 Hong Kong Exchanges and Clearing Limited and The Stock Exchange of Hong Kong Limited take no responsibility for the contents of this document, make no representation as to its accuracy or completeness
Guide to Treatment of Withholding Tax Rates. January 2018
 Guide to Treatment of Withholding Tax Rates Contents 1. Introduction 1 1.1. Aims of the Guide 1 1.2. Withholding Tax Definition 1 1.3. Double Taxation Treaties 1 1.4. Information Sources 1 1.5. Guide Upkeep
FTSE Global Equity Index Series
 Methodology overview FTSE Global Equity Index Series Built for the demands of global investors Indexes for a global market The FTSE Global Equity Index Series (FTSE GEIS) includes objective, rules-based
Today's CPI data: what you need to know
 Trend Macrolytics, LLC Donald Luskin, Chief Investment Officer Thomas Demas, Managing Director Michael Warren, Energy Strategist Data Insights: Consumer Price Index, Producer Price Index Friday, July 14,
Argentina Bahamas Barbados Bermuda Bolivia Brazil British Virgin Islands Canada Cayman Islands Chile
 Americas Argentina (Banking and finance; Capital markets: Debt; Capital markets: Equity; M&A; Project Bahamas (Financial and corporate) Barbados (Financial and corporate) Bermuda (Financial and corporate)
Today's CPI data: what you need to know
 Trend Macrolytics, LLC Donald Luskin, Chief Investment Officer Thomas Demas, Managing Director Michael Warren, Energy Strategist Data Insights: Consumer Price Index, Producer Price Index Thursday, July
FY2016 RESULTS. 1 February 2016 to 31 January Inditex continues to roll out its global, fully integrated store and online model.
 FY2016 RESULTS 1 February 2016 to 31 January 2017 Inditex continues to roll out its global, fully integrated store and online model. Strong operating performance: Net sales for FY2016 reached 23.3 billion,
Today's CPI data: what you need to know
 Trend Macrolytics, LLC Donald Luskin, Chief Investment Officer Thomas Demas, Managing Director Michael Warren, Energy Strategist Data Insights: Consumer Price Index, Producer Price Index Friday, August
Today's CPI data: what you need to know
 Trend Macrolytics, LLC Donald Luskin, Chief Investment Officer Thomas Demas, Managing Director Michael Warren, Energy Strategist Data Insights: Consumer Price Index, Producer Price Index Thursday, October
Today's CPI data: what you need to know
 Trend Macrolytics, LLC Donald Luskin, Chief Investment Officer Thomas Demas, Managing Director Michael Warren, Energy Strategist Data Insights: Consumer Price Index, Producer Price Index Wednesday, December
Today's CPI data: what you need to know
 Trend Macrolytics, LLC Donald Luskin, Chief Investment Officer Thomas Demas, Managing Director Michael Warren, Energy Strategist Data Insights: Consumer Price Index, Producer Price Index Wednesday, February
Today's CPI data: what you need to know
 Trend Macrolytics, LLC Donald Luskin, Chief Investment Officer Thomas Demas, Managing Director Michael Warren, Energy Strategist Data Insights: Consumer Price Index, Producer Price Index Friday, January
Today's CPI data: what you need to know
 Trend Macrolytics, LLC Donald Luskin, Chief Investment Officer Thomas Demas, Managing Director Michael Warren, Energy Strategist Data Insights: Consumer Price Index, Producer Price Index Wednesday, April
Today's CPI data: what you need to know
 Trend Macrolytics, LLC Donald Luskin, Chief Investment Officer Thomas Demas, Managing Director Michael Warren, Energy Strategist Data Insights: Consumer Price Index, Producer Price Index Friday, October
Today's CPI data: what you need to know
 Trend Macrolytics, LLC Donald Luskin, Chief Investment Officer Thomas Demas, Managing Director Michael Warren, Energy Strategist Data Insights: Consumer Price Index, Producer Price Index Wednesday, November
26 MAY Boustead Singapore Limited / Boustead Projects Limited Joint FY2015 Financial Results Presentation
 26 MAY 2015 Boustead Singapore Limited / Boustead Projects Limited Joint FY2015 Financial Results Presentation Disclaimer This presentation contains certain statements that are not statements of historical
Clinical Trials Insurance
 Allianz Global Corporate & Specialty Clinical Trials Insurance Global solutions for clinical trials liability Specialist cover for clinical research The challenges of international clinical research are
YUM! Brands, Inc. Historical Financial Summary. Second Quarter, 2017
 YUM! Brands, Inc. Historical Financial Summary Second Quarter, 2017 YUM! Brands, Inc. Consolidated Statements of Income (in millions, except per share amounts) 2017 2016 2015 YTD Q3 Q4 FY FY Revenues Company
PENTA CLO 2 B.V. (the "Issuer")
") THIS NOTICE CONTAINS IMPORTANT INFORMATION OF INTEREST TO THE REGISTERED AND BENEFICIAL OWNERS OF THE NOTES (AS DEFINED BELOW). IF APPLICABLE, ALL DEPOSITARIES, CUSTODIANS AND OTHER INTERMEDIARIES RECEIVING
THIS NOTICE CONTAINS IMPORTANT INFORMATION OF INTEREST TO THE REGISTERED AND BENEFICIAL OWNERS OF THE NOTES (AS DEFINED BELOW). IF APPLICABLE, ALL DEPOSITARIES, CUSTODIANS AND OTHER INTERMEDIARIES RECEIVING
FTSE Annual Country Classification Review Published: 26 September 2018
 FTSE Classification of Markets FTSE Annual Country Classification Review Published: 26 September 2018 Headlines China A to be assigned Secondary Emerging market status commencing June 2019 Iceland to be
EQUITY REPORTING & WITHHOLDING. Updated May 2016
 EQUITY REPORTING & WITHHOLDING Updated May 2016 When you exercise stock options or have RSUs lapse, there may be tax implications in any country in which you worked for P&G during the period from the
STOXX EMERGING MARKETS INDICES. UNDERSTANDA RULES-BA EMERGING MARK TRANSPARENT SIMPLE
 STOXX Limited STOXX EMERGING MARKETS INDICES. EMERGING MARK RULES-BA TRANSPARENT UNDERSTANDA SIMPLE MARKET CLASSIF INTRODUCTION. Many investors are seeking to embrace emerging market investments, because
Global Select International Select International Select Hedged Emerging Market Select
 International Exchange Traded Fund (ETF) Managed Strategies ETFs provide investors a liquid, transparent, and low-cost avenue to equities around the world. Our research has shown that individual country
FY2017 RESULTS. 1 February 2017 to 31 January Inditex continues to roll out its global, fully integrated store and online platform.
 FY2017 RESULTS 1 February 2017 to 31 January 2018 Inditex continues to roll out its global, fully integrated store and online platform. Strong operating performance: Net sales for FY2017 reached 25.3 billion,
First ever quarter with over 200m Gross Profit
 11 July 2018 and H1 2018 Trading Update Steve Ingham Kelvin Stagg Chief Executive Officer Chief Financial Officer First ever quarter with over 200m Gross Profit LSE: PAGE.L Website: http://www.page.com/investors
Total Imports by Volume (Gallons per Country)
") 10/5/2017 Imports by Volume (Gallons per Country) YTD YTD Country 08/2016 08/2017 % Change 2016 2017 % Change MEXICO 51,349,849 67,180,788 30.8 % 475,806,632 503,129,061 5.7 % NETHERLANDS 12,756,776 12,954,789
10/5/2017 Imports by Volume (Gallons per Country) YTD YTD Country 08/2016 08/2017 % Change 2016 2017 % Change MEXICO 51,349,849 67,180,788 30.8 % 475,806,632 503,129,061 5.7 % NETHERLANDS 12,756,776 12,954,789
Total Imports by Volume (Gallons per Country)
") 10/5/2018 Imports by Volume (Gallons per Country) YTD YTD Country 08/2017 08/2018 % Change 2017 2018 % Change MEXICO 67,180,788 71,483,563 6.4 % 503,129,061 544,043,847 8.1 % NETHERLANDS 12,954,789 12,582,508
10/5/2018 Imports by Volume (Gallons per Country) YTD YTD Country 08/2017 08/2018 % Change 2017 2018 % Change MEXICO 67,180,788 71,483,563 6.4 % 503,129,061 544,043,847 8.1 % NETHERLANDS 12,954,789 12,582,508
Total Imports by Volume (Gallons per Country)
") 11/2/2018 Imports by Volume (Gallons per Country) YTD YTD Country 09/2017 09/2018 % Change 2017 2018 % Change MEXICO 49,299,573 57,635,840 16.9 % 552,428,635 601,679,687 8.9 % NETHERLANDS 11,656,759 13,024,144
11/2/2018 Imports by Volume (Gallons per Country) YTD YTD Country 09/2017 09/2018 % Change 2017 2018 % Change MEXICO 49,299,573 57,635,840 16.9 % 552,428,635 601,679,687 8.9 % NETHERLANDS 11,656,759 13,024,144
Total Imports by Volume (Gallons per Country)
") 7/6/2018 Imports by Volume (Gallons per Country) YTD YTD Country 05/2017 05/2018 % Change 2017 2018 % Change MEXICO 71,166,360 74,896,922 5.2 % 302,626,505 328,397,135 8.5 % NETHERLANDS 12,039,171 13,341,929
7/6/2018 Imports by Volume (Gallons per Country) YTD YTD Country 05/2017 05/2018 % Change 2017 2018 % Change MEXICO 71,166,360 74,896,922 5.2 % 302,626,505 328,397,135 8.5 % NETHERLANDS 12,039,171 13,341,929
Total Imports by Volume (Gallons per Country)
") 1/5/2018 Imports by Volume (Gallons per Country) YTD YTD Country 11/2016 11/2017 % Change 2016 2017 % Change MEXICO 50,994,409 48,959,909 (4.0)% 631,442,105 657,851,150 4.2 % NETHERLANDS 9,378,351 11,903,919
1/5/2018 Imports by Volume (Gallons per Country) YTD YTD Country 11/2016 11/2017 % Change 2016 2017 % Change MEXICO 50,994,409 48,959,909 (4.0)% 631,442,105 657,851,150 4.2 % NETHERLANDS 9,378,351 11,903,919
SINGAPORE - FINAL LIST OF MFN EXEMPTIONS (For the Second Package of Commitments) Countries to which the measure applies
 Countries to which the measure applies") All Sectors: Presence of: - unskilled and semi-skilled natural persons - skilled persons (include craftsmen skilled in a particular trade, but exclude specialists/professio nal personnel at management
All Sectors: Presence of: - unskilled and semi-skilled natural persons - skilled persons (include craftsmen skilled in a particular trade, but exclude specialists/professio nal personnel at management
Total Imports by Volume (Gallons per Country)
") 12/6/2018 Imports by Volume (Gallons per Country) YTD YTD Country 10/2017 10/2018 % Change 2017 2018 % Change MEXICO 56,462,606 60,951,402 8.0 % 608,891,240 662,631,088 8.8 % NETHERLANDS 11,381,432 10,220,226
12/6/2018 Imports by Volume (Gallons per Country) YTD YTD Country 10/2017 10/2018 % Change 2017 2018 % Change MEXICO 56,462,606 60,951,402 8.0 % 608,891,240 662,631,088 8.8 % NETHERLANDS 11,381,432 10,220,226
Quarterly Investment Update First Quarter 2017
 Quarterly Investment Update First Quarter 2017 Market Update: A Quarter in Review March 31, 2017 CANADIAN STOCKS INTERNATIONAL STOCKS Large Cap Small Cap Growth Value Large Cap Small Cap Growth Value Emerging
ANNEX 2: Methodology and data of the Starting a Foreign Investment indicators
 ANNEX 2: Methodology and data of the Starting a Foreign Investment indicators Methodology The Starting a Foreign Investment indicators quantify several aspects of business establishment regimes important
Total Imports by Volume (Gallons per Country)
") 2/6/2019 Imports by Volume (Gallons per Country) YTD YTD Country 11/2017 11/2018 % Change 2017 2018 % Change MEXICO 48,959,909 54,285,392 10.9 % 657,851,150 716,916,480 9.0 % NETHERLANDS 11,903,919 10,024,814
2/6/2019 Imports by Volume (Gallons per Country) YTD YTD Country 11/2017 11/2018 % Change 2017 2018 % Change MEXICO 48,959,909 54,285,392 10.9 % 657,851,150 716,916,480 9.0 % NETHERLANDS 11,903,919 10,024,814
Total Imports by Volume (Gallons per Country)
") 3/6/2019 Imports by Volume (Gallons per Country) YTD YTD Country 12/2017 12/2018 % Change 2017 2018 % Change MEXICO 54,169,734 56,505,154 4.3 % 712,020,884 773,421,634 8.6 % NETHERLANDS 11,037,475 8,403,018
3/6/2019 Imports by Volume (Gallons per Country) YTD YTD Country 12/2017 12/2018 % Change 2017 2018 % Change MEXICO 54,169,734 56,505,154 4.3 % 712,020,884 773,421,634 8.6 % NETHERLANDS 11,037,475 8,403,018
Total Imports by Volume (Gallons per Country)
") 6/6/2018 Imports by Volume (Gallons per Country) YTD YTD Country 04/2017 04/2018 % Change 2017 2018 % Change MEXICO 60,968,190 71,994,646 18.1 % 231,460,145 253,500,213 9.5 % NETHERLANDS 13,307,731 10,001,693
6/6/2018 Imports by Volume (Gallons per Country) YTD YTD Country 04/2017 04/2018 % Change 2017 2018 % Change MEXICO 60,968,190 71,994,646 18.1 % 231,460,145 253,500,213 9.5 % NETHERLANDS 13,307,731 10,001,693
Quarterly Investment Update First Quarter 2018
 Quarterly Investment Update First Quarter 2018 Dimensional Fund Advisors Canada ULC ( DFA Canada ) is not affiliated with [insert name of Advisor]. DFA Canada is a separate and distinct company. Market
WHY UHY? The network for doing business
 The network for doing business the network for doing business UHY has over 6,800 professionals to choose from trusted advisors and consultants operating in more than 250 business centres, based in 81 countries
Total Imports by Volume (Gallons per Country)
") 2/6/2018 Imports by Volume (Gallons per Country) YTD YTD Country 12/2016 12/2017 % Change 2016 2017 % Change MEXICO 50,839,282 54,169,734 6.6 % 682,281,387 712,020,884 4.4 % NETHERLANDS 10,630,799 11,037,475
2/6/2018 Imports by Volume (Gallons per Country) YTD YTD Country 12/2016 12/2017 % Change 2016 2017 % Change MEXICO 50,839,282 54,169,734 6.6 % 682,281,387 712,020,884 4.4 % NETHERLANDS 10,630,799 11,037,475
DOMESTIC CUSTODY & TRADING SERVICES
 Pricing Structure DOMESTIC CUSTODY & TRADING SERVICES A flat custody fee of 20bps per account type per year is applicable to all holdings and cash, the custody fee is collected each month but will be capped
Total Imports by Volume (Gallons per Country)
") 3/7/2018 Imports by Volume (Gallons per Country) YTD YTD Country 01/2017 01/2018 % Change 2017 2018 % Change MEXICO 54,235,419 58,937,856 8.7 % 54,235,419 58,937,856 8.7 % NETHERLANDS 12,265,935 10,356,183
3/7/2018 Imports by Volume (Gallons per Country) YTD YTD Country 01/2017 01/2018 % Change 2017 2018 % Change MEXICO 54,235,419 58,937,856 8.7 % 54,235,419 58,937,856 8.7 % NETHERLANDS 12,265,935 10,356,183
COUNTRY COST INDEX JUNE 2013
 COUNTRY COST INDEX JUNE 2013 June 2013 Kissell Research Group, LLC 1010 Northern Blvd., Suite 208 Great Neck, NY 11021 www.kissellresearch.com Kissell Research Group Country Cost Index - June 2013 2 Executive
FOREIGN ACTIVITY REPORT
 FOREIGN ACTIVITY REPORT SECOND QUARTER 2012 TABLE OF CONTENTS Table of Contents... i All Securities Transactions... 2 Highlights... 2 U.S. Transactions in Foreign Securities... 2 Foreign Transactions in
Thomas Buberl Group CEO, AXA. Bank of America Merrill Lynch Conference London September 27, 2018
 Thomas Buberl Group CEO, AXA Bank of America Merrill Lynch Conference London September 27, 2018 IMPORTANT LEGAL INFORMATION AND CAUTIONARY STATEMENTS CONCERNING FORWARD-LOOKING STATEMENTS Certain statements
Global Business Barometer April 2008
 Global Business Barometer April 2008 The Global Business Barometer is a quarterly business-confidence index, conducted for The Economist by the Economist Intelligence Unit What are your expectations of
H S B C H O L D I N G S P L C HSBC HOLDINGS PLC THE CAPITAL REQUIREMENTS. (Country-by-Country Reporting) REGULATION 2013
 REGULATION 2013") HSBC HOLDINGS PLC THE CAPITAL REQUIREMENTS (Country-by-Country Reporting) REGULATION 2013 31 December 2015 This report has been prepared for HSBC Holdings plc and its subsidiaries (the HSBC Group ) to
HSBC HOLDINGS PLC THE CAPITAL REQUIREMENTS (Country-by-Country Reporting) REGULATION 2013 31 December 2015 This report has been prepared for HSBC Holdings plc and its subsidiaries (the HSBC Group ) to
Total Imports by Volume (Gallons per Country)
") 5/4/2016 Imports by Volume (Gallons per Country) YTD YTD Country 03/2015 03/2016 % Change 2015 2016 % Change MEXICO 53,821,885 60,813,992 13.0 % 143,313,133 167,568,280 16.9 % NETHERLANDS 11,031,990 12,362,256
5/4/2016 Imports by Volume (Gallons per Country) YTD YTD Country 03/2015 03/2016 % Change 2015 2016 % Change MEXICO 53,821,885 60,813,992 13.0 % 143,313,133 167,568,280 16.9 % NETHERLANDS 11,031,990 12,362,256
SHARE IN OUR FUTURE AN ADVENTURE IN EMPLOYEE STOCK OWNERSHIP DEBBI MARCUS, UNILEVER
 SHARE IN OUR FUTURE AN ADVENTURE IN EMPLOYEE STOCK OWNERSHIP DEBBI MARCUS, UNILEVER DEBBI.MARCUS@UNILEVER.COM RUTGERS SCHOOL OF MANAGEMENT AND LABOR RELATIONS NJ/NY CENTER FOR EMPLOYEE OWNERSHIP AGENDA
Summary 715 SUMMARY. Minimum Legal Fee Schedule. Loser Pays Statute. Prohibition Against Legal Advertising / Soliciting of Pro bono
 Summary Country Fee Aid Angola No No No Argentina No, with No No No Armenia, with No No No No, however the foreign Attorneys need to be registered at the Chamber of Advocates to be able to practice attorney
AXA. Henri de Castries. Chairman & CEO. London - October 2, Sanford C. Bernstein Strategic Decisions Conference
 AXA Henri de Castries Chairman & CEO London - October 2, 2013 Sanford C. Bernstein Strategic Decisions Conference Cautionary note concerning forward-looking statements Certain statements contained herein
Another quarter of double digit growth
 11 April 2018 2018 Trading Update Steve Ingham Kelvin Stagg Chief Executive Officer Chief Financial Officer Another quarter of double digit growth LSE: PAGE.L Website: http://www.page.com/investors Headline
26 MAY Boustead Singapore Limited FY2010 Financial Results Presentation
 26 MAY 2010 Boustead Singapore Limited FY2010 Financial Results Presentation Disclaimer This presentation contains certain statements that are not statements of historical fact such as forward-looking
Total Imports by Volume (Gallons per Country)
") 4/5/2018 Imports by Volume (Gallons per Country) YTD YTD Country 02/2017 02/2018 % Change 2017 2018 % Change MEXICO 53,961,589 55,268,981 2.4 % 108,197,008 114,206,836 5.6 % NETHERLANDS 12,804,152 11,235,029
4/5/2018 Imports by Volume (Gallons per Country) YTD YTD Country 02/2017 02/2018 % Change 2017 2018 % Change MEXICO 53,961,589 55,268,981 2.4 % 108,197,008 114,206,836 5.6 % NETHERLANDS 12,804,152 11,235,029
The Capital Requirements (Country-by-Country Reporting) Regulations December 2017
 Regulations December 2017") HSBC Holdings plc The Capital Requirements (Country-by-Country Reporting) Regulations 2013 31 December 2017 This report has been prepared for HSBC Holdings plc and its subsidiaries (the HSBC Group ) to
HSBC Holdings plc The Capital Requirements (Country-by-Country Reporting) Regulations 2013 31 December 2017 This report has been prepared for HSBC Holdings plc and its subsidiaries (the HSBC Group ) to
July 26, 2017 LafargeHolcim Ltd 2015
 Second Quarter 2017 Results Beat Hess, Chairman and Interim CEO Roland Köhler, Interim COO and Regional Head of Europe, Australia/NZ & Trading Ron Wirahadiraksa, CFO July 26, 2017 LafargeHolcim Ltd 2015
1.1. STOXX TOTAL MARKET INDICES
 STOXX INDEX LIST A-Z 1. TOTAL MARKET INDICES 1/14 1.1. STOXX TOTAL MARKET INDICES Regional indices STOXX BRIC TMI STOXX Developed and Emerging Markets TMI STOXX Developed Markets TMI STOXX Emerging Markets
Double Tax Treaties. Necessity of Declaration on Tax Beneficial Ownership In case of capital gains tax. DTA Country Withholding Tax Rates (%)
") Double Tax Treaties DTA Country Withholding Tax Rates (%) Albania 0 0 5/10 1 No No No Armenia 5/10 9 0 5/10 1 Yes 2 No Yes Australia 10 0 15 No No No Austria 0 0 10 No No No Azerbaijan 8 0 8 Yes No Yes
Double Tax Treaties DTA Country Withholding Tax Rates (%) Albania 0 0 5/10 1 No No No Armenia 5/10 9 0 5/10 1 Yes 2 No Yes Australia 10 0 15 No No No Austria 0 0 10 No No No Azerbaijan 8 0 8 Yes No Yes
Setting up in Denmark
 Setting up in Denmark 6. Taxation The Danish tax system for individuals rests on the global taxation principle. The principle holds that the income of individuals and companies with full tax liability
CNH and China QFII market: Opportunities and Challenges A Fund Custodian and Administrator's Perspective"
 CNH and China QFII market: Opportunities and Challenges A Fund Custodian and Administrator's Perspective" Eric Chow HSBC Securities Services June 2011 2 Agenda About HSBC Securities Services (HSS) Introducing
Financial Globalization, governance, and the home bias. Bong-Chan Kho, René M. Stulz and Frank Warnock
 Financial Globalization, governance, and the home bias Bong-Chan Kho, René M. Stulz and Frank Warnock Financial globalization Since end of World War II, dramatic reduction in barriers to international
For personal use only
 Click to edit Master text styles IDP Education FY16 Results Presentation Twelve months to 30 June 2016 11 February 2016 Important notice and disclaimer Click Disclaimer to edit Master text styles The material
15 Popular Q&A regarding Transfer Pricing Documentation (TPD) In brief. WTS strong presence in about 100 countries
 In brief. WTS strong presence in about 100 countries") 15 Popular Q&A regarding Transfer Pricing Documentation (TPD) Contacts China Martin Ng Managing Partner Martin.ng@worldtaxservice.cn + 86 21 5047 8665 ext.202 Xiaojie Tang Manager Xiaojie.tang@worldtaxservice.cn
15 Popular Q&A regarding Transfer Pricing Documentation (TPD) Contacts China Martin Ng Managing Partner Martin.ng@worldtaxservice.cn + 86 21 5047 8665 ext.202 Xiaojie Tang Manager Xiaojie.tang@worldtaxservice.cn
Sourcing Outlook for the Fashion Industry. Julia K. Hughes USFIA Washington Trade Symposium July 30, 2015
 Sourcing Outlook for the Fashion Industry Julia K. Hughes USFIA Washington Trade Symposium July 30, 2015 First, let s take a look at the data and trends Sourcing Trends for 2014 In 2014, imports grew 5%
GS Emerging Markets Debt Blend Portfolio
 Factsheet as at : November 12, 2018 GS Emerging Markets Debt Blend Portfolio Fund objective The Portfolio seeks to provide income and capital growth over the longer term. The Portfolio will mostly invest
Auditores & Consultores S.A. Auditoria - Consultoria - Impuestos - Revisoria Fiscal - Outsourcing WHY UHY? The network for doing business
 Auditores & Consultores S.A. Auditoria - Consultoria - Impuestos - Revisoria Fiscal - Outsourcing WHY UHY? The network business WHY UHY? THE NETWORK FOR DOING BUSINESS UHY has over 6,800 professionals
Household Debt and Business Cycles Worldwide Out-of-sample results based on IMF s new Global Debt Database
 Household Debt and Business Cycles Worldwide Out-of-sample results based on IMF s new Global Debt Database Atif Mian Princeton University and NBER Amir Sufi University of Chicago Booth School of Business
IMPORTANT TAX INFORMATION
 00126803 IMPORTANT TAX INFORMATION Dear Hartford Funds Shareholder: The following information about your enclosed 1099-DIV from Hartford Funds should be used when preparing your 2014 tax return. The information
1.1. STOXX TOTAL MARKET INDICES
 1. BROAD TOTAL MARKET INDICES/BENCHMARK INDICES, EQUAL WEIGHT INDICES 1/15 1.1. STOXX TOTAL MARKET INDICES Regional indices STOXX BRIC TMI STOXX Developed and Emerging Markets TMI STOXX Developed Markets
Supplemental Table I. WTO impact by industry
 Supplemental Table I. WTO impact by industry This table presents the influence of WTO accessions on each three-digit NAICS code based industry for the manufacturing sector. The WTO impact is estimated
Best Treasury & Cash Management Providers 2017
 Page 1 of 5 In March 2017, Global Finance will publish its selections for the Seventeenth Annual World s Best Treasury & Cash Management Providers. Global Finance will select the best overall global cash
Frontier Markets and a teaser of what is to come. Peter Elam Håkansson, Chairman and Partner
 Frontier Markets and a teaser of what is to come Peter Elam Håkansson, Chairman and Partner The Frontier Markets Have the good old Emerging Markets lost their appeal? We remain convinced that Emerging
Capital Markets Day 2011
 Capital Markets Day 2011 DSV Air & Sea Division Jorgen Moller, President DSV Air & Sea Holding A/S Capital Markets Day 6 September 2011 Agenda 1. DSV Air & Sea - general facts 2. Update on H1 2011 3. Growth
Actuarial Supply & Demand. By i.e. muhanna. i.e. muhanna Page 1 of
 By i.e. muhanna i.e. muhanna Page 1 of 8 040506 Additional Perspectives Measuring actuarial supply and demand in terms of GDP is indeed a valid basis for setting the actuarial density of a country and
Latin America Equities
 Latin America Equities March 2013 Stephen Burrows, Senior Investment Manager Emerging Markets - Pictet Asset Management Dec-10 Feb-11 Apr-11 Jun-11 Aug-11 Oct-11 Dec-11 Feb-12 Apr-12 Jun-12 Aug-12 Oct-12
Credit Ratings for 50 Countries and Regions by Dagong
 Review Summary at 1 st Anniversary of Issuance of Sovereign Credit Ratings for 50 Countries and Regions by Dagong July 11, 2011 Dagong officially released Sovereign credit ratings for 50 countries and
EXAMINING REIT JURISDICTIONS, STRUCTURES AND INVESTOR APPETITE ACROSS ASIA PACIFIC MARKETS
 PERPETUAL CORPORATE TRUST EXAMINING REIT JURISDICTIONS, STRUCTURES AND INVESTOR APPETITE ACROSS ASIA PACIFIC MARKETS GLEN DOGAN, SENIOR SALES & RELATIONSHIP MANAGER PERPETUAL: 128 YEARS OF HISTORY We are
UBI Pramerica SGR. US Economic Environment. Richard K. Mastain, Senior Vice President Jennison Associates LLC. April 2008
 UBI Pramerica SGR US Economic Environment Richard K. Mastain, Senior Vice President Jennison Associates LLC Subadvisor to Certain UBI Pramerica SGR Funds April 2008 Notice This presentation is for informational
SANGAM GLOBAL PHARMACEUTICAL & REGULATORY CONSULTANCY
 SANGAM GLOBAL PHARMACEUTICAL & REGULATORY CONSULTANCY Regulatory Affairs Worldwide An ISO 9001:2015 Certified Company Welcome to Sangam Global Pharmaceutical & Regulatory Consultancy (SGPRC) established
HEALTH WEALTH CAREER 2017 WORLDWIDE BENEFIT & EMPLOYMENT GUIDELINES
 HEALTH WEALTH CAREER 2017 WORLDWIDE BENEFIT & EMPLOYMENT GUIDELINES WORLDWIDE BENEFIT & EMPLOYMENT GUIDELINES AT A GLANCE GEOGRAPHY 77 COUNTRIES COVERED 5 REGIONS Americas Asia Pacific Central & Eastern
(of 19 March 2013) Valid from 1 January A. Taxpayers
 Valid from 1 January A. Taxpayers") Leaflet. 29/460 of the Cantonal Tax Office on withholding taxes applicable to pension benefits under private law for persons without domicile or residence in Switzerland (of 19 March 2013) Valid from 1
Leaflet. 29/460 of the Cantonal Tax Office on withholding taxes applicable to pension benefits under private law for persons without domicile or residence in Switzerland (of 19 March 2013) Valid from 1
World Stockmarket Forecasts
 Information and Advice on World Stockmarkets from Securities Research Company's... Inte ternational Investor Issue No. 261 www.stockmarket.co.nz September 11, 2017 Stockmarket Forecasts remain Bullish...
Third Quarter 2017 Results Jan Jenisch, CEO Ron Wirahadiraksa, CFO. October 27, 2017 LafargeHolcim Ltd 2015
 Third Quarter 2017 Results Jan Jenisch, CEO Ron Wirahadiraksa, CFO October 27, 2017 LafargeHolcim Ltd 2015 01 Initial views Q3 2017 and Outlook Jan Jenisch, Chief Executive Officer 2017 LafargeHolcim 2
Comperative DTTs of Pakistan
 Comperative DTTs of Pakistan 1 2 3 4 5 6 7 8 9 10 11 12 13 14 15 S. No. COUNTRY CONTINENT Republic/Dem ocratic/kingdo m/sultanate P.E. BUSINESS PROFIT SHIPPING AIR TRANSPORT DIVIDEND INTEREST ROYALITIES
TRENDS AND MARKERS Signatories to the United Nations Convention against Transnational Organised Crime
 A F R I C A WA T C H TRENDS AND MARKERS Signatories to the United Nations Convention against Transnational Organised Crime Afghanistan Albania Algeria Andorra Angola Antigua and Barbuda Argentina Armenia
Strategies for Successful Business in Asia Fasico is proud to be a partner of
 Strategies for Successful Business in Asia Fasico is proud to be a partner of Introduction to Fasico Established as a fully independent consulting firm, in position to support European companies in Asia.
2010 Results. Paris - March 2, 2011
 2010 Results Paris - March 2, 2011 > Highlights of 2010 > Financial results > Strategy and outlook 2010 Results 2 2010: A Year of Acceleration Highlights of 2010 Revenue of 3,892m, up 19.1% Operating profit
Dutch tax treaty overview Q3, 2012
 Dutch tax treaty overview Q3, 2012 Hendrik van Duijn DTS Duijn's Tax Solutions Zuidplein 36 (WTC Tower H) 1077 XV Amsterdam The Netherlands T +31 888 387 669 T +31 888 DTS NOW F +31 88 8 387 601 duijn@duijntax.com
FRANKLIN TEMPLETON INVESTMENTS. Franklin Resources, Inc. Bank of America Merrill Lynch Banking and Financial Services Conference November 18, 2010
 Franklin Resources, Inc. Bank of America Merrill Lynch Banking and Financial Services Conference November 18, 2010 Forward-Looking Statements The financial results in this presentation are preliminary.
Global Consumer Confidence
 Global Consumer Confidence The Conference Board Global Consumer Confidence Survey is conducted in collaboration with Nielsen 4TH QUARTER 2017 RESULTS CONTENTS Global Highlights Asia-Pacific Africa and
Appendix. Table S1: Construct Validity Tests for StateHist
 Appendix Table S1: Construct Validity Tests for StateHist (5) (6) Roads Water Hospitals Doctors Mort5 LifeExp GDP/cap 60 4.24 6.72** 0.53* 0.67** 24.37** 6.97** (2.73) (1.59) (0.22) (0.09) (4.72) (0.85)
2014 Full year results. INVESTOR CALL 26 March 2014
 2014 Full year results INVESTOR CALL 26 March 2014 AGENDA DISCLAIMER 2014 FOURTH QUARTER 2014 FULL YEAR CAPITAL STRUCTURE OUTLOOK APPENDIX 2 DISCLAIMER Any information in this presentation that is not
World s Best Investment Bank Awards 2018
 Global Finance will publish its selections for the 19th Annual World s Best Investment Banks in the April 2018 issue. Winners will be honored at an awards ceremony in New York City in March, and all award
Denmark Country Profile
 Denmark Country Profile EU Tax Centre June 2018 Key tax factors for efficient cross-border business and investment involving Denmark EU Member State Double Tax Treaties With: Argentina Armenia Australia
Financial wealth of private households worldwide
 Economic Research Financial wealth of private households worldwide Munich, October 217 Recovery in turbulent times Assets and liabilities of private households worldwide in EUR trillion and annualrate
Investment Theme 3Q18. Ageing Population. Source: AFP Photo
 Investment Theme 3Q18 Ageing Population Source: AFP Photo 91 Investment Theme III: Ageing Population Jason Low, CFA Strategist The global population is growing older and people are living longer. Demographics