Investor Roadshow December 2010
|
|
|
- Logan Flowers
- 5 years ago
- Views:
Transcription
1 Investor Roadshow December
2 A Spreading Geography OPERATING TERRITORIES KEY EXPORT MARKETS 2
3 A Strategy For Growth Market Volume Growth 2-3% Organic Growth Developing Cold-Drink Distribution Innovation Adding 1-2% Average Realised Price c.1%+ International Expansion M&A: Europe Britvic International: Export Outside Europe: Licensing and Franchising 3


4 The Britvic Investment Case Britvic is a leading European branded soft drinks business STRONG MARKET POSITIONS #2 in British branded soft drinks #2 in Irish branded soft drinks #1 in French syrups A POWERFUL EUROPEAN BRAND PORTFOLIO #1 or #2 brands in the key categories Barriers to entry for entrants looking to replicate scale AN EVER-EXPANDING 23-YEAR RELATIONSHIP WITH PEPSICO A number of bottling contracts Provide enormous scale An outstanding platform for growth in current and future territories A STRONG TRACK RECORD Top Line EBIT Earnings Free Cashflow Sources: Nielsen Scantrack Take Home 52 weeks to Nielsen Scantrack 52 weeks to Oct 3rd 2010: ROI Grocery IRI Census data (Total Suppliers THG) MAT October


5 A Strengthening Track Record GB/INT L L REVENUE GB/INT L L EBITA 6.4% CAGR 12.5% CAGR ADJUSTED EPS UNDERLYING FREE CASHFLOW 17.9% CAGR 318M IN 5 YEARS Note: All numbers are pre-exceptionals unless stated otherwise. Adjusted EPS is calculated on a constant-currency basis and is adjusted for amortisation. For ease of comparison, 2010 figures above are based on a 52-week period except EPS. 5


 Grocery and Impulse: Nielsen Scantrack data to")

6 Channels To Market In GB Grocery Pubs & Clubs Impulse Food Service Retail value 5.0bn Retail value 2.8bn Retail value 1.5bn Retail value 2.2bn Britvic share 12.8% Britvic share 40.9% Britvic share 9.6% Britvic share 10.2% Gaining share through quality distribution Retaining marketleading positions Strategy drives 20bps of value share gains Strategy drives 40bps of value share gains Sources: Britvic Value Share Of GB On-The-Go Up 60 bps This Year (1) Grocery and Impulse: Nielsen Scantrack data to October 2010 Total Coverage MAT (2) Pubs & Clubs: CGA Pubs & Clubs data to August 2010 MAT (3) Food Service: Crest data and represents total foodservice soft drink market value. Britvic internal data for foodservice share estimate (4) Nielsen MAT to October


7 GB Activity In 2011 Oct - Dec Jan - Mar April - June July - Sept Taste The Moment Taste The Moment Portfolio Reward Your Thirst Launch: Nov - Feb Reward Your Thirst Refresh: April - July Juicy Extra-Free Pack Mountain Dew TTL Gatorade Re-brand KOPG On-pack Robinsons' Wimbledon Pepsi Music On Pack Brand On-going Cycling Partnership Drench Smart Hydration TV Fruit Shoot Kings of Playground Launch Drench Smart Hydration TV 7


8 Brand Relaunch Packaging Redesign New Flavour Major A&P Investment..used by the best Olympians in the World...because we are the original, the most researched and the most credible PepsiCo Confidential 8


9 Britvic France In 2011 Building Capability Further Innovation To Market The Launch Of Fruit Shoot 9


10 Britvic Ireland In 2011 A Right- Sized Business Model Medium- Term Confidence Focused Brand Investment Innovation And Product Launches 10
11 Innovation Across The Group In


12 Britvic International The Global Spread of Fruit Shoot A national launch the two largest retailers, Cole s and Woolworth s Sales already commenced November 2010 Ambition to be a leading category brand 12


13 Britvic International The Global Spread of Fruit Shoot Buffalo Rock and Britvic - a successful partnership Exciting further trialling with other independent PepsiCo partners o up the Eastern Seaboard Building a global presence our wholly-owned brands 13
14 Financial Headlines Underlying Revenue up 5.9% Underlying EBITA up 10.8% Exceptional and Other Items of 137.9m Adjusted EPS up 18.1% Underlying Free Cashflow of 67.8m Note: underlying revenue and EBITA are 52 weeks and before exceptional and other items and exclude first-time impact of France Underlying Free Cash flow is before exceptional and other items and excludes the acquisition of Britvic France 14
15 Like-For For-Like Underlying Performance FY10 m FY09 m % Change Revenue 1, EBITA EBIT EBIT Margin 11.8% 11.2% 60bps Profit After Tax Note: All numbers are before exceptional and other items. P&L items are shown on a constant-currency basis and are therefore restated for FY09. 15
16 Cash flow FY10 FY09 % m m change 53 weeks 52 weeks Depreciation & Amortisation (9.7) EBITDA Working Capital (11.1) Capital Expenditure (45.3) (40.1) (13.0) Pension (13.2) (10.0) (32.0) Other (41.5) (44.5) 6.7 Underlying Free Cash flow (2.7) Dividends (34.9) (27.8) (25.5) Adjusted Net Debt (451.2) (366.4) (23.1) Note: Underlying Free Cash flow is defined as net cash flow excluding movements in borrowings, dividend payments, exceptional and other items and the acquisition of Britvic France Adjusted Net Debt is defined as net group debt, adding back the foreign exchange impact of derivatives hedging the balance sheet debt. 16


17 Summary Challenging Macro Conditions With Resilient Markets Well-Invested Brands And Innovations A Strong 2011 Programme A Balanced Strategy Delivering Quality Earnings Growth 17
18 Appendix 18
19 The ADR Programme Britvic s ADR shares trade on the US over-the-counter market under the following information: Symbol BTVCY CUSIP Ratio 1 ADR : 2 ORD Country UK Effective Date February 2010 ADR Benefits to US Investors: ADRs give access to cross-border market liquidity ADRs are cost-effective ADRs are convenient to own: Underlying SEDOL Underlying ISIN Depositary B0N8QD5 GB00B0N8QD54 BNY Mellon Quoted in US dollars Dividends paid in US dollars 19


20 The Evolving GB On-The The-Go Portfolio


21 The 2010 GB Innovation Programme New Brands Brand Extensions Pack & Experience 21


22 Fruit Shoot Driving French Synergies Total Market Volumes 70m Litres Y1: Strong In-Store Support & Start of TV Campaign Specific French Formulations Teisseire Endorsement - Reassuring Mum 22


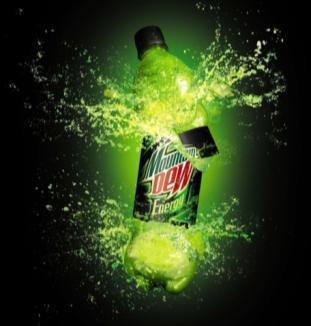
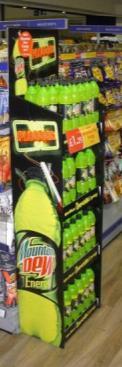


23 Britvic Ireland: Mountain Dew Energy Driving Availability Quality distribution of 500ml PET in the right channels Unavoidable Visibility Impact Feature & POS to POP Sampling Campaign Increases across Brand Awareness & Buzz/Excitement among target audience


24 Britvic Ireland: Juicy Drench Jan - Feb 2011 Mar - Apr 2011 May-Jun 2011 Jul-Aug 2011 Sep 2011 Oct 2012 Engagement Innovation Launch 1.25L Relevance 24
25 Debt Structure Facility Size ( m) Maturities Drawing ( m) Headroom ( m) Bank Loans US PP Issued , 2017, US PP Issued , , (Cash)/ Overdraft/Other - - (53.4) 53.4 SUB-TOTAL US PP Issued soon to TOTAL Note: as at 3 rd October Proposed USPP issue of USD:STERLING estimated rate of and 7.5m issuance 25

26 m Debt Repayment Profile Revolver USPP 26
27 Guidance 2011 Revenue Innovation adds 1-2% Medium-term growth drivers remain robust 53 rd week was a one-off benefit for 2010 France in 2010 included the strongest 4 months of the year Costs & Capex Raw-material Inflation likely to be 5-6% Further group-structure investment of 2m Capex GB 50-55m Ireland 8m France 5m plus: m m m Margins Average annual EBITA margin growth of 50 bps H likely to be impacted by cost inflation Possible pricing benefit in H2 France particularly impacted by juice inflation 27


28 GB Market Growth Rates CARBS TOTAL MARKET VALUE GROWTH + 6.3% TOTAL MARKET VOLUME GROWTH + 2.3% STILLS 47.9% 67.5% 28
29 GB Market Volumes 000s LITRES 190, /08 180, /09 170, /10 160, , , , , ,000 WE WE WE WE WE WE WE WE WE WE WE WE WE Source: Nielsen Scantrack Sept 2009: Take Home 29


30 Irish Market Growth Rates TOTAL MARKET VALUE DECLINE (5.4%) CARBS TOTAL MARKET VOLUME GROWTH + 4.3% STILLS Source: Nielsen Scantrack 52 weeks to Oct 3rd 2010: ROI Grocery 30


31 Irish Market Volumes 2007/08 000s LITRES 2008/ /10 Source: Nielsen Scantrack Sept 2009: Take Home 31


32 French Market Growth Rates TOTAL MARKET VALUE GROWTH + 3.8% TOTAL MARKET VOLUME GROWTH + 2.2% STILLS CARBS 32
33 French Market Volumes 000s LITRES 2007/ ,000, / /10 750, , Oct Nov Dec Jan Feb Mar Apr May Jun Jul Aug Sept 33
Britvic plc. Preliminary Results 2011
 Britvic plc Preliminary Results 2011 Gerald Corbett Chairman John Gibney Group Finance Director Agenda Financial performance John Gibney Britvic and the market review Paul Moody Group performance +14.6%
Britvic plc Interim Results 2018
 Britvic plc Interim Results 2018 CEO SIMON LITHERLAND DELIVERING ON OUR STRATEGIC PRIORITIES AND VISION 2 OUR STRATEGY IS DELIVERING CONSISTENT RETURNS FOR SHAREHOLDERS GENERATE PROFITABLE GROWTH IN OUR
Interim Results Presentation
 Interim Results Presentation May 2017 Chairman - Gerald Corbett 2 Agenda Simon Litherland Chief Executive Officer Successful delivery of our strategic priorities Mathew Dunn Chief Financial Officer Strong
Britvic plc Preliminary Results 2017
 Britvic plc Preliminary Results 2017 CEO SIMON LITHERLAND DELIVERING ON OUR STRATEGIC PRIORITIES AND VISION Britvic plc Preliminary Results 2017 2 2017 ANOTHER YEAR OF STRONG PROGRESS STRONG REVENUE AND
B R I T V I C P L C P R E L I M I N A R Y R E S U L T S NOV 2018
 B R I T V I C P L C P R E L I M I N A R Y R E S U L T S 2 0 1 8 29 NOV 2018 Simon Litherland Chief Executive Officer Delivering on our strategic priorities 2 2018 STRONG PROGRESS DELIVERING OUR STRATEGIC
Britvic plc. Interims presentation 2015
 Britvic plc Interims presentation 2015 Gerald Corbett Chairman John Gibney Chief Financial Officer Continued strong earnings growth in challenging trading conditions -0.7% +6.2% +60bps +11.6% 0.4x +9.8%
Britvic plc Investor presentation
 Britvic plc Investor presentation BRITVIC INVESTMENT CASE A TRACK RECORD OF CREATING SHAREHOLDER VALUE Portfolio of Market Leading Brands Strong Channel Positions Healthier / Better For You Focus Growing
annual annual Britvic plc
 annual report Britvic at a glance Britvic is one of the leading branded soft drinks businesses in Europe. The company leverages its own leading brand portfolio including Robinsons, Tango, drench, J 2 O
24/7. A day in the life of Britvic
 24/7 A day in the life of Britvic Annual Report Overview 01/ Our performance at a glance 02/ about us 03/ Our brand portfolio 06/ where we are 10/ our people 11/ Strategy for Growth Business review 14/
Britvic plc Preliminary Results 26 November 2014
 Preliminary Results 26 November 2014 announces its preliminary results for the 52 weeks ended 28 September 2014. All numbers quoted are on a constant currency basis and are pre-exceptional and other items,
24/7. A day in the life of Britvic
 24/7 A day in the life of Britvic Interim Report 2010 Overview 01/ Our Performance at a Glance 04/ every minute, every hour, every day 05/ our brand portfolio 08/ who we are Operating and Financial Review
Britvic plc Preliminary Results 30 November 2016
 Britvic plc Preliminary Results 30 November 2016 Britvic plc announces another year of strong results for the 53 weeks ended 2 October 2016. Group Financial Headlines: Revenue increased 10.1% to 1,431.3m
Britvic plc Interim Results 24 May 2017 Covering the 28 weeks ended 16 April 2017.
 Britvic plc Interim Results 24 May 2017 Covering the 16 April 2017. A strong first half performance, confident of meeting market expectations for FY17 Group Financial Headlines: Revenue increased 11.5%
Britvic plc. Interim
 Britvic plc Interim Report 2009 02/ Chairman s Statement 04/ operating and finance review: 04/ chief Executive s review 10/ finance and business review 14/ Business resources 15/ risks and uncertainties
52 weeks ended 1 October 2017 m 1, % p. 52.9p. 26.5p. 2.0x
 Britvic plc Preliminary Results 29 November For the 1 October. A strong performance delivered by the successful execution of our strategy Group Financial Headlines: Revenue increased 7.7% to 1,540.8m with
Britvic plc Annual Report 2008
 Britvic plc Annual Report Who We Are Britvic is one of the two leading branded soft drinks businesses in the UK and the Republic of Ireland. Many of our brands are either first or second in their respective
PT Ultrajaya Milk Industry & Trading Company Tbk. FY 2013 results update
 PT Ultrajaya Milk Industry & Trading Company Tbk. FY 2013 results update April 2014 0 Disclaimer These materials are not intended to be a public offering document under Law of the Republic of Indonesia
Looking to the medium term
 Looking to the medium term Issued: 4 September 2013 Legal notice This presentation has been prepared to inform investors and prospective investors in the secondary markets about the Group and does not
The Proposed Acquisition. Fruité Entreprises SA
 The Proposed Acquisition Of Fruité Entreprises SA 1 This presentation does not constitute an offer to sell or issue or the solicitation of an offer to buy or subscribe for the securities mentioned herein
Britvic plc Preliminary Results 29 November 2018 For the 52 weeks ended 30 September 2018.
 Britvic plc Preliminary Results 29 November For the 30 September. Another strong performance driven by the continued execution of our strategy Group Financial Headlines: Revenue increased 5.1% to 1,503.6m
24/7. A day in the life of Britvic
 24/7 A day in the life of Britvic Annual Report Overview 01/ Our Performance at a Glance 03/ OUR BRAND PORTFOLIO 06/ WHO WE ARE 07/ WHERE WE ARE 08/ Strategy for Growth 09/ BRAND HIGHLIGHTS Business review
Annual Report making life s everyday moments more enjoyable
 Annual Report 2016 making life s everyday moments more enjoyable Contents Strategic report 2 Chairman s introduction 4 Britvic at a glance 6 Our brands 8 Our business model 10 Trends 11 Our geographies
ANNOUNCEMENT OF PRELIMINARY RESULTS
 The leading high service distributor to engineers worldwide ANNOUNCEMENT OF PRELIMINARY RESULTS YEAR ENDED 31 MARCH 2009 29 May 2009 Agenda Overview and current trading Ian Mason Financial performance
Availability, Reliability, Ease. 11 September 2018
 Availability, Reliability, Ease 11 September 2018 LEGAL NOTICE This presentation has been prepared to inform investors and prospective investors in the secondary markets about the Group and does not constitute
Responsible investment in growth
 Responsible investment in growth Issued: 17 June 2014 Legal notice This presentation has been prepared to inform investors and prospective investors in the secondary markets about the Group and does not
Performance Report October 2018
 Structured Investments Indicative Report October 2018 This report illustrates the indicative performance of all Structured Investment Strategies from inception to 31 October 2018 Matured Investment Strategies
FY2018 Half-Year Results. 26 October, 2017
 FY2018 Half-Year Results 26 October, 2017 Disclaimer This presentation has been prepared solely in connection with the financial results of C&C Group plc (the "Company") for the period ended 31 August,
EABL F08 Investor Group Briefing
 EABL F08 Investor Group Briefing outperforming in a challenging environment... Gerald Mahinda - Group Managing Director Peter Ndegwa - Group Finance Director 29 August 2008, 16h00 Agenda > Business Review
Kerry Interim Results Presentation
 Kerry - 2005 Interim Results Presentation Introduction and Overview Hugh Friel Financial Review Brian Mehigan Business Review Hugh Friel Prospects and Future Development Hugh Friel Q&A H1 2005: Solid Performance
Making it happen. 6 March 2018
 Making it happen 6 March 2018 LEGAL NOTICE This presentation has been prepared to inform investors and prospective investors in the secondary markets about the Group and does not constitute an offer of
Availability, Reliability, Ease. 11 December 2018
 Availability, Reliability, Ease 11 December 2018 LEGAL NOTICE This presentation has been prepared to inform investors and prospective investors in the secondary markets about the Group and does not constitute
Financial & Business Highlights For the Year Ended June 30, 2017
 Financial & Business Highlights For the Year Ended June, 17 17 16 15 14 13 12 Profit and Loss Account Operating Revenue 858 590 648 415 172 174 Investment gains net 5 162 909 825 322 516 Other 262 146
Executive Summary. July 17, 2015
 Executive Summary July 17, 2015 The Revenue Estimating Conference adopted interest rates for use in the state budgeting process. The adopted interest rates take into consideration current benchmark rates
Fourth quarter results 2015
 1 Fourth quarter results 2015 11 February 2016 Peter A. Ruzicka, President & CEO Continued growth in the fourth quarter 4.1% organic growth 1 17% EBIT (adj.) 2 growth in BCG Full-year EPS doubled to NOK
Responsible investment in growth
 Responsible investment in growth Issued: 1 March 2016 Legal notice This presentation has been prepared to inform investors and prospective investors in the secondary markets about the Group and does not
H1 16 interim results. 22 September 2015
 H1 16 interim results 22 September 2015 Important notice 2 This presentation may include certain forward-looking statements, beliefs or opinions, including statements with respect to the Company s business,
Financial results & business update. Quarter ended 30 September October 2016
 Financial results & business update Quarter ended 30 September 2016 19 October 2016 Disclaimer 3 Any remarks that we may make about future expectations, plans and prospects for the company constitute forward-looking
Eric Foss Chairman & CEO. Al Drewes SVP & CFO
 Eric Foss Chairman & CEO Al Drewes SVP & CFO Cautionary Statement Statements made in this presentation that relate to future performance or financial results of PBG are forward-looking statements, which
Financial results & business update. Quarter and year ended 31 December February 2016
 Financial results & business update Quarter and year ended 31 December 2015 11 February 2016 Disclaimer 3 Any remarks that we may make about future expectations, plans and prospects for the company constitute
FY16 YEAR END RESULTS 5 APRIL 2016
 FY16 YEAR END RESULTS 5 APRIL 2016 DEFINITIONS AND IMPORTANT NOTICE The following definitions apply throughout Trading EBITDA (earnings before interest, tax, depreciation and amortisation): excludes exceptional
Kerry Preliminary Results Presentation
 Kerry - 2006 Preliminary Results Presentation Review of Business Hugh Friel Financial Review Brian Mehigan Business Growth Prospects Hugh Friel Q&A 2006 Performance Highlights Revenue growth of 4.9% to
Turkey s Largest Food Company
 Turkey s Largest Food Company F i r s t H a l f 2017 F i n a n c i a l R e s u l t s A u g 16, 2 0 1 7 Borsa Istanbul: ULKER ULKER.TI (Bloomberg) ULKER IS (Reuters) www.ulkerbiskuvi.com.tr Disclaimer This
Growing dynamically in Western Europe
 資料 5 Growing dynamically in Western Europe Vassilis Vovos Regional President, Western Europe Caution on Forward-Looking Statements Today s presentations contain forward-looking statements. These statements
Full Year Results. 4 October 2018
 Full Year Results 4 October 2018 Highlights Ian Filby Good strategic progress in a challenging market KEY FINANCIALS 1,125.6m +13.6% 76.1m -7.6% 38.3m -23.7% Gross sales Underlying EBITDA Underlying PBT
Interim Results For 6 months ended 31 Dec February 2018
 Interim Results For 6 months ended 31 Dec 2017 February 2018 Financial highlights 62.5m 55.7m 71.7m 13.7m 10.8m 15.8m 8.8m 11.2m 12.9m 16 17 18 16 17 18 16 17 18 REVENUE 71.7m (H1 FY17: 62.5m) +14.7% YEAR-ON-YEAR
Half Year Results 2012 ITV Transformation Plan delivers double digit revenue and profit growth
 Half Year Results 2012 ITV Transformation Plan delivers double digit revenue and profit growth 0 Agenda 1 Strategic and operating review Financial review Outlook Adam Crozier Ian Griffiths Adam Crozier
M&G Investments. Michael McLintock and Grant Speirs
 M&G Investments Michael McLintock and Grant Speirs Agenda M&G Group strategic overview Michael McLintock M&G s results and the industry Grant Speirs Business outlook and summary Michael McLintock 2 About
The Property Franchise Group. Half Year Results September 2016
 The Property Franchise Group Half Year Results September 2016 Agenda 2 Overview Ian Wilson, Chief Executive Officer Financial performance David Raggett, Chief Financial Officer Operational performance
Interim Results 2014
 Interim Results 2014 Ralph Findlay Chief Executive Officer Highlights 1. Good trading performance, in line with our expectations Growth in core profits in each trading segment Earnings per share up 10.8%
Results Briefing. Results for the first quarter ended 30 June August 2016
 Results Briefing Results for the first quarter ended 30 June 2016 11 August 2016 1 Executive summary Financial highlights Operational updates 2 Executive summary 1 55.8% growth in net profit to S$9.4 million
CPA Australia Plan Your Own Enterprise Competition
 Financial Plan Your financial plan should include: 1. A list of Start-Up Costs and how these will be paid for (eg from savings, bank loan or family loan) 2. A Breakeven Analysis, which includes: a list
Huhtamaki roadshow presentation. Investor Relations Q1 2009
 Huhtamaki roadshow presentation Investor Relations 2009 Huhtamaki in brief A leading manufacturer of consumer and specialty packaging with head office in Espoo, Finland Net sales EUR 2.3 billion in 65
Financial Highlights Store Network Consolidated Results Business Segments Working Capital Capital Expenditure Recent Developments
 20181113 Financial Highlights Store Network Consolidated Results Business Segments Working Capital Capital Expenditure Recent Developments 2 1,778 stores plus 1,914 TGP branches nationwide 13.1% yoy lift
ANNUAL GENERAL MEETING 2010
 ANNUAL GENERAL MEETING 2010 Business Overview Sales channel Products Sourcing Footprint Key Facts Business to business distribution 4.6bn revenue in 2009 Wide range of non-food consumable products From
Huhtamaki roadshow presentation. Investor Relations Copenhagen Jan 8, 2010
 Huhtamaki roadshow presentation Investor Relations Copenhagen Jan 8, 2010 Huhtamaki in brief A leading manufacturer of consumer and specialty packaging with head office in Espoo, Finland Net sales EUR
Electrocomponents 2017 half-year financial results. 18 November 2016
 Electrocomponents 2017 half-year financial results 18 November 2016 Agenda Overview of results Lindsley Ruth Financial results and performance update David Egan Performance Improvement Plan Lindsley Ruth
HALF YEAR RESULTS 20 AUGUST
 2014 HALF YEAR RESULTS 20 AUGUST 2014 www.glanbia.com CAUTIONARY STATEMENT This presentation contains forward-looking statements. These statements have been made by the Directors in good faith based on
Interim Results for the 6 months to 30 September NOVEMBER 2010
 Interim Results for the 6 months to 30 September 2010 8 NOVEMBER 2010 Nick Robertson Introduction Strong H1 Retail sales up 50%, group revenues up 45% Strong UK and international retail sales, up 26% and
Making it happen. 13 June 2017
 Making it happen 13 June 2017 LEGAL NOTICE This presentation has been prepared to inform investors and prospective investors in the secondary markets about the Group and does not constitute an offer of
SAP s Credit Rating - Rationale and Process
 SAP s Credit Rating - Rationale and Process Klaus Heizmann Head of Treasury Finance SAP SE November 19, 2015 Agenda Overview SAP M&A and debt history Credit rating: Rationale and process 2015 SAP SE. All
2014 Interim Results Presentation. 29 th July
 2014 Interim Results Presentation 29 th July 2014 1 Stephen A. Carter Group Chief Executive Measured change 2 2014 Interim results agenda Measured Change New Divisional Operating Model Strengthening Executive
Results Presentation. Full Year Ended 31 st May 2018
 Results Presentation Full Year Ended 31 st May 2018 Disclaimer This presentation, prepared by IG Group Holdings plc (the Company ), may contain forward-looking statements about the Company. Such forward-looking
ING Belgium Adapting to a changing market
 ING Belgium Adapting to a changing market ING Investor Day Jan Op de Beeck CEO ING Retail Belgium Rotterdam 9 April 2009 www.ing.com Key Messages Changing market conditions and customer behaviour led to
Business & Financial Services December 2017
 Business & Financial Services December 217 Completed Procurement Transactions by Month 2 4 175 15 125 1 75 5 2 1 Business Days to Complete 25 Jan Feb Mar Apr May Jun Jul Aug Sep Oct Nov Dec 217 Procurement
Forward Looking Statements
 Damian Gammell, CEO Nik Jhangiani, CFO 1 1 Forward Looking Statements This document contains statements, estimates or projections that constitute forward-looking statements concerning the financial condition,
Rebalanced ITV delivers continued good growth Interim Results 2016
 Rebalanced ITV delivers continued good growth Interim Results 2016 27 July 2016 Agenda Key Messages and H1 Highlights Adam Crozier Half Year Financial Results Ian Griffiths Strategic Outlook Adam Crozier
PRESENTATION OF FINANCIAL RESULTS
 PRESENTATION OF FINANCIAL RESULTS LINDA MASTERSON GROUP MANAGING DIRECTOR 28 March 2018 0 EDGARS 1 EXECUTIVE SUMMARY Sales growth: Edgars 16.5%, Jet 35.8%. Significant improvement in quality of debtors
Domino s Pizza UK & IRL plc. Preliminary Results for the 52 weeks ended 30 December 2007
 Domino s Pizza UK & IRL plc Preliminary Results for the 52 weeks ended 30 December 2007 The Team Stephen Hemsley Executive Chairman Chris Moore Chief Executive Officer Lee Ginsberg Chief Financial Officer
2017 GENERAL MEETING. Arnaud Lagardère General and Managing Partner. 4 May 2017
 2017 GENERAL MEETING Arnaud Lagardère General and Managing Partner 4 May 2017 CONTENTS 1 2 3 4 OUR MARKETS AND TRENDS OUR GROUP TODAY OUR VALUE CREATION STRATEGY OUR PERFORMANCE 5 OUR OUTLOOK 2 OUR MARKETS
UK retail sales 137, ,967 26% International retail sales 214, ,954 39%
 2 3 000s Six months to 28 February 2013 Six months to 29 February 2012 Change Group revenues 1 359,731 269,926 33% Retail sales 352,263 262,921 34% UK retail sales 137,579 108,967 26% International retail
Group Results Presentation for the six months ended 31 March 2016
 Group Results Presentation for the six months ended 31 March 2016 Index Overview Financial performance Operational performance Outlook 2 Overview Noel Doyle Chief Operating Officer Disclaimer Forward-looking
Forward-Looking Statements
 1 Forward-Looking Statements This document may contain statements, estimates or projections that constitute forward-looking statements. Generally, the words believe, expect, intend, estimate, anticipate,
2017 Full Year. Results Presentation. 21 February 2018
 2017 Full Year Results Presentation 21 February 2018 CAUTIONARY STATEMENT 2017 Full Year Results Slide 2 Full Year Highlights 2017 Full Year Results Presentation 8TH YEAR OF DOUBLE-DIGIT GROWTH 2017 FINANCIAL
Kerry Preliminary Results Presentation
 Kerry - 2005 Preliminary Results Presentation Review of Business Hugh Friel Financial Review Brian Mehigan Business Growth Prospects Hugh Friel Q&A 2005 Performance: Key Accomplishments Good top-line and
Domino s Pizza UK & IRL plc Interim Results for the 26 weeks ended 2 July _interim_results
 Interim Results for the 26 weeks ended 2 July 2006 The Team Stephen Hemsley, Chief Executive Chris Moore, Chief Operating Officer Lee Ginsberg, Finance Director 2 Financial Highlights System sales up 18.3%
Arçelik Financial Results
 Arçelik 2015 Financial Results 4Q15 developments Key developments Strong growth in international sales, both organic and FX related Record breaking monthly international sales in October and November Good
Six good reasons for choosing DNB in the new banking environment
 Six good reasons for choosing DNB in the new banking environment Bank of America Merrill Lynch, 18th Annual Banking & Insurance CEO Conference 2013 24 September, London Rune Bjerke, CEO of DNB 1 Reason
Varun Beverages Limited
 February 20, 2017 Varun Beverages Limited Q4 & 2016 Results Presentation Fizzy Juicy Packaged Water Disclaimer Certain statements in this communication may be forward looking statements within the meaning
Foxtons Interim results presentation For the period ended June 2017
 Foxtons Interim results presentation For the period ended June 2017 Important information This presentation includes statements that are, or may be deemed to be, forward-looking statements. These forward-looking
2017 HALF-YEAR RESULTS
 I 1 I 2017 HALF-YEAR RESULTS July 27, 2017 Emmanuel Faber, CEO Cécile Cabanis, CFO I 2 I This document is presented by Danone. It contains certain forward-looking statements concerning Danone. In some
Woongjin Coway IR Presentation Materials
 0 Woongjin Coway IR Presentation Materials March 2007 WOONGJIN COWAY CO., LTD. (021240) 1 Disclaimer This presentation contains historical information of the Company which should not be regarded as an
2012 Preliminary Results For the year ended 31 December Proven strategy adds value to customers, delivers growth and increases resilience
 2012 Preliminary Results For the year ended 31 December 2012 Proven strategy adds value to customers, delivers growth and increases resilience Agenda Overview Financial highlights Growth Strategy Market
AUDITED RESULTS FOR THE YEAR ENDED 31 DECEMBER 2016
 AUDITED RESULTS FOR THE YEAR ENDED 31 DECEMBER 2016 AGENDA 2 1 Opening remarks / market update 2 Financial results 3 Operational review 4 Strategy update 5 Outlook 1 2 3 4 5 OPENING REMARKS / MARKET UPDATE
Cost Estimation of a Manufacturing Company
 Cost Estimation of a Manufacturing Company Name: Business: Date: Economics of One Unit: Manufacturing Company (Only complete if you are making a product, such as a bracelet or beauty product) Economics
July-September Experian plc. All rights reserved. Experian Public.
 July-September 2015 Overview Snapshot of Experian Revenue: US$4.8 bn EBIT: US$1.3 bn Market Cap*: c. 12 bn In top 50 of FTSE-100 Employees: c.17,000 Offices in 39 countries Largest markets: US, Brazil,
XML Publisher Balance Sheet Vision Operations (USA) Feb-02
 Feb-02") Page:1 Apr-01 May-01 Jun-01 Jul-01 ASSETS Current Assets Cash and Short Term Investments 15,862,304 51,998,607 9,198,226 Accounts Receivable - Net of Allowance 2,560,786
Page:1 Apr-01 May-01 Jun-01 Jul-01 ASSETS Current Assets Cash and Short Term Investments 15,862,304 51,998,607 9,198,226 Accounts Receivable - Net of Allowance 2,560,786
FORWARD-LOOKING STATEMENTS
 1 FORWARD-LOOKING STATEMENTS This document may contain statements, estimates or projections that constitute forward-looking statements concerning the financial condition, performance, results, strategy
Non-standard monetary policy in the euro area Economics Roundtable discussion (8 September 2017)
") Non-standard monetary policy in the euro area Economics Roundtable discussion (8 September 2017) Gillian Phelan Outline Monetary policy action Interest rate policy Non-standard measures Monetary policy
Non-standard monetary policy in the euro area Economics Roundtable discussion (8 September 2017) Gillian Phelan Outline Monetary policy action Interest rate policy Non-standard measures Monetary policy
SND. Sanderson Group. Buy. In-line With Expectation Full-Year Results. Target price. Update 27 th November 2013
 Sanderson Group In-line With Expectation Full-Year Results Sanderson Group has announced full-year results which are in-line with our expectations. We have upgraded our forecasts for FY14, while providing
Amsterdam - May 17 th, Philippe Camus CEO - Rainer Hertrich CEO
 AGENDA Acceptance and approval of the Report of the Board of Directors Adoption of the accounts for the financial year 2001 Approval of the result allocation, distribution and payment date of dividends
2015 INSOLVENCY AND RESTRUCTURING FORUMS. Retail insolvency. A practitioner s guide to key issues and challenges
 Retail insolvency A practitioner s guide to key issues and challenges Agenda Introduction Quick overview of retail in Canada So now what do you do with an insolvent retailer? Questions Key retail macro-economic
Half year result. 26 August 2016
 2016 Half year result 26 August 2016 Alison Watkins Group Managing Director Martyn Roberts Group Chief Financial Officer Barry O Connell MD Australian Beverages Agenda Group Result Summary Shareholder
Market presentation. February 2008
 Market presentation February 2008 1. Alfesca at a glance 2. Operational review by pillar Salmon and other fish Foie gras and duck products Prawns and other shellfish Blinis and spreadables 3. Financial
Shaping our future. René Hooft Graafland. Member of the Executive Board/ CFO
 New York 6 March 2012 Disclaimer This presentation contains forward-looking statements with regard to the financial position and results of HEINEKEN s activities. These forward-looking statements are subject
Growth and diversification. 7 March 2017
 Growth and diversification 7 March 2017 LEGAL NOTICE 2 This presentation has been prepared to inform investors and prospective investors in the secondary markets about the Group and does not constitute
Maruti Suzuki (RHS) BUY. Operationally In Line; Reiterate Buy. Automobiles October 31, 2014 RESULT REVIEW. Outlook & Valuation.
 BUY. Operationally In Line; Reiterate Buy. Automobiles October 31, 2014 RESULT REVIEW. Outlook & Valuation.") Oct13 Dec13 Jan14 Feb14 Apr14 May14 Jun14 Aug14 Sep14 Oct14 India Research Automobiles RESULT REVIEW Bloomberg: MSIL IN Reuters: MRTI.BO BUY Operationally In Line; Reiterate Buy India s (MSIL) Revenue/EBIDTA/PAT
Oct13 Dec13 Jan14 Feb14 Apr14 May14 Jun14 Aug14 Sep14 Oct14 India Research Automobiles RESULT REVIEW Bloomberg: MSIL IN Reuters: MRTI.BO BUY Operationally In Line; Reiterate Buy India s (MSIL) Revenue/EBIDTA/PAT
Preliminary Results 25th February 2002
 Preliminary Results 25th February 2002 agenda Introduction - Mike Harris Operational Review - Paul Gratton Financial Results - Stacey Cartwright Outlook & Summary - Paul Gratton Slide 1 agenda Introduction
Acquisition of The Gaymer Cider Company - Portfolio Diversification & Growth
 Acquisition of The Gaymer Cider Company - Portfolio Diversification & Growth 30 November, 2009 Disclaimer This presentation does not constitute an invitation to underwrite, subscribe for, or otherwise
(Registration no C) (Registration no C) Financial Results. (unaudited) 11 November 2009
 (Registration no C) Financial Results. (unaudited) 11 November 2009") 3 rd Quarter and 9-Month 9 2009 Financial Results (unaudited) 11 November 2009 1 Important note on forward looking statements The presentation herein may contain forward looking statements by the management
3 rd Quarter and 9-Month 9 2009 Financial Results (unaudited) 11 November 2009 1 Important note on forward looking statements The presentation herein may contain forward looking statements by the management
Monster Beverage. CONSUMER PACKAGED GOODS RESEARCH November 9, Momentum to Continue & Margins Improve, PT to $64
 Global Equity Research Company Note Earnings Update CONSUMER PACKAGED GOODS RESEARCH Monster Beverage Momentum to Continue & Margins Improve, PT to $64 KEY TAKEAWAYS Growth remains strong and momentum