Market presentation. February 2008
|
|
|
- Megan Sims
- 5 years ago
- Views:
Transcription


1 Market presentation February 2008


2 1. Alfesca at a glance 2. Operational review by pillar Salmon and other fish Foie gras and duck products Prawns and other shellfish Blinis and spreadables 3. Financial review 4. Future prospects
3 1. Alfesca at a glance 2. Operational review by pillar Salmon and other fish Foie gras and duck products Prawns and other shellfish Blinis and spreadables 3. Financial review 4. Future prospects
4 Alfesca at a glance: Q2 07/08 highlights Strong sales growth well balanced by pillar Sales m up 11.5% (up 5.2% proforma) versus last year Good profit increase Ebitda 38.1 m up 9.7% (+ 3.4 m) versus last year Net income 22.5 m up 15.7% versus last year Key achievements Strong market share gains in growing markets Satisfactory launch of new product categories across businesses, especially with the Christmas ranges Salmon and prawn prices in line with expectations Concerns of the period Duck prices linked to commodity prices Adverse Sterling effect Integration of LTG and Adrimex delivering positive results Sales up by 1.4% versus last year for LTG Sales up by 13.8% versus last year for Adrimex Synergies starting to deliver 4


5 Alfesca at a glance: Q2 07/08 Net sales by pillar vs LY : m % vs LY (*) Total group pro forma Q2 : % vs LY Smoked salmon Foie gras & other fish & other duck products Blinis & spreadables Prawns Q1 +5.3% Q1-0.6% Q1 +7.0% Q1 +4.4% Q2 +2.9% Q2 +4.8% Q2 +3.4% Q % YTD +3.7% YTD +3.9% YTD +4.6% YTD +8.2% 5 (*) : Adrimex and LTG proforma for LY, CP excluded


6 Alfesca at a glance: Q2 07/08 Net sales by company vs LY (*) Total Group Proforma Q2 : + 5.2% vs LY *Tota group pro forma : + 4,7 % vs LY Q1 +4.6% Q % Q1-19.1% Q1 +2.7% Q1 +7.1% Q1-0.3% Q1 +4.9% Q % Q2 +3.1% Q2-16.8% Q % Q2 +4.1% Q2-4.9% Q2 +8.8% YTD +7.9% YTD +6.8% YTD -17.6% YTD +8.6% YTD +5.1% YTD -3.0% YTD +8.0% Skandia and Delpierre sales impacted by our decision to discontinue the low price/low margin products 6 (*) : Adrimex and LTG proforma for LY, CP excluded
7 Alfesca at a glance: all indicators strongly improving vs last year Figures in million 07/08 Q2 06/07 Q2 Var in % 07/08 H1 06/07 H1 Var in % NET SALES % % EBIT % % EBITDA % % NET INCOME % % EBITDA excluding equity plan for Q2 07/08 was 39.1 up 12.7% versus last year and for H1 07/08 was up by 23% 7
8 1. Alfesca at a glance 2. Operational review by pillar Salmon and other fish Foie gras and duck products Prawns and other shellfish Blinis and spreadables 3. Financial review 4. Future prospects

9 1. Alfesca at a glance 2. Operational review by pillar Salmon and other fish Foie gras and duck products Prawns and other shellfish Blinis and spreadables 3. Financial review 4. Future prospects
10 Salmon raw mat: Norway FHL price 2005 to 2008 (3/4kg in Nok/kg) Week FHL 05 FHL 06 FHL 07 FHL 08 10

11 Salmon raw mat: Norwegian Dec 07 vs Dec 06 * Generation Harvest period Volume WFE 31/12/07 Harvest period Volume WFE 31/12/06 Var in % 06/S1 Sep 07 to March Sep 06 to Mar % 06/S0 Apr 08 to Aug Apr 07 to Aug % 07/S1 Sep 08 to Mar Sep 07 to Mar % 07/S0 Apr 09 to Aug Apr 08 to Aug % Good availability of Norwegian salmon for the coming year does not require a high level of hedging to take advantage of possible lower salmon prices * Kontali Jan 08 11

12 Salmon raw mat: Scottish Dec 07 vs Dec 06 * Generation Harvest period Volume WFE 31/12/07 Harvest period Volume WFE 31/12/06 Var in % 06/S1 Sep 07 to March Sep 06 to Mar % 06/S0 Apr 08 to Aug Apr 07 to Aug % 07/S1 Sep 08 to Mar Sep 07 to Mar % 07/S0 Apr 09 to Aug Apr 08 to Aug % The expected volatility of Scottish salmon prices lead us to contract fixed quantities at fixed prices for the major part of our supply * Kontali Jan 08 12
13 Salmon market: value trends in million +5.5% Strong consumption growth Quarter +7.1% % Q2 06/07 Q2 07/08 Q2 06/07 Q2 07/08 Q2 06/07 Q2 07/08 French market (Iri source for Oct-Dec) UK market (TNS Worldpanel Oct-Dec) Spanish market (Nielsen Oct-Dec) % 410 Calendar year % % French market (Iri source for full year) UK market (TNS Worldpanel for full year) Spanish market (Nielsen for full year)
 30.8% (+1.1 pts) 42.7% (+0.2 pts) (-0.6 pts) 5.3% 7.")
14 Salmon market: Labeyrie brand good results Q2 Value market share (IRI Oct 16th 07 to Jan 6th, 08) (+0.6 pts) 30.8% (+1.1 pts) 42.7% (+0.2 pts) (-0.6 pts) 5.3% 7.4% LABEYRIE DELPIERRE PLB 1st prices 14
15 Salmon market: Labeyrie brand good results Labeyrie brand awareness on smoked salmon buyers (Sofres 2008) Jan 04 Jan 05 Jan 06 Jan 07 Jan 08 83% 84% 81% 87% 89% New "Labeyrism" TV campaign 15


16


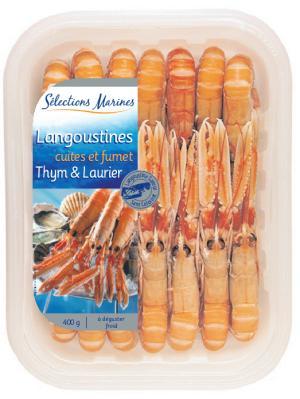
17 Salmon and other fish Q2 operational highlights High contribution of innovations Festive range New Vodka Lemon smoked salmon France Classical range Festive dinners France New trends Smoked salmon towers France 17

")

18 Salmon and other fish Q2 operational highlights High contribution of innovations Festive range Smoked salmon fans (Albanico) Spain Classical range Grande Selezioni Italy New trends Seafood and asparagus towers UK 18
19 Salmon and other fish net sales in million Continuous and significant development of this pillar Q2 H1 (July-Dec) +3.7% +2.9% +5.4% 168, % 112, , % 78,5-17.3% +12.7% -18.1% 19, , , , UK + Exports France + Exports Spain + Exports Total Q2 06/07 Q2 07/08 UK + Exports France + Exports Spain + Exports Total H1 06/07 H2 07/08 19


 Festive range of")
20 Salmon and other fish outlook Consumption of salmon will continue to grow in line with the demand for convenient, festive and healthy food Alfesca will keep on innovating strongly on the smoked salmon market but also on the other product categories such as natural fish cuts, with the just cook concept Alfesca supports sustainable development efforts: with new MSC labelled products Vensy will be the first in Spain to be certified on the wet fish counter Raw material will either remain stable (Norway) or be properly contracted (Scotland) Festive range of salmon will see another peak at Easter 20

21 1. Alfesca at a glance 2. Operational review by pillar Salmon and other fish Foie gras and duck products Prawns and other shellfish Blinis and spreadables 3. Financial review 4. Future prospects
22 /MT Cereals and soy purchase price /MT January 1, 2006 February 1, 2006 Current high cereals prices (corn, wheat, soy) : March 1, 2006 April 1, 2006 May 1, 2006 June 1, 2006 July 1, 2006 August 1, 2006 September 1, 2006 October 1, 2006 November 1, 2006 December 1, 2006 January 1, 2007 February 1, 2007 March 1, 2007 April 1, 2007 May 1, 2007 June 1, 2007 July 1, 2007 August 1, 2007 September 1, 2007 October 1, 2007 November 1, 2007 December 1, 2007 Increasing population with higher standards of living (China, India) Increasing need for ethanol particularly in the USA Increasing financial speculations (stock exchange and real estate drop) Stabilization of corn and wheat prices (more production is forecasted) 22 January 1, 2008 February 1, 2008 Soy Wheat Corn
23 Duck raw mat: purchase price in /duck We have revised our assumptions upwards 2007/2008 Actuals + forecast Previous forecast Average 2006/ Average 2006/ Jul Aug Sep Oct Nov Dec Jan Feb Mar Apr May Jun 23
24 Foie gras market: value trends in million Consumption increasing year after year Quarter Calendar year % % Q2 06/07 Q2 07/ French market (Iri source for Oct-Dec) French market (Iri source for full year) 24
25 Foie gras market: good Labeyrie brand results Q2 Value market share (IRI Oct 16th 07 to Jan 6th, 08) (+0.7 pts) (+1.9 pts) 36.2% 26.4% (-1.7 pts) 11.7% (+1.7 pts) 6.9% Labeyrie Montfort Delpeyrat PLB 25
26 Foie gras market: the Labeyrie brand reference Labeyrie brand awareness on foie gras buyers (Sofres 2008) Jan 04 Jan 05 Jan 06 Jan 07 Jan 08 86% 85% 82% 90% 95% New "Labeyrism" TV campaign 26


27 Foie gras and duck Q2 operational highlights High contribution of innovations Festive range Le Grand Foie gras New Torchon Classical range 1) Easy to open 2) Best seller preserves department 1 2 New trends Chutneys for Foie gras 27
28 Foie gras and duck products net sales in million (1) Strong growth driven by very satisfactory Christmas sales Q2 H1 (July-Dec) +4.8% % (1) : Labeyrie brand and second brands 28


29 Foie gras and duck products outlook Commodity prices will still impact our raw material costs. We are negotiating our prices with our customers to offset the deviation. The next peak in foie gras sales will be Easter We are preparing for the summer duck meat consumption peak We are close to starting our new Christmas 08 range negotiation with our customers 29

30 1. Alfesca at a glance 2. Operational review by pillar Salmon and other fish Foie gras and duck products Prawns and other shellfish Blinis and spreadables 3. Financial review 4. Future prospects

31 Prawns raw material prices Good availability Stable prices 31
 Q2 06/07 Q2 07/08 UK market (TNS source for Oct-Dec) Calendar year 382.5 +9.7% 419.6 251.3 +21.4% 305.")
32 Prawns market: value trend in million Dynamic market both in France and in the UK Quarter % % 93.2 Q2 06/07 Q2 07/08 French market (TNS/IRI source for Oct-Dec) Q2 06/07 Q2 07/08 UK market (TNS source for Oct-Dec) Calendar year % % French market (TNS/IRI source for full year) UK market (TNS source for full year) 32


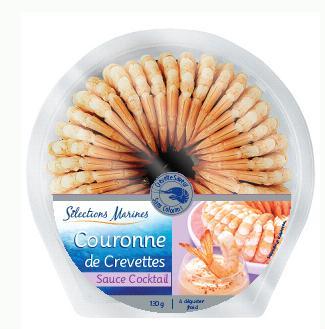


33 Prawns and other shellfish Q2 operational highlights Strong sales from the christmas range Prawn ring big hit Successful innovation policy drives sales and increases our market share in growing markets 33
34 Prawns and other shellfish net sales in million Q % % % We are moving faster than the market UK + Exports France + Exports Total prawn net sales H1 (Jul-Dec) + 8.2% % % (Including Adrimex proforma) UK + Exports France + Exports Total prawn net sales 34


35 Prawns and other shellfish outlook Market will continue to grow at a high pace as prawns are viewed as healthy, convenient, and trendy Warm water prawns are becoming more and more attractive and gaining market shares over cold water prawns Good availability of raw material means stable prices Continuous NPD: Chinese New Year special product Valentine s product to share Summer barbecue range 35
36 1. Alfesca at a glance 2. Operational review by pillar Salmon and other fish Foie gras and duck products Prawns and other shellfish Blinis and spreadables 3. Financial review 4. Future prospects
37 Blinis and spreadables calendar year value market trend in million Good demand for these fusion food products Blini % Tarama % (Nielsen source for full year) 45.4 Spreadables +9.1%

38 Blinis and spreadables Q2 market share Successful performance for the Blini brand Blini + 2 pts Tarama + 3 pts 36% 45% + 5 pts = 48% 40% - 1 pt 5% + 1 pt 4% BLINI LTG PLB BLINI LTG PLB Spreadables + 5pts + 3 pts 17% = 19% 28% BLINI LTG PLB 38


39 Blinis and Spreadables Q2 operational highlights Good success of the apéro blinis now reaching important volumes Very efficient Christmas promotions on the salmon tarama, sales doubled versus LY Big performance from the spreadables: all winners! +40% +44% +28% +43% 39

 +6.0% 20.4 21.6 + 1.9% + 2.7% +12.4% 6.9 7.0 6.1 6.3 7.")
40 Blinis and Spreadables net sales in million Q2 +7.0% % + 3.0% +16.0% Branded and PLB sales Blini Tarama V Spreadable Total H1 (Jul-Dec) +6.0% % + 2.7% +12.4% Blini Tarama V Spreadable Total 40


41 Blinis and Spreadables outlook Synergies between Blini and LTG already delivering and anticipated to grow in the near future Raw mat and packaging supply Shipping organisation Production planning and capacity All raw material prices for the pillar, oil, flour, and dairy products, will remain high New prices are under negotiation with our customers We will launch a new summer range of dippings for vegetables 41
42 1. Alfesca at a glance 2. Operational review by pillar Salmon and other fish Foie gras and duck products Prawns and other shellfish Blinis and spreadables 3. Financial review 4. Future prospects
43 Financial review: Income statement versus last year in million Q2 Sales growth : 11.5% H1 EBITDA margin : 11.5% Income statement in million 07/08 Q2 06/07 Var % 07/08 H1 06/07 Var % Net sales % % Cost of goods sold (203.6) (186.2) 9.4% (319.4) (286.4) 11.5% Gross profit % % Gross margin % 22.3% 20.8% 19.4% 17.4% Operating expenses (25.2) (18.4) 37.2% (40.9) (30.9) 32.3% EBIT % % EBIT % 12.7% 12.9% 9.0% 8.5% Net financial expenses (3.2) (2.9) 10.2% (5.1) (6.1) -16.9% Net profit before taxes % % Income tax (7.6) (8.1) -6.0% (7.4) (6.0) 24.7% Discontinued operations Net profit for the period % % EBITDA % % EBITDA % 14.5% 14.8% 11.5% 11.0% 43
44 Financial review: sales and EBITDA development in million Q2 EBITDA up by 32.7% over 2 years Q2 EBITDA margin up by 1.6 pts over 2 years Net Sales million EBITDA million Q2 05/06 Q3 05/06 Q4 05/06 Q1 06/07 Q2 06/07 Q3 06/07 Q4 06/07 Q1 07/08 Q2 07/
45 Actuals versus market consensus Alfesca s profit above expectations Q2 07/08 Average Actual Var vs. average Sales in m (2.1) EBITDA in m Net income in m EBITDA % 13.7% 14.5% 45
46 Financial review: Balance sheet in million Balance sheet - Assets million 31/12/ /12/2006 Intangible assets % % Operational assets % % Long-term investments % % Non current Assets % % Inventories % % Receivables % % Bank deposits and cash % % Current assets % % Total assets % % Reduction in working capital requirements Balance sheet - Shareholders equity and Liabilities million 31/12/ /12/2006 Shareholders equity % % Long-term liabilities % % Deferred tax liabilities % % Obligations 7.8 1% % Long-term liabilities and obligations % % Bank loans % % Current maturities of long-term debt % % Other current liabilities % % Trade payables % % Current liabilities % % Shareholders equity and liabilities % % Sound financial structure Current ratio Equity ratio 41.4% 41.9% 46
47 Financial review: Cash flow in million Cash flow from operating activities up 23.3% Net cash position 41 million as of January 31 Cash flow in million 07/08 July-Dec 06/07 July-Dec Cash flow from operating activities Working capital provided by operating activities (66.0) (72.1) Tax paid / received (0.0) 2.9 Net Cash flow from operating activities (22.7) (34.0) Capital expenditures (8.5) (8.3) Proceeds from sales of subsidiaries 13.4 Proceeds (Purchases) of other assets (2.0) 5.1 Net Cash flow from investing activities (10.6) 10.3 Net Cash flow from financing activities Change in cash for the period
48 Financial review: Key ratios Improved performance in all key areas Main ratios by Dec end CALENDAR YEAR EBITDA ratio 9.2% 8.7% Current ratio Equity ratio 41.4% 41.9% Return on Equity 9.7% 6.5% Earnings per share (Euro cents)
49 Key highlights for 2007 versus last year CALENDAR YEAR 2007 SALES UP 15.8% EBITDA UP 21.5% PAT UP 59.1% MARKET CAP UP 37.5% 2 acquisitions in 2007 Refinancing completed 49
50 ISK pr. share Shareprice performance /01/ /03/ /05/ /07/ /09/ /11/ /01/ /03/ /05/ /07/ /09/ /11/ /01/2008 Alfesca ICEX 15 (Index) 50

51 1. Alfesca at a glance by pilar 2. Operational review Salmon and other fish Foie gras and duck products Prawns and other shellfish Blini and spreadables 3. Financial review 4. Future prospects
52 Future prospects 2008 will be a challenging year: oil and commodities prices will remain very high strong retailer s pressure on our sales prices all over Europe However, Alfesca is well prepared to keep on growing thanks to a cocktail of good ingredients: growing markets with a strong demand for convenient, healthy and festive foods excellent track record of innovative products quickly creating new areas of consumption solid customer relationships ( good products, right price, excellent service rate ) appropriate industrial investments to ensure higher sales at low production costs Alfesca will continue to speed up its growth contemplating strategic acquisitions 52

53 Thank you 53
Market presentation 2 September 2008
 Market presentation Q4 2008 1 Market presentation 2 September 2008 Q4 07/08 Results 1. Alfesca at a glance 2. Operational review by pillar Salmon and other fish Foie gras and duck products Blinis and spreadables
Q October- December 2006
 Q2 06-07 October- December 2006 AGENDA - ALFESCA AT A GLANCE XG - RAW MAT BAROMETER XG - OVERVIEW BY COMPANY XG - ADRIMEX FOCUS AH - FINANCIAL DETAILS PP - OUTLOOK XG AGENDA - ALFESCA AT A GLANCE XG -
Full Year 1 July June 06
 Full Year 1 July 05 30 June 06 MISSION STRATEGY FDK 05-06 RATIONALS BUSINESS MODEL ALFESCA MISSION ALFESCA s mission is to be the leader in selected convenience fine Seafood Products and Regional Specialty
Questions - Fishpool seminar Bergen
 Questions - Fishpool seminar Bergen Paul Aandahl, Seafood Analyst, Norwegian Seafood Council 22.11.2018 Global supply Global Trade Estimates Atlantic Salmon Volume wfe Value 2 000 000 1 800 000 1 600 000
Investor Teleconference Presentation Third Quarter October 25, 2006
 Investor Teleconference Presentation October 25, 10/25/06 2 Earnings Teleconference Forward Looking Statements This document contains forward-looking statements within the meaning of the Private Securities
Santiago, May 11 th, Results Presentation 1Q18
 Santiago, May 11 th, 2018 Results Presentation 1Q18 Agenda I. Highlights II. III. Financial Statements Supply, Demand and Prices IV. Farming Operation V. Prospects 2 Highlights EBIT 1Q18 USD 18.8 million
Results for first half of Financial analysts' presentation
 Results for first half of 2017 Financial analysts' presentation 17.08.2017 Bell Food Group overview of first half of 2017 Operating income Sales in 1,000 tonnes Half-year profit Number of employees as
Fishpool Christmas Seminar 2017 Bearish signals going into 2018
 Photo: SB1 Markets SEAFOOD SALMON FARMING Fishpool Christmas Seminar 2017 Bearish signals going into 2018 Tore A. Tønseth Phone : (+47) 24 14 74 18 Mobile : (+47) 95 80 62 77 E-mail : tore.tonseth@sb1markets.no
Athens Greece May Months 2009 Results Presentation
 Athens Greece May 2009 3 Months 2009 Results Presentation NIREUS AQUACULTURE S.A. Nireus at a glance The leader in seabass and seabream fish farming - A fully integrated producer - Production facilities
Six good reasons for choosing DNB in the new banking environment
 Six good reasons for choosing DNB in the new banking environment Bank of America Merrill Lynch, 18th Annual Banking & Insurance CEO Conference 2013 24 September, London Rune Bjerke, CEO of DNB 1 Reason
Electrocomponents 2017 half-year financial results. 18 November 2016
 Electrocomponents 2017 half-year financial results 18 November 2016 Agenda Overview of results Lindsley Ruth Financial results and performance update David Egan Performance Improvement Plan Lindsley Ruth
Britvic plc. Preliminary Results 2011
 Britvic plc Preliminary Results 2011 Gerald Corbett Chairman John Gibney Group Finance Director Agenda Financial performance John Gibney Britvic and the market review Paul Moody Group performance +14.6%
South Region Committee Brexit and the Associated Challenges
 South Region Committee Brexit and the Associated Challenges event in Tralee with Jim Power Tralee, 17 October 2017 Brexit and the Associated Challenges The Institute of Banking, Tralee October 17 th 2017
Kerry Interim Results Presentation
 Kerry - 2005 Interim Results Presentation Introduction and Overview Hugh Friel Financial Review Brian Mehigan Business Review Hugh Friel Prospects and Future Development Hugh Friel Q&A H1 2005: Solid Performance
FEDERAL RESERVE BANK OF MINNEAPOLIS BANKING AND POLICY STUDIES
 FEDERAL RESERVE BANK OF MINNEAPOLIS BANKING AND POLICY STUDIES Minneapolis Options Report December 13 th Commodity Markets Option trading rose relative to two weeks ago to a more average level last week
XML Publisher Balance Sheet Vision Operations (USA) Feb-02
 Feb-02") Page:1 Apr-01 May-01 Jun-01 Jul-01 ASSETS Current Assets Cash and Short Term Investments 15,862,304 51,998,607 9,198,226 Accounts Receivable - Net of Allowance 2,560,786
Page:1 Apr-01 May-01 Jun-01 Jul-01 ASSETS Current Assets Cash and Short Term Investments 15,862,304 51,998,607 9,198,226 Accounts Receivable - Net of Allowance 2,560,786
PRESENTATION Q Oslo, 14 November 2012 John Binde, CEO Ola Loe, CFO
 PRESENTATION Q3 2012 Oslo, 14 November 2012 John Binde, CEO Ola Loe, CFO AGENDA: Highlights for the period Segment information Group financials Outlook 2 Highlights in Q3 2012: Strong consumption growth
Lerøy Seafood Group. Preliminary financial figures February 25th Helge Singelstad. Alf-Helge Aarskog. Ivan Vindheim.
 Lerøy Seafood Group Preliminary financial figures 2009 February 25th 2010 Helge Singelstad Chairman Alf-Helge Aarskog CEO Ivan Vindheim CFO 1 Agenda 1. 1 Considerations 2. 2 Key financial figures Q4 2009
Fourth Quarter 2016 Performance Summary
 Fourth Quarter 2016 Performance Summary Operational and Financial Highlights - 2016 Net profit rises by +2.5% to Euros 545.5 million Recurring sales (excluding Raw Materials and Others) rise by +4.5% (+4.6%
Fall 2017 Crop Outlook Webinar
 Fall 2017 Crop Outlook Webinar Chris Hurt, Professor & Extension Ag. Economist James Mintert, Professor & Director, Center for Commercial Agriculture Fall 2017 Crop Outlook Webinar October 13, 2017 50%
World Economy Geopolitics Investment Strategy. The Impact of EU s Sovereign Risks on Turkish Economy. Presentation given by
 World Economy Geopolitics Investment Strategy OUTLOOK FOR WORLD S MAJOR FINANCIAL MARKETS The Impact of EU s Sovereign Risks on Turkish Economy Presentation given by Dr. Michael Ivanovitch, President MSI
Lerøy Seafood Group. Quarterly report First quarter May 12th Helge Singelstad. Henning Beltestad. Ivan Vindheim.
 Lerøy Seafood Group Quarterly report First quarter 2010 May 12th 2010 Helge Singelstad Chairman Henning Beltestad CEO Ivan Vindheim CFO 1 Agenda 1. 1 Considerations 2. 2 Key financial figures Q1 2010 3.
2015 Third Quarter Earnings Call. November 5, 2015
 2015 Third Quarter Earnings Call November 5, 2015 20 5 The Andersons, Inc. Forward Looking Statements Certain information discussed today constitutes forward-looking statements. Actual results could differ
SACU INFLATION REPORT. December 2014
 SACU INFLATION REPORT December 2014 The content of this publication is intended for general information only. While precaution is taken to ensure the accuracy of information, the SACU Secretariat shall
1Q of FY ending December 31, (0.2) (1.9) 11.3 (0.2) (0.2) (0.2) (0.2) (1.2) (89.2) 0.1
 (1.9) 11.3 (0.2) (0.2) (0.2) (0.2) (1.2) (89.2) 0.1") August 6, ISEKI & CO., LTD. Supplementary Information to Consolidated Financial Results (April 1, June 30, ) I. Consolidated business results for the three months ended June 30, (Billions of yen, %) Year-on
August 6, ISEKI & CO., LTD. Supplementary Information to Consolidated Financial Results (April 1, June 30, ) I. Consolidated business results for the three months ended June 30, (Billions of yen, %) Year-on
INVESTOR PRESENTATION
 INVESTOR PRESENTATION HALF YEAR 2010 CONTENTS 1 PERFORMANCE HIGHLIGHTS HY 2010 2 ENVIRONMENT HY 2010 3 P&L & B/S DETAILS HY 2010 4 MATERIAL COST DEVELOPMENT 5 OUTLOOK 2010 6 QUESTIONS & ANSWERS 1 PERFORMANCE
Lerøy Seafood Group. Quarterly report Second quarter August 19th Helge Singelstad. Ivan Vindheim CEO CFO
 Lerøy Seafood Group Quarterly report Second quarter 2009 August 19th 2009 Helge Singelstad CEO Ivan Vindheim CFO 1 Agenda 1. 1 Considerations 2. 2 Key financial figures Q2 2009 3. 3 Lerøy at a glance 4.
Eurozone Economic Watch. March 2018
 Eurozone Economic Watch March 20 Eurozone Economic Watch March 20 Eurozone: The moderation of confidence continues We expect GDP growth to remain steady early this year supported mostly by strong global
Weekly Salmon Outlook Week
 Week 10-20 Page 1 of 8 Harvest of Atlantic salmon in Norway continued to grow in week 9. The harvest volume (23 000 tonnes wfe) was up 1000 tonnes from the previous week and 3% higher than in the corresponding
Time series adjustment in Austria
 We are moving Time series adjustment in Austria information Workshop II, 2 5 December 28, Vienna Statistics Austria www.statistik.at S T A T I S T I C S A U S T R I A 1 Overview Background Basic idea Method
NIREUS AQUACULTURE S.A.
 Athens Greece 29 March 2013 12 Months 2012 Results Presentation NIREUS AQUACULTURE S.A. Main events 12M 2012 Total sales up +2.7% to 202.2 mi. Fish sales value up +5.5% to 163 mi., volume up +8.3% to 31.6
THE B E A CH TO WN S O F P ALM B EA CH
 THE B E A CH TO WN S O F P ALM B EA CH C OU N T Y F LO R I D A August www.luxuryhomemarketing.com PALM BEACH TOWNS SINGLE-FAMILY HOMES LUXURY INVENTORY VS. SALES JULY Sales Luxury Benchmark Price : 7,
2016 Economic Outlook for Ireland & Eurozone IFP Launch
 2016 Economic Outlook for Ireland & Eurozone IFP Launch December 3 rd 2015 Jim Power Global Background US & UK growing at reasonable pace Euro Zone growing well below potential Emerging markets in some
REPORT / 2 ND QUARTER OF 2018 AND 18 MONTHS OF 2017/ October 2018
 REPORT / 2 ND QUARTER OF 2018 AND 18 MONTHS OF 2017/2018 31 October 2018 2018 Q2 + 18 MONTHS 2017/2018 2 CONTENTS BRIEF OVERVIEW OF THE GROUP 3-5 KEY HIGHLIGHTS 6-10 FINANCIAL POSITION 12-15 REVENUE ANALYSIS
SACU INFLATION REPORT. February 2017
 SACU INFLATION REPORT February 2017 The content of this publication is intended for general information only. While precaution is taken to ensure the accuracy of information, the SACU Secretariat shall
Introduction to Futures & Options Markets for Livestock
 Introduction to Futures & Options Markets for Livestock Kevin McNew Montana State University Marketing Your Cattle Marketing: knowing when and how to price your cattle. When Prior to sale At time of sale
Singapore Exchange Limited Building Tomorrow s Market, Today
 Singapore Exchange Limited Building Tomorrow s Market, Today Singapore Exchange SGX: Building Tomorrow s Market, Today SGX: Our Fundamentals FY2002 Half Year Results Going Forward SGX: Building Tomorrow
Fundamental Factors Affecting Agricultural and Other Commodities. Research & Product Development Updated July 11, 2008
 Fundamental Factors Affecting Agricultural and Other Commodities Research & Product Development Updated July 11, 2008 Outline Review of key supply and demand factors affecting commodity markets World stocks-to-use
SACU INFLATION REPORT. December 2018
 SACU INFLATION REPORT December 201 The content of this publication is intended for general information only. While precaution is taken to ensure the accuracy of information, the SACU Secretariat shall
Aker Seafoods Second quarter 2010 Profits improved in high season
 Aker Seafoods Second quarter 21 Profits improved in high season CEO Liv Monica B Stubholt CFO Gunnar Aasbø-Skinderhaug Welcome Agenda Topic Speaker Operational Update Liv Monica Stubholt, CEO Group Harvesting
AUDITED RESULTS FOR THE YEAR ENDED 31 DECEMBER 2016
 AUDITED RESULTS FOR THE YEAR ENDED 31 DECEMBER 2016 AGENDA 2 1 Opening remarks / market update 2 Financial results 3 Operational review 4 Strategy update 5 Outlook 1 2 3 4 5 OPENING REMARKS / MARKET UPDATE
Interim Results 2008/09 26 weeks to 3 August September 2008
 Interim Results 2008/09 26 weeks to 3 August 2008 11 September 2008 Sir Ian Gibson Chairman Richard Pennycook Group Finance Director Financial summary 4 H1 m 08/09 07/08 ** Turnover 7,105 6,259 Operating
Commodity Risk Through the Eyes of an Ag Lender
 Commodity Risk Through the Eyes of an Ag Lender Wisconsin Banker s Association April 5 th, 2017 Michael Irgang, Executive Vice President 1 Michael Irgang: Bio Michael Irgang is currently Executive Vice
Spheria Australian Smaller Companies Fund
 29-Jun-18 $ 2.7686 $ 2.7603 $ 2.7520 28-Jun-18 $ 2.7764 $ 2.7681 $ 2.7598 27-Jun-18 $ 2.7804 $ 2.7721 $ 2.7638 26-Jun-18 $ 2.7857 $ 2.7774 $ 2.7690 25-Jun-18 $ 2.7931 $ 2.7848 $ 2.7764 22-Jun-18 $ 2.7771
INTERIM PRESENTATION Second quarter, 2006
 INTERIM PRESENTATION Second quarter, 6 CEO Yngve Myhre CFO Bent M. Skisaker Agenda Operational Update Group Harvesting Processing Norway and Denmark Strategic considerations and Outlook Financials Income
U.S. Steel Market Outlook. Amy Ebben ArcelorMittal USA November 30, 2018
 U.S. Steel Market Outlook Amy Ebben ArcelorMittal USA November 30, 2018 Agenda ArcelorMittal introduction U.S. steel industry performance and trade Global steel industry Review of steel markets 1 About
INEOS STYROLUTION. Q1/ 2018 Investor Earnings Call
 INEOS STYROLUTION Q1/ 2018 Investor Earnings Call Disclaimer The following presentation includes forward-looking statements, within the meaning of the US securities laws, based on our current expectations
First half 2017 results presentation (January-June 2017) Madrid, July 26 th 2017
 Madrid, July 26 th 2017") First half 2017 results presentation (January-June 2017) Madrid, July 26 th 2017 MEDIASET ESPAÑA 1H17 RESULTS AT A GLANCE Million 1H17 AUDIENCE SHARE 1H17 FINANCIALS 24h total individuals 1H17 1H16 Var.
First half 2017 results presentation (January-June 2017) Madrid, July 26 th 2017 MEDIASET ESPAÑA 1H17 RESULTS AT A GLANCE Million 1H17 AUDIENCE SHARE 1H17 FINANCIALS 24h total individuals 1H17 1H16 Var.
ACE 427 Spring Lecture 6. by Professor Scott H. Irwin
 ACE 427 Spring 2013 Lecture 6 Forecasting Crop Prices with Futures Prices by Professor Scott H. Irwin Required Reading: Schwager, J.D. Ch. 2: For Beginners Only. Schwager on Futures: Fundamental Analysis,
Eurozone Economic Watch. February 2018
 Eurozone Economic Watch February 2018 Eurozone: Strong growth continues in 1Q18, but confidence seems to peak GDP growth moderated slightly in, but there was an upward revision to previous quarters. Available
SACU INFLATION REPORT. February 2016
 SACU INFLATION REPORT February 2016 The content of this publication is intended for general information only. While precaution is taken to ensure the accuracy of information, the SACU Secretariat shall
Maple Leaf Foods Investor Presentation Second Quarter Ended June 30, 2007
 Maple Leaf Foods Investor Presentation Second Quarter Ended June 30, 2007 Some of the statements in this presentation may constitute forward-looking information and future results could differ materially
PRESENTATION Q Oslo, 19 February 2013 John Binde, CEO Ola Loe, CFO
 PRESENTATION Q4 2012 Oslo, 19 February 2013 John Binde, CEO Ola Loe, CFO AGENDA: Highlights for the period Segment information Group financials Outlook 2 Highlights in Q4 2012: Significant improvement
SACU INFLATION REPORT. July 2018
 SACU INFLATION REPORT July 2018 The content of this publication is intended for general information only. While precaution is taken to ensure the accuracy of information, the SACU Secretariat shall not
Cembrit Group Q Unaudited interim report
 Cembrit Group Q4 2017 Unaudited interim report 2017 main events COMMENTARY Strong demand across both markets and product categories resulted in revenue growth of 7.9% YoY 2017 EBITDA showed solid underlying
Presentatio. on Q3 2010
 Presentatio on Q3 2010 CEO Regin Jacobsen CFO Teitur Samuelsen Oslo November 9 th 2010 Disclaimer This presentation includes statements regarding future results, which are subject to risks and uncertainties.
BIMBO Food. Quarterly Report October 27, BIMBO Market Underperformer 2016 Price Target P$41.9
 Quarterly Report BIMBO Market Underperformer 2016 Price Target P$41.9 Price 51.51 12M Price Range 45.02 / 59.86 Shares Outstanding (Mill) 4,703.2 Market Cap (Mill) 242,262 Float 24.0% Net Debt (Mill) 72,562
May Domestic Exports Imports. Volume Tonnes SW. MAT May-14 4, ,960 38, ,
 May 2014 Overview Table 1.1 Overview trends for Domestic, Export and Import trade Domestic Exports Imports Month Slaughter Pigmeat (Tonnes) Volume Tonnes SW Value $AUD (Million) Volume Tonnes SW Value
SACU INFLATION REPORT. February 2015
 SACU INFLATION REPORT February 2015 The content of this publication is intended for general information only. While precaution is taken to ensure the accuracy of information, the SACU Secretariat shall
(Registration no C) (Registration no C) Financial Results. (unaudited) 11 November 2009
 (Registration no C) Financial Results. (unaudited) 11 November 2009") 3 rd Quarter and 9-Month 9 2009 Financial Results (unaudited) 11 November 2009 1 Important note on forward looking statements The presentation herein may contain forward looking statements by the management
3 rd Quarter and 9-Month 9 2009 Financial Results (unaudited) 11 November 2009 1 Important note on forward looking statements The presentation herein may contain forward looking statements by the management
%
 IMFC Global Investment Program Commentary: April, 2010 Performance Analysis April 0.56 % Winning Months 21 Year to date 2.93 % Losing Months 18 Total ROR (Ann.) 18.75 % Current Drawdown 1.18 % 1 Year 7.93
Committed to sustainable productivity
 Committed to sustainable productivity results Did you know? 2 Atlas Copco - results in brief 4 Record revenues and high profit level Order growth for all business areas Growth in all regions Strong operating
Fourth Quarter 2015 Performance Summary
 Fourth Quarter 2015 Performance Summary Operational and Financial Highlights - 2015 Grifols revenues grow by 17.3% to Euros 3,935 million, and net profit grows by 13.2% reaching Euros 532 million of the
Interim Results for the 6 months to 30 September NOVEMBER 2010
 Interim Results for the 6 months to 30 September 2010 8 NOVEMBER 2010 Nick Robertson Introduction Strong H1 Retail sales up 50%, group revenues up 45% Strong UK and international retail sales, up 26% and
Cost Estimation of a Manufacturing Company
 Cost Estimation of a Manufacturing Company Name: Business: Date: Economics of One Unit: Manufacturing Company (Only complete if you are making a product, such as a bracelet or beauty product) Economics
DnB NOR Group Results according to IFRS and NGAAP. First quarter 2005
 DnB NOR Group Results according to IFRS and NGAAP First quarter 2005 1Q05 Results - based on previous principles (NGAAP) Pre-tax operating profit before losses and goodwill up 21 per cent to NOK 2.7 billion
Soybeans face make or break moment Futures need a two-fer to avoid losses By Bryce Knorr, senior grain market analyst
 Soybeans face make or break moment Futures need a two-fer to avoid losses By Bryce Knorr, senior grain market analyst A year ago USDA shocked the market by cutting its forecast of soybean production, helping
ANNOUNCEMENT OF PRELIMINARY RESULTS
 The leading high service distributor to engineers worldwide ANNOUNCEMENT OF PRELIMINARY RESULTS YEAR ENDED 31 MARCH 2009 29 May 2009 Agenda Overview and current trading Ian Mason Financial performance
Review of Membership Developments
 RIPE Network Coordination Centre Review of Membership Developments 7 October 2009/ GM / Lisbon http://www.ripe.net 1 Applications development RIPE Network Coordination Centre 140 120 100 80 60 2007 2008
Conference Call First Quarter 2014 Financial Results. Presentation3
 Conference Call First Quarter 204 Financial Results Presentation3 May 2, 204 Agenda 2 Presentation3 Agenda 2 3 4 5 6 Opening Remarks Global Alimentos Acquisition Q4 Highlights Operating and Financial Review
Trade Finance, Letters of Credit and Bank Guarantees
 Trade Finance, Letters of Credit and Bank Guarantees Page 1 of 10 Why Attend Securing company s assets while transacting with local and international customers is critical for the success and sustainability
Fourth Quarter 2014 Earnings Conference Call. 26 November 2014
 Fourth Quarter 2014 Earnings Conference Call 26 November 2014 Safe Harbor Statement & Disclosures The earnings call and accompanying material include forward-looking comments and information concerning
Interim results briefing. Jyri Luomakoski President and CEO Riitta Palomäki CFO 1 9 / 2016
 Interim results briefing Jyri Luomakoski President and CEO Riitta Palomäki CFO 1 9 / 2016 Q3/2016: Performance in Europe improved, supply issues impacted North American business July - September, M Net
SACU INFLATION REPORT. December 2017
 SACU INFLATION REPORT December 20 The content of this publication is intended for general information only. While precaution is taken to ensure the accuracy of information, the SACU Secretariat shall not
Results Presentation 3Q17
 Multiexport Foods S.A. Results Presentation 3Q17 Santiago, November 2017 Agenda I. Highlights II. III. Financial Statements Supply, Demand and Prices IV. Farming Operation V. Perspectives 2 Highlights
Euler Hermes 2009 H1 financial results. 28 July 2009
 Euler Hermes 2009 H1 financial results Contents 1 Economic environment 2 Euler Hermes actions and achievements 3 Q2 2009 consolidated results 4 S1 2009 consolidated results 2 Contents 1 Economic environment
SACU INFLATION REPORT. January 2017
 SACU INFLATION REPORT January 2017 The content of this publication is intended for general information only. While precaution is taken to ensure the accuracy of information, the SACU Secretariat shall
Release date: 12 July 2018
 Release date: 12 July 218 UK Finance: Mortgage Trends Update May 218 Mortgage market sees pre-summer boost as remortgaging continues strong upward trend Key data highlights: There were 32,2 new first-time
Investor Roadshow December 2010
 Investor Roadshow December 2010 1 A Spreading Geography OPERATING TERRITORIES KEY EXPORT MARKETS 2 A Strategy For Growth Market Volume Growth 2-3% Organic Growth Developing Cold-Drink Distribution Innovation
Olivier Blanchard Economic Counsellor and Director of the Research Department, International Monetary Fund
 Centre for Economic Performance 21st Birthday Lecture Series The State of the World Economy Olivier Blanchard Economic Counsellor and Director of the Research Department, International Monetary Fund Lord
Historical Pricing PJM COMED, Around the Clock. Cal '15 Cal '16 Cal '17 Cal '18 Cal '19 Cal '20 Cal '21 Cal '22
 $50 Historical Pricing PJM COMED, Around the Clock $48 $46 $44 $42 $40 $38 $36 $34 $32 $30 $28 $26 Cal '15 Cal '16 Cal '17 Cal '18 Cal '19 Cal '20 Cal '21 Cal '22 The information presented above was gathered
Growing dynamically in Western Europe
 資料 5 Growing dynamically in Western Europe Vassilis Vovos Regional President, Western Europe Caution on Forward-Looking Statements Today s presentations contain forward-looking statements. These statements
Kerry Preliminary Results Presentation
 Kerry - 2006 Preliminary Results Presentation Review of Business Hugh Friel Financial Review Brian Mehigan Business Growth Prospects Hugh Friel Q&A 2006 Performance Highlights Revenue growth of 4.9% to
Q U A R T E R L Y R E P O R T 2 N D Q U A R T E R
 Q U A R T E R L Y R E P O R T 2 N D Q U A R T E R 2 0 0 7 1. Grieg Seafood develops as planned Grieg Seafood was listed in June, and has now 869 shareholders after 2 shares issues of MNOK 700 in total.
Yara International ASA. 21 October 2011
 Yara International ASA Third quarter results 211 21 October 211 1 Summary third quarter Strong results driven by improved margins Strong demand outside Europe, satisfactory sales in Europe Sluiskil urea
Interim results briefing Jyri Luomakoski President and CEO Riitta Palomäki CFO 1 3 / 2016
 Interim results briefing Jyri Luomakoski President and CEO Riitta Palomäki CFO 1 3 / 2016 Q1/2016: Steady progress in Europe, strong growth in North America January - March, M Net sales Healthy U.S. market
NOVEMBER 22, : MONTHLY INFLATION RATE INCREASES SIGNIFICANTLY
 CONSUMER PRICE INDEX (CPI) November, 2016: PRESS RELEASE Released on Thursday December 22, 2016 at 1:00 pm NOVEMBER 2016 MONTHLY INFLATION RATE INCREASES SIGNIFICANTLY The national monthly CPI (2008=100)
Review of Registered Charites Compliance Rates with Annual Reporting Requirements 2016
 Review of Registered Charites Compliance Rates with Annual Reporting Requirements 2016 October 2017 The Charities Regulator, in accordance with the provisions of section 14 of the Charities Act 2009, carried
March Domestic Exports Imports. Volume Tonnes SW. MAT Mar-16 4, ,322 32, , % Change 3.8% 5.2% 13.2% 8.0% 1.1% 1.
 March 2017 Overview Table 1.1 Overview trends for Domestic, Export and Import trade Domestic Exports Imports Month Slaughter Pigmeat (Tonnes) Volume Tonnes SW Value $AUD (Million) Volume Tonnes SW Value
Conference Call Second Quarter 2013 Financial Results. Presentation3
 Conference Call Second Quarter 2013 Financial Results Presentation3 August 2, 2013 Agenda 1 Agenda 1 2 Opening Remarks 2Q13 Highlights 3 Operating and Financial Review 4 Closing Remarks 5 Q&A 2 1 Alicorp
NIREUS AQUACULTURE S.A.
 Athens Greece 30 May 2013 3 Months 2013 Results Presentation NIREUS AQUACULTURE S.A. Main events 3M 2013 Total Group sales up +1% to 44.6 mi. Exports up +2% to 35.7 mi - 80% of total sales. Cash generation
REVIEW OF Q FINANCIAL RESULTS
 REVIEW OF FINANCIAL RESULTS May 10, DISCLAIMER FORWARD-LOOKING STATEMENT Certain statements in this presentation, including statements regarding future results and performance, are forward-looking statements
How to Write a Pre-Harvest Marketing Plan
 How to Write a Pre-Harvest Marketing Plan Edward Usset, Grain Marketing Economist University of Minnesota Columnist, Corn & Soybean Digest usset001@umn.edu www.cffm.umn.edu Three slides that explain the
EUROZONE ECONOMIC WATCH JANUARY 2017
 EUROZONE ECONOMIC WATCH JANUARY 2017 Key messages: some changes for the better Improving confidence in across the board shows the resilience of the eurozone to the various potentially disturbing political
CME Group 2Q 2009 Earnings Conference Call. July 23, 2009
 CME Group 2Q 2009 Earnings Conference Call July 23, 2009 Forward-Looking Statements Statements in this press release that are not historical facts are forward-looking statements. These statements are not
Aker Seafoods Second quarter 2009 Sales of fresh products up, but prices down
 Aker Seafoods Second quarter Sales of fresh products up, but prices down CEO Yngve Myhre CFO Gunnar Aasbø Interim presentation second quarter 1 Welcome Agenda Topic Operational Update Group Harvesting
FY 2016 Results Presentation. Milan, 19 th April 2017
 FY 2016 Results Presentation Milan, 19 th April 2017 Advertising MEDIASET CONFIDENCE FY 2016 INDEXES Advertising CONSUMERS, revenues MANUFACTURERS growth & vs RETAILERS Total advertising market Total ad
Interim Results FOR THE SIX MONTHS ENDED 30 SEPTEMBER 2016
 Interim Results FOR THE SIX MONTHS ENDED 30 SEPTEMBER 2016 1 AGENDA INTRODUCTION Martin Davey, Chairman HIGHLIGHTS Adam Couch, CEO FINANCIAL REVIEW Mark Bottomley, Finance Director COMMERCIAL REVIEW Jim
Spanish economic outlook. June 2017
 Spanish economic outlook June 2017 1 2 3 Spanish economy a pleasant surprise Growth drivers Forecasts once again bright One of the most dynamic economies in Europe Spain growing at a faster rate than EMU
Eurozone Economic Watch. May 2018
 Eurozone Economic Watch May 2018 BBVA Research - Eurozone Economic Watch / 2 Eurozone: more moderate growth with higher uncertainty The eurozone GDP growth slowed in more than expected. Beyond temporary