Q October- December 2006
|
|
|
- Ronald McDonald
- 6 years ago
- Views:
Transcription


1 Q October- December 2006

2 AGENDA - ALFESCA AT A GLANCE XG - RAW MAT BAROMETER XG - OVERVIEW BY COMPANY XG - ADRIMEX FOCUS AH - FINANCIAL DETAILS PP - OUTLOOK XG
3 AGENDA - ALFESCA AT A GLANCE XG - RAW MAT BAROMETER XG - OVERVIEW BY COMPANY XG - ADRIMEX FOCUS AH - FINANCIAL DETAILS PP - OUTLOOK XG
4 ALFESCA AT A GLANCE Good trend and good balance for the development of the Q2 activity per company. ALFESCA Selected convenience fine foods BLINIS SPREADABLES PRAWNS Q2 + 12% -8% +3% -30% +10% +8% +8% H1 + 14% +1% +7% -35% +9% +6% +9% Net revenues


5 Net revenues ALFESCA AT A GLANCE Good contribution of each pillar in the quaterly development ALFESCA Selected convenience fine foods ALFESCA Selected convenience fine foods SMOKED SALMON SMOKED FISH FOIE GRAS REGIONAL PRODUCTS BLINIS SPREADABLES PRAWNS Q % + 6,5% + 10,1% % H % + 7,6% + 7.8% %
6 ALFESCA AT A GLANCE ACQUISITION : Srengthening of the prawns pillar Europeanization of the prawns pillar Rebalance of the turnover ALFESCA ALFESCA Selected convenience fine foods Selected convenience fine foods SMOKED SALMON & FISH FOIE GRAS REGIONAL PRODUCTS BLINIS & SPREADABLES PRAWNS Total 202 M 110 M 27 M 168 M 88% Net revenues
7 ALFESCA AT A GLANCE EBITDA STRONGLY IMPROVING VS LAST YEAR Q Q Net revenues 235 M 221,5 M +6,1% EBIT 30,4 M 24,9 M +22,1% EBITDA 34,7 M 28,7 M + 21,0% EBITDA without extraordinary 33,1 M 28,7 M +15,3%
8 AGENDA - ALFESCA AT A GLANCE XG - RAW MAT BAROMETER XG - OVERVIEW BY COMPANY XG - ADRIMEX FOCUS AH - FINANCIAL DETAILS PP - OUTLOOK XG
9 NORWEGIAN SALMON NOK FHL Price 2000 to 2006 (Size 3/4 Kg in NOK/ kg) Estimated W06 S01 S04 S07 S10 S13 S16 S19 S22 S25 S28 S31 S34 S37 S40 S43 S46 S49 S52 FNL 02 FNL 05 FNL 01 FNL 03 FNL 04 FNL 06 FNL 07
10 NORWEGIAN SALMON Norvegian salmon ( as of 31/12/06 Source Kontali Jan 07) ESTIMATED STOCK PER 31/12/06 ESTIMATED STOCK PER 31/12/06 Individuals Biomass GENERATION SMOLTS N pieces Average Volime GENERATION SMOLTS N pieces Average Volime x 1000 weight (kg) WFE x 1000 weight (kg) WFE 05 S S , % 13% S , S , % 23% TOTAL GO TOTAL GO S , S , % 1% S , S , % 20% TOTAL G TOTAL O % 3% TOTAL G05+G TOTAL % 12% WFE Whole Fish Equivalent Date of sea water entry Estimated period of harvest Generation 04 S1 released at sea april may 04 July August 05-March 06 S0 released at sea autumn 04 April May 06 to July August 06 Generation 05 S1 released at sea april may 05 Sept-Oct 06 to March 07 S0 released at sea autumn 05 March- April 07 to July August 07 Generation 06 S1 released at sea april may 06 Sept Oct 07 to March 08 S0 released at sea autumn 06 April 08 to July-August 08
11 AGENDA - ALFESCA AT A GLANCE XG - RAW MAT BAROMETER XG - OVERVIEW BY COMPANY XG - ADRIMEX FOCUS AH - FINANCIAL DETAILS PP - OUTLOOK XG
12 LYONS FARNE VENSY FDK DELPIERRE BLINI LABEYRIE ADRIMEX

13 HIGHLIGHTS 2006 Positive : Good trends for the market Successful industrial move : Project «Under one roof»
14 COMMERCIAL INDICATORS Market trends (M ) Q2 +12 % Full year +13 % +4 % 51,1 57,2 36,1 = 36,1 215,4 243, ,8 Herring Market trends (tons) Chilled Frozen Chilled Frozen LYONS SALES (all products M ) Q2 Full year +12 % +19 % 26,3 29,3 100,6 119,


15 OUTLOOK 2007 Focusing a new products development : New concept «on go» New concept marinated prawns.
16 LYONS FARNE VENSY FDK DELPIERRE BLINI LABEYRIE ADRIMEX

17 HIGHLIGHTS 2006 Positive : Good partnership with TESCO Good industrial results Negative : Market trend on Christmas
18 COMMERCIAL INDICATORS Salmon Market trend (tons) SALMON MARKET TRENDS (Source TNS total UK market ). Value (M ) -5.9 % FARNE SALES Full year 06 Value (M ) +15% +7,4% 35,3 40,6 15,2 16, TESCO OTHERS CLIENTS


19 OUTLOOK 2007 New business with TESCO : Chilean frozen salmon cuts New innovative added cooked value products Dynamisation of the UK market with more promotions.
20 LYONS FARNE VENSY FDK DELPIERRE BLINI LABEYRIE ADRIMEX


21 HIGHLIGHTS 2006 Positive : Much better balanced client sales vs previous year Successful new specialities products launched on the Christmas period. Satisfactory industrial results Negative: Agressive development of PLB and negative impact on the branded products. Difficulties for increasing prices on the PLB
22 COMMERCIAL INDICATORS MARKET TRENDS VOL (NIELSEN + INTERNAL ) FULL YEAR % MARKET SHARE NIELSEN VOL: leader challenged by PLB low price position. 63,0% Herring Market trends (tons) BRANDS GROWTH IN THE MARKET 13,00% (+1.6pt) 7,6% 7,1% 4,2% (-2.4pt) (-0.3pt) (-0.2pt) (+0.2pt) 3,3% -2,00% PLB SKANDIA ROYAL DOMINGUEZ MARTIKO SALMON VOLUMES GROWTH FULL YEAR SKANDIA + 2 nd brand NATIONAL BRANDS PLB -3% PLB +8 % TAMS0206 TAMS0207 TAMS0206 TAMS0207
 Promotional activity to")

23 OUTLOOK 2007 Focusing on innovation on the core business (smoked salmon) Promotional activity to dynamise the market Gain of new clients expected for mid 2007 Industrial optimization plan on track
24 LYONS FARNE VENSY FDK DELPIERRE BLINI LABEYRIE ADRIMEX


25 HIGHLIGHTS 2006 Positive : Improvement of Delpierre profitability Gains of new clients for the salmon Good industrial results Successful launch of new products on the wet fish counter Negative : High competition on the smoked salmon market.
26 Salmon Market trend (tons) MARKET (IRI VOL) COMMERCIAL INDICATORS Smoked Salmon Herrings + 1,2% -2,9% DELPIERRE MARKET SHARE ( IRI VOL) Smoked Salmon Herrings 29,2% (+2.2pt) 16,6% 39,3% (+2.6pt) 26,7% (-2.1pt) 17,4% 18,2% (-5.7 pt) (+0.9 pt) (+0.2pt) 7,0% ( -0.2pt) 2,8% 2,0% (-0.2pt) (-0.2pt) Labeyrie Delpierre SetM PLB 1st Prices Delpierre PLB 1st Prices Fortfiller
27 Salmon Market trend (tons) VOLUMES Q2 Act vs LY in MT COMMERCIAL INDICATORS Smoked Salmon Herrings Salted Cod % -2.8% + 3%


28 SALMON OUTLOOK 2007 Key objective is to gain some additional Private Label Brand and to strech our presence on a new sales space, the self service wet fish counter. HERRINGS Innovation is on track to modernize the image of herrings and enlarge its consumption SALTED FISH/MARINATED FISH A new innovation strategy will be implemented to become a key player on the self service wet fish counter with a range of marinated fish ready to eat or to cook.
29 LYONS FARNE VENSY FDK DELPIERRE BLINI LABEYRIE ADRIMEX

30 HIGHLIGHTS 2006 Positive Market trends well oriented on the tarama and spreadables markets Market shares strengthening on the blinis and tarama Negative Blinis market trend Poor BLINI performance on the spreadables
31 MARKET TRENDS Nielsen : Contrasted trends, overall dynamic markets Blinis -3,7% Tarama + 2,8% Spreadables + 21,6% VOLUME MARKET SHARE Nielsen : significant gains/losses on blinis and spreadables Blinis 30,8% +4,3 8,8% -0,6 50,1% Tarama 31,7% +1,0 4,2% -0,6 53,8% Spreadables 17,6% -4,8 19,4% +0,5 27,5% +3,4 +0-2,1 BLINI TASSOS PLB BLINI TASSOS PLB BLINI TASSOS PLB VOLUME Q2 Act vs LY (without Fram Foods) Nielsen : strong gains except in spreadables Blinis Tarama Spreadables ,9% + 4,7% -1,3% (Source Nielsen Dec


32 OUTLOOK 2007 Focusing on innovation to be different from the PLB : The fromage frais range The pancake range
33 LYONS FARNE VENSY FDK DELPIERRE BLINI LABEYRIE ADRIMEX


34 HIGHLIGHTS 2006 Positive Market trends well oriented in 2006 Market shares strengthening on a full year basis, and on the season Very positive results for the new TV advertising campaign Good industrial results Good results of the 60th anniversary range Negative Christmas sales below expectation (Christmas conditions, Christmas calendar positioning)
35 COMMERCIAL INDICATORS (Full year ) MARKET (IRI Vol) : Steady growth Foie Gras +4.4% Smoked Salmon +1.2 % MARKET SHARE (IRI Vol) : Gains in both pillars Foie Gras Smoked Salmon 40,5% (+2,0pt) 16,6% 39,3% (+2,6 pt) 26,7% ( -2,10pt) 17,3% (+0,2pt) 11,3% (+0,9pt) 5,3% (+0,2 pt) 2,8% 2,0% (+0,6pt) 3,3% 0,9% (-1pt ) (-0,4 pt) ( -0.2pt) ( -0.2pt) Labeyrie Montfort Delpeyrat Larnaudie P.Gueraçague PLB Labeyrie Delpierre S et M PLB 1st Prices
36 MARKET (IRI VOL) : Salmon decrease COMMERCIAL INDICATORS(Xmas Nov+Dec) Foie Gras +2,4% Smoked Salmon -4,1 % MARKET SHARE (IRI VOL) : strong positions 40,1% Foie Gras (+1,5) Smoked Salmon 18,2% (=) 13,0% (+1) 5,2% (+1) 2,8% (-1 ) 0,8% ,8% (+1,3) 5,2% ( -0,3) 39,6% (+1,9) 15,6% (-1,9) Labeyrie Delpierre PLB 1st Prices Labeyrie Montfort Delpeyrat Larnaudie P.Gueraçague PLB VOLUMES GROWTH Q2 06/07 vs Q2 05/6 : Foie Gras Smoked Salmon +2,4% +2,2% / / / /07
37 Brand strengthening as a result of the new TV commercial campaign. LABEYRIE COMPETITOR N 1 MONTFORT STRONG AWARENESS : Jan 07 Jan 06 90% 82% 20% 17% EXCELLENT BRAND IMAGE (% of agreement) Items : - Premium brand - Desire to buy the brand - Icône of pleasure - Quality brand - Trustable brand 59% 63% 62% 72% 73% 17% 31% 34% 37% 34%


38 OUTLOOK 2007 SALMON Key objective is to go on strengthening our market share and brand loyalty on the core products through innovation : Concept : LABEYRIE s «good for me!» FOIE GRAS Focusing on innovation on the most profitable segments of the market with new ranges
39 LYONS FARNE VENSY FDK DELPIERRE BLINI LABEYRIE ADRIMEX


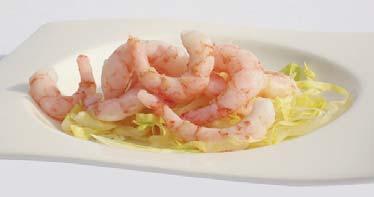
40 A D R I M E X Value-added added shrimps


41 RATIONALS FOR ACQUISITION Strengthening of a Alfesca s core pillars Adrimex leadership position Market evolution Room for synergies.
42 COMPANY PROFILE Turnover : 57 M Processed volume : T Global sales volume : T A processing plant in Nantes, Loire Atlantique (44) 120 employees
43 4 DEPARTMENTS CONCERNED

44 Traditional wet fish counter
45 Wet fish counter 2 or 3 kg bulk Shelf life 8 days

46 Wet fish counter self-service


47 Wet fish counter self-service Economical Shelf life 8 days 200 g 500 g 1 kgk


48 Wet fish counter self-service added value Shelf life 14 days

49 Seafood corner


50 Seafood corner Michel Adrien France Shelf life 21 days


51 Seafood corner - Michel Adrien Export Shelf life 21 days

52 Frozen department


53 Frozen department Michel Adrien Shelf life 18 months


54 PRAWNS STRATEGY IN FRANCE To strengthen our leadership position in FRANCE by: Developing strongly the sales of the added value products by taking advantage of: Fast trend of this market segment Rebranding of the offer with the labels LABEYRIE and DELPIERRE Strong innovation policy To improve rapidly the profitability of ADRIMEX by: Optimizing of the sourcing with LYONS SEAFOODS Optimizing of the processing in MAP presentation with LYONS SEAFOODS Reduction of the commercial and shipping costs with Delpierre/Labeyrie Same clients/same corner To strengthen our leadership position

55 Financials FDK 05-06
56 Financials Income statement Organic sales growth 6.3% YTD Q2 EBITDA 34.7m & 38.3m YTD - Up by 20% Q2 Net Income 19.4m and 17.7m YTD Up by 47% Income Statement Alfesca Oct.-Dec. 06 Jul.-Sep. 06 Apr.-Jun. 06 Jan.-Mar. 06 Oct - Dec '05 Jul - Sep '05 Apr - Jun '05 In thousands of Euros Q2 '06/'07 Q1 '06/'07 Q4 '05/'06 Q3 '05/'06 Q2 '05/'06 Q1 '05/'06 Q4 '04/'05 Net sales Cost of goods sold ( ) ( ) ( ) (93.980) ( ) (93.070) (90.740) Gross profit Other income (343) Operating expenses (18.048) (12.529) (13.457) (15.503) (20.345) (13.118) (12.323) Operating profit (897) (1.355) (2.222) Net financial expenses (2.867) (3.250) (2.137) (2.116) (2.459) (2.560) Earnings from associates (18) 0 (59) Net income before taxes (4.147) (1.248) (116) (3.879) 26 Income taxes (8.124) (6.596) (261) Net income after taxes (1.983) (2.114) (235) Minority interest Discontinued operations (3.523) (1.744) (625) (1.162) Net income (1.753) (603) (3.276) Depreciation EBITDA ,8% 3,1% 5,5% 5,0% 13,0% 2,9% 1,5%
57 Financials Salmon raw material price (4-5 kg FHL) 5,70 5,20 FHL prices /kg, 4/5 kg gutted salmon 4,70 4,20 3,70 3,20 2,70 2,20 1,70 Week: Year 2005 Year /2007 Average
58 Financials EBITDA Development Net Revenue EBITDA Q3 '04/05 Q4 '04/05 Q1 '05/06 Q2 '05/06 Q3 '05/06 Q4 '05/06 Q1 '06/07 Q2 '06/07 0
59 Financials Assets Inventory 77m Down by 32m from end of Sept. Receivables 158m Xmas now fully paid Balance sheet - Assets In thousands of Euros Intangible assets % % Operational assets % % Long-term investments % % Fixed assets % % Inventories % % Receivables % % Bank deposits and cash % % Current assets % % Non-current assets held for sale 0 0% % Total assets % % Equity & Liabilities Equity ratio 42% Long term liabilities Down by 14m Debt/Equity 72% vs 84% LY Net Cash - 56m Balance sheet - Shareholders equity and Liabilities In thousands of Euros Shareholders equity % % Deferred tax liabilities % % Obligations % % Long-term liabilities % % Long-term liabilities and obligations % % Bank loans % % Other current liabilities % % Current maturities of long-term debt % % Current liabilities % % Liabilities associated with assets classified as held for sale 0 0% % Shareholders equity and liabilities % %
60 Financials Senior Loans - Development okt.06 nóv.06 des.06 apr.05 maí.05 jún.05 júl.05 ágú.05 sep.05 okt.05 nóv.05 des.05 jan.06 feb.06 mar.06 apr.06 maí.06 jún.06 júl.06 ágú.06 mar.05 sep.06 Period M des.04 jan.05 feb.05
61 Financials Cash Flow Cash Flow FY 06/07 FY 05/06 1/7-31/12 1/7-31/12 Net profit for the period Items not affecting cash Depreciation Gain/loss on sale of assets (973) 53 Discontinued operations (229) Other calculated items (1.545) Working capital provided by (used in) operating activities Change in working capital (64.394) (71.930) Cash flow from operating activities (40.755) (45.314) Investing activities (221) Financing activities (2.486) Change in cash for the period (48.021)
Market presentation. February 2008
 Market presentation February 2008 1. Alfesca at a glance 2. Operational review by pillar Salmon and other fish Foie gras and duck products Prawns and other shellfish Blinis and spreadables 3. Financial
Full Year 1 July June 06
 Full Year 1 July 05 30 June 06 MISSION STRATEGY FDK 05-06 RATIONALS BUSINESS MODEL ALFESCA MISSION ALFESCA s mission is to be the leader in selected convenience fine Seafood Products and Regional Specialty
Market presentation 2 September 2008
 Market presentation Q4 2008 1 Market presentation 2 September 2008 Q4 07/08 Results 1. Alfesca at a glance 2. Operational review by pillar Salmon and other fish Foie gras and duck products Blinis and spreadables
PRESENTATION Q Oslo, 19 February 2013 John Binde, CEO Ola Loe, CFO
 PRESENTATION Q4 2012 Oslo, 19 February 2013 John Binde, CEO Ola Loe, CFO AGENDA: Highlights for the period Segment information Group financials Outlook 2 Highlights in Q4 2012: Significant improvement
PRESENTATION Q Oslo, 14 November 2012 John Binde, CEO Ola Loe, CFO
 PRESENTATION Q3 2012 Oslo, 14 November 2012 John Binde, CEO Ola Loe, CFO AGENDA: Highlights for the period Segment information Group financials Outlook 2 Highlights in Q3 2012: Strong consumption growth
Aker Seafoods Second quarter 2009 Sales of fresh products up, but prices down
 Aker Seafoods Second quarter Sales of fresh products up, but prices down CEO Yngve Myhre CFO Gunnar Aasbø Interim presentation second quarter 1 Welcome Agenda Topic Operational Update Group Harvesting
Santiago, May 11 th, Results Presentation 1Q18
 Santiago, May 11 th, 2018 Results Presentation 1Q18 Agenda I. Highlights II. III. Financial Statements Supply, Demand and Prices IV. Farming Operation V. Prospects 2 Highlights EBIT 1Q18 USD 18.8 million
Athens Greece May Months 2009 Results Presentation
 Athens Greece May 2009 3 Months 2009 Results Presentation NIREUS AQUACULTURE S.A. Nireus at a glance The leader in seabass and seabream fish farming - A fully integrated producer - Production facilities
NIREUS AQUACULTURE S.A.
 Athens Greece 29 March 2013 12 Months 2012 Results Presentation NIREUS AQUACULTURE S.A. Main events 12M 2012 Total sales up +2.7% to 202.2 mi. Fish sales value up +5.5% to 163 mi., volume up +8.3% to 31.6
Q August 24th. Lerøy Seafood Group ASA. CEO Henning Beltestad CFO Sjur S. Malm
 Q2 2017 August 24th Lerøy Seafood Group ASA CEO Henning Beltestad CFO Sjur S. Malm Agenda Highlights Key financial figures Outlook Q2 2017 EBIT before FV adj. NOK 801 million Harvest volume 26 156 GWT
INTERIM PRESENTATION Second quarter, 2006
 INTERIM PRESENTATION Second quarter, 6 CEO Yngve Myhre CFO Bent M. Skisaker Agenda Operational Update Group Harvesting Processing Norway and Denmark Strategic considerations and Outlook Financials Income
Fishpool Christmas Seminar 2017 Bearish signals going into 2018
 Photo: SB1 Markets SEAFOOD SALMON FARMING Fishpool Christmas Seminar 2017 Bearish signals going into 2018 Tore A. Tønseth Phone : (+47) 24 14 74 18 Mobile : (+47) 95 80 62 77 E-mail : tore.tonseth@sb1markets.no
Aker Seafoods Second quarter 2010 Profits improved in high season
 Aker Seafoods Second quarter 21 Profits improved in high season CEO Liv Monica B Stubholt CFO Gunnar Aasbø-Skinderhaug Welcome Agenda Topic Speaker Operational Update Liv Monica Stubholt, CEO Group Harvesting
Lerøy Seafood Group. Quarterly report First quarter May 12th Helge Singelstad. Henning Beltestad. Ivan Vindheim.
 Lerøy Seafood Group Quarterly report First quarter 2010 May 12th 2010 Helge Singelstad Chairman Henning Beltestad CEO Ivan Vindheim CFO 1 Agenda 1. 1 Considerations 2. 2 Key financial figures Q1 2010 3.
Q November 9th. Lerøy Seafood Group ASA. CEO Henning Beltestad CFO Sjur S. Malm
 Q3 2017 November 9th Lerøy Seafood Group ASA CEO Henning Beltestad CFO Sjur S. Malm Agenda Highlights Key financial figures Outlook Q3 2017 EBIT before FV adj. NOK 861 million Harvest volume 46 024 GWT
PRESENTATION Q Oslo, 15 August 2013 John Binde, CEO Ola Loe, CFO
 PRESENTATION Q2 2013 Oslo, 15 August 2013 John Binde, CEO Ola Loe, CFO AGENDA: Highlights for the period Segment information Group financials Outlook 2 Highlights in Q2 2013: Best quarterly operational
Supplemental Documents for 1 st Quarter of FY2017. August 4, 2017 Nippon Suisan Kaisha, Ltd.
 Supplemental Documents for 1 st Quarter of FY2017 August 4, 2017 Nippon Suisan Kaisha, Ltd. Overview of the 1 st Quarter of FY2017 Increase both in revenue and income thanks to significant recovery of
Weekly Salmon Outlook Week
 Week 10-20 Page 1 of 8 Harvest of Atlantic salmon in Norway continued to grow in week 9. The harvest volume (23 000 tonnes wfe) was up 1000 tonnes from the previous week and 3% higher than in the corresponding
PRESENTATION Q Oslo, 26 February 2014 John Binde, CEO Ola Loe, CFO
 PRESENTATION Q4 2013 Oslo, 26 February 2014 John Binde, CEO Ola Loe, CFO AGENDA: Highlights for the period Segment information Group financials Outlook 2 Highlights in Q4 2013: The best quarterly and yearly
Results Presentation 3Q17
 Multiexport Foods S.A. Results Presentation 3Q17 Santiago, November 2017 Agenda I. Highlights II. III. Financial Statements Supply, Demand and Prices IV. Farming Operation V. Perspectives 2 Highlights
All figures in NOK 1,000 Q3 11 Q3 10 Sept. 30, 2011 Sept. 30,
 Austevoll Seafood ASA 0 INTERIM REPORT Q3 2011 Significant reduction in interest-bearing liabilities in the quarter Third quarter is low season for production of pelagic fish in Europe and South America
Q NOVEMBER 8TH 2018
 Q3 2018 NOVEMBER 8TH 2018 1. Highlights 2. Key Financial Figures 3. Outlook Highlights Klikke for å legge til annet bilde Q3 2018 - EBIT before FV adj. NOK 660 million - Harvest volume 37 227 GWT - EBIT/kg
NIREUS AQUACULTURE S.A.
 Athens Greece 30 May 2013 3 Months 2013 Results Presentation NIREUS AQUACULTURE S.A. Main events 3M 2013 Total Group sales up +1% to 44.6 mi. Exports up +2% to 35.7 mi - 80% of total sales. Cash generation
Q MAY 8TH 2018
 Q1 2018 MAY 8TH 2018 1. Highlights 2. Key Financial Figures 3. Outlook Highlights Klikke for å legge til annet bilde Q1 2018 - EBIT beforefv adj. NOK 960 million - Harvest volume 37576 GWT - EBIT/kg all
3Q Financial Results Presentation. Manuel Fernandez de Sousa-Faro, Chairman Joaquín Viña Tamargo, CAO & IR
 3Q 211- Financial Results Presentation Manuel Fernandez de Sousa-Faro, Chairman Joaquín Viña Tamargo, CAO & IR Disclaimer This document is purely informative and does not intend to be comprehensive. Financial
Lerøy Seafood Group. Preliminary financial figures February 25th Helge Singelstad. Alf-Helge Aarskog. Ivan Vindheim.
 Lerøy Seafood Group Preliminary financial figures 2009 February 25th 2010 Helge Singelstad Chairman Alf-Helge Aarskog CEO Ivan Vindheim CFO 1 Agenda 1. 1 Considerations 2. 2 Key financial figures Q4 2009
Questions - Fishpool seminar Bergen
 Questions - Fishpool seminar Bergen Paul Aandahl, Seafood Analyst, Norwegian Seafood Council 22.11.2018 Global supply Global Trade Estimates Atlantic Salmon Volume wfe Value 2 000 000 1 800 000 1 600 000
Growing dynamically in Western Europe
 資料 5 Growing dynamically in Western Europe Vassilis Vovos Regional President, Western Europe Caution on Forward-Looking Statements Today s presentations contain forward-looking statements. These statements
Villa Organic AS fourth quarter 2012
 Notice to shareholders; Villa Organic AS fourth quarter 2012 Highlights fourth quarter 2012 The average prices were approximately at the same level as Q3, but improvement was observed towards the end of
THIRD QUARTER / 2018
 REPORT FOR THE THIRD QUARTER 2018 HIGHLIGHTS Operationally strong quarter, with cost improvements and good price achievement. Record-high volume for sales & processing with positive contribution Total
1Q of FY ending December 31, (0.2) (1.9) 11.3 (0.2) (0.2) (0.2) (0.2) (1.2) (89.2) 0.1
 (1.9) 11.3 (0.2) (0.2) (0.2) (0.2) (1.2) (89.2) 0.1") August 6, ISEKI & CO., LTD. Supplementary Information to Consolidated Financial Results (April 1, June 30, ) I. Consolidated business results for the three months ended June 30, (Billions of yen, %) Year-on
August 6, ISEKI & CO., LTD. Supplementary Information to Consolidated Financial Results (April 1, June 30, ) I. Consolidated business results for the three months ended June 30, (Billions of yen, %) Year-on
RS Platou Markets. Seafood conference. 10th June 2010
 RS Platou Markets Seafood conference 10th June 2010 Agenda Introduction to Cermaq Highlights Q1 2010 and outlook full year Chile Recovery 2 Overview of Cermaq One of the global leaders in the aquaculture
Q Nova Austral Financial Reporting May 2nd, 2018
 Q1-2018 Nova Austral Financial Reporting May 2nd, 2018 Agenda A. Nova Austral Pillars & Fundamentals B. Market and company updates C. Financial Report 1) Key Financial summary 2) LTM EBITDA, Revenue and
Events after balance sheet date
 Austevoll Seafood ASA 0 Financial Report Q4 2011 Successful second fishing season for anchoveta in Peru A positive result recorded for fish farming, sale and distribution, in difficult conditions Seasonally,
Q4 presentation Harald Dahl, CEO Nicolaj Weiergang, CFO
 Q4 presentation 2011 29.02.2012 Harald Dahl, CEO Nicolaj Weiergang, CFO Highlights Very low harvesting volumes in Q4 2011. We also plan for low volumes in Q1 2012. We expect to harvest only 10% of the
Presentatio. on Q3 2010
 Presentatio on Q3 2010 CEO Regin Jacobsen CFO Teitur Samuelsen Oslo November 9 th 2010 Disclaimer This presentation includes statements regarding future results, which are subject to risks and uncertainties.
Financial report Q3 2014
 Financial report Q3 2014 Austevoll Seafood ASA Financial report Q3 2014 Index Key figures for the Group... 03 Q3 2014... 04 Operating segments... 04 Cash flows... 05 Financial information as of 30 September
(Registration no C) (Registration no C) Financial Results. (unaudited) 11 November 2009
 (Registration no C) Financial Results. (unaudited) 11 November 2009") 3 rd Quarter and 9-Month 9 2009 Financial Results (unaudited) 11 November 2009 1 Important note on forward looking statements The presentation herein may contain forward looking statements by the management
3 rd Quarter and 9-Month 9 2009 Financial Results (unaudited) 11 November 2009 1 Important note on forward looking statements The presentation herein may contain forward looking statements by the management
Marisa at a Glance. Largest women fashion and underwear retailer in Brazil. Focus on the middle class. 63 years of track record.
 Institutional Presentation May 2012 Marisa at a Glance 63 years of track record Financial services platform Focus on the middle class Largest women fashion and underwear retailer in Brazil Multiformat
Six months of FY ending December 31, (0.4) (1.9) 22.5 (0.4) (0.3) (0.4) (0.1) (0.4) (0.7) (2.0) 0.9 (1.
 (1.9) 22.5 (0.4) (0.3) (0.4) (0.1) (0.4) (0.7) (2.0) 0.9 (1.") November 11, ISEKI & CO., LTD. Supplementary Information to Consolidated Financial Results (April 1, September 30, ) I. Consolidated business results for the six months ended September 30, (Billions of
November 11, ISEKI & CO., LTD. Supplementary Information to Consolidated Financial Results (April 1, September 30, ) I. Consolidated business results for the six months ended September 30, (Billions of
Q BAKKAFROST GROUP Oslo 21 August 2018
 BAKKAFROST GROUP Oslo 21 August DISCLAIMER This presentation includes statements regarding future results, which are subject to risks and uncertainties. Consequently, actual results may differ significantly
Presentation of Cermaq
 Presentation of Cermaq North Atlantic Seafood Seminar Oslo, 8 th March 2012 Agenda Introduction to Cermaq Key results 2011 Focus on Mainstream Chile Outlook 2012 Photograph: Alf Børjesson 2 This is Cermaq
SalMar ASA. Presentation Q CEO Leif Inge Nordhammer CFO Trond Tuvstein
 SalMar ASA Presentation Q1 2015 CEO Leif Inge Nordhammer CFO Trond Tuvstein Agenda Highlights Financial update Operational update Outlook First quarter 2015 highlights Improved operations Challenging biological
Results for first half of Financial analysts' presentation
 Results for first half of 2017 Financial analysts' presentation 17.08.2017 Bell Food Group overview of first half of 2017 Operating income Sales in 1,000 tonnes Half-year profit Number of employees as
Lerøy Seafood Group. Quarterly report Second quarter August 19th Helge Singelstad. Ivan Vindheim CEO CFO
 Lerøy Seafood Group Quarterly report Second quarter 2009 August 19th 2009 Helge Singelstad CEO Ivan Vindheim CFO 1 Agenda 1. 1 Considerations 2. 2 Key financial figures Q2 2009 3. 3 Lerøy at a glance 4.
SalMar ASA. Presentation Q CEO Olav-Andreas Ervik CFO Trond Tuvstein
 SalMar ASA Presentation Q1 2018 CEO Olav-Andreas Ervik CFO Trond Tuvstein Olav-Andreas Ervik new CEO of SalMar 41 years, from Frøya More than 20 years of experience from the aquaculture industry Worked
Financial & Business Highlights For the Year Ended June 30, 2017
 Financial & Business Highlights For the Year Ended June, 17 17 16 15 14 13 12 Profit and Loss Account Operating Revenue 858 590 648 415 172 174 Investment gains net 5 162 909 825 322 516 Other 262 146
Q U A R T E R L Y R E P O R T 2 N D Q U A R T E R
 Q U A R T E R L Y R E P O R T 2 N D Q U A R T E R 2 0 0 7 1. Grieg Seafood develops as planned Grieg Seafood was listed in June, and has now 869 shareholders after 2 shares issues of MNOK 700 in total.
Conference Call Second Quarter 2013 Financial Results. Presentation3
 Conference Call Second Quarter 2013 Financial Results Presentation3 August 2, 2013 Agenda 1 Agenda 1 2 Opening Remarks 2Q13 Highlights 3 Operating and Financial Review 4 Closing Remarks 5 Q&A 2 1 Alicorp
Q BAKKAFROST GROUP Oslo 20 February 2018
 BAKKAFROST GROUP Oslo 20 February 2018 DISCLAIMER This presentation includes statements regarding future results, which are subject to risks and uncertainties. Consequently, actual results may differ significantly
Thai Union Group Public Company Limited
 2Q17: Strict cost control aided operation Revenue 2Q17 sales grew by 1.2 YoY to THB 34,818mn. Soft sales growth was driven by weak market demand amid product repricing and the European currency depreciation.
Your Aquaculture Technology and Service Partner. Company presentation November 2014
 Company presentation November 2014 Important Information About this Company Presentation This Company Presentation has been prepared by AKVA group ASA ("AKVA group" or the "Company") for information purposes
From Copeinca to Mitsubishi and beyond. Jon Hindar CEO London, 31 October 2014
 From Copeinca to Mitsubishi and beyond Jon Hindar CEO London, 31 October 2014 A roller coaster with a happy ending for Cermaq and for the industry Page 2 A roller coaster with a happy ending for Cermaq
Q May 12th Oslo
 Q1 2016 May 12th Oslo Lerøy Seafood Group ASA CEO Henning Beltestad CFO Sjur S. Malm Agenda Highlights Key financial figures Outlook Q1 2016 EBIT before FV adj. NOK 584.5 million EBIT/kg all inclusive
Interim Report Q2-18
 Interim Report Q2-18 HIGHLIGHTS Operational EBIT of NOK 181 million o Operational EBIT per kg of NOK 24.73 in Region North o Operational EBIT per kg of NOK 23.49 in Region South o Non-recurring item of
OTHER DEPOSITS FINANCIAL INSTITUTIONS DEPOSIT BARKAT SAVING ACCOUNT
 WEIGHTAGES JAN FEB MAR APR MAY JUN JUL AUG SEPT OCT NOV DEC ANNOUNCEMENT DATE 19.Dez.14 27.Jän.15 24.Feb.15 26.Mär.15 27.Apr.15 26.Mai.15 25.Jun.15 28.Jul.15 26.Aug.15 23.Sep.15 27.Okt.15 25.Nov.15 MUDARIB
Supplemental Document for 2 nd Quarter of Fiscal Year November 4, 2016 Nippon Suisan Kaisha, Ltd.
 Supplemental Document for 2 nd Quarter of Fiscal Year 2016 November 4, 2016 Nippon Suisan Kaisha, Ltd. Overview of the 2 nd Quarter of FY2016 Despite the grim profit forecast in 1 st half, operating income
Your Aquaculture Technology and Service Partner. Q Presentation Oslo - May 11 th, 2016 Trond Williksen, CEO Eirik Børve Monsen, CFO
 Q1 2016 Presentation Oslo - May 11 th, 2016 Trond Williksen, CEO Eirik Børve Monsen, CFO Agenda 1 Highlights 2 Financial performance 3 Outlook 4 Q&A Highlights Q1 2016 - by CEO Trond Williksen 3 MNOK On
 - - - - - - - 20 000 15 000 10 000 5 000 0 2017 2014 2013 2012 2011 2010 2009 2008 2007 2006 2005 2004 2003 2002 2001 2000 1999 1995 1 400 30 1 200 25 1 000 800 600 400 777 20 15 10 16,5 200 5 0 0 Q4/17
Conference Call First Quarter 2014 Financial Results. Presentation3
 Conference Call First Quarter 204 Financial Results Presentation3 May 2, 204 Agenda 2 Presentation3 Agenda 2 3 4 5 6 Opening Remarks Global Alimentos Acquisition Q4 Highlights Operating and Financial Review
Six good reasons for choosing DNB in the new banking environment
 Six good reasons for choosing DNB in the new banking environment Bank of America Merrill Lynch, 18th Annual Banking & Insurance CEO Conference 2013 24 September, London Rune Bjerke, CEO of DNB 1 Reason
REPORT / 2015 Q
 REPORT / 2015 Q1 2015.05.15 Premium fish products and fish farming 2015 Q1 3 Table of contents Structure of AS PRFoods Summary: 1st quarter and 3 months Key ratios : income statement Sales by contries
24 August slide 1
 slide 1 Highlights on results Very strong H1 2007 financial performance Fixed revenue grew 0.5% yoy. Growth of Internet, TV and ICT services compensates for declining traditional voice Outstanding result
XML Publisher Balance Sheet Vision Operations (USA) Feb-02
 Feb-02") Page:1 Apr-01 May-01 Jun-01 Jul-01 ASSETS Current Assets Cash and Short Term Investments 15,862,304 51,998,607 9,198,226 Accounts Receivable - Net of Allowance 2,560,786
Page:1 Apr-01 May-01 Jun-01 Jul-01 ASSETS Current Assets Cash and Short Term Investments 15,862,304 51,998,607 9,198,226 Accounts Receivable - Net of Allowance 2,560,786
Highlights for the quarter Q2 / EBIT NOK 60 million pre biomass write-down
 Half year report Highlights for the quarter EBIT NOK 60 million pre biomass write-down EBIT pre fair value and biomass write-down (NOK million) 318 348 300 101 60 Mainstream results negatively impacted
German Investment Seminar 2011 Commerzbank AG New York January 10-11, 2011
 German Investment Seminar 2011 Commerzbank AG Mark Langer Chief Financial Officer Dennis Weber Head of Investor Relations New York January 10-11, 2011 German Investment Seminar, Commerzbank HUGO BOSS January
Cost Estimation of a Manufacturing Company
 Cost Estimation of a Manufacturing Company Name: Business: Date: Economics of One Unit: Manufacturing Company (Only complete if you are making a product, such as a bracelet or beauty product) Economics
INEOS STYROLUTION. Q1/ 2018 Investor Earnings Call
 INEOS STYROLUTION Q1/ 2018 Investor Earnings Call Disclaimer The following presentation includes forward-looking statements, within the meaning of the US securities laws, based on our current expectations
Economic Activity Index ( GDB-EAI ) For the month of May 2013 G O V E R N M E N T D E V E L O P M E N T B A N K F O R P U E R T O R I C O
 For the month of May 2013 G O V E R N M E N T D E V E L O P M E N T B A N K F O R P U E R T O R I C O") Economic Activity Index ( GDB-EAI ) For the month of May 2013 General Commentary May 2013 GDB-EAI for the month of May registered a 3.4% year-over-year ( YOY ) reduction May 2013 EAI was 126.7, a 3.4%
Economic Activity Index ( GDB-EAI ) For the month of May 2013 General Commentary May 2013 GDB-EAI for the month of May registered a 3.4% year-over-year ( YOY ) reduction May 2013 EAI was 126.7, a 3.4%
Supplemental Documents for Fiscal Year May 15, 2015 Nippon Suisan Kaisha, Ltd.
 Supplemental Documents for Fiscal Year 214 May 15, 215 Nippon Suisan Kaisha, Ltd. Overview of FY214 Both revenue and income increased in Marine Products and Food Products. Revenue and income decreased
Fourth quarter results 2015
 1 Fourth quarter results 2015 11 February 2016 Peter A. Ruzicka, President & CEO Continued growth in the fourth quarter 4.1% organic growth 1 17% EBIT (adj.) 2 growth in BCG Full-year EPS doubled to NOK
Analyst Presentation. Annual Report 2014
 Analyst Presentation 1 1 2 Highlights Financials 2014 3 Outlook 2015 ADLER 2 Cornerstones and Highlights 2014 Cornerstones 2014 New Image Campaign Area-wide launch of RFID technology Store refurbishments
Fourth Quarter 2016 Performance Summary
 Fourth Quarter 2016 Performance Summary Operational and Financial Highlights - 2016 Net profit rises by +2.5% to Euros 545.5 million Recurring sales (excluding Raw Materials and Others) rise by +4.5% (+4.6%
SIX MONTHS REPORT, JAN JUN 2018
 SIX MONTHS REPORT, JAN JUN 2018 TELEPHONE/AUDIO CONFERENCE 11 JULY 2018, AT 11.00 CET TOMMY ANDERSSON, PRESIDENT AND CEO HELENA WENNERSTRÖM, EVP AND CFO DIRECT LINK AUDIOCAST: HTTPS://TV.STREAMFABRIKEN.COM/BULTEN
Financial Report Q FINANCIAL REPORT Q1 2010
 Financial Report Q4 2010 FINANCIAL REPORT Q1 2010 Austevoll Seafood ASA 0 Interim Report Q4 2010 Fourth quarter also achieved record-high operating result Good market and good prices for salmon and trout
First Quarter 2015 Earnings. May 11, 2015
 First Quarter 2015 Earnings May 11, 2015 1 Forward-Looking Statements Some of the statements made in this presentation are forward-looking and are made pursuant to the safe harbor provision of the Private
INVESTOR PRESENTATION Henry Demone, CEO; Paul Jewer, CFO Heather Keeler-Hurshman, Investor Relations. November 2014
 INVESTOR PRESENTATION Henry Demone, CEO; Paul Jewer, CFO Heather Keeler-Hurshman, Investor Relations November 2014 Disclaimer Certain statements made in this presentation are forward-looking and are subject
Investor Roadshow December 2010
 Investor Roadshow December 2010 1 A Spreading Geography OPERATING TERRITORIES KEY EXPORT MARKETS 2 A Strategy For Growth Market Volume Growth 2-3% Organic Growth Developing Cold-Drink Distribution Innovation
P/F Bakkafrost Condensed Consolidated Interim Report for Q and 9 months 2013
 P/F Bakkafrost Condensed Consolidated Interim Report for Q3 2013 and 9 months 2013 15000 10000 5000 0 Harvest volume - TGW Q3 12 Q4 12 Q1 13 Q2 13 Q3 13 Operational EBIT mdkk 200 150 100 50 0 Q3 12 Q4
Lindab Group presentation Q3 2010
 lindab group presentation Lindab Group presentation Q3 2010 David Brodetsky, CEO Nils-Johan Andersson, CFO Agenda Highlights Group Business Areas Strategy Trends and outlook Q & A 2 Lindab Group Highlights
Your Aquaculture Technology and Service Partner. Q Presentation Oslo - August 17 th, 2016 Trond Williksen, CEO Eirik Børve Monsen, CFO
 Q2 2016 Presentation Oslo - August 17 th, 2016 Trond Williksen, CEO Eirik Børve Monsen, CFO Agenda 1 Highlights 2 Financial performance 3 Outlook 4 Q&A Highlights Q2 2016 - by CEO Trond Williksen 3 Improved
FULL YEAR REPORT, 2017 TELEPHONE/AUDIO CONFERENCE 8 FEBRUARY 2018, AT CET TOMMY ANDERSSON, PRESIDENT AND CEO HELENA WENNERSTRÖM, EVP AND CFO
 TELEPHONE/AUDIO CONFERENCE 8 FEBRUARY 2018, AT 15.30 CET TOMMY ANDERSSON, PRESIDENT AND CEO HELENA WENNERSTRÖM, EVP AND CFO DIRECT LINK AUDIOCAST: HTTPS://TV.STREAMFABRIKEN.COM/BULTEN Q4 2017 TELECONFERENCE:
Kerry Preliminary Results Presentation
 Kerry - 2006 Preliminary Results Presentation Review of Business Hugh Friel Financial Review Brian Mehigan Business Growth Prospects Hugh Friel Q&A 2006 Performance Highlights Revenue growth of 4.9% to
2014 INTRAFISH SEAFOOD INVESTOR FORUM Paul Jewer, CFO. May 20, 2014 New York
 2014 INTRAFISH SEAFOOD INVESTOR FORUM Paul Jewer, CFO May 20, 2014 New York Disclaimer Certain statements made in this presentation are forward-looking and are subject to important risks, uncertainties
Austevoll Seafood ASA Q1 2009
 Q1 2009 Ole Rasmus Møgster Chairman Britt Kathrine Drivenes CFO Disclaimer This Presentation has been produced by (the Company or Austevoll ) solely for use at the presentation to the market held in connection
Austevoll Seafood ASA Financial report 4th quarter 2006
 Austevoll Seafood ASA Financial report 4th quarter 2006 Page 1 of 10 The group s pro forma income for 2006 was NOK 3 465,9 million and the pro forma operating profit/loss before depreciation and amortization
Highlights Q EBITDA forecast for 2015 raised to USD million. Higher passenger revenue and lower fuel price resulting in higher EBITDA
 ICELANDAIR GROUP PRESENTATION OF Q2 2015 RESULTS 28 JULY 2015 Highlights Q2 2015 1 2 3 EBITDA USD 50.3 million improving by USD 5.0 million from 2014 Higher passenger revenue and lower fuel price resulting
11-Year Consolidated Financial Highlights
 11-Year Consolidated Financial Highlights As of March 31, 2017 2007.3 2008.3 2009.3 2010.3 Net Sales ( million) 1,376,958 1,487,496 1,660,162 1,415,718 Operating Profit ( million) 162,315 70,048 65,204
Ageas Strategy in Portugal
 Ageas Strategy in Portugal A G E A S I N V E S T O R D AY 6 TH O F J U N E 2 0 17 I LISBON PORTUGAL Evolution of Ageas presence in Portugal Ocidental : A success story since 2005 Agenda Ageas Seguros :
Cembrit Group Q Unaudited interim report
 Cembrit Group Q4 2017 Unaudited interim report 2017 main events COMMENTARY Strong demand across both markets and product categories resulted in revenue growth of 7.9% YoY 2017 EBITDA showed solid underlying
Kuehne + Nagel International AG
 Kuehne + Nagel International AG Analyst Conference Call 1 st Half-Year 2011 Results July 18, 2011 (CET 14.00) Schindellegi, Switzerland Agenda Welcome & Highlights 1st Half Year 2011 Gerard van Kesteren
Review of Membership Developments
 RIPE Network Coordination Centre Review of Membership Developments 7 October 2009/ GM / Lisbon http://www.ripe.net 1 Applications development RIPE Network Coordination Centre 140 120 100 80 60 2007 2008
GENERAL FUND AT A GLANCE Category Budget YTD Actual % % Year Passed Resources 8.33% Uses 8.33% $0 $1,330,750
 City of Edmond Monthly Financial Report FY 2008/2009 Through the Month Ended Unaudited - Intended for Management Purposes Only The following is a summary of the City's financial results for operating funds.
NORWAY ROYA L S A L M ON PRESENTATION Q Oslo, 7 November 2017 Charles Høstlund, CEO Ola Loe, CFO 1
 PRESENTATION Q3 2017 Oslo, 7 November 2017 Charles Høstlund, CEO Ola Loe, CFO 1 AGENDA: Highlights for the period Segment information Group financials Markets Outlook 2 Highlights in Q3 2017 Operational
Chilean volume reduction Impact on global markets. North Atlantic Seafood Forum Steven Rafferty CFO Cermaq ASA 5 March 2009
 Chilean volume reduction Impact on global markets North Atlantic Seafood Forum Steven Rafferty CFO Cermaq ASA 5 March 2009 Context Chilean Atlantic salmon supply will drop by 50% + in 2009 Further drop
% Million yen % 277, ,912 (54.2) 754 (85.7) (1,216) - 271, , , ,073 - Equity ratio %
 754 (85.7) (1,216) - 271, , , ,073 - Equity ratio %") Summary of 2nd Quarter Report for Fiscal Year 2012 (April 1, 2012 through September 30, 2012) Qualification: This is directly translated into English for the convenience of readers, and all financial results
Summary of 2nd Quarter Report for Fiscal Year 2012 (April 1, 2012 through September 30, 2012) Qualification: This is directly translated into English for the convenience of readers, and all financial results
INTERIM REPORT 2015 FIRST QUARTER (Q1)
") INTERIM REPORT 2015 FIRST QUARTER (Q1) Summary - Revenue in the first quarter came to 570 million kroner, 61 million kroner higher than the first quarter of 2014 - Higher revenue was mainly a result of
INTERIM REPORT 2015 FIRST QUARTER (Q1) Summary - Revenue in the first quarter came to 570 million kroner, 61 million kroner higher than the first quarter of 2014 - Higher revenue was mainly a result of
EMPRESAS AQUACHILE S.A. RESULTS FOR 1 TH QUARTER May 2015
 EMPRESAS AQUACHILE S.A. RESULTS FOR 1 TH QUARTER 2015 May 2015 1. About Empresas AquaChile S.A. 03 2. Quarterly Summary 04 3. Analysis of Results 06 4. Balance Sheet Analysis 13 5. Cash Flow Analysis 15
Business & Operating Review
 Business & Operating Review 0 This presentation may contain financial or business projections regarding recent acquisitions, their financial or business impact, management expectations and objectives regarding
QUARTERLY FINANCIAL REPORT March 31, 2018
 California Independent System Operator QUARTERLY FINANCIAL REPORT March 31, 2018 250 Outcropping Way Folsom, CA 95630 (916) 351-4000 CALIFORNIA INDEPENDENT SYSTEM OPERATOR CORPORATION QUARTERLY FINANCIAL