Corral Q May 2017
|
|
|
- Loreen Lewis
- 5 years ago
- Views:
Transcription


1 Corral Q May 2017
2 Disclaimer This presentation has been prepared by Corral Petroleum Holdings AB (publ) and/or its subsidiaries and affiliates ( Corral ). The information contained in this presentation is for information purposes only. Among other things, this presentation is intended to be used in connection with a scheduled international conference call for investors and analysts to be held on June 1, 2017 at 3:00 pm CET. The call-in number is and the meeting code is Preem. The conference call will also be available for replay for a limited time beginning on June 2, 2017 with access information to be posted via the "Press and Notices" heading of the Corral investors section of Preem's website at The information contained in this presentation is not intended to be used as the basis for making an investment decision. You are solely responsible for seeking independent professional advice in relation to the information. This presentation is not and does not constitute an offer to sell or the solicitation, invitation or recommendation to purchase any securities in the United States or any other jurisdiction. Securities may not be offered or sold in the United States absent registration under the Securities Act of 1933 (the Securities Act ) or an exemption from registration. This presentation may not be reproduced, disseminated, quoted or referred to, in whole or in part. This presentation speaks as of the date of this presentation. No representation or warranty, express or implied, is made as to the fairness, accuracy, completeness or correctness of the information, opinions and conclusions contained in this presentation. Neither the shareholders of Corral nor any directors, officers, employees, agents or representatives of Corral, provide, grant or state, any representation, warranty, guarantee, undertaking or obligation, whether express or implied and whether by operation of law or otherwise, regarding or in relation to the completeness or the accuracy of the information contained in this presentation, and they are under no obligation to update or keep current the information contained in this presentation, to correct any inaccuracies which may become apparent, or to publicly announce the result of any revision to the statements made herein except where they would be required to do so under applicable law, and any opinions expressed in this presentation are subject to change without notice. No liability whatsoever for any loss, howsoever arising, from any use of this presentation or its contents is accepted by any such person in relation to such information. Certain financial data included in the presentation are non-ifrs financial measures. These non-ifrs financial measures may not be comparable to similarly titled measures presented by other entities, nor should they be construed as an alternative to other financial measures determined in accordance with International Financial Reporting Standards ( IFRS ). Although Corral believes these non-ifrs financial measures provide useful information to users in measuring the financial performance and condition of its business, users are cautioned not to place undue reliance on any non-ifrs financial measures and ratios included in this presentation. This presentation contains forward-looking statements. Examples of these forward-looking statements include, but are not limited to statements of plans, objectives or goals and statements of assumptions underlying those statements. Words such as may, will, expect, intend, plan, estimate, anticipate, believe, continue, probability, risk and other similar words are intended to identify forward-looking statements but are not the exclusive means of identifying those statements. By their very nature, forward-looking statements involve inherent risks and uncertainties, both general and specific, and risks exist that such predictions, forecasts, projections and other forward-looking statements will not be achieved. A number of important factors could cause our actual results to differ materially from the plans, objectives, expectations, estimates and intentions expressed in such forward-looking statements. Past performance of Corral cannot be relied on as a guide to future performance. Forward-looking statements speak only as at the date of this presentation. Corral, its agents and advisors and all of their employees expressly disclaim any obligations or undertaking to release any update of, or revisions to, any forward-looking statements in this presentation. No statement in this presentation is intended to be a profit forecast. As such, undue influence should not be placed on any forwardlooking statement. By attending this presentation or by reading the presentation slides, you are agreeing to be bound by the foregoing limitations and restrictions and, in particular, will be deemed to have represented, warranted and undertaken that you have read and agree to comply with the contents of this disclaimer. 2
3 First Quarter Market and Market Outlook

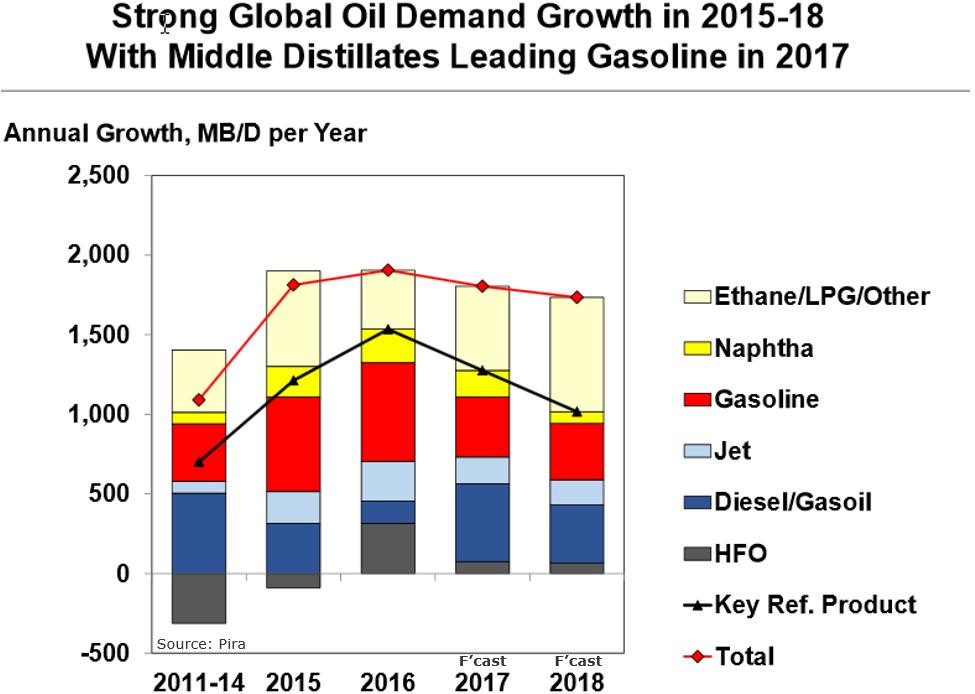
4 Source: Pira 4

5 OPEC key objectives: o reduce crude inventory surplus. o o move the market to backwardation. reach 60+ USD/bbl Brent. OPEC to continue cuts since Inventory Objective not achieved Source: Pira Avg export MBD only -- and from an extremely high level +0.1 MBD per month since October 2016 Source: Pira Source: DNB 5
6 6


7 US + Europe Combined Diesel/Gasoil Stocks Russian Fuel Oil Exports F cast Source: Pira 7
8 Product Crack Spreads $/bbl 35 Gasoline cracks $/bbl 30 Diesel cracks $/bbl Fuel oil cracks Jan Feb Mar Apr May Jun Jul Aug Sep Oct Nov Dec Jan Feb Mar Apr May Jun Jul Aug Sep Oct Nov Dec 5 yr Range ( ) yr Average ( ) 0 Jan Feb Mar Apr May Jun Jul Aug Sep Oct Nov Dec 5 yr Range ( ) yr Average ( ) yr Range ( ) yr Average ( ) Source: Platts 8
9 First quarter Highlights Market and Operation European refining margins were stable at a healthy level during the first quarter of The support for the margins came mainly from the strong demand globally for gasoline reducing the gasoline inventory levels and from unusual strength in fuel oil. Financial Adjusted EBITDA for the first quarter 2017 was MSEK, compared to MSEK in the first quarter 2016 and operating profit was MSEK compared to 775 MSEK in the first quarter On March 31, 2017 Preem satisfied the cash flow test and on May 29, 2017 Preem satisfied the minimum liquidity test under the Credit Facilities to upstream cash to Corral Petroleum Holdings for the July 1, 2017 scheduled interest payment on the 2021 Notes. 9
10 Projects and Activities Preem has agreed with YX Norge to acquire its bulk sales business in Norway. The transaction consists mainly of sales agreements with 15 resellers and approximately 600 direct customers, with the acquired business currently generating approximately 200,000 m3 of annual fuel sales. Investment in a Vacuum Distillation Unit in Lysekil with a total capital expenditure plan of MSEK during the period 2016 to The project is progressing according to plan. All major mechanical items and works have been contracted. Site preparation work has been completed Investment in a Hydrogen Production Unit in Gothenburg with a total capital expenditure plan of 635 MSEK which is expected to be mechanically complete by the end of Strategic upgrade of IT systems with a total capital expenditure budget of 500 MSEK, mainly in 2016 and 2017, with planned implementation in Implementation is now expected stepwise in 2017 and The Gothenburg refinery is back in operation after the scheduled shutdown. All units except the Fluid catalytic cracking unit ( FCC ) in the Lysekil refinery are now back in operation. All mechanical work on the FCC is completed and startup is ongoing. 10
11 First Quarter Financial Summary
12 Refining Margin and Production Q1 Refining margin Production LTM Q yr yr 4.61 LTM Q yr yr *Rolling 12 months 12
 7.4% 8.2% 6.5% 5.")
13 Group First Quarter 2017 Results Revenue (MSEK) Revenue Change Q1 55% LTM 2.2% Comments Revenue The increase is a result of higher crude and product prices as well as higher sales volumes. Adjusted EBITDA * Adjusted EBITDA Improved Adjusted EBITDA is driven by higher margins and increased production volumes. Q1 36% LTM -26% Adj EBITDA Margin (% of Revenue) 7.4% 8.2% 6.5% 5.9% *As defined in the Corral Petroleum Holdings AB (publ) report for the first quarter ended 31 March
14 Supply & Refining Segment Throughput (000 bbls) Comments 5% -4% Average Brent Crude Price ($/bbl) 59% -16% Throughput The refineries in Lysekil and Gothenburg had good operational performance and high utilization in the first quarter of 2017 with a throughput of 4.9 (4.7) million m3. Average Brent Crude Price During the first quarter of 2017, the price of Dated Brent traded in a range between 49 $/bbl to 56 $/bbl. The price fell to 49 $/bbl in the middle of March but climbed back up to 52 $/bbl by the end of the quarter. Refining Margin European refining margins were stable at a healthy level during the first quarter of The support for the margins came mainly from the strong demand globally for gasoline reducing gasoline the inventory levels and unusual strength in fuel oil. Average Refining Margin($/bbl) 4,27 37% 43% -30% 6,10 6,41-29% 4,50 Q4 15 Q4 16 FYE 15 FY16 14
 Marketing EBITDA The decrease in operating profit is mainly attributable to higher selling expenses compared to the first quarter in the previous year.")
15 Marketing Segment Revenue (MSEK) 38% -5% Comments Revenue Sales volumes were 4% higher in the first quarter of 2017 compared to the first quarter of the previous year. Marketing EBITDA (MSEK) Marketing EBITDA The decrease in operating profit is mainly attributable to higher selling expenses compared to the first quarter in the previous year. 34% -4% EBITDA Margin (% of Revenue) 5.0% 3.5% 3.3% 4.7% 15
16 Capital Expenditures Capex by Purpose (MSEK) (a) Q1 16 Q Recurring maintenance Incremental improvements Specific projects Comments Specific Projects The VDU investment in Lysekil, 74 MSEK Q Strategic IT project. 51 MSEK Q Specific projects in Q includes a 5 MSEK in a Green Hydro Treater. Recurring maintenance Increased capex in Q vs Q driven by scheduled maintenance (12MSEK) and planned maintenance (16 MSEK). Regulatory/Environmental maintenance increased by 9 MSEK Safety/Risk maintenance increased by 4 MSEK Future investments In November 2016 the Preem Board approved a 635 MSEK investment in a Hydrogen Production Unit at the Gothenburg refinery. This attractive investment, which we expect will be mechanically complete by the end of 2018, is designed to further increase the refinery s desulphurization capacity. The investment has an estimated pay-back time of less than two years. Approximately 150 MSEK planned capital expenditure will be reallocated to Total capex in 2016 was MSEK compared to plan 1,500 MSEK. Total capex in 2017 is estimated at 2,550 MSEK. (a) Shown on a gross basis. 16
17 Cash Flow (MSEK) Q1 16 Q1 17 LTM Q1 16 LTM Q1 17 Profit before taxes Adjustments for items not included in cash flow Tax paid Decrease(+)/Increase(-) in inventories Decrease(+)/Increase(-) in operating receivables Decrease(-)/Increase(+) in operating liabilities Changes in working capital Cash flow from operating activities Cash flow used in investing activities Amortization/Raising of loans Loan expenditure Cash flow used in financing activities Cash flow for the period Comments Adjustments not included in cash flow are primarily deprecation, unrealized FX effects, write downs of inventory (or reversals) and reservations for Preem s receivable on Corral Morocco Oil&Gas. Cash flow was negatively impacted by movements in working capital of 270 MSEK for the first quarter of 2017 compared to a positive impact of 2,204 MSEK for the first quarter of Cash flow used in inventories amounted to 66 MSEK for the first quarter of 2017, primarily due to the increase in the price of crude oil. Cash flow from operating receivables amounted to 320 MSEK for the first quarter of 2017, primarily due to an increase in sales. Cash flow used in operating liabilities for the first quarter of 2017 amounted to 523 primarily due to the increase in the price of crude oil. The loan expenditure of 679 MSEK relates to the refinancing of both Preem AB and Corral Petroleum Holdings. Cash flow used in financing activities is the reduced utilization of Preem s revolving credit facility 17
18 Simplified Capital Structure Cap Structure at the end of Q MSEK $M USD xebitda Cash (382) (43) RCF Other interest bearing liabilities and transaction expenses (348) (39) Comments Continued deleveraging through reduced utilization of Preem s RCF Continued strong focus on paying cash coupons on the 2021 Notes Net debt Preem x 2021 Corral Notes Transaction expenses (250) (28) Cash (452) (51) Total Corral Group 3rd part debt (a) x Adj EBITDA USD:SEK Exchange rate 8.93 *Cash and debt figures exclude deeply subordinated debt held by our ultimate shareholder. **Exchange rate (SEK/USD) as of March 31,

19 Liquidity Reserves Higher availability due to higher average prices and higher average inventory levels. Note: Drawdown and availability figures are not IFRS measures and are based on month end values averaged over the course of the year. In part, these values are internal calculations based on variables that are subjectively determined and which may not be comparable in approach to similar calculations of other companies 19


20 QUESTIONS?
Corral Q August 2017
 Corral Q2 2017 August 2017 Disclaimer This presentation has been prepared by Corral Petroleum Holdings AB (publ) and/or its subsidiaries and affiliates ( Corral ). The information contained in this presentation
Q3 Investor Call. September 2016
 Q3 Investor Call September 2016 Disclaimer This presentation has been prepared by Corral Petroleum Holdings AB (publ) and/or its subsidiaries and affiliates ( Corral ). The information contained in this
FIRST QUARTER June 4, 2018
 FIRST QUARTER 2018 June 4, 2018 Presenters Petter Holland CEO Gunilla Spongh CFO 2 Disclaimer This presentation has been prepared by Corral Petroleum Holdings AB (publ) and/or its subsidiaries and affiliates
CORRAL PETROLEUM HOLDINGS AB Q November
 CORRAL PETROLEUM HOLDINGS AB Q3 2018 November 28 2018 Presenters Petter Holland CEO Peder Zetterberg CFO (acting) 2 Disclaimer This presentation has been prepared by Corral Petroleum Holdings AB (publ)
FOURTH QUARTER March, 2018
 FOURTH QUARTER 2017 20 March, 2018 Presenters Petter Holland CEO Gunilla Spongh CFO 2 Disclaimer This presentation has been prepared by Corral Petroleum Holdings AB (publ) and/or its subsidiaries and affiliates
FULL YEAR May, 2018
 FULL YEAR 2017 3 May, 2018 Presenters Petter Holland CEO Gunilla Spongh CFO 2 Disclaimer This presentation has been prepared by Corral Petroleum Holdings AB (publ) and/or its subsidiaries and affiliates
CORRAL PETROLEUM HOLDINGS AB (publ)
") CORRAL PETROLEUM HOLDINGS AB (publ) REPORT FOR THE FIRST QUARTER ENDED MARCH 31, 2018 FOR IMMEDIATE RELEASE Date: May 30, 2018 Stockholm No. of pages 14 This report includes unaudited consolidated financial
CORRAL PETROLEUM HOLDINGS AB (publ) REPORT FOR THE FIRST QUARTER ENDED MARCH 31, 2018 FOR IMMEDIATE RELEASE Date: May 30, 2018 Stockholm No. of pages 14 This report includes unaudited consolidated financial
CORRAL PETROLEUM HOLDINGS AB (publ)
") CORRAL PETROLEUM HOLDINGS AB (publ) REPORT FOR THE SECOND QUARTER ENDED JUNE 30, 2018 FOR IMMEDIATE RELEASE Date: August 29, 2018 Stockholm No. of pages 14 This report includes unaudited consolidated financial
CORRAL PETROLEUM HOLDINGS AB (publ) REPORT FOR THE SECOND QUARTER ENDED JUNE 30, 2018 FOR IMMEDIATE RELEASE Date: August 29, 2018 Stockholm No. of pages 14 This report includes unaudited consolidated financial
CORRAL PETROLEUM HOLDINGS AB (publ)
") CORRAL PETROLEUM HOLDINGS AB (publ) REPORT FOR THE FOURTH QUARTER ENDED DECEMBER 31, 2018 FOR IMMEDIATE RELEASE Date: March 14, 2019 Stockholm No. of pages 15 This report includes unaudited consolidated
CORRAL PETROLEUM HOLDINGS AB (publ) REPORT FOR THE FOURTH QUARTER ENDED DECEMBER 31, 2018 FOR IMMEDIATE RELEASE Date: March 14, 2019 Stockholm No. of pages 15 This report includes unaudited consolidated
CORRAL FINANS AB (publ)
") CORRAL FINANS AB (publ) INTERIM REPORT FOR THREE MONTHS ENDED SEPTEMBER 30, 2007 FOR IMMEDIATE RELEASE Date: November 30, 2007 Stockholm Nr. of pages 12 Organizational Structure Corral Finans AB (publ)
CORRAL FINANS AB (publ) INTERIM REPORT FOR THREE MONTHS ENDED SEPTEMBER 30, 2007 FOR IMMEDIATE RELEASE Date: November 30, 2007 Stockholm Nr. of pages 12 Organizational Structure Corral Finans AB (publ)
2016 1Q Results. May 2016
 216 1Q Results May 216 Agenda 1. Financials 2. Refinery Division 3. Olefins Division 4. Plant Operation 5.Expansion 2 Financial Status (NTD) Category Units 2154Q 2161Q QoQ 2151Q YoY Revenue Mn 15,296 124,471-17%
2017 1Q Results. May 2017
 217 1Q Results May 217 Agenda 1. Financials 2. Market Fundamental 3. Industry Outlook 4. Plant Operation 5.Expansion 2 Financial Status (Unit: NTD Million) 4Q16 1Q17 QoQ 1Q16 YoY Revenues 152,287 164,486
LOTOS Group Q3 Consolidated Financial results
 LOTOS Group Q3 Consolidated Financial results 29 October 2014 Disclaimer Not for release, publication or distribution, directly or indirectly, in or into the United States of America, Australia, Canada
RESULTS FOR Q ANALYST TELECONFERENCE
 RESULTS FOR Q3 217 ANALYST TELECONFERENCE Market 1 2 Operation Financials 3 Market 1 217 Third Quarter Market Conditions Fires & Strikes in Europe Harsh Hurricane Season in United States Increase in Global
RAJESH EXPORTS LIMITED GLOBAL PRESENCE IN GOLD AND GOLD PRODUCTS. Earnings Presentation - FY16
 RAJESH EXPORTS LIMITED GLOBAL PRESENCE IN GOLD AND GOLD PRODUCTS Earnings Presentation - FY16 HIGHLIGHT FOR THE QUARTER Posted record REVENUE, EBITDA and PAT for the year 2015-16. Consolidated position
RESULTS FOR Q ANALYST TELECONFERENCE
 RESULTS FOR Q2 217 ANALYST TELECONFERENCE Market 1 2 Operation Financials 3 2 Market 1 3 4 217 Second Quarter Market Conditions Supply Disruptions Increase in middle distillate demand High import requirements
The oil market remains strong
 Oil Norway Review June 2007 The oil market remains strong Strong supply-/demand-fundamentals Arnstein Wigestrand (47) 21 00 85 16-1- The oil price remains at high level 80 Crude Oil-Brent Dated FOB U $/BBL
INDIAN OIL CORPORATION LIMITED RESEARCH
 RESULTS REVIEW Indian Oil Corporation Ltd. Hold Share Data Market Cap Rs. 439.99 bn Price Rs. 369.0 BSE Sensex 15,185.32 Reuters Bloomberg Avg. Volume (52 Week) IOC.BO IOCL IN 0.19 mn 52-Week High/Low
3 rd QUARTER 2018 EARNINGS WEBCAST. November 12 th, 2018
 3 rd QUARTER 2018 EARNINGS WEBCAST November 12 th, 2018 1 Important notice Safe harbor statement under the US Private Securities Litigation Reform Act of 1995. This document contains statements that YPF
LOTOS Group 2Q 2015 consolidated financial results
 LOTOS Group 2Q 2015 consolidated financial results August 11th, 2015 1 Key highlights 3-4 2 EFRA Programme milestones 5-9 3 External environment 10-13 4 Upstream 14-17 5 Downstream 18-22 6 Consolidated
SARAS Second Quarter and First Half 2014 results
 SARAS Second Quarter and First Half 2014 results 8 th August 2014 8 August 2014 Saras SpA 1 AGENDA Highlights Segments Review Financials Outlook & Strategy Additional Information DISCLAIMER Certain statements
First Quarter 2007 Results. Lisbon, 17 May 2007
 Lisbon, 17 May 2007 Disclaimer Matters discussed in this presentation may constitute forward-looking statements. Forwardlooking statements are statements other than in respect of historical facts. The
Historical Pricing PJM COMED, Around the Clock. Cal '15 Cal '16 Cal '17 Cal '18 Cal '19 Cal '20 Cal '21 Cal '22
 $50 Historical Pricing PJM COMED, Around the Clock $48 $46 $44 $42 $40 $38 $36 $34 $32 $30 $28 $26 Cal '15 Cal '16 Cal '17 Cal '18 Cal '19 Cal '20 Cal '21 Cal '22 The information presented above was gathered
Puma Energy : Fourth quarter & full year 2018 results Thursday 28 th March Puma Energy
 Puma Energy : Fourth quarter & full year 2018 results Thursday 28 th March 2019 Puma Energy The opportunity for Puma Energy Unique footprint, great people & strong business fundamentals in high potential
Financial Highlights (1)
") Disclaimer The information in this document has not been independently verified and no representation or warranty, expressed or implied, is made as to, and no reliance should be placed on, the fairness,
Disclaimer The information in this document has not been independently verified and no representation or warranty, expressed or implied, is made as to, and no reliance should be placed on, the fairness,
FY 2017 FINANCIAL RESULTS. March 1 st, 2018
 FY 2017 FINANCIAL RESULTS March 1 st, 2018 FY 2017 Results 1. Highlights 2. FY Financial Performance Analysis 3. Appendix Verallia FY 2017 Financial Results 01/03/2018 2 2017 HIGHLIGHTS A very good financial
XML Publisher Balance Sheet Vision Operations (USA) Feb-02
 Feb-02") Page:1 Apr-01 May-01 Jun-01 Jul-01 ASSETS Current Assets Cash and Short Term Investments 15,862,304 51,998,607 9,198,226 Accounts Receivable - Net of Allowance 2,560,786
Page:1 Apr-01 May-01 Jun-01 Jul-01 ASSETS Current Assets Cash and Short Term Investments 15,862,304 51,998,607 9,198,226 Accounts Receivable - Net of Allowance 2,560,786
The Competition Clash of Titans February - April, 2014
 The Competition Clash of Titans February - April, 2014 Goals and objectives of the Competition Clash of Titans Goal: to improve the quality of the order book for derivative instruments. Objectives: o to
BAZAN Group Oil Refineries Ltd. Second Quarter 2013 Results. August 2013
 BAZAN Group Oil Refineries Ltd. Second Quarter 2013 Results August 2013 1 Disclaimer This presentation has been prepared by Oil Refineries Ltd. (the "Company") as a general presentation of the Company
Historical Pricing PJM PSEG, Around the Clock. Cal '15 Cal '16 Cal '17 Cal '18 Cal '19 Cal '20 Cal '21 Cal '22
 $70 Historical Pricing PJM PSEG, Around the Clock $65 $60 $55 $50 $45 $40 $35 $30 $25 Cal '15 Cal '16 Cal '17 Cal '18 Cal '19 Cal '20 Cal '21 Cal '22 The information presented above was gathered and compiled
Q Results presentation
 Q1 2016 Results presentation 12 May 2016 1 Disclaimer This presentation (the "Presentation") has been prepared and is issued by, and is the sole responsibility of Telepizza Group, S.A. ( Telepizza" or
Investor Presentation. FY 2017 Results
 Investor Presentation FY 2017 Results April 4, 2018 Disclaimer This presentation provides general information about Compañía Sud Americana de Vapores S.A. ( CSAV ). It consists of summary information and
Deutsche Bank U.S. Independent Refiners Conference January 9, 2014
 Deutsche Bank U.S. Independent Refiners Conference January 9, 2014 Forward-Looking Statements This Presentation has been prepared by Calumet Specialty Products Partners, L.P. (the Company or Calumet )
[Insert Subheading] Click to edit Master text styles. Shop Direct Limited. Q1 FY18 Results. Three months ended 30 September 2017.
![[Insert Subheading] Click to edit Master text styles. Shop Direct Limited. Q1 FY18 Results. Three months ended 30 September 2017.](/thumbs/75/71763350.jpg "[Insert Subheading] Click to edit Master text styles. Shop Direct Limited. Q1 FY18 Results. Three months ended 30 September 2017.") [Insert Subheading] Click to edit Master text styles Shop Direct Limited Q1 FY18 Results Three months ended 30 September 2017 7 December 2017 1 Disclaimer This presentation (the Presentation ) has been
[Insert Subheading] Click to edit Master text styles Shop Direct Limited Q1 FY18 Results Three months ended 30 September 2017 7 December 2017 1 Disclaimer This presentation (the Presentation ) has been
Supporting Material for First Quarter Results April 2010
 1 Supporting Material for First Quarter Results April Notes This document contains forward-looking statements concerning the results of operations and businesses of Showa Shell Sekiyu K.K.. Forward-looking
Vol. 5 : August Forward to Complex Refinery. The Bangchak Petroleum Public Company Limited
 Vol. 5 : August 2008 Forward to Complex Refinery The Bangchak Petroleum Public Company Limited Contents Editor s Note 2 Oil Price Situation 2Q 08 3 2Q 08 Performance Summary Product Quality Improvement
04 January 2008 Flash Comment
 04 January 2008 Flash Comment Sinopec (0386.HK) Acquisition five oil refineries and 63 gas stations Expected Return Rating : HOLD Price (03/01/08) : HK$11.62 Target Price : HK$13.10 Expected Capital Gain
1Q2017 IFRS RESULTS MAY 31, Q2017 IFRS RESULTS
 Q27 IFRS RESULTS MAY 3, 27 Q27 IFRS RESULTS Alexander Ivannikov Head of Department Q27 IFRS RESULTS 2 DISCLAIMERS This presentation has been prepared by PJSC Gazprom (the Company ), and comprises the slides
2Q/2011 Analyst Meeting. August 9, 2011 Synergy Hall
 2Q/2011 Analyst Meeting August 9, 2011 Synergy Hall 1 Agenda Key Highlights 2Q/11 Financial Results Market Outlook This presentation has be prepared by PTT Aromatics and Refining Public Company Limited
Full Year 2017 EARNINGS WEBCAST. March 05, 2018
 Full Year 2017 EARNINGS WEBCAST March 05, 2018 DISCLAIMER Safe harbor statement under the US Private Securities Litigation Reform Act of 1995. This document contains statements that YPF believes constitute
First Quarter Financial Results Conference Call M AY 6,
 First Quarter 2015 Financial Results Conference Call M AY 6, 2 0 1 5 Forward-Looking Statements This Presentation has been prepared by Calumet Specialty Products Partners, L.P. (the Company or Calumet
Teekay Tankers. Q Earnings Presentation. February 21, 2019
 Teekay Tankers Q4 2018 Earnings Presentation February 21, 2019 Forward Looking Statement This presentation contains forward-looking statements (as defined in Section 21E of the Securities Exchange Act
April 29, Results First quarter 2016
 April 29, 2016 Results First quarter 2016 Cautionary Statement 2 By attending or reading this presentation, you acknowledge and agree to be bound by the following limitations and restrictions. This presentation
ROSNEFT Q3 and 9M 2012 IFRS Financial Results. 1 November 2012
 ROSNEFT Q3 and 9M 2012 IFRS Financial Results 1 November 2012 Important Notice The information i contained herein has been prepared by the Company. The opinions i presented herein are based on general
Results First Quarter 2012/13
 Results First Quarter 2012/13 Investor Call Mannheim, 27 th June 2012 Dr. Michael Majerus CFO Disclaimer 2012 PHOENIX Pharmahandel GmbH & Co KG This document has been prepared by PHOENIX Pharmahandel GmbH
Indian Oil Corporation Ltd.
 Nov-14 Dec-14 Jan-15 Feb-15 Mar-15 Apr-15 May-15 Jun-15 Jul-15 Aug-15 Sep-15 Oct-15 Nov-15 Dec-15 Jan-16 Feb-16 February 12, 2016 COMPANY RESULTS REPORT REVIEW Analyst Sudeep Anand +91-22-4322 1190 sudeep.anand@idbicapital.com
Consolidated Financial Results of LOTOS Group 3Q 2013
 Consolidated Financial Results of LOTOS Group 3Q 2013 Management Board of Grupa LOTOS S.A. 29th October 2013 1 2 3 4 5 Key highlights Market conditions Market Upstream Conditions Upstream Downstream Downstream
GAZPROM: 2Q 2018 IFRS RESULTS
 GAZPROM: 2Q 28 IFRS RESULTS AUGUST 3, 28 2Q28 IFRS RESULTS Alexander Ivannikov Head of Department 2Q28 IFRS RESULTS 2 DISCLAIMERS This presentation has been prepared by PJSC Gazprom (the Company ), and
Gazprom. Consolidated 1Q 2008 IFRS Financial Results Presentation
 Gazprom Consolidated 1Q 2008 IFRS Financial Results Presentation Disclaimers This presentation has been prepared by OJSC Gazprom (the Company ), and comprises the slides for a presentation to investors
Investor Highlight 1Q 2018
 Invesor Highlight October 2017 Investor Highlight 1Q 2018 Ver. 2017.10.24 Company Disclaimer This confidential document (the Presentation ) and the information contained herein do not constitute or form
KION GROUP AG Q Update Call. Gordon Riske (CEO), Anke Groth (CFO) Frankfurt, 26 July 2018
, Anke Groth (CFO) Frankfurt, 26 July 2018") KION GROUP AG Q2 Update Call Gordon Riske (CEO), Anke Groth (CFO) Frankfurt, 26 July Agenda 1. Highlights 2. Market Update 3. Financial Update 4. Outlook 2 KION GROUP AG Q2 Update Call 26 July Q2 Strategic
KION GROUP AG Q2 Update Call Gordon Riske (CEO), Anke Groth (CFO) Frankfurt, 26 July Agenda 1. Highlights 2. Market Update 3. Financial Update 4. Outlook 2 KION GROUP AG Q2 Update Call 26 July Q2 Strategic
2 nd QUARTER 2018 EARNINGS WEBCAST. August 8 th, 2018
 2 nd QUARTER 2018 EARNINGS WEBCAST August 8 th, 2018 1 Important notice Safe harbor statement under the US Private Securities Litigation Reform Act of 1995. This document contains statements that YPF believes
16 May M FY 2017/18 FINANCIAL RESULTS
 16 May 2018 6M FY 2017/18 FINANCIAL RESULTS NOTICE TO RECIPIENTS This presentation and any materials distributed in connection herewith (together, the Presentation ) have been prepared by Douglas GmbH
Q3 17 Results November 2017
 Q3 17 Results November 2017 Key highlights Q3 17 Sales volumes: 5.8 million m 3 Gross profit: US$ 406 million EBITDA: US$ 180 million Operating cash flow: US$ 249 million Investment in infrastructure:
Gazprom. Consolidated 2008 IFRS Financial Results Presentation
 Gazprom Consolidated 2008 IFRS Financial Results Presentation Disclaimers This presentation has been prepared by OJSC Gazprom (the Company ), and comprises the slides for a presentation to investors concerning
3M FY 2016/17 Financial results. 22 February
 3M FY 206/7 Financial results 22 February 207 0 Table of contents. Key Highlights 2. Financial Update Appendix Notice to recipients This presentation and any materials distributed in connection herewith
Fourth Quarter Review of Financial Results. April 2, 2018
 Fourth Quarter 2017 Review of Financial Results April 2, 2018 Forward-Looking Statements This Presentation has been prepared by Calumet Specialty Products Partners, L.P. (the Company or Calumet ) as of
CABOT CREDIT MANAGEMENT Financial Results. For the nine months ended 30 September 2018
 CABOT CREDIT MANAGEMENT Financial Results For the nine months ended 30 September 2018 8 November 2018 DISCLAIMER This presentation has been prepared by Cabot Credit Management ( the Company ) solely for
2Q2015 IFRS CONSOLIDATED FINANCIAL RESULTS
 Q5 IFRS CONSOLIDATED FINANCIAL RESULTS SEPTEMBER, 5 Alexander Ivannikov Head of the Department Q5 IFRS CONSOLIDATED FINANCIAL RESULTS DISCLAIMERS This presentation has been prepared by PJSC Gazprom (the
Air Berlin PLC 11 th November 2015 Analyst Conference 3rd Quarter 2015
 Air Berlin PLC 11 th November 2015 Analyst Conference 3rd Quarter 2015 DISCLAIMER This presentation has been prepared by Air Berlin PLC. No representation, warranty or undertaking, express or implied,
BAZAN Group Oil Refineries Ltd. First Nine Months and Q Results. November 2012
 BAZAN Group Oil Refineries Ltd. First Nine Months and Q3 2012 Results November 2012 2 Disclaimer This presentation has been prepared by Oil Refineries Ltd. (the "Company") as a general presentation of
PT Ultrajaya Milk Industry & Trading Company Tbk. FY 2013 results update
 PT Ultrajaya Milk Industry & Trading Company Tbk. FY 2013 results update April 2014 0 Disclaimer These materials are not intended to be a public offering document under Law of the Republic of Indonesia
Eesti Energia Audited Financial Results for 2016
 Eesti Energia Audited Financial Results for 2016 27 February 2017 Eesti Energia Narva Wind Park, Estonia 2 Disclaimer This presentation and any materials distributed or made available in connection herewith
Sabancı Holding Q Earnings Presentation
 Sabancı Holding Q1 2018 Earnings Presentation Disclaimer 2 The information and opinions contained in this document have been compiled by Hacı Ömer Sabancı Holding A.Ş. ( Holding ) from sources believed
Q Operational and Financial Results. 15 May 2018
 Q1 2018 Operational and Financial Results 15 May 2018 DISCLAIMER The information contained herein pertaining to SIBUR (the "Company") has been provided by the Company solely for use at this presentation.
Investor Highlight. October 2016
 Investor Highlight October 2016 Company Disclaimer Company Disclaimer This confidential document (the Presentation ) and the information contained herein do not constitute or form part of and should not
1Q 2017 EARNINGS PRESENTATION MAY 10, 2017
 1Q 2017 EARNINGS PRESENTATION MAY 10, 2017 Real Industry, Inc. 17 State Street, Suite 3811, New York, NY 10004 www.realindustryinc.com Real Alloy, Inc. 3700 Park East Dr., Suite 300, Beachwood, OH 44122
HOLD. Deleveraging story playing out RAMCO CEMENTS. Target Price: Rs 503. Q4 performance
 RAMCO S HOLD Target Price: Rs 503 Deleveraging story playing out Ramco Cements total debt reduced by a massive Rs 5 bn to Rs 22 bn in FY16. The company generated total EBITDA of Rs 11.5 bn in FY16 and
Indian Oil Corporation Ltd.
 Sep-16 Oct-16 Nov-16 Dec-16 Jan-17 Feb-17 Mar-17 Apr-17 May-17 Jun-17 Jul-17 Aug-17 Sep-17 s. Indian Oil Corporation Ltd.. October 25, 217 BSE Code: 53965 NSE Code: IOC Reuters Code: IOC.NS Bloomberg Code:
Results for Q3/07. Record net income with growth in all businesses. David Davies, CFO November 15, Move & More. 1 OMV Group, Q3/07
 Results for Record net income with growth in all businesses David Davies, CFO November 15, 2007 1 OMV Group, Move & More. Key themes in Clean EBIT at EUR 625 mn, up 15% on Strong earnings growth across
JinkoSolar Holding Co., Ltd. Q Earnings Call Presentation
 JinkoSolar Holding Co., Ltd. Q3 2018 Earnings Call Presentation November 26, 2018 Disclaimer This presentation does not constitute an offer to sell or issue or the solicitation of an offer to buy or acquire
Third Quarter Final Financial Results
 Third Quarter 2017 Final Financial Results DECEMBER 28, 2017 Forward-Looking Statements This Presentation has been prepared by Calumet Specialty Products Partners, L.P. (the Company or Calumet ) as of
Bharat Petroleum Corporation Ltd
 Institutional Equity Research Key data 19 June 2008 Sector Oil& Gas Market Cap Rs.7bn/US$2.3bn 52 Wk H/L (Rs) 560/260.25 Avg. daily vol. (6 month) 799,179 BSE Code 500547 NSE Code BPCL Bloomberg BPCLIN
06 July 2007 Flash Comment
 06 July 2007 Flash Comment CR Power (0836.HK) Acquisition of Jinzhou Power Plant Expected Return Rating : Reduce Price (05/07/07) : HK$19.50 Target Price : HK$16.66 Expected Capital Gain : -14.6% Expected
Russell 2000 Index Options
 Interactive Brokers Webcast Russell 2000 Index Options April 20, 2016 Presented by Russell Rhoads, Senior Instructor Disclosure Options involve risks and are not suitable for all investors. Prior to buying
Record year without Gas Business 2006 AND 2006 IV. QUARTER PRELIMINARY RESULTS. February 12, 2007
 Record year without Gas Business AND IV. QUARTER PRELIMINARY RESULTS February 12, 2007 highlights Outstanding results due to previous years investments and efficiency improvements in all businesses Key
1 6 A u g u s t Q RESULTS TELECONFERENCE
 1 6 A u g u s t 2 0 1 7 Q2 2017 RESULTS TELECONFERENCE SAFE HARBOR STATEMENT Matters discussed in this release may constitute forward-looking statements. Forward-looking statements reflect our current
Delek US Holdings, Inc./ Delek Logistics Partners, LP Wells Fargo Energy Symposium December 2013
 Delek US Holdings, Inc./ Delek Logistics Partners, LP Wells Fargo Energy Symposium December 2013 Safe Harbor Provision Delek US Holdings and Delek Logistics Partners, LP are traded on the New York Stock
Looking to the medium term
 Looking to the medium term Issued: 4 September 2013 Legal notice This presentation has been prepared to inform investors and prospective investors in the secondary markets about the Group and does not
2013 3Q Results Presentation. Athens, 14 November 2013
 2013 3Q Results Presentation Athens, 14 November 2013 CONTENTS Executive Summary Industry Environment Group Results Overview Segmental Performance Financial Results Q&A 1 3Q 2013 GROUP KEY FINANCIALS FY
Please do not copy or distribute this material as it contains the confidential information of the Company.
 This report has been prepared by Hyundai Oilbank Co., Ltd., indicated as "Company" below, for the purpose of promoting understanding of the company's business activities and it is prohibited to export,
Bharat Petroleum Corporation
 Higher inventory loss drag earnings August 14, 2017 Avishek Datta avishekdatta@plindia.com +91 22 66322254 Rating BUY Price Rs479 Target Price Rs553 Implied Upside 15.4% Sensex 31,449 Nifty 9,794 (Prices
OPEC extends oil output cut through March 2018
 Economics Research Desk Market Highlights: Oil & Gas update 25 May 2017 OPEC extends oil output cut through March 2018 Oil prices swung between sharp gains and losses in volatile trade on Thursday, after
BHARAT FORGE LIMITED RESEARCH
 EQUITY September 05, 2008 RESULTS REVIEW Share Data Market Cap Rs. 56 bn Price Rs. 250.45 BSE Sensex 14,483.83 Reuters Bloomberg Avg. Volume (52 Week) BFRG.BO BHFC IN 0.1 mn 52-Week High/Low Rs. 389.75/215.05
3 MAY Q Interim Management Statement
 3 MAY 2018 Q1 2018 Interim Management Statement Important Notice This presentation has been prepared by the management of Nyrstar NV (the "Company"). It does not constitute or form part of, and should
BOARD OF DIRECTORS. James Flude Chief Financial Officer. Peter Cheung Executive Chairman. Steve Crossley Chief Executive Officer
 ANNUAL GENERAL MEETING YEAR ENDED 30 APRIL 2016 SEPTEMBER 2016 BOARD OF DIRECTORS Peter Cheung Executive Chairman Steve Crossley Chief Executive Officer James Flude Chief Financial Officer Joanne Lake
THE CURRENCY- IRANIAN RIAL (IRR)
") THE CURRENCY- IRANIAN RIAL (IRR) THE VIEW ON FX JANUARY 2018 ASSET MANAGEMENT AND PRIVATE EQUITY 1978 1979 1980 1981 1982 1983 1984 1985 1986 1987 1988 1989 1990 1991 1992 1993 1994 1995 1996 1997 1998
THE CURRENCY- IRANIAN RIAL (IRR) THE VIEW ON FX JANUARY 2018 ASSET MANAGEMENT AND PRIVATE EQUITY 1978 1979 1980 1981 1982 1983 1984 1985 1986 1987 1988 1989 1990 1991 1992 1993 1994 1995 1996 1997 1998
Amber Enterprises India Ltd
 3QFY2019 Result Update Consumer Durable February 16, 2019 Amber Enterprises India Ltd Performance Update (` cr) 3QFY19 3QFY18 % yoy 2QFY19 % qoq Revenue 388.8 338.4 14.9 226.3 71.8 EBITDA 22.1 24.1 (8.2)
Orders received increased to EUR 3.1 billion and Comparable EBITA to EUR 196 million in 2016
 Orders received increased to EUR 3.1 billion and Comparable EBITA to EUR 196 million in 216 Financial Statements Review 216 February 8, 217 Pasi Laine, President and CEO Kari Saarinen, CFO Agenda Financial
Reliance Industries. Timing is everything BUY COMPANY UPDATE 1 OCT 2014
 INDUSTRY OIL & GAS Timing is everything COMPANY UPDATE 1 OCT 2014 Reliance Industries BUY CMP (as on 30 Sep 2014) Rs 945 Target Price Rs 1,100 Nifty 7,965 Sensex 26,631 KEY STOCK DATA Bloomberg/Reuters
1Q 2017 IFRS Financial Results May 31, 2017
 Always moving forward 1Q 2017 IFRS Financial Results May 31, 2017 Forward-Looking Statements Certain statements in this presentation are not historical facts and are forward-looking. Examples of such forwardlooking
Statkraft Investor Update. March 2014
 Statkraft Investor Update March 2014 Disclaimer This presentation has been prepared by, and the information contained herein (unless otherwise indicated) has been provided by Statkraft AS (the "Company").
Market Watch Presentation
 Special Presentation Market Watch Presentation Petrotech Johannes Benigni December 2016 Disclaimer All statements other than statements of historical fact are, or may be deemed to be, forward-looking statements.
Gulf Keystone Petroleum
 Gulf Keystone Petroleum 13 July 2018 Annual General Meeting Amsterdam Disclaimer This proprietary presentation (the Presentation ) has been prepared by Gulf Keystone Petroleum Limited (the Company ). Under
Quality assets. Selective and profitable growth. Self-funding business model
 This presentation has been prepared by EDP Renováveis, S.A. (the "Company") solely for use at the presentation to be made on May 6 th, 2015. By attending the meeting where this presentation is made, or
Investor presentation, Interim report September 2018 November 2018 NOBINA AB. Nobina investor presentation, Q3 2018/19
 1 Investor presentation, Interim report September 2018 November 2018 NOBINA AB PROFITABLE GROWTH IN THIRD QUARTER NET SALES EBITA EBT CASH FLOW SEK Millions 2,609 (2,260) SEK Millions 256 (221) SEK Millions
ETFs: Regulatory (High) Impact. Commerzbank, leaders in ETF February 2018
 Impact. Commerzbank, leaders in ETF February 2018") ETFs: Regulatory (High) Impact Commerzbank, leaders in ETF February 2018 What are ETFs? Securities that track the value of an index, commodities or a basket of assets and trade like a stock on the exchange
ETFs: Regulatory (High) Impact Commerzbank, leaders in ETF February 2018 What are ETFs? Securities that track the value of an index, commodities or a basket of assets and trade like a stock on the exchange
Q3 FY2010 Financial Highlights
 Disclaimer The information in this document has not been independently verified and no representation or warranty, express or implied, is made as to, and no reliance should be placed on, the fairness,
Results 2Q18. August 2, 2018
 Results August 2, 2018 Highlights Indicators Var. x 2Q17 Operating Income (R$ MM) 42.8 +92.7% Operating Margin 1.8% +0.8 p.p. Net operating revenues: R$2.4 billion (+9.0% vs. 2Q17) ASK (BN) 10.7 +2.2%
Sabancı Holding Q Earnings Presentation
 Sabancı Holding Q4 2017 Earnings Presentation Disclaimer 2 The information and opinions contained in this document have been compiled by Hacı Ömer Sabancı Holding A.Ş. ( Holding ) from sources believed