Investor Presentation. FY 2017 Results
|
|
|
- Kerry Harper
- 6 years ago
- Views:
Transcription


1 Investor Presentation FY 2017 Results April 4, 2018
2 Disclaimer This presentation provides general information about Compañía Sud Americana de Vapores S.A. ( CSAV ). It consists of summary information and does not purport to be complete. It is not intended to be relied upon as advice to potential investors. No representations or warranties, express or implied, are made as to, and no reliance should be placed on, the accuracy, fairness or completeness of the information presented or contained in this presentation. Neither CSAV nor any of its affiliates, advisers or representatives, accepts any responsibility whatsoever for any loss or damage arising from any information presented or contained in this presentation. The information presented or contained in this presentation is subject to change without notice and its accuracy is not guaranteed. Neither the Company nor any of its affiliates, advisers or representatives make any undertaking to update any such information subsequent to the date hereof. This presentation contains forward looking statements within the meaning of the 'safe harbor' provision of the US securities laws. These statements are based on management's current expectations or beliefs and are subject to a number of factors and uncertainties that could cause actual results to differ materially from those described in the forward looking statements. Actual results may differ from those set forth in the forward looking statements as a result of various factors (including, but not limited to, future global economic conditions, market conditions affecting the container shipping industry, intense competition in the markets in which we operate, potential environmental liability and capital costs of compliance with applicable laws, regulations and standards in the markets in which we operate, diverse political, legal, economic and other conditions affecting the markets in which we operate, our ability to successfully integrate business acquisitions and our ability to service our debt requirements). Many of these factors are beyond our control. This presentation is intended to provide a general overview of CSAV business and does not purport to deal with all aspects and details regarding CSAV. Accordingly, neither CSAV nor any of its directors, officers, employees or advisers nor any other person makes any representation or warranty, expressed or implied, as to, and accordingly no reliance should be placed on, the fairness, accuracy or completeness of the information contained in the presentation or of the views given or implied. Neither CSAV nor any ofits directors, officers, employees or advisors nor any other person shall have any liability whatsoever for any errors or omissions or any loss howsoever arising, directly or indirectly, from any use of this information or its contents or otherwise arising in connection therewith. Each investor must conduct and rely on its own evaluation in taking an investment decision. This presentation does not constitute an offer, or invitation, or solicitation of an offer, to subscribe for or purchase any securities. Neither this presentation nor anything contained herein shall form the basis of any contract or commitment whatsoever. Recipients of this presentation are not to construe the contents of this summary as legal, tax or investment advice and recipients should consult their own advisors in this regard. 2
3 Agenda 1. Highlights 2. Market Overview 3. FY 2017 Results 4. Outlook
, as synergies were not included in the valuation under applicable IFRS standards.")
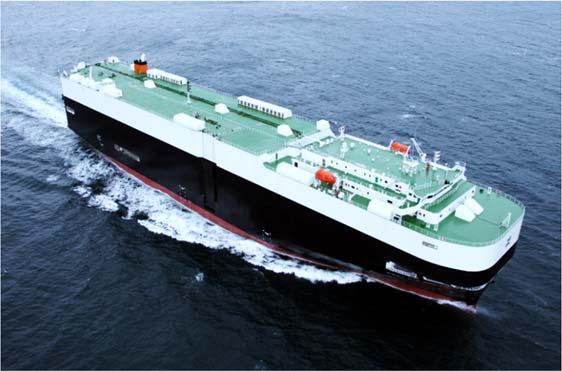
4 Highlights The merger between HLAG and UASC was successfully completed on May 24, CSAV diluted its share in HLAG from 31.4% to 22.6%. The dilution generated an accounting loss for CSAV of US$ M (non recurring), as synergies were not included in the valuation under applicable IFRS standards. HLAG s & CSAV s capital increases successfully completed. With the HLAG placement completed, CSAV reached a 24.7% interest. CSAV increased its share to 25% by purchasing shares from Kühne Maritime on Oct 30, CSAV successfully concluded its capital increase in Chile on November 21, 2017, raising gross proceeds of US$ 294 M, leaving a cash surplus of US$ 31 M after repaying bridge loans. With the cash surplus CSAV purchased an additional 0.5% of HLAG, reaching a 25.5% stake. These acquisitions generated a badwill profit in CSAV of US$14.8 M in Q In 2017, HLAG reported a substantial improvement in results compared to the previous period. EBIT US$ 466 M; EBITDA US$ M (2017 vs 2016: EBIT +326 M, Net Income +138 M). For CSAV, the net dilution effect (incl. the Q4 badwill) heavily impacted the container shipping segment for 2017, alongside deferred tax expenses of US$ 44.3 M. Excluding these accounting effects, segment earnings reported a profit of US$ 4.3 M, an improvement of US$ 19.5 M when compared to 2016, excluding the effect of the reversal of the ILA provision in Other transport services segment (mainly Car Carrier) reported a full year profit of US$ 4.4 M in 2017, completing seven consecutive quarter of profits for CSAV s retained activities. 4


5 Market Overview Extracted from HLAG s Investor Presentation FY 2017, available at lloyd.com/en/ir.html 5
6 Market Overview SCFI vs Rotterdam Platts (March 2018) Margen SCFI RTM(1) Rotterdam Platts SCFI (2) Avg. Margin 2013 = 480 Avg. Margin 2014 = 536 Avg. Margin 2015 = 468 Avg. Margin 2016 = 436 Avg. Margin 2017 = ene 13 mar 13 may 13 jul 13 sep 13 nov 13 ene 14 mar 14 may 14 jul 14 sep 14 nov 14 ene 15 mar 15 may 15 jul 15 sep 15 nov 15 ene 16 mar 16 may 16 jul 16 sep 16 nov 16 ene 17 mar 17 may 17 jul 17 sep 17 nov 17 ene 18 mar 18 Notes: (1) SCFI RTM Margin is only referential since bunker consumption per TEU may vary depending on the trade and on the vessel efficiency (2) The SCFI index includes: Spot rates for Main Haul trades exports from Shanghai Margin Monthly Jan Feb Mar Abr May Jun Margin Monthly Jul Aug Sep Oct Nov Dic Margin Jan Mar Source: SCFI. Platts. 6
![Market Overview Carrier capacity [TEU m] Global capacity share [%] Extracted from HLAG](/docs-images/76/74220441/images/7-3.jpg "s Investor Presentation FY 2017, available at https://www.hapag lloyd.com/en/ir.html 7")
7 Market Overview Carrier capacity [TEU m] Global capacity share [%] Extracted from HLAG s Investor Presentation FY 2017, available at lloyd.com/en/ir.html 7
8 FY 2017 Results: CSAV CSAV Net Income 2016 vs 2017 Container Transport Segment Figures in USD million CSAV Net Income 2016 Other Transport Services Segment 4.4 Equity Accounted Investees (HLAG) 19.9 Dilution Accounting Loss Badwill Defered Taxes GAE & Others CSAV Net Income 2017 (23.3) (151,4) 14.8 (188.1) (167.2) CSAV Net Income before Tax 2016 vs 2017 (excluding net dilution accounting loss effect) Container Transport Segment (23.8) (12.9) CSAV Net Income before Tax 2016 Other Transport Services Segment Equity Accounted Investees (HLAG) 19.9 GAE & Others CSAV Net Income before Tax (12.9) 10.8 (3.0) 8
9 FY 2017 Results: CSAV Figures in USD million 2017 Q4 Q3 Q2 Q1 YoY QoQ 2016 Q4 M US$ M US$ M US$ M US$ M US$ M US$ M US$ M US$ M US$ Operating revenue (2.6) Operating cost (102.6) (26.5) (27.7) (27.6) (20.8) 3.3 (27.7) (105.9) (26.9) Gross margin SG&A and others (10.7) (3.4) (2.7) (2.3) (2.3) 1.0 (2.7) (11.7) (3.7) Other income (11.5) Operational result 1.3 (1.5) (0.1) (6.6) EBITDA (w/o equity accounted investees) 2.5 (0.8) (0.1) (5.5) Financial result (4.4) (1.4) (1.0) (1.0) (1.0) (0.6) (1.0) (3.8) (1.0) Equity accounted investees (139.5) (159.8) (15.4) (132.5) 14.4 (7.0) 20.2 Exchange rate differences (0.1) (0.1) 0.2 Taxes (45.2) (7.1) (12.3) (20.3) (5.5) (24.6) (12.3) (20.6) 12.4 Net result after taxes (186.8) (179.3) (22.1) (163.2) 2.6 (23.6) 32.5 Discontinued operations net result after tax (1.3) (0.7) (0.5) (0.1) 0.0 (2.6) (0.5) 1.3 (0.1) Reversal of non controlling interests (1.0) 0.0 Net profit result attributable to shareholders (188.1) (179.4) (22.1) (164.8) 2.1 (23.3) 32.4 Note: 2016 & 2017 results has been restated to account for the liquid bulk business unit and the logistics business unit as discontinued operations, according to IFRS 5. 9
10 FY 2017 Results: CSAV Segments Results Figures in USD million Other transport services 2017 Q4 Q3 Q2 Q1 YoY QoQ 2016 Q4 M US$ M US$ M US$ M US$ M US$ M US$ M US$ M US$ M US$ Operating revenue (3.0) Operating cost (102.6) (26.5) (27.7) (27.6) (20.8) (105.9) (27.2) Gross margin (2.3) SG&A and others (6.2) (1.4) (1.9) (1.4) (1.5) (7.6) (2.6) Other revenue net (0.5) Operational result (1.6) (0.5) 2.1 Financial result Equity accounted investees Exchange rate differences (0.1) 0.2 (0.1) 0.2 (0.1) (0.1) 0.2 Taxes (0.9) 0.3 (0.5) (0.8) 0.1 (0.8) 0.3 (0.1) 0.0 Net result after taxes (1.3) (0.4) 2.4 Discontinued operations net result after tax (1.3) (0.7) (0.5) (0.1) 0.0 (2.6) (0.6) 1.3 (0.1) Reversal of non controlling interests (1.0) 0.0 Net profit result attributable to shareholders (1.9) (0.1) 2.3 Container transport services 2017 Q4 Q3 Q2 Q1 YoY QoQ 2016 Q4 M US$ M US$ M US$ M US$ M US$ M US$ M US$ M US$ M US$ SG&A and others (4.5) (2.0) (0.8) (0.9) (0.8) (0.4) (0.9) (4.1) (1.1) Other revenue net (0.1) (12.5) (0.2) Operational result (4.5) (2.0) (0.9) (0.8) (0.8) (12.9) (0.6) 8.4 (1.4) Financial result (5.0) (1.6) (1.1) (1.1) (1.2) (0.9) (0.5) (4.1) (1.1) Equity accounted investees (139.5) (159.8) (15.4) (132.5) 1.1 (7.0) 20.2 Exchange rate differences (0.1) Taxes (44.3) (7.4) (11.8) (19.5) (5.6) (23.8) (19.8) (20.5) 12.4 Net result after taxes (192.4) (181.3) (23.0) (169.2) (19.2) (23.2) 30.1 Net profit result attributable to shareholders (192.4) (181.3) (23.0) (169.2) (19.2) (23.2) 30.1 Note: 2016 & 2017 results has been restated to account for the liquid bulk business unit and the logistics business unit as discontinued operations, according to IFRS 5. 10
11 FY 2017 Results: Hapag Lloyd EBITDA Margin, EBIT Margin and Net income trends 7.9% 10.6% 11.3% 12.5% 1.6% 4.1% 5.1% 5.4% Q Q Q Q EBITDA Margin EBIT Margin Group profit / loss Q Q Figures in USD million (103) 11

12 HLAG FY 2017: Profit of US$ 35 M, reverting H1 loss. Extracted from HLAG s Investor Presentation FY 2017, available at lloyd.com/en/ir.html 12
13 Balance Sheet Position (Figures in USD million) Assets December 2017 December 2016 Var Cash & cash equivalents (12.2) Accounts receivables (0.9) Inventories (1.1) Other current assets (1.2) Total current assets (15.4) Equity accounted investees 1, , Deferred tax asset (46.2) PP&E and others (1.1) Other (0.1) Total non current assets 2, , Total assets 2, , Equity & liabilities December 2017 December 2016 Var Accounts payables (2.2) Financial obligations Provisions (13.0) Other liabilities Total liabilities (13.2) Equity 2, , Minority interest Total equity 2, , Total equity & liabilities 2, ,
14 Cash Position (Figures in USD million) Cash flow 2017 Initial cash position 54.6 Operating cash flow (12.9) Investing cash flow (288.6) Equity accounted investees (293.7) Non controlling interests & subsidiaries 0.2 PP&E 3.9 Interest & dividends received 1.0 Financing cash flow Capital increase Bridge loan received Bridge loan payment (120.0) Interests paid (4.9) Exchange rate variation 1.0 Final cash position
15 Outlook UASC commercial integration completed in November 2017, only 5 months after closing, with sizeable optimization measures already implemented in the areas of network and shipping systems during Ongoing fleet and network optimization to extract full impact of synergies. Main focus of HLAG s management in 2017 was to quickly integrate the UASC business, enabling about 90% synergies of US$ 435 M p/a to be realized during Substantial deleveraging in HLAG from 2018 onwards, considering highly positive EBITDA and no significant investments in vessels, other than M&R. For the container business, transport volumes expected to increase around 5% in Container freight rates showing more stability in H2 2017, but still with a downward trend since Q related to the start of the slack season and Chinese new year. For the car carrier business, volumes expected to continue growing throughout 2018, with pressure on freight rates in local markets and also on our streamlined cost structure. 15
16 Annexes

17 Hapag Lloyd / UASC Merger Successfully Completed Extracted from HLAG s Investor Presentation FY 2017, available at lloyd.com/en/ir.html 17

18 Hapag Lloyd s New Shareholder Structure 1) CSAV Germany Container Holding GmbH 2) Kühne Maritime GmbH 3)Qatar Holding Germany GmbH 4) The Public Investment Fund of the Kingdom of Saudi Arabia Extracted from HLAG s Investor Presentation FY 2017, available at lloyd.com/en/ir.html 18

19 Hapag Lloyd / UASC Merger: Expected Synergies Extracted from HLAG s Investor Presentation FY 2017, available at lloyd.com/en/ir.html 19
Investor Presentation. H Results
 Investor Presentation H1 2018 Results September 4 th, 2018 Disclaimer This presentation provides general information about Compañía Sud Americana de Vapores S.A. ( CSAV ). It consists of summary information
Q4 I FY Hapag-Lloyd AG. Investor Report. 1 January to 31 December 2017
 Hapag-Lloyd AG 1 Q4 I FY 2017 Investor Report 1 January to 31 December 2017 SUMMARY OF HAPAG-LLOYD KEY FIGURES Key operating figures Q4 2017 Q4 2016 FY 2017 FY 2016 Change Total vessels, of which 219 166
Q1 I Hapag-Lloyd AG. Investor Report. 1 January to 31 March 2018
 Q1 I 2018 1 Hapag-Lloyd AG Investor Report 1 January to 31 March 2018 SUMMARY OF HAPAG-LLOYD KEY FIGURES Q1 2018 Q1 2017 Change Key operating figures Total vessels, of which 221 172 28% Own vessels 98
Investor Presentation Preliminary Financials Hamburg, 28 February 2018
 Investor Presentation Preliminary Financials 20 Hamburg, 28 February 2018 Disclaimer Forward-looking statements This presentation contains forward-looking statements that involve a number of risks and
Roadshow Presentation Preemptive Rights Offering. October 2017
 Roadshow Presentation Preemptive Rights Offering October 2017 Disclaimer The information hereby contained is a brief description of the characteristics of the issuance and of Compañía Sud Americana de
9M I Hapag-Lloyd AG. Investor. report. 1 January to 30 September 2017
 Hapag-Lloyd AG Investor 1 9M I 2017 report 1 January to 30 September 2017 SUMMARY OF HAPAG-LLOYD KEY FIGURES Key operating figures 1 Q3 2017 Q3 2016 9M 2017 9M 2016 % change Total vessels, of which 215
Hapag-Lloyd Analyst Event. Hamburg, 21 November 2017
 Hapag-Lloyd Analyst Event Hamburg, 21 November 20 Executive Summary Deliverables UASC Integration Sector Financials Way Forward We continued to deliver on our initiatives (UASC integration, cash capital
Investor Report 1 January to 30 September 2018
 Hapag-Lloyd AG 1 Q3 I 9M 2018 Investor Report 1 January to 30 September 2018 SUMMARY OF HAPAG-LLOYD KEY FIGURES Key operating figures 1 Q3 2018 Q3 2017 9M 2018 9M 2017 Change Total vessels, of which 222
Investor Presentation Q Results. Hamburg, 14 May 2018
 Investor Presentation Q1 2018 Results Hamburg, 14 May 2018 Disclaimer Forward-looking statements This presentation contains forward-looking statements that involve a number of risks and uncertainties.
Investor Presentation Preliminary Results Hamburg, 25 February 2019
 Investor Presentation Preliminary Results 20 Hamburg, 25 February 2019 Disclaimer Forward-looking statements This presentation contains forward-looking statements that involve a number of risks and uncertainties.
Hapag-Lloyd Analyst Event Financial Structure and Path to de-leveraging Hamburg, 21 November 2017
 Hapag-Lloyd Analyst Event Financial Structure and Path to de-leveraging Hamburg, 21 November 2017 Management summary Integration Financial Debt of UASC Strong Deleveraging Maintain Adequate Liquidity Reserve
INVESTOR REPORT HAPAG-LLOYD AG 1 JANUARY TO 31 MARCH 2015
 INVESTOR REPORT Q1 2015 HAPAG-LLOYD AG 1 JANUARY TO 31 MARCH 2015 SUMMARY OF HAPAG-LLOYD KEY FIGURES KEY OPERATING FIGURES 1) Q1 2015 Q1 2014 Change absolute Total vessels, of which 190 153 37 own vessels
Investor Presentation
 Investor Presentation Q1 2017 Results Hamburg, 12 May 2017 Disclaimer Forward-looking Statements This presentation contains forward-looking statements that involve a number of risks and uncertainties.
INVESTOR REPORT Q4 I FY 2014
 INVESTOR REPORT Q4 I FY 2014 HAPAG-LLOYD AG 1 JANUARY TO 31 DECEMBER 2014 SUMMARY OF HAPAG-LLOYD KEY FIGURES KEY OPERATING FIGURES Q4 2014 Q4 2013 FY 2014 FY 2013 Change absolute Total vessels 1), of which
The Navigator Company Q Results Presentation
 The Navigator Company 2016 Results Presentation April 28th, 2016 Speakers Diogo da Silveira CEO Manuel Regalado CFO Joana Appleton - IR 1 Significant turnover growth and diversification over the last years
Q Results presentation
 Q1 2016 Results presentation 12 May 2016 1 Disclaimer This presentation (the "Presentation") has been prepared and is issued by, and is the sole responsibility of Telepizza Group, S.A. ( Telepizza" or
Investor Presentation Full Year 2017 Results. Hamburg, 28 March 2018
 Investor Presentation Full Year 2017 Results Hamburg, 28 March 2018 Disclaimer Forward-looking statements This presentation contains forward-looking statements that involve a number of risks and uncertainties.
1Q 2013 Performance Review. 14 May 2013
 1Q 2013 Performance Review 14 May 2013 Forward Looking Statements The following presentation includes forward-looking statements, which involve known and unknown risks and uncertainties, that could cause
Investor Presentation Hamburg, 24 May 2017
 Investor Presentation Hamburg, 24 May 2017 Opening Remarks DEAL STRUCTURE On 24 May 2017, the merger between HapagLloyd and UASC has been closed UASC business has been contributed inkind into HapagLloyd
HAMBURGER HAFEN UND LOGISTIK AG
 HAMBURGER HAFEN UND LOGISTIK AG RESULTS JANUARY MARCH 2012 Analyst Conference Call, 15 May 2012 Hamburger Hafen und Logistik AG DISCLAIMER The facts and information contained herein are as up to date as
Investor Presentation Preliminary Financials Hamburg, 28 February 2017
 Investor Presentation Preliminary Financials 2016 Hamburg, 28 February 2017 Disclaimer Forward-looking Statements This presentation contains forward-looking statements that involve a number of risks and
Financial Highlights (1)
") Disclaimer The information in this document has not been independently verified and no representation or warranty, expressed or implied, is made as to, and no reliance should be placed on, the fairness,
Disclaimer The information in this document has not been independently verified and no representation or warranty, expressed or implied, is made as to, and no reliance should be placed on, the fairness,
Fourth Quarter 2015 Performance Summary
 Fourth Quarter 2015 Performance Summary Operational and Financial Highlights - 2015 Grifols revenues grow by 17.3% to Euros 3,935 million, and net profit grows by 13.2% reaching Euros 532 million of the
SMART STEEL. Q Results. Detlef Borghardt, CEO Dr. Matthias Heiden, CFO. August 14, 2018
 SMART STEEL Q2 218 Results Detlef Borghardt, CEO Dr. Matthias Heiden, CFO August 14, 218 Agenda Business Summary Guidance adjustment FY 218 Market update Regional trends: Status and profitability trend
Results FY 2017 Schaeffler AG. Conference Call March 7, 2018 Munich
 Results FY 2017 Schaeffler AG Conference Call Munich Disclaimer This presentation contains forward-looking statements. The words "anticipate", "assume", "believe", "estimate", "expect", "intend", "may",
Investor Presentation. Schaeffler India Limited February 09, 2018
 Schaeffler India Limited February 09, 2018 Agenda 1 2 3 4 Economy & Market Financial update Q4 / 12M - 2017 Transaction update Key takeaways 2 1 Economy & Market Macroeconomic Performance GDP Growth %
HAMBURGER HAFEN UND LOGISTIK AG
 HAMBURGER HAFEN UND LOGISTIK AG Analyst Conference Call on the Interim Results January to September 2017 Hamburg, 14 November 2017 Disclaimer The facts and information contained herein are as up to date
Corral Q May 2017
 Corral Q1 2017 May 2017 Disclaimer This presentation has been prepared by Corral Petroleum Holdings AB (publ) and/or its subsidiaries and affiliates ( Corral ). The information contained in this presentation
HAMBURGER HAFEN UND LOGISTIK AG
 HAMBURGER HAFEN UND LOGISTIK AG Analyst Conference Call on the Interim Results January to March 2017 Hamburg, 12 May 2017 Disclaimer The facts and information contained herein are as up to date as is reasonably
Hapag-Lloyd AG. Credit update following completion of the UASC merger. CREDIT OPINION 20 July Update. Summary Rating Rationale.
 CREDIT OPINION Hapag-Lloyd AG Credit update following completion of the UASC merger Update Summary Rating Rationale RATINGS Hapag-Lloyd AG Domicile Germany Long Term Rating 2 Type LT Corporate Family Ratings
Investor Presentation Preliminary Financials FY March 2016
 Investor Presentation Preliminary Financials FY 20 1 2 March 2016 Hapag-Lloyd made material progress in 20 STRATEGIC HIGHLIGHTS CUATRO: The integration is completed substantial portion of synergies already
Earnings Presentation FIRST QUARTER 2016
 Earnings Presentation FIRST QUARTER 2016 Agenda 1 Highlights of the period 2 Consolidated overview 3 Overview by Business Units 4 Overview by Country 5 Balance Sheet Financials 6 Q&A First Quarter Highlights
Kuehne + Nagel International AG
 Kuehne + Nagel International AG Analyst Conference Call 1 st Half-Year 2011 Results July 18, 2011 (CET 14.00) Schindellegi, Switzerland Agenda Welcome & Highlights 1st Half Year 2011 Gerard van Kesteren
COSCO SHIPPING Holdings Co., Ltd.
 COSCO SHIPPING Holdings Co., Ltd. 2018 Q3 Results STOCK CODE:601919.SH / 1919.HK 31 October 2018 To become a top-tier container transportation and port service provider 01 Highlights 02 Financial Review
Analyst Presentation Q May 8, 2014 Dr Matthias Zieschang, CFO
 Analyst Presentation Q1 2014 May 8, 2014 Dr Matthias Zieschang, CFO Slide 2 Disclaimer This document has been prepared by Fraport solely for use in this presentation. The information contained in this
Full year and Q results March 15, 2017
 Full year and Q4 2016 results March 15, 2017 Disclaimer This document and its related communication ( Presentation ) have been issued by windeln.de SE and its subsidiaries ( Company ) and do not constitute
Saudi Arabian Mining Company (Ma aden)
") Saudi Arabian Mining Company (Ma aden) Earnings Conference Call Q2 2017 August 1, 2017 Earnings Call Presentation Q2, 2017 1 Walid Al-Hakim Head Investor Relations Earnings Call Presentation Q2, 2017 2
Saudi Arabian Mining Company (Ma aden) Earnings Conference Call Q2 2017 August 1, 2017 Earnings Call Presentation Q2, 2017 1 Walid Al-Hakim Head Investor Relations Earnings Call Presentation Q2, 2017 2
YTD13 & 3Q 2013 Performance Review. 30 October 2013
 YTD13 & 3Q 2013 Performance Review 30 October 2013 Forward Looking Statements The following presentation includes forward-looking statements, which involve known and unknown risks and uncertainties, that
Investor Presentation Signing of Business Combination Agreement. 18 July 2016
 Investor Presentation Signing of Business Combination Agreement 1 18 July 2016 Disclaimer Forwardlooking Statements This presentation contains forwardlooking statements that involve a number of risks and
Q3 FY2010 Financial Highlights
 Disclaimer The information in this document has not been independently verified and no representation or warranty, express or implied, is made as to, and no reliance should be placed on, the fairness,
RESULTS PRESENTATION THIRD QUARTER November 21st, 2018
 RESULTS PRESENTATION THIRD QUARTER 2018 November 21st, 2018 RESULTS THIRD QUARTER 2018 DISCLAIMER This presentation provides general information about Sociedad Matriz SAAM S.A. ( SMSAAM ) and related companies.
2017 1Q Results. May 2017
 217 1Q Results May 217 Agenda 1. Financials 2. Market Fundamental 3. Industry Outlook 4. Plant Operation 5.Expansion 2 Financial Status (Unit: NTD Million) 4Q16 1Q17 QoQ 1Q16 YoY Revenues 152,287 164,486
Results 2Q18. August 2, 2018
 Results August 2, 2018 Highlights Indicators Var. x 2Q17 Operating Income (R$ MM) 42.8 +92.7% Operating Margin 1.8% +0.8 p.p. Net operating revenues: R$2.4 billion (+9.0% vs. 2Q17) ASK (BN) 10.7 +2.2%
HAMBURGER HAFEN UND LOGISTIK AG INVESTOR PRESENTATION
 HAMBURGER HAFEN UND LOGISTIK AG INVESTOR PRESENTATION Hamburg Investment Conference - Bankhaus Lampe, 22 June 2011 Hamburger Hafen und Logistik AG DISCLAIMER The facts and information contained herein
JinkoSolar Holding Co., Ltd. Q Earnings Call Presentation
 JinkoSolar Holding Co., Ltd. Q3 2018 Earnings Call Presentation November 26, 2018 Disclaimer This presentation does not constitute an offer to sell or issue or the solicitation of an offer to buy or acquire
Financial Results: Fourth Quarter & Fiscal October 24, 2017
 Financial Results: Fourth Quarter & Fiscal 2017 October 24, 2017 Safe Harbor SAFE HARBOR Statements and information included in this presentation by Schnitzer Steel Industries, Inc. (the "Company") that
PORR 1H 2014 Update Investor Presentation September 2014
 PORR 1H 2014 Update Investor Presentation September 2014 Disclaimer This presentation was prepared by PORR AG (the "Company") solely for use at investors meetings and is furnished to you solely for informational
COMPAÑÍA SUD AMERICANA DE VAPORES S.A. AND SUBSIDIARIES
 COMPAÑÍA SUD AMERICANA DE VAPORES S.A. AND SUBSIDIARIES INTERIM CONSOLIDATED FINANCIAL STATEMENTS and for the period ended March 31, 2018 (Unaudited) M/V CSAV Rio Grey, 6,300 RT car carrier chartered by
Full year results presentation Year ended 31 March June 2018
 Full year results presentation Year ended 31 March 2018 7 June 2018 Disclaimer Not for publication, transmission, distribution or release, directly or indirectly, in or into any jurisdiction in which the
2017 Container Shipping Outlook - A tragedy in three acts
 217 Container Shipping Outlook - A tragedy in three acts Alan Murphy CEO and Co-Founder SeaIntel Maritime Analysis June 1 st, 217 ESPO Barcelona 217 1 SeaIntel Container Shipping Analysts - Founded January
FY 2017 Presentation
 FY 2017 Presentation 1 2 At a glance Overview FY 2017 YoY revenue growth of 2.2% to EUR 82.5 mn (FY 2016: EUR 80.7 mn) in a challenging year after 13.5% decline at the end of H1/17 (compared YoY) New order
PROTELINDO PT. SARANA MENARA NUSANTARA, Tbk. (TOWR) Indonesia s Premier Tower Company 2Q 2014 Results Presentation
 Indonesia s Premier Tower Company 2Q 2014 Results Presentation") PROTELINDO PT. SARANA MENARA NUSANTARA, Tbk. (TOWR) Indonesia s Premier Tower Company 2Q 2014 Results Presentation Disclaimer These materials have been prepared by PT Sarana Menara Nusantara, Tbk. (the
PROTELINDO PT. SARANA MENARA NUSANTARA, Tbk. (TOWR) Indonesia s Premier Tower Company 2Q 2014 Results Presentation Disclaimer These materials have been prepared by PT Sarana Menara Nusantara, Tbk. (the
EARNINGS CONFERENCE CALL
 EARNINGS CONFERENCE CALL AUGUST 15, 2017 INVESTOR RELATIONS Disclaimer This material is a presentation of general information about Marfrig Global Foods S.A. and its consolidated subsidiaries (jointly
Investor Presentation
 Investor Presentation Full Year 2016 Results Hamburg, 24 March 2017 Disclaimer Forwardlooking Statements This presentation contains forwardlooking statements that involve a number of risks and uncertainties.
RAJESH EXPORTS LIMITED GLOBAL PRESENCE IN GOLD AND GOLD PRODUCTS. Earnings Presentation - FY16
 RAJESH EXPORTS LIMITED GLOBAL PRESENCE IN GOLD AND GOLD PRODUCTS Earnings Presentation - FY16 HIGHLIGHT FOR THE QUARTER Posted record REVENUE, EBITDA and PAT for the year 2015-16. Consolidated position
INVESTOR PRESENTATION Results 2Q2018. August 16, 2018
 INVESTOR PRESENTATION Results 2Q2018 August 16, 2018 RESULTS SECOND QUARTER 2018 DISCLAIMER This presentation provides general information about Sociedad Matriz SAAM S.A. ( SMSAAM ) and related companies.
Product tanker supply/demand in dwt rates are (so basically the inverse of last week s discussion). Currently, the one-year time charter
. Currently, the one-year time charter") Crude Products Drybulk Containers AXIA Research An American s view from Piraeus Shipping Weekly Market Overview So, the elections happened just like everyone had predicted, and the markets responded just
Crude Products Drybulk Containers AXIA Research An American s view from Piraeus Shipping Weekly Market Overview So, the elections happened just like everyone had predicted, and the markets responded just
SMART STEEL. Q Results. Detlef Borghardt, CEO Dr. Matthias Heiden, CFO. November 8, 2018
 SMART STEEL Q3 218 Results Detlef Borghardt, CEO Dr. Matthias Heiden, CFO November 8, 218 Agenda Business Summary Preliminaries confirmed Market update Segments: Status and profitability trend in the regions
Fourth Quarter 2016 Performance Summary
 Fourth Quarter 2016 Performance Summary Operational and Financial Highlights - 2016 Net profit rises by +2.5% to Euros 545.5 million Recurring sales (excluding Raw Materials and Others) rise by +4.5% (+4.6%
was RESULTS Q May 30, 2018
 was RESULTS Q1-2018 May 30, 2018 FORWARD-LOOKING STATEMENTS Matters discussed in this presentation may constitute forward-looking statements. The Private Securities Litigation Reform Act of 1995 provides
2017 Container Shipping Outlook - A tragedy in three acts
 217 Container Shipping Outlook - A tragedy in three acts Alan Murphy CEO and Co-Founder SeaIntel Maritime Analysis March 21 st, 217 ILSS 217 1 SeaIntel Container Shipping Analysts - Founded January 1 st,
FY 2017 FINANCIAL RESULTS. March 1 st, 2018
 FY 2017 FINANCIAL RESULTS March 1 st, 2018 FY 2017 Results 1. Highlights 2. FY Financial Performance Analysis 3. Appendix Verallia FY 2017 Financial Results 01/03/2018 2 2017 HIGHLIGHTS A very good financial
Air Berlin PLC 11 th November 2015 Analyst Conference 3rd Quarter 2015
 Air Berlin PLC 11 th November 2015 Analyst Conference 3rd Quarter 2015 DISCLAIMER This presentation has been prepared by Air Berlin PLC. No representation, warranty or undertaking, express or implied,
HALF-YEAR RESULTS 2017
 HALF-YEAR RESULTS 2017 INVESTOR PRESENTATION RESULTS FROM JANUARY TO JUNE 2017 BASEL 20 JULY 2017 Achievements and key figures Operating and financial review Outlook and priorities 2017 Appendix 2 ACHIEVEMENTS
Goodyear India ACCUMULATE. Performance Highlights. CMP Target Price `326 `374. 1QCY2012 Result Update Tyres. Key financials
 1QCY212 Result Update Tyres June 6, 212 Goodyear India Performance Highlights Y/E December (` cr) 1QCY212 1QCY211 % chg (yoy) 4QCY211 % chg (qoq) Net sales 331 336 (1.6) 395 (16.2) EBITDA 2 24 (18.6) 34
Corral Q August 2017
 Corral Q2 2017 August 2017 Disclaimer This presentation has been prepared by Corral Petroleum Holdings AB (publ) and/or its subsidiaries and affiliates ( Corral ). The information contained in this presentation
Historical Pricing PJM COMED, Around the Clock. Cal '15 Cal '16 Cal '17 Cal '18 Cal '19 Cal '20 Cal '21 Cal '22
 $50 Historical Pricing PJM COMED, Around the Clock $48 $46 $44 $42 $40 $38 $36 $34 $32 $30 $28 $26 Cal '15 Cal '16 Cal '17 Cal '18 Cal '19 Cal '20 Cal '21 Cal '22 The information presented above was gathered
Q RESULTS May 14th, 2018
 Q1 2018 RESULTS May 14th, 2018 1 Disclaimer This document has been prepared by HelloFresh SE (the Company and, together with its subsidiaries, the Group ). All material contained in this document and information
To put our customers, employees and suppliers at the heart of our business decisions. Operating results 1Q16
 To put our customers, employees and suppliers at the heart of our business decisions. Operating results 1Q16 Date 13 May 2016 Important Notice The information contained in this presentation is for information
[Insert Subheading] Click to edit Master text styles. Shop Direct Limited. Q1 FY18 Results. Three months ended 30 September 2017.
![[Insert Subheading] Click to edit Master text styles. Shop Direct Limited. Q1 FY18 Results. Three months ended 30 September 2017.](/thumbs/75/71763350.jpg "[Insert Subheading] Click to edit Master text styles. Shop Direct Limited. Q1 FY18 Results. Three months ended 30 September 2017.") [Insert Subheading] Click to edit Master text styles Shop Direct Limited Q1 FY18 Results Three months ended 30 September 2017 7 December 2017 1 Disclaimer This presentation (the Presentation ) has been
[Insert Subheading] Click to edit Master text styles Shop Direct Limited Q1 FY18 Results Three months ended 30 September 2017 7 December 2017 1 Disclaimer This presentation (the Presentation ) has been
Results Q Schaeffler AG. Conference Call November 8, 2017 Herzogenaurach
 Results 2017 Schaeffler AG Conference Call Herzogenaurach Disclaimer This presentation contains forward-looking statements. The words "anticipate", "assume", "believe", "estimate", "expect", "intend",
Q3 Investor Call. September 2016
 Q3 Investor Call September 2016 Disclaimer This presentation has been prepared by Corral Petroleum Holdings AB (publ) and/or its subsidiaries and affiliates ( Corral ). The information contained in this
2011 Interim Results. Keith Gordon, Managing Director & Chief Executive Officer Stephen Gobby, Chief Financial Officer
 2011 Interim Results Keith Gordon, Managing Director & Chief Executive Officer Stephen Gobby, Chief Financial Officer Emeco 2011 Interim Results Overview Financials Strategy & Outlook Questions Appendices
Investor Presentation. 1 st Quarter 2017
 Investor Presentation 1 st Quarter 2017 1 1 Disclaimer This document has been prepared by Mobily (the Company ) solely for presentation purposes. The information contained in this document has not been
Santiago, May 11 th, Results Presentation 1Q18
 Santiago, May 11 th, 2018 Results Presentation 1Q18 Agenda I. Highlights II. III. Financial Statements Supply, Demand and Prices IV. Farming Operation V. Prospects 2 Highlights EBIT 1Q18 USD 18.8 million
Historical Pricing PJM PSEG, Around the Clock. Cal '15 Cal '16 Cal '17 Cal '18 Cal '19 Cal '20 Cal '21 Cal '22
 $70 Historical Pricing PJM PSEG, Around the Clock $65 $60 $55 $50 $45 $40 $35 $30 $25 Cal '15 Cal '16 Cal '17 Cal '18 Cal '19 Cal '20 Cal '21 Cal '22 The information presented above was gathered and compiled
NINE MONTHS RESULTS 2017
 NINE MONTHS RESULTS 2017 INVESTOR PRESENTATION RESULTS FROM JANUARY TO SEPTEMBER 2017 BASEL 19 OCTOBER 2017 Achievements and key figures Operating and financial review Outlook and priorities 2017 Appendix
Saudi Arabian Mining Company (Ma aden)
") Saudi Arabian Mining Company (Ma aden) Earnings Conference Call Second Quarter 2018 July 26, 2018 1 Reem M. Asaad Head of Investor Relations 2 Forward looking statement This presentation contains statements
Saudi Arabian Mining Company (Ma aden) Earnings Conference Call Second Quarter 2018 July 26, 2018 1 Reem M. Asaad Head of Investor Relations 2 Forward looking statement This presentation contains statements
H Results. September 13 th, Delivery Hero SE. H Trading Update.
 H 208 Results September 3 th, 208 Our Clear Vision AMAZING FOOD AMAZING ORDERING Create an amazing takeaway experience AMAZING SERVICE 2 Agenda Business Update 2 Financial Update 3 Outlook 3 H 208 Financial
26 October 2016 MEXICO. January September 2016
 26 October 2016 MEXICO January September 2016 Disclaimer IMPORTANT INFORMATION Banco Santander, S.A. ( Santander ) Warns that this presentation contains forward-looking statements within the meaning of
Statkraft Investor Update. March 2014
 Statkraft Investor Update March 2014 Disclaimer This presentation has been prepared by, and the information contained herein (unless otherwise indicated) has been provided by Statkraft AS (the "Company").
Saudi Company for Hardware (SACO) CMP: SAR 72, Target Price: SAR 62
 CMP: SAR 72, Target Price: SAR 62") Saudi Company for Hardware (SACO) CMP: SAR 72, Target Price: SAR 62 Raneem Seroor +973-17515000 (extn - 5096) rseroor@sicobank.com GCC Equities Consumer Goods Company Update 20 December 2018 Time to book
Saudi Company for Hardware (SACO) CMP: SAR 72, Target Price: SAR 62 Raneem Seroor +973-17515000 (extn - 5096) rseroor@sicobank.com GCC Equities Consumer Goods Company Update 20 December 2018 Time to book
Hapag-Lloyd AG Quarterly financial report. 1 January to 31 March 2018 Q1 I 2018
 Hapag-Lloyd AG Quarterly financial report 1 January to 31 March 2018 Q1 I 2018 SUMMARY OF HAPAG-LLOYD KEY FIGURES QUARTERLY FINANCIAL REPORT Q1 2018 1.1. 31.3. 2018 1.1. 31.3. 2017 Change absolute Key
RESULTS JANUARY JUNE 2010 ANALYSTS CONFERENCE CALL
 RESULTS JANUARY JUNE 2010 ANALYSTS CONFERENCE CALL 13 August 2010 1 DISCLAIMER The facts and information contained herein are as up to date as is reasonably possible and are subject to revision in the
Schaeffler AG 17 th GCC Kepler Cheuvreux. Jan 17, 2018 Frankfurt
 Schaeffler AG 17 th GCC Kepler Cheuvreux Jan 17, 2018 Frankfurt Disclaimer This presentation contains forward-looking statements. The words "anticipate", "assume", "believe", "estimate", "expect", "intend",
Eurozone Economic Watch. November 2017
 Eurozone Economic Watch November 2017 Eurozone: improved outlook, still subdued inflation Our MICA-BBVA model for growth estimates for the moment a quarterly GDP figure of around -0.7% in, after % QoQ
HAMBURGER HAFEN UND LOGISTIK AG COMMERZBANK SECTOR CONFERENCE
 HAMBURGER HAFEN UND LOGISTIK AG COMMERZBANK SECTOR CONFERENCE Frankfurt am Main, 1 September 2011 Hamburger Hafen und Logistik AG DISCLAIMER The facts and information contained herein are as up to date
Siemens Gamesa Renewable Energy Q Results
 Siemens Gamesa Renewable Energy Q2 208 Results 04 May 208 Disclaimer This material has been prepared by Siemens Gamesa Renewable Energy, and is disclosed solely for information purposes. This document
PACC Offshore Services Holdings Ltd. Results Presentation Q3 & 9M FY15 Results
 PACC Offshore Services Holdings Ltd. Results Presentation Q3 & 9M FY15 Results 1 Agenda 1. Financial Highlights 2. CAPEX plan & fleet optimisation programme 3. Updates 4. Q & A 2 Key Highlights Focus on
Algo Trading System RTM
 Year Return 2016 15,17% 2015 29,57% 2014 18,57% 2013 15,64% 2012 13,97% 2011 55,41% 2010 50,98% 2009 48,29% Algo Trading System RTM 89000 79000 69000 59000 49000 39000 29000 19000 9000 2-Jan-09 2-Jan-10
Garware Wall Ropes ACCUMULATE. Performance Highlights CMP. `550 Target Price `618. 2QFY2017 Result Update Textile. Investment Period 12 months
 2QFY217 Result Update Textile November 16, 216 Garware Wall Ropes Performance Highlights Quarterly Data (`cr) 2QFY17 2QFY16 % yoy 1QFY17 % qoq Revenue 232 214 8.5 225 3.3 EBITDA 4 26 5.9 31 29.4 Margin
Qatar National Bank (QNB)
") Feb-15 Mar-15 Apr-15 May-15 Jun-15 Jul-15 Aug-15 Sep-15 Oct-15 Nov-15 Dec-15 Jan-16 Feb-16 Global Research Investment Update Equity Qatar Banking Sector 15 February, 2016 (QNB) Market Data Bloomberg Code:
Feb-15 Mar-15 Apr-15 May-15 Jun-15 Jul-15 Aug-15 Sep-15 Oct-15 Nov-15 Dec-15 Jan-16 Feb-16 Global Research Investment Update Equity Qatar Banking Sector 15 February, 2016 (QNB) Market Data Bloomberg Code:
Portucel S.A. Assembleia Geral 21 de Maio de Results Presentation
 Portucel S.A. Assembleia Geral 21 de Maio de 2013 2015 Results Presentation Disclaimer This presentation does not constitute or form part of and should not be construed as any offer or invitation to sell
Financial Presentation 4Q / FY 2017 IFRS Results
 Financial Presentation 4Q / FY 217 IFRS Results March 1, 218 Disclaimer No representation or warranty (express or implied) is made as to, and no reliance should be placed on, the fairness, accuracy or
Financial Data Report ROGERS AND COMPANY LIMITED (THE GROUP) for the period ending 31.Dec.2017
 for the period ending 31.Dec.2017") Financial Data Report ROGERS AND COMPANY LIMITED (THE GROUP) for the period ending 31.Dec.2017 Equity Statistics Particulars Units 29-Dec-17 Current Market Price MUR 31.30 52 week H/L* MUR 33.00 / 27.00
Financial Data Report ROGERS AND COMPANY LIMITED (THE GROUP) for the period ending 31.Dec.2017 Equity Statistics Particulars Units 29-Dec-17 Current Market Price MUR 31.30 52 week H/L* MUR 33.00 / 27.00
Notice on Forward Looking Statements
 1 1 Notice on Forward Looking Statements This presentation contains certain forward-looking statements (as such term is defined in Section 21E of the Securities Exchange Act of 1934, as amended), which
Suzlon Energy Limited. Q1 FY16 Earnings Presentation
 Suzlon Energy Limited Q1 FY16 Earnings Presentation 31 st July 2015 Disclaimer This presentation and the accompanying slides (the Presentation ), which have been prepared by Suzlon Energy Limited (the
Scout24 AG Interim Results Q Conference Call November 11, 2015
 www.scout24.com Scout24 AG Interim Results Q3 2015 Conference Call November 11, 2015 Disclaimer This document has been issued by Scout24 AG (the Company and, together with its direct and indirect subsidiaries,
Schaeffler AG Results H Conference Call August 11, 2016 Herzogenaurach
 Conference Call August 11, 2016 Herzogenaurach Disclaimer This presentation contains forward-looking statements. The words "anticipate", "assume", "believe", "estimate", "expect", "intend", "may", "plan",
Siemens Gamesa Renewable Energy Q3 18 Results
 Siemens Gamesa Renewable Energy Q3 18 Results 27 July 2018 Disclaimer This material has been prepared by Siemens Gamesa Renewable Energy, and is disclosed solely for information purposes. This document