Annual Results November 2015
|
|
|
- Morris Jenkins
- 5 years ago
- Views:
Transcription

1 Annual Results 2015 November 2015

2 Forward looking statements We may make statements that are not historical facts and relate to analyses and other information based on forecasts of future results and estimates of amounts not yet determinable. These are forward-looking statements as defined in the U.S. Private Securities Litigation Reform Act of Words such as believe, anticipate, expect, intend, seek, will, plan, could, may, endeavour and project and similar expressions are intended to identify such forward-looking statements, but are not the exclusive means of identifying such statements. By their very nature, forward-looking statements involve inherent risks and uncertainties, both general and specific, and there are risks that predictions, forecasts, projections and other forward-looking statements will not be achieved. If one or more of these risks materialise, or should underlying assumptions prove incorrect, actual results may be very different from those anticipated. The factors that could cause our actual results to differ materially from the plans, objectives, expectations, estimates and intentions in such forward-looking statements are discussed in each year s annual report. Forward-looking statements apply only as of the date on which they are made, and we do not undertake other than in terms of the Listings Requirements of the JSE Limited, to update or revise any statement, whether as a result of new information, future events or otherwise. All income forecasts published in this report are unaudited. Investors are cautioned not to place undue reliance on any forward-looking statements contained herein.
3 Strategy
4 Strategy remains unchanged 4 Unlock further value from base business Accelerate African growth Active portfolio management, including possible divestitures Stringent cost management Working capital management Business process improvement» Buy better streamline procurement process» Make better operational excellence, safety and efficiency» Sell better margin expansion, customer portfolio management Invest to compete Growth through greenfield investment and acquisitions in metals, glass and plastics Growth at a reasonable and sustainable return Partner with major multinational customers Sensibly manage and grow presence in current jurisdictions» Building market base through exports» Diversifying manufacturing to other Nampak products» Building on existing hubs
5 Nampak s transitionary year 5 Portfolio rationalisation» successful sale of Corrugated, Tissue, Flexible, Recycling and Sacks divisions Business performance» decks cleared for a much improved performance» continued growth and strong performance of beverage can businesses» foreign currency liquidity issues in key markets impacted results Buy better» initial savings from Buy Better programme delivered Make better» operations excellence initiatives gaining solid traction new aluminium can lines ramped up in line with expectations spoilage at Bevcan Springs continues to improve glass issues fundamentally resolved and poised to deliver a strong performance in FY16 Sell better» successful conclusion of long-term agreements for Bevcan, Glass and DivFood Invest to compete» R2.2 billion capex invested
6 The Rest of Africa trading profit up 43% 6 RoA recorded sales of R4.7 billion in the Rest of Africa up from R3.3 billion in 2014, and recorded operating profit of R884 million on this revenue Results impacted by local currency depreciation and lack of liquidity, but businesses still very profitable Key market GDP growth rate estimates revised downwards and inflation increased Current challenges do not change the overall investment rationale in key markets The Rest of Africa an important market for Nampak» the Rest of Africa now contributes 49% to trading profit, up from 37% in 2014» operations expected to continue generating growth in revenue and profit supported by beverage market demand
7 FINAL INVESTMENT DECISION Our project pipeline 7 CONCEPT DEVELOPMENT FEASIBILITY PLANNING EXECUTION Angola Glass (Greenfield) Nigeria Glass (Greenfield) Ethiopia Glass (Greenfield) Rosslyn Bevcan Line 2 Nigeria Bevcan Line 2 Angola Line 1 Conversion Cape Town Line Conversion Bevcan New Ends Plant Plastic Consolidation DivFood Recapitalisation PERIOD TO COMMISSIONING 2 3 years months months 0 12 months

8 Results summary 8 Group revenue from continuing operations Revenue and trading profit from the rest of Africa 13% Rest of Africa now 49% of group trading profit, up from 37% in 2014 Net profit from continuing operations 2% HEPS from continuing operations 43% Trading profit from continuing operations 10% Group operating profit from continuing operations 9% Year-end dividend per share 92.0 cents 6%

9 Financial results
10 Group financial results for year-end 10 R million % Revenue Trading profit Abnormal items (loss)/profit (139) 186 Operating profit (9) Net finance costs (279) (308) 9 Share of (loss)/profit from assoc. (3) 33 Profit before tax (11) Tax benefit/(expense) 57 (142) Profit for the period from continuing operations Discontinued operations (395) (222) Profit for the year (12) HEPS continuing (6) Revenue up 13% Trading profit up 10%, despite disappointing first half performance from Glass Significant adverse change in abnormal items Revenue and trading profit from rest of Africa up 43%, now 49% of group Operating profit down 9%, impacted by abnormal items EBITDA of R2.5 billion, in line with prior year Effective tax rate of (4%) HEPS down 6%
11 Regional segmental Rest of Africa revenue and trading profit up 43% 11 REVENUE (R million) TRADING PROFIT (R million) TRADING MARGIN (%) 2015 % % South Africa (4) Rest of Africa United Kingdom (11) (19) Corporate 82 (35) 126 Group Modest revenue growth in South Africa with margins impacted by» higher than expected spoilage at Bevcan Springs» difficult start to year at Glass Strong performance in Rest of Africa, driven by Bevcan Angola and Bevcan Nigeria United Kingdom affected by margin pressures in milk industry Corporate services impacted by» decline in property rental income due to disposals» accounting impact of associates now fully consolidated
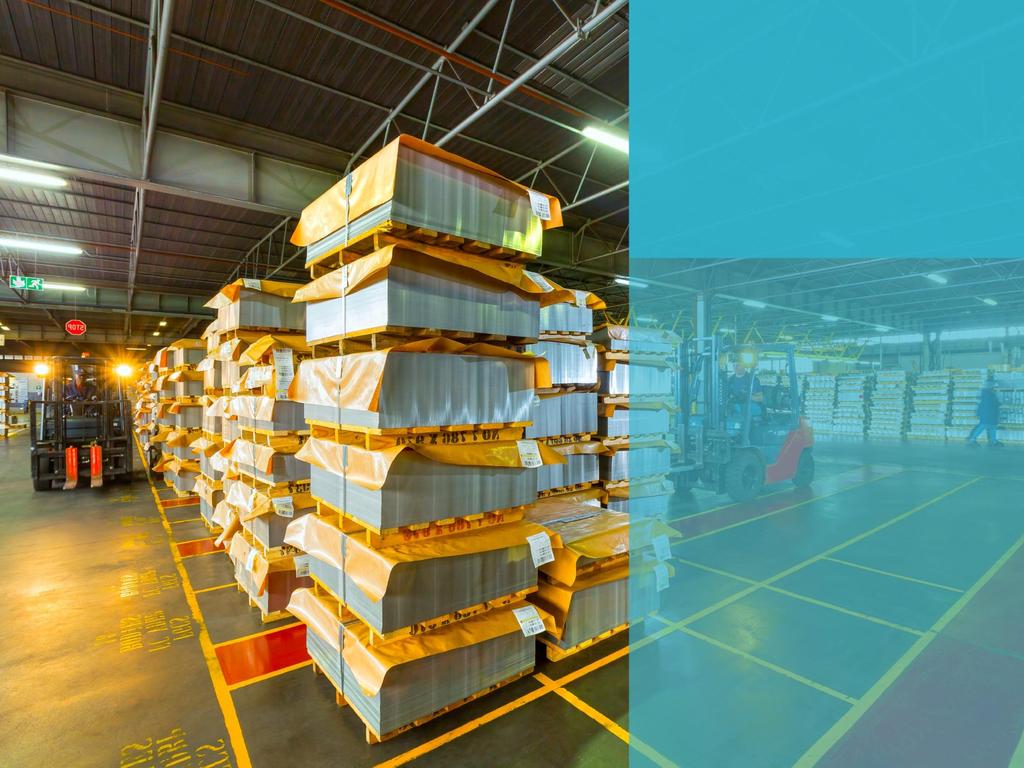
12 Segmental by substrate Trading profit from continuing operations up 10% 12 REVENUE (R million) TRADING PROFIT (R million) TRADING MARGIN (%) 2015 % % Metals Plastics Paper (10) Corporate Services 82 (35) 126 Group excl. Glass Glass 877 (11) 984 (76) (58) (48) (8.7) (4.9) Group incl. Glass Strong growth in metals revenue driven by Bevcan Nigeria and Angola Plastics benefited from aggressive cost-management initiatives Paper revenue growth boosted by consolidation of previously equity accounted associates Glass revenue down 11% due to capitalisation» R251 million in sales excluded» revenue up 15% without capitalisation impact
13 Translation of financial instruments impacts abnormal items 13 R million Trading profit Abnormal items (139) 186 (Loss)/gain on translation of financial instruments (141) 210 Net impairment losses (121) (37) Net gain on Nampak Zimbabwe restructure 124 Restructuring and retrenchment costs (103) (21) Net profit on disposal of land and buildings Other 10 Operating profit R351 million swing in valuation of financial instruments due to naira and kwanza devaluations against the US dollar Net impairment losses includes R85 million for Bevcan tinplate lines Net gain on Nampak Zimbabwe restructure offset by net impairment losses Restructuring and retrenchment costs compensated by disposals net profit of land and buildings
14 Foreign exchange impacts 14 CLOSING RATES AVERAGE RATES 2015 % % 2014 ZAR/USD (22.7) (13.6) ZAR/GBP (14.4) (5.8) Group trading results» impacted by naira and kwanza devaluation versus the US dollar Liquidity issues led to R141 million forex loss» benefited from translation of non-south African earnings at weaker rand Weaker rand impacts group equity» R775 million increase in foreign currency translation reserve Average exchange rates below year-end close in both years Weaker year-end rand to US dollar rate impacted translation of net long-term debt
15 Short term liquidity impacted by repayment of portion of long term debt 15 R million Property, plant and equipment Goodwill Other non-current assets Current assets Total assets Total equity Non-current liabilities Current liabilities Total equity and liabilities PPE increased in line with capex programme Current assets increased 10% 3% due to consolidation of previous associates Interest bearing debt offset by proceeds from disposals and cash from operations Rand weakness impacts translation of dollar portion of long-term debt Net debt to equity improves to 72% (2014: 73%) Net debt to EBITDA at 2.3 times (2014: 2.2 times) Total equity up 16% boosted by R775 million» increase in foreign currency translation reservation (FCTR)
16 Capital expenditure positions Nampak for the future 16 CAPEX SPEND 2011 TO 2015 R million Full-year 2015 capital expenditure of R2.2 billion, in line with guidance Expansion» Bevcan Angola warehouse and second line» Glass third furnace Replacement» Bevcan SA aluminium» DivFood production efficiency improvement Replacement capex well managed Full-year 2016 capital expenditure of R1.2 billion R1.5 billion R million on replacement R million on expansion Excludes possible greenfields Glass projects Expansion Replacement Cumulative

17 Operational review
18 Trading profit contribution from the Rest of Africa increases to 49% 18 REVENUE (%) South Africa Rest of Africa United Kingdom TRADING PROFIT (%) South Africa Rest of Africa United Kingdom Corporate Services
19 Revenue and trading profit contribution by substrate 19 REVENUE (%) Metals Glass Plastics Paper TRADING PROFIT (%) 20 0% Metals Plastics Paper Corporate Services %
20 Metals
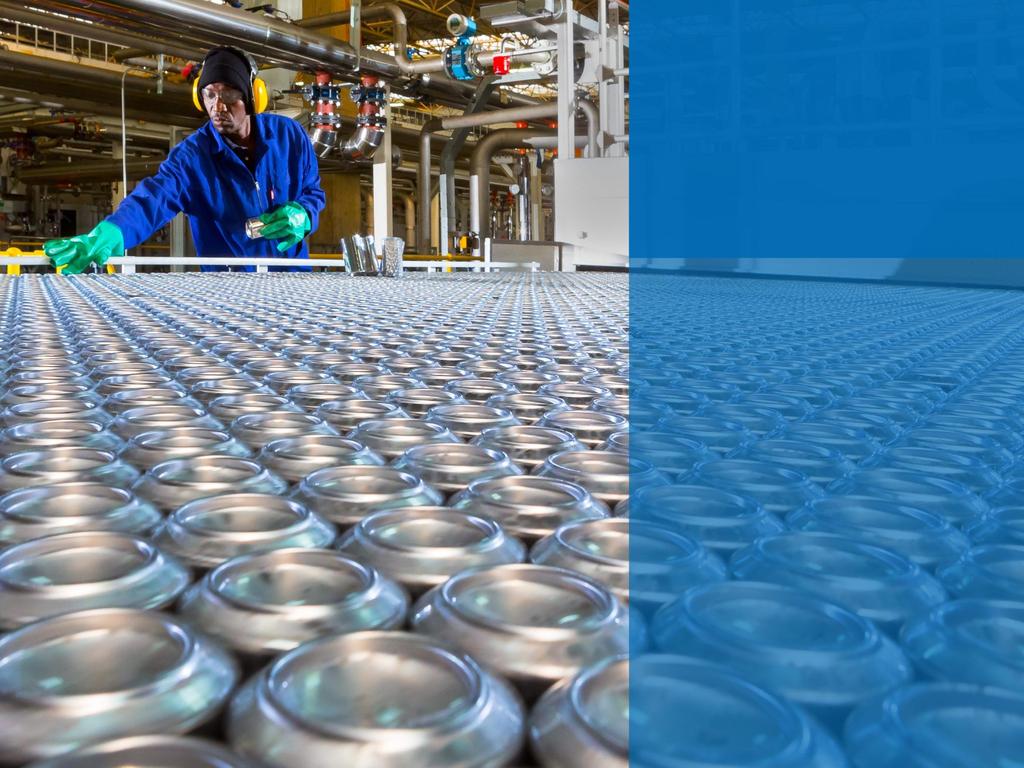
21 Metals Volume growth continues, spoilage improving 21 R million % Revenue Trading profit Margin (%) Revenue increase due to double digit beverage can volume growth and ramp-up of new lines Bevcan South Africa» Increased sales volumes in the local and export markets» Spoilage improving Bevcan Angola» Filled product import substitution and local beverage market growth benefits results Bevcan Nigeria» Growth from existing and new customers DivFood» Good fruit and vegetable demand, meat performed well» Initial improvement initiative benefits expected in 2016» Long-term supply agreements concluded with two major customers General Metal Packaging» Affected by lower demand, weak agricultural harvest and foreign exchange depreciation
22 Bevcan Nampak s strong position 22 Pack share low by international standards Double digit volume growth in SA will require the industry to invest in additional capacity Largest beverage can manufacturer in Africa provides local economies of scale Strong market position with in-depth knowledge of local market dynamics Well established footprint Proven track record trusted supplier Modern assets built at 25% weaker ZAR/USD than today Low-cost producer Long-term pricing based on notional most-efficient entrant
23 Plastics
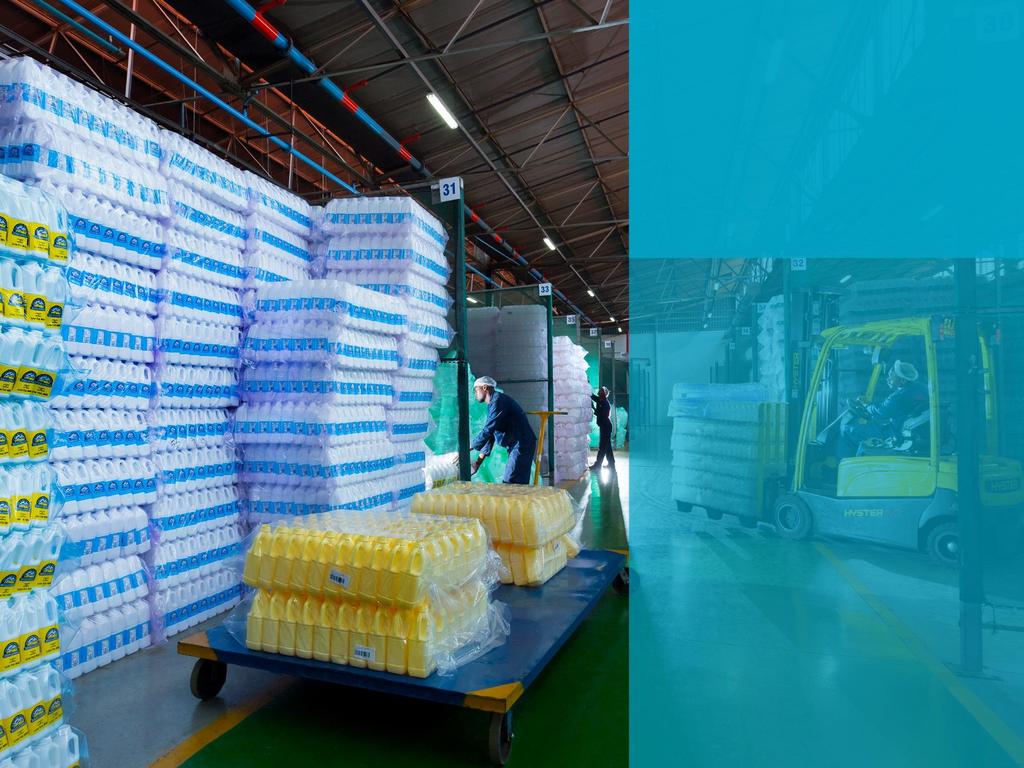
24 Plastics Challenging environment, benefits from cost savings and new opportunities 24 R million % Revenue Trading profit Margin (%) Improved performance driven by site consolidation, cost management and feedstock benefits Liquid Packaging:» Performance impacted by lost volumes» Drums made a profit Closures and tubes:» Growth in metal closures for the food and wine industry and bottled water/csd closures» Tubes volumes impacted by customer imports» Crates benefit from improved efficiencies and strong demand Zimbabwe CMB and Megapak» Meeting expectation Plastics UK» Lower sales volumes and sluggish milk consumption
25 Paper
26 Paper Margins holding up, recovering from first half low 26 R million % Revenue Trading profit (10) Margin (%) (36) Revenue benefiting from Hunyani consolidation and full acquisition of Bullpak Trading profit impacted by high inflation and Hunyani consolidation Nigeria Cartons» Weak first-half cigarette carton sales and currency losses impact results» Solid general FMCG packaging demand Zambia» Customer volumes recovering Malawi» Increase in sales volumes, but high inflation and exchange rate decline impacts overhead cost Bullpak» Flat demand for self-opening bag Hunyani» In line with 2014, benefiting from cost management actions

27 Glass
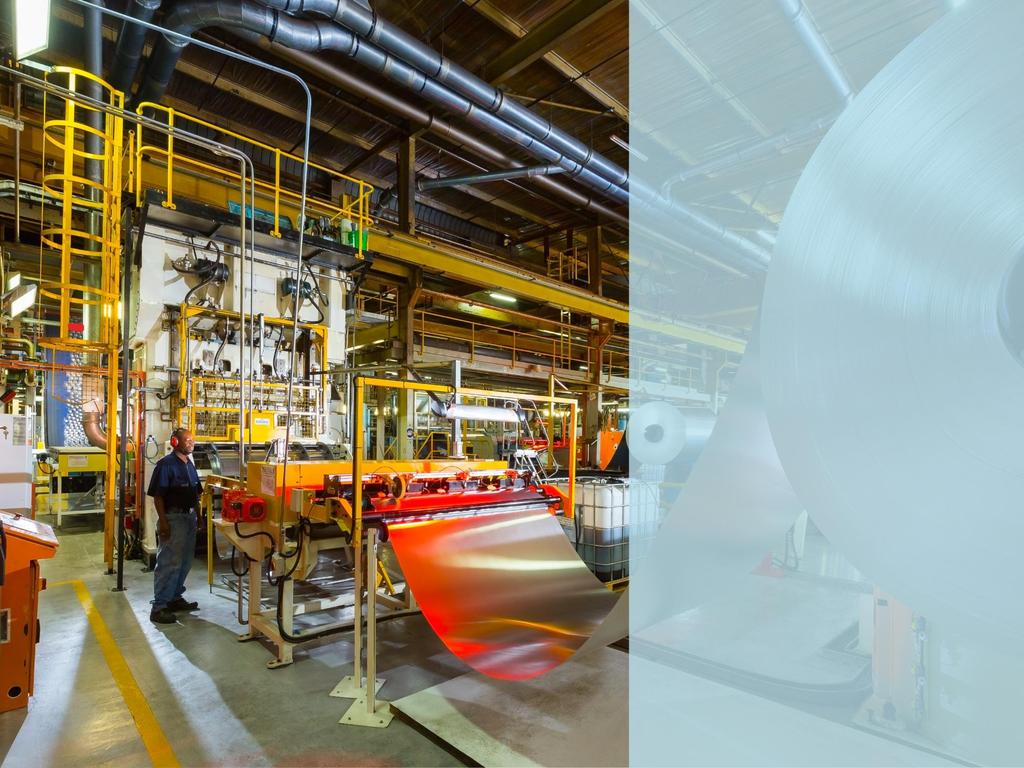
28 Glass Turning the corner on improved performance 28 R million % Revenue (11) Trading profit (76) (48) (58) Margin (%) (8.7) (4.9) (78) Sales volume growth following third furnace installation Challenging start to the year due to disappointing operating performance and late commissioning of Furnace 3 Interventions resolved issues Furnace 3 stabilised and operation performing at acceptable levels Operational efficiency targets met Returned to profitability in the latter months of the year Recovery limited by second half seasonal factors and stock building for the peak Product portfolio consolidation
29 Outlook 29 External macroeconomic headwinds in key markets expected to continue Positive earnings growth in the medium term:» continued volume growth in beverage cans» gains from improved performance of the Glass and Bevcan Springs operations» efficiency gains from business improvement initiatives at DivFood» Buy better initiative savings» Sell better SKU reduction in DivFood and Glass The Rest of Africa expected to continue generating growth in revenue and profit Nampak is well-positioned in key SSA markets to defend markets and leverage opportunities Future Targets CAPEX GLASS PTM GROUP MARGIN PROFIT FROM ROA R1.2 R1.5 billion per annum next two years 80% 85% starting % 12% average per annum >50%
30 Thank you
31 Countering the risks and challenges of doing business in Africa 31 Political and country risk» Countries in which Nampak does business have relatively lower political risk» In some countries in the Rest of Africa Nampak has been doing business for over 15 years Regulatory risk» Packaging industry rarely a target for government intervention» In most countries packaging industry seen as key to creating employment and skills transfer Fiscal and monetary risk» Nampak business predominantly done in local currency linked to the US dollar» Brewers import between 40% 80% of raw materials (Nigeria) Resources, raw materials and infrastructure availability» Plant location and self-sufficiency very important Payment risk» ~60% Nampak customers are multinational companies Liquidity and forex risk» Bevcan businesses dollar pricing» Nampak has good relationships with authorities» Manufacturing a key industry in most African countries
Nampak Overview March 2016
 Nampak Overview March 2016 Forward looking statements We may make statements that are not historical facts and relate to analyses and other information based on forecasts of future results and estimates
AUDITED GROUP RESULTS AND DIVIDEND DECLARATION. For the year ended 30 September 2015
 AUDITED GROUP RESULTS AND DIVIDEND DECLARATION For the year ended 30 September 2015 GROUP REVENUE FROM CONTINUING OPERATIONS UP 13% GROUP TRADING PROFIT FROM CONTINUING OPERATIONS UP 10%, IN SPITE OF A
Annual Results November 2016
 Annual Results 2016 November 2016 Forward looking statements We may make statements that are not historical facts and relate to analyses and other information based on forecasts of future results and estimates
Interim Results 2018
 Interim Results 2018 Forward looking statements We may make statements that are not historical facts and relate to analyses and other information based on forecasts of future results and estimates of amounts
2011 Annual Results. November 2011
 2011 Annual Results November 2011 1 Agenda Highlights Group results Operational review Strategic review 2 Highlights HEPS from continuing operations up 21% Dividend increased by 30% to 108 cents per share
First-half Results June 2016
 First-half Results 2016 June 2016 Forward looking statements We may make statements that are not historical facts and relate to analyses and other information based on forecasts of future results and estimates
UNAUDITED GROUP RESULTS AND DIVIDEND DECLARATION
 UNAUDITED GROUP RESULTS AND DIVIDEND DECLARATION For the half year ended 31 March 2015 GROUP REVENUE FROM CONTINUING OPERATIONS UP 16% GROUP OPERATING PROFIT FROM CONTINUING OPERATIONS DOWN 9%, FOLLOWING
VOLUNTARY TRADING UPDATE FOR THE FIVE MONTHS TO 28 FEBRUARY 2018
 SENS ANNOUNCEMENT - Nampak Limited (Incorporated in the Republic of South Africa) Registration Number: 1968/008070/06 Share Code: NPK ISIN: ZAE 000071676 ( Nampak or the "Group") VOLUNTARY TRADING UPDATE
2010 Annual Results. November 2010
 2010 Annual Results November 2010 1 Agenda Highlights Group results Operational review Strategic Update 2 Highlights Operating profit up 126% Trading margin improved from 5.8% to 8.3% Sale/closure of under-performers
Interim Results May 2006
 Interim Results May 2006 Agenda Group results Segmental performance Growth prospects Income Statement Rm 2006 2005 % Comments Revenue 7 845 7 910-1 + 4% ex Peters Papers Profit before abnormal items 798
Agenda. Salient features. Group financial results. Operational review. The way forward
 2009 Group Results Agenda Salient features Group financial results Operational review The way forward 2 Salient Features Turnover up 6% Volumes down 6% Trading income down 27% Cash from operations R2.2bn
Nampak 2012 Annual Results
 Nampak 2012 Annual Results November 2012 1 Highlights cents 250 Headline Earnings per Share continuing operations 200 150 142.3 172.4 200.8 100 73.9 50 0 2009 2010 2011 2012 2 Highlights Rm 1,800 1,600
Summarised consolidated financial results
 Summarised consolidated financial results For the six months ended 31 March 2018 Revenue increased to Trading profit increased to HEPS increased by R8.8 bn R1.2 bn 10% up by 2 % up by 7% to 132.0 cents
Nampak Limited Audited Group results and dividend declaration for the year ended 30 September 2013
 AUDITED GROUP RESULTS AND DIVIDEND DECLARATION FOR THE YEAR ENDED 30 SEPTEMBER 2013 Nampak Limited Audited Group results and dividend declaration for the year ended 30 September 2013 1 Highlights Trading
+13% Nampak enriches peoples lives every day through the provision of. HEPS from continuing operations. EPS from continuing operations +17%
 Interim report and dividend declaration for the six months ended 31 March 2012 Nampak enriches peoples lives every day through the provision of wine bottles flavoured alcoholic beverages tissue products
Nampak 2013 Interim Results
 Nampak 2013 Interim Results May 2013 1 Agenda Salient features Group results Operational review Strategic update Outlook 2 Salient Features Revenue up 7%, Africa up 19% Trading profit up 6% Profits from
Nampak 2013 Annual Results
 Nampak 2013 Annual Results November 2013 Summary of Results HEPS up 8% EPS up 13% Operating profit up 8% Africa trading profit up 60% Improvement in working capital management ROE 22% Dividend up 8% to
Interim Results May 2007
 Interim Results May 2007 Salient Features Volume growth in South Africa up 4% Revenue up 11% Costs well-controlled Trading income up 15% HEPS before fair value adjustment up 17% Income Statement Rm 2007
INTERIM REPORT and. cash DISTRIBUTION
 INTERIM REPORT and cash DISTRIBUTION FOR THE SIX MONTHS ENDED 31 MARCH 2008 nampak limited (Registration number 1968/008070/06) (Incorporated in the Republic of South Africa) Share code: NPK ISIN: ZAE
31/05/2017 SENS Article
 NAMPAK LIMITED Unaudited group results and ordin 30 May 2017 Close NPK 201705300042A Unaudited group results and ordinary dividend announcement for the half year ended 31 March 2017 Nampak Limited (Registration
AUDITED GROUP RESULTS FOR THE YEAR ENDED 30 SEPTEMBER 2007
 AUDITED GROUP RESULTS FOR THE YEAR ENDED 30 SEPTEMBER 2007 Revenue up 12% Trading income up 18% Headline earnings per share up 22% Cash distribution up 20% CONDENSED GROUP INCOME STATEMENT 2007 2006 Change
Summarised consolidated financial results
 Summarised consolidated financial results For the year ended 30 September 2017 Group revenue of Trading profit increased to R18.8 bn R2.0 bn HEPS increased by 15% to 123.8 cents per share down by 2 % up
Nampak Limited (Registration number 1968/008070/06) (Incorporated in the Republic of South Africa) Share code: NPK SIN: ZAE
 (Incorporated in the Republic of South Africa) Share code: NPK SIN: ZAE") Nampak Limited (Registration number 1968/008070/06) (Incorporated in the Republic of South Africa) Share code: NPK SIN: ZAE 000071676 Summarised consolidated financial results for the year ended 30 September
Nampak Limited (Registration number 1968/008070/06) (Incorporated in the Republic of South Africa) Share code: NPK SIN: ZAE 000071676 Summarised consolidated financial results for the year ended 30 September
For personal use only
 Orora Pro Forma Full Year Results Year Ended 30 June 2014 Nigel Garrard Managing Director and CEO Stuart Hutton Chief Financial Officer 25 August 2014 IMPORTANT PLEASE READ Effective 17 December 2013,
Annual Financial Results for the financial year ended 31 March 2018
 PRESENTATION JUNE 2018 Annual Financial Results for the financial year ended 31 March 2018 Contents EXECUTIVE OVERVIEW FINANCIAL REVIEW OPERATING REVIEW OUTLOOK PRESENTED BY: Neil Birch Chief Executive
Results for the Fourth Quarter ended 31 December 2017
 Results for the Fourth Quarter ended 31 December 2017 Athens, Greece, 25 April 2018 Frigoglass SAIC ( Frigoglass or we or the Group ) announces results for the quarter and full year ended 31 December 2017
Unaudited group results for the six months ended 31 March 2018
 Unaudited group results for the six months ended 31 March 2018 Index Listeria update Results overview Financial & operational performance Outlook & conclusion 2 Disclaimer Forward-looking statement This
Financial Results 2016
 Financial Results 2016 March 29 th, 2017 Website: www.dairibord.com Presentation Outline Operating Environment A Mandiwanza Performance Highlights Volumes and Revenue Review Financials M Ndoro Outlook
Results for the First Quarter ended 31 March 2018
 Results for the First Quarter ended 31 March 2018 Athens, Greece, 11 June 2018 Frigoglass SAIC ( Frigoglass or we or the Group ) announces unaudited results for the quarter ended 31 March 2018 First Quarter
Welcome to Nampak s Investor Day
 Welcome to Nampak s Investor Day Durban: 11 September 2013 1 Programme for the Day Beverage Cans and Glass - Charles Bromley Africa growth Rob Morris Nampak Flexible Clinton Farndell Aerosol investment
Tiger Brands Limited. Group Results Presentation. for the year ended 30 September 2015
 Tiger Brands Limited Group Results Presentation for the year ended 30 September 2015 2 Index Strategic review 3 Strategic review Peter Matlare Chief Executive Officer 4 Key strategic deliverables 1 Improve
Interim Results. Six months ended 31 August 2016
 Interim Results Six months ended 31 August 2016 Stefanutti Stocks City A multi-disciplinary construction group (Vision) (Mission) 2 www.stefanuttistocks.com y 2 Agenda Six month overview Operational Overview
Mpact Limited Annual Results. 31 December 2013
 Mpact Limited Annual Results 31 December 2013 2013 in context and financial highlights Operating review Financial review Strategy and outlook Appendices 2 2013 in context Muted GDP and consumer spending
TRELLIDOR HOLDINGS LIMITED UNAUDITED INTERIM RESULTS FOR THE SIX MONTHS ENDED 31 DECEMBER 2017
 TRELLIDOR HOLDINGS LIMITED UNAUDITED INTERIM RESULTS FOR THE SIX MONTHS ENDED 31 DECEMBER 2017 GROUP HIGHLIGHTS 5% Revenue 5% PAT 5% HEPS 35.2c 5% Interim dividend declared 11.0 cents per share Slide 2
TRELLIDOR HOLDINGS LIMITED AUDITED RESULTS FOR THE YEAR ENDED 30 JUNE 2016
 TRELLIDOR HOLDINGS LIMITED AUDITED RESULTS FOR THE YEAR ENDED 30 JUNE 2016 OVERVIEW Trellidor is the market leading manufacturer of custom made barrier security products Distribution through dedicated
The changing landscape of cement in sub-saharan Africa Written by: Ielhaam Ismail, Equity Analyst at Prudential Investment Managers
 FUNDS ON FRIDAY b y G l a c i e r R e s e a r c h 08 J u n e 2 0 1 8 V o l u m e 9 61 The changing landscape of cement in sub-saharan Africa Written by: Ielhaam Ismail, Equity Analyst at Prudential Investment
About this report. Scope and boundary of the report. Nampak s management structure. Nampak s reporting approach
 Integrated Annual Report 2011 About this report Nampak s management structure The Nampak group is managed according to raw material and product type in South Africa and according to geography in the rest
ADVANCED MANUFACTURING
 INTEGRATED REPORT 2017 ADVANCED MANUFACTURING Contents 1 About our report WHO WE ARE 2 This is Nampak 4 How we define value and the stakeholders who help us create it 5 Our operating context 6 How we performed
Results for the Third Quarter ended 30 September 2018
 Results for the Third Quarter ended 30 September 2018 Athens, Greece, 16 November 2018 Frigoglass SAIC ( Frigoglass or we or the Group ) announces results for the quarter and nine months ended 30 September
INTERIM RESULTS PRESENTATION
 INTERIM RESULTS PRESENTATION for the six months ended 31 March 2016 Agenda Strategic Update Financial Performance Divisional Performance Outlook and Imperatives 1 Strategic Update Phil Roux CEO 2 Environmental
GROUP RESULTS PRESENTATION For the year ended 30 September 2017
 GROUP RESULTS PRESENTATION For the year ended 30 September 2017 Index Overview Financial & operational performance Strategy update 2 Disclaimer Forward-looking statement This document contains forward
Capital Restructuring Update. 20 th of March 2017
 Capital Restructuring Update 20 th of March 2017 DISCLAIMER This presentation has been prepared by Frigoglass S.A.I.C. (the Company ) for informational purposes only. Neither the Company, its affiliates
NOVELIS Q3 FISCAL 2019 EARNINGS CONFERENCE CALL
 NOVELIS Q3 FISCAL 2019 EARNINGS CONFERENCE CALL February 5, 2019 Steve Fisher President and Chief Executive Officer Dev Ahuja Senior Vice President and Chief Financial Officer SAFE HARBOR STATEMENT Forward-looking
SABMiller plc. Full year results Twelve months ended 31 March Graham Mackay, Chief Executive Jamie Wilson, Chief Financial Officer.
 SABMiller plc Full year results Twelve months ended 31 March 2012 Graham Mackay, Chief Executive Jamie Wilson, Chief Financial Officer 24 May 2012 Forward looking statements This presentation includes
Amcor Half Year Results
 Amcor Half Year Results Investor Presentation Ron Delia Managing Director & CEO Michael Casamento CFO Disclaimer Forward looking statements This presentation contains forwardlooking statements that involve
ASX & MEDIA RELEASE (ASX: SGM, USOTC: SMSMY) 19 February 2016 SIMS METAL MANAGEMENT ANNOUNCES FISCAL 2016 HALF YEAR RESULTS
 19 February 2016 SIMS METAL MANAGEMENT ANNOUNCES FISCAL 2016 HALF YEAR RESULTS") ASX & MEDIA RELEASE (ASX: SGM, USOTC: SMSMY) 19 February 2016 Results at a glance SIMS METAL MANAGEMENT ANNOUNCES FISCAL 2016 HALF YEAR RESULTS STATUTORY (A$m) 1H FY16 1H FY15 Change % Sales revenue 2,412.2
ASX & MEDIA RELEASE (ASX: SGM, USOTC: SMSMY) 19 February 2016 Results at a glance SIMS METAL MANAGEMENT ANNOUNCES FISCAL 2016 HALF YEAR RESULTS STATUTORY (A$m) 1H FY16 1H FY15 Change % Sales revenue 2,412.2
Orora Investor Briefing. November 2013
 Orora Investor Briefing November 2013 Contents The demerger of Orora Limited About Orora Limited Strategic Direction of Orora Orora Leadership Board & Management Teams Summary Orora Ltd 2 The demerger
Group Results Presentation for the six months ended 31 March 2016
 Group Results Presentation for the six months ended 31 March 2016 Index Overview Financial performance Operational performance Outlook 2 Overview Noel Doyle Chief Operating Officer Disclaimer Forward-looking
DATATEC GROUP AUDITED PROVISIONAL RESULTS FOR THE YEAR ENDED 28 FEBRUARY 2018
 Technology Distribution Integration & Managed Services Consulting & Research AUDITED PROVISIONAL RESULTS FOR THE YEAR ENDED 28 FEBRUARY 2018 AGENDA Results summary, overview & strategic update Jens Montanana,
KAP INDUSTRIAL HOLDINGS LIMITED (KAP) UNAUDITED INTERIM RESULTS FOR THE SIX MONTHS ENDED 31 DECEMBER 2017
 UNAUDITED INTERIM RESULTS FOR THE SIX MONTHS ENDED 31 DECEMBER 2017") KAP INDUSTRIAL HOLDINGS LIMITED (KAP) UNAUDITED INTERIM RESULTS FOR THE SIX MONTHS ENDED 31 DECEMBER 2017 WELCOME JAAP DU TOIT CHAIRMAN AGENDA WELCOME UNAUDITED INTERIM RESULTS FOR THE SIX STRATEGY MONTHS
KAP INDUSTRIAL HOLDINGS LIMITED (KAP) UNAUDITED INTERIM RESULTS FOR THE SIX MONTHS ENDED 31 DECEMBER 2017 WELCOME JAAP DU TOIT CHAIRMAN AGENDA WELCOME UNAUDITED INTERIM RESULTS FOR THE SIX STRATEGY MONTHS
Stock Symbol: TSX CCL.A and CCL.B. CCL Industries Reports a 25% Increase in Third Quarter 2012 Net Earnings and Declares Dividend Results Summary
 CCL Industries Inc. 105 Gordon Baker Road, Suite 500, Toronto, Ontario M2H 3P8 Telephone: (416) 756-8500 Fax: (416) 756-8555 News Release Stock Symbol: TSX CCL.A and CCL.B For Immediate Release Tuesday,
Ontex Q3 2018: Further progress in challenging environment
 Ontex Q3 2018: Further progress in challenging environment Q3 LFL revenue ex Brazil +3%, outperforming flat hygiene markets Continuous focus on value: price/mix +2.9% Important milestones achieved in Brazil
Unaudited results for the 6 months ended 30 September H Investor Booklet November 2016
 H1 2017 Investor Booklet November 2016 Agenda Overview of Results Financial Review Outlook 2 Overview In the F2016 results presentation (14 July 2016) we said: Dawn board had approved a plan to stop losses
Nampak (NPKJ.J) Share fully priced with growth dependent on Africa CREDIT SUISSE SECURITIES RESEARCH & ANALYTICS
 Share fully priced with growth dependent on Africa CREDIT SUISSE SECURITIES RESEARCH & ANALYTICS") EEMEA/South Africa Equity Research Containers & Packaging Rating UNDERPERFORM* Price (27 Jun 12, R) 25.50 Target price (R) 23.00¹ Market cap. (R m) 15,070.55 Enterprise value (R m) 16,798.2 *Stock ratings
EEMEA/South Africa Equity Research Containers & Packaging Rating UNDERPERFORM* Price (27 Jun 12, R) 25.50 Target price (R) 23.00¹ Market cap. (R m) 15,070.55 Enterprise value (R m) 16,798.2 *Stock ratings
Logista FY 2016 Results. November 8, 2016
 Logista FY 2016 Results November 8, 2016 Logista reports FY 2016 Results Logista announces today its FY Results for 2016. Main highlights: Revenues growing by 1.7% Economic Sales 1 up by 2.8% Adjusted
Results Presentation for the year ended 30 June 2012
 Results Presentation for the year ended 30 June 2012 Agenda Financial highlights Year at a glance Group at a glance Operational reviews Financial review Industrial Cable Suppliers Strategy and outlook
Cement s Changing Landscape ARTICLE SUMMARY
 PRUDENTIAL INSIGHTS Ielhaam Ismail Equity Analyst JUNE 2018 Cement s Changing Landscape ARTICLE SUMMARY One of the industries most likely to benefit from Africa s growing economies and infrastructure expansion
Horizon Global First Quarter 2016 Earnings Presentation
 Horizon Global First Quarter 2016 Earnings Presentation May 3, 2016 1 Safe Harbor Statement Forward-Looking Statements This presentation may contain "forward-looking statements" as defined in the Private
Nampak Annual Report 2003
 Nampak Annual Report 2003 Nampak Limited, PO Box 784324 Sandton 2146, South Africa Nampak Annual Report 2003 It s all part of the package! Nampak contents Packaging solutions 2 Global growth 4 Income statements
FY2019 Interim results presentation
 EXPLORE OUR WORLD Established 1975 I Listed JSE limited 1987 ADCORP IS A WORKPLACE SOLUTIONS COMPANY Presented by Innocent Dutiro Chief Executive Officer Cheryl Jane CJ Kujenga Chief Financial Officer
Barloworld Limited. Reviewed interim results to 31 March May 15, 2006
 Barloworld Limited Reviewed interim results to 31 March 2006 May 15, 2006 BARLOWORLD IS A DIVERSIFIED INDUSTRIAL COMPANY Over 26 000 people in 31 countries Barloworld s way of doing business - market-leading
qualities INNOVATIVE DIVERSE RESPONSIVE FLEXIBLE PROACTIVE
 qualities INNOVATIVE DIVERSE RESPONSIVE FLEXIBLE PROACTIVE 1 Nampak Limited Profile 2 Goals 2 Values 3 Financial Summary 5 The Group at a Glance 8Group Structure 9 Chairman s Statement 16 Group Managing
ArcelorMittal South Africa Achieving profit in a challenging market. Nonkululeko Nyembezi-Heita, CEO 31 May 2013
 ArcelorMittal South Africa Achieving profit in a challenging market Nonkululeko Nyembezi-Heita, CEO 31 May 2013 Disclaimer Forward-Looking Statements This presentation may contain forward-looking information
For personal use only
 A S X A N N O U N C E M E N T DATE: 24 August 2016 FY2016 RESULTS PRESENTATION Attached is the Presentation regarding Pact s Financial Results for the year ended 30 June 2016. The Presentation will occur
Period overview Operational Overview Financial Results Conclusion
 Interim Results Six months ended 31 ust 2015 Bridging y expectations Agenda Period overview Operational Overview Financial Results Conclusion Bridging y expectations 2 1 Six month overview Satisfactory
ANNUAL RESULTS PRESENTATION. for the year ended 30 September 2016
 ANNUAL RESULTS PRESENTATION for the year ended 30 September 2016 What a year!! Salient Features: Massive discontinuities Drought Rand volatility Wheat duty So Portfolio and brand strength matters (size
Results for the Third Quarter ended 30 September 2017
 Results for the Third Quarter ended 30 September 2017 Athens, Greece, 24 November 2017 Frigoglass SAIC ( Frigoglass or we or the Group ) announces results for the quarter and nine months ended 30 September
Group finance director s report
 Group finance director s report Revenue increased by 9,2% on subscriber growth of 28% to 116 million users... Had there been no change in currency rates during the year, revenue growth would have been
2017 M ACQUA RIE AUS T R A LI A CONF ERENCE
 2017 M ACQUA RIE AUS T R A LI A CONF ERENCE Malcolm Bundey Managing Director and CEO 3 May 2017 1 IMPORTANT INFORMATION This Presentation contains the summary information about the current activities of
MONDI GROUP RESULTS FOR THE YEAR ENDED 31 DECEMBER February 2011
 MONDI GROUP RESULTS FOR THE YEAR ENDED 31 DECEMBER 21 February 2011 Agenda Highlights Financial overview Operational review Summary Appendices Page 2 Key financial highlights Earnings significantly up
Half-Year 2017 Results. 20 February 2017
 Half-Year 2017 Results 20 February 2017 Overview & Results Highlights Tom Gorman Key messages Sales revenue growth of 5% at constant currency, reflecting growth in every operating segment despite some
Axalta Coating Systems Ltd.
 Q1 2015 Conference Call May 6, 2015 Notice Regarding Forward Looking Statements, Non-GAAP Financial Measures and Defined Terms Forward-Looking Statements This presentation and the oral remarks made in
Briefing Booklet additional financials. For the year ended 31 March 2016
 Briefing Booklet additional financials For the year ended 31 March 2016 Important information This presentation contains forward-looking statements as defined in the United States Private Securities Litigation
Investor Presentation Second Quarter and First Half 2012 Financial Results
 What we do Ice-Cold Merchandisers xxx Investor Presentation Second Quarter and First Half 2012 Financial Results Glass Operations xxx Disclaimer This presentation contains forward-looking statements which
PRE CLOSED PERIOD INVESTOR LUNCH 12 th and 13 th of June 2017
 PRE CLOSED PERIOD INVESTOR LUNCH 12 th and 13 th of June 2017 OVERVIEW ASCENDIS HEALTH AT A GLANCE (31 st of Dec 2016) H1 2017 Big part of European $/ business going into high growth emerging markets Health
SABMiller plc. Full year results Twelve months ended 31 March Jamie Wilson, Chief Financial Officer Gary Leibowitz, SVP, Investor Relations
 SABMiller plc Full year results Twelve months ended 31 March 2012 Jamie Wilson, Chief Financial Officer Gary Leibowitz, SVP, Investor Relations 24 May 2012 Forward looking statements This presentation
REPORT TO STAKEHOLDERS
 REPORT TO STAKEHOLDERS FOR THE YEAR ENDED 30 JUNE 2011 RECOVERY & GROWTH MEDUPI POWER STATION 2 Salient points FY2011 Summarised financial results Hot topics Group financials Purpose, values and vision
BV 2020 Financial. Roadmap
 BV 2020 Financial Roadmap Improving trends YTD 2017 Nine months organic revenue +1.6% trending higher in Q3 Strong organic growth momentum of Growth Initiatives +7.1% y/y External growth +2.7% with 9 acquisitions
SECOND QUARTER 2018 EARNINGS CONFERENCE CALL JUNE 7, 2018
 SECOND QUARTER 2018 EARNINGS CONFERENCE CALL JUNE 7, 2018 Safe harbor FORWARD-LOOKING STATEMENTS This presentation contains certain forward-looking information within the meaning of the Private Securities
Novelis Q4 and Fiscal Year 2016 Earnings Conference Call
 Novelis Q4 and Fiscal Year 2016 Earnings Conference Call May 10, 2016 Steve Fisher President and Chief Executive Officer Steve Pohl Vice President and Interim Chief Financial Officer 1 Safe Harbor Statement
UNAUDITED INTERIM RESULTS FOR THE HALF-YEAR ENDED 30 JUNE 2011
 UNAUDITED INTERIM RESULTS FOR THE HALF-YEAR ENDED 30 JUNE 2011 Agenda Introduction Financial Review Operational Review Strategic Review and Objectives Prospects 2 Introduction - Operating Environment External
Barloworld Limited. Audited results for the year ended 30 September 2003
 Barloworld Limited Audited results for the year ended 30 September 2003 Barloworld is an international industrial brand management company 23 000 people... in 32 countries providing business solutions
2017 FULL YEAR RESULTS
 2017 FULL YEAR RESULTS ESTABLISHING LEADING POSITIONS IN NEW GROWTH SECTORS Malcolm Bundey Managing Director and CEO Richard Betts Chief Financial Officer 16 August 2017 Pact Group Holdings Ltd ABN: 55
NETCARE LIMITED UNAUDITED INTERIM GROUP RESULTS FOR THE SIX MONTHS ENDED 31 MARCH 2016 CARE DIGNITY TRUTH PARTICIPATION PASSION
 NETCARE LIMITED UNAUDITED INTERIM GROUP RESULTS FOR THE SIX MONTHS ENDED 31 MARCH 2016 Group Overview South Africa United Kingdom Financial Review Guidance GROUP OVERVIEW 4 Group A comprehensive network
A X A L T A C O A T I N G S Y S T E M S. Q FINANCIAL RESULTS July 26, 2016
 A X A L T A C O A T I N G S Y S T E M S Q2 2016 FINANCIAL RESULTS July 26, 2016 Legal Notices Forward-Looking Statements This presentation and the oral remarks made in connection herewith may contain forward-looking
Brambles reports results for the half-year ended 31 December 2017
 Brambles Limited ABN 89 118 896 021 Level 10, 123 Pitt Street Sydney NSW 2000 Australia GPO Box 4173 Sydney NSW 2001 Tel +61 2 9256 5222 Fax +61 2 9256 5299 www.brambles.com 19 February 2018 The Manager
SIX MONTHS ENDED 30 SEPTEMBER 2018
 PRESENTATION TUESDAY, 20 NOVEMBER 2018 SIX MONTHS ENDED 30 SEPTEMBER 2018 CONTENTS PRESENTED BY Neil Birch Chief Executive Officer Harry Todd Chief Financial Officer 2 EXECUTIVE OVERVIEW 3 RESULTS SUMMARY
AUDITED RESULTS FOR THE YEAR ENDED 31 DECEMBER 2015
 AUDITED RESULTS FOR THE YEAR ENDED 31 DECEMBER 2015 AGENDA 2 1 Opening remarks / market update Richard 2 Financial results David 3 Operational review Richard 4 Strategy update Richard 5 Outlook Richard
Fiscal 2019 First Quarter Results. December 20, 2018
 Fiscal 2019 First Quarter Results December 20, 2018 Safe harbor and non-gaap Cautionary Note Regarding Forward-Looking Statements: All statements in these materials and the related presentation that are
Standard Bank Group financial results presentation for the year ended 31 December 2015
 Standard Bank Group financial results presentation for the year ended 31 December 215 standardbank.com Financial results presentation Standard Bank Group 215 Macroeconomic environment 17 16 15 14 13 12
A X A L T A C O A T I N G S Y S T E M S Q4 & FULL YEAR 2015 FINANCIAL RESULTS FEBRUARY 10, 2016
 A X A L T A C O A T I N G S Y S T E M S Q4 & FULL YEAR 2015 FINANCIAL RESULTS FEBRUARY 10, 2016 Legal Notices Forward-Looking Statements This presentation and the oral remarks made in connection herewith
MTN Group Limited Results presentation for the six months ended 30 June 2017
 MTN Group Limited Results presentation for the six months ended 30 June 2017 Disclaimer The information contained in this document has not been verified independently. No representation or warranty express
Investor Presentation First Half 2011 Financial Results 6 th Annual Greek Roadshow September 8&9, London
 www.frigoglass.com Investor Presentation First Half 2011 Financial Results 6 th Annual Greek Roadshow September 8&9, London www.frigoglass.com 2 What we do Ice-Cold Merchandisers First Half 2011: Sales
ANNUAL RESULTS PRESENTATION
 ANNUAL RESULTS PRESENTATION FOR THE YEAR ENDED 30 SEPTEMBER 2016 CONTENTS 2 Annual Results Presentation 8 Financial Performance 19 Divisional Performance 19 Essential Foods 26 Groceries 35 International
February 21, Conduent Q4 & FY 2017 Earnings Results
 February 21, 2018 Conduent Q4 & FY 2017 Earnings Results Cautionary Statements Forward-Looking Statements This report contains forward-looking statements that involve risks and uncertainties. These statements
CEVA Holdings LLC Investor Call First quarter May 2017
 CEVA Holdings LLC Investor Call First quarter 2017 3 May 2017 1Executive Summary Good growth with revenue up 5% YoY in constant currency, both in Freight Management and Contract Logistics Continued profitability
A S X A N N O U N C E M E N T
 A S X A N N O U N C E M E N T DATE: 24 February 2016 Attached is the Presentation regarding Pact s Half year Financial Results for the half year ended 31 December 2015. The Presentation will occur at 10am
MYERS INDUSTRIES, INC. MARCH 9, 2017 FOURTH QUARTER & FULL YEAR EARNINGS PRESENTATION
 MYERS INDUSTRIES, INC. MARCH 9, 2017 FOURTH QUARTER & FULL YEAR EARNINGS PRESENTATION SAFE HARBOR STATEMENT Statements in this presentation concerning the Company s goals, strategies, and expectations
2011 FINAL RESULTS PRESENTATION
 2011 FINAL RESULTS PRESENTATION FEBRUARY 2012 1 Agenda 1 Market Conditions 2011 2 Financial Review 3 Operational Review 4 Key Strategic Priorities 5 Outlook for 2012 and Beyond 2 MARKET CONDITIONS 2011
Canadian Equipment Rentals Corp. Announces 2016 Year End Results
 Canadian Equipment Rentals Corp. Announces Year End Results CALGARY, ALBERTA April 25, 2017: Canadian Equipment Rentals Corp. (the "Company") (TSX VENTURE: CFL) today announced its financial and operating