TRELLIDOR HOLDINGS LIMITED UNAUDITED INTERIM RESULTS FOR THE SIX MONTHS ENDED 31 DECEMBER 2017
|
|
|
- Bethanie Barber
- 5 years ago
- Views:
Transcription


1 TRELLIDOR HOLDINGS LIMITED UNAUDITED INTERIM RESULTS FOR THE SIX MONTHS ENDED 31 DECEMBER 2017
2 GROUP HIGHLIGHTS 5% Revenue 5% PAT 5% HEPS 35.2c 5% Interim dividend declared 11.0 cents per share Slide 2
3 GROUP GROWTH STRATEGIES Acquisitive growth Further acquisitions targeted from mid to late FY2019 Diversified product offering Aluminium Retractable version launched Sept 2017 LPCB level 3 certified product developed for UK market Strong growth in the Trellidor Security Shutter in the period International growth focus on Africa Africa slowly improving economy on back of better commodity prices Strong demand from UK commencing December major projects Geographic expansion of Taylor focus on synergies Product set introduced to the Trellidor franchise network where appropriate Strategy working and should escalate going forward Foundation in place now to build Slide 3
4 GROUP OVERVIEW Trellidor Group consists of Trellidor and Taylor Trellidor Trellidor is the market leading manufacturer of custom-made barrier security products Distribution through dedicated and skilled owner operated franchises in South Africa and throughout Africa Further representation in Israel, UK, parts of Europe Products manufactured at the Group s modern facility in Durban, supported by assembly shops in parts of Africa including the Group s subsidiary in Ghana Slide 4
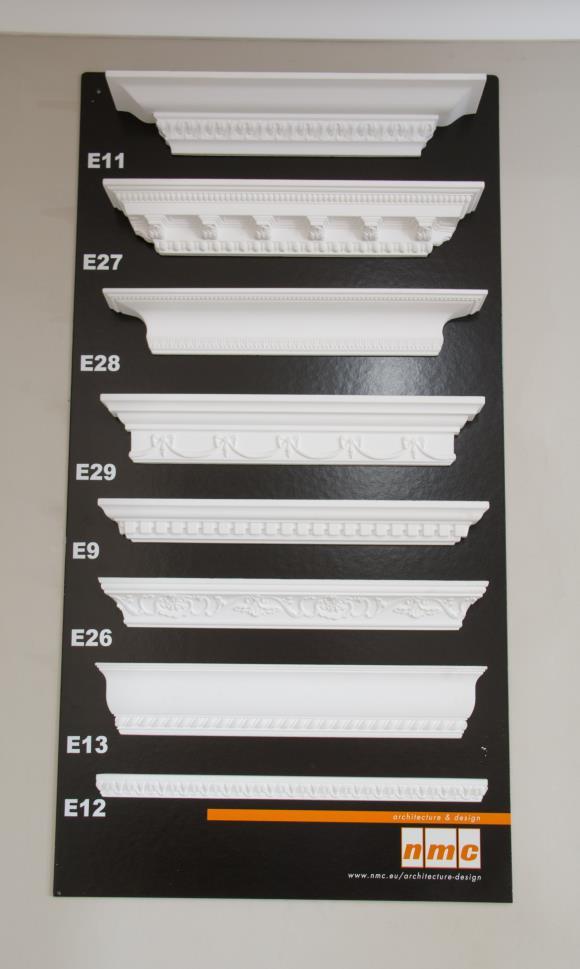
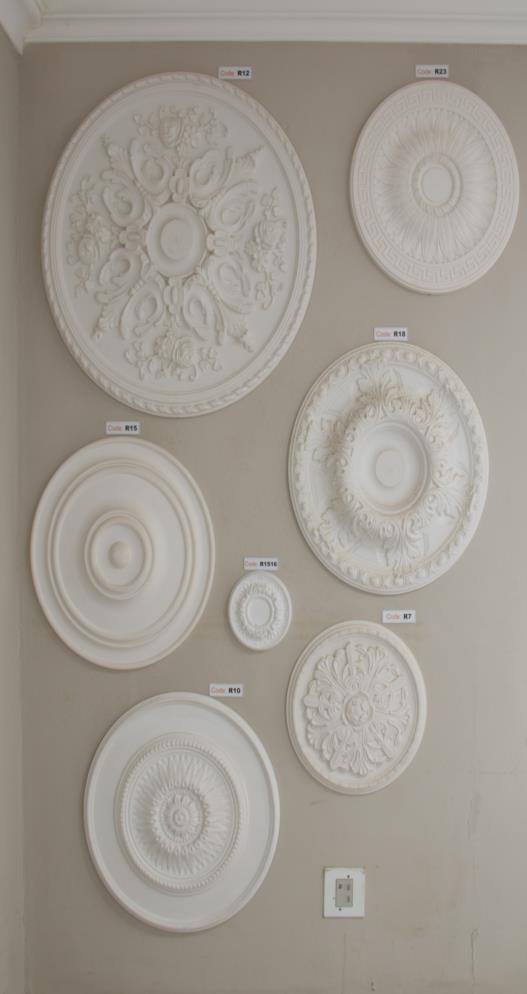
5 GROUP OVERVIEW Taylor Taylor is a major manufacturer and distributor of a range of custom-made blinds, and a range of decorative and security shutters Strong distribution in Western and Southern Cape A limited presence in Gauteng, the rest of South Africa and Africa Products are manufactured at the factory in Cape Town NMC division distributes imported decorative mouldings out of branches in Johannesburg, Durban and Cape Town The sellers achieved their earnings target. A final payment of R30m was made in cash during July A forward PE of 5.3x was achieved Slide 5


6 NEW PRODUCT TA600 and LPCB SR3 Substantive in-house developed product Slide 6


7 Slide 7
8 GROUP FINANCIAL OVERVIEW Slide 8
9 GROUP FINANCIAL PERFORMANCE Group financial performance (R'm) FY 16 HY 17 FY 17 HY 18 HY 18 vs HY 17 Revenue 313,4 282,8 525,4 297,4 5% Gross Profit 157,3 136,0 250,5 137,2 1% Core EBITDA 83,2 67,4 119,1 65,0-4% EBITDA 81,5 63,5 113,9 65,0 2% Profit after tax 54,2 37,4 66,0 39,1 5% Dividends paid 20,0 17,1 28,5 21,1 23% EPS (cents) 50,8 33,5 59,3 35,2 5% HEPS (cents) 50,3 33,5 59,2 35,2 5% Core HEPS (cents) 51,9 38,0 * 66,0 36,7-3% Gross Margin 50,2% 48,1% 47,7% 46,1% EBITDA Margin 26,0% 22,5% 21,7% 21,8% Weighted avg shares in issue (millions) 105,6 108,3 108,3 108,1 * Restated See note 5 Interim Results Slide 9

10 GROUP FINANCIAL PERFORMANCE Tough trading conditions continued to prevail throughout the period for the Trellidor Group Revenue Improved trading in agricultural and mining areas but weaker trading prevailed in urban areas, particularly in Gauteng Slide 10

11 GROUP FINANCIAL PERFORMANCE Sales volumes marginally down on comparative prior period c.2% Core EBITDA Input costs increased in excess of product price increases, squeezing margins H1 Forex losses of R1.3m in December due to stronger Rand, however will have a positive impact on input costs in H2 and F2019 Slide 11
12 GROUP FINANCIAL PERFORMANCE Core Headline Earnings (R'm) FY 16 HY 17 FY 17 HY 18 HY 18 vs HY 17 Profit attributable to ordinary shareholders 53,7 36,3 64,3 38,1 5% Adjusted for: Profit on disposal of property, plant and equipment (0,5) 0,0 (0,1) 0,0 Headline earnings 53,2 36,3 64,2 38,1 5% Adjusted for: Amortisation of customer database - Taylor - 2,4 4,9 2,4 Acquisition costs - Taylor - 2,5 2,5 - Fair value adjustment on contingent - 1,5 2,7 - consideration - Taylor Listing costs 1, Non-controlling interests - (0,4) (0,6) (0,1) Tax effect thereon - (1,1) (2,1) (0,7) Core Headline earnings 54,8 41,2 71,5 39,7-4% Weighted average number of ordinary shares 105,6 108,3 108,3 108,1 Earnings per share (cents) 50,8 33,5 59,3 35,2 5% Headline earnings per share (cents) 50,3 33,5 59,2 35,2 5% Core headline earnings per share (cents) 51,9 38,0 66,0 36,7-3% Core EBITDA adjustments Core headline earnings per share 36.7c Slide 12

13 GROUP BALANCE SHEET Debt/EBITDA ratio 0.8x Debt servicing of R15m Gearing ratio is 47% down from 55% at year end June nd tranche Taylor of R30m paid in July 2017 Ratios FY 16 HY 17 FY 17 HY 18 Debt/Equity 18% 70% 55% 47% Interest Cover 32.9x 8.8x 8.4x 11.7x Debt/EBITDA 0.3x 1.2x 1.2x 0.8x Interest bearing debt reduced by R10m Slide 13
14 GROUP NET WORKING CAPITAL Seasonal reduction in trade and other payables Stock increased on prior year with increased goods in transit and increased product lines Net investment in working capital R'm FY ,3 HY ,8 FY ,2 HY ,2 FY ,6 HY ,6 Future working capital investment in line with sales growth Slide 14
15 SEGMENTS Slide 15

16 SALES ANALYSIS - TRELLIDOR DIVISION H1 revenue in South Africa grew by c.9% driven mainly by outlying areas growth of c.12% African economies reliant on oil - remain weak, mainly Nigeria, Angola Africa sales growth of c.7% reflects tough trading in H1 Geographical Presence FY 2017 HY 2018 Main centres (DBN, CPT, GP) 39% 37% Outlying regions (RSA) 45% 45% Africa 15% 17% International (UK, Israel) 1% 1% Recovery in outlying areas Slide 16

17 SALES ANALYSIS - TRELLIDOR DIVISION New product sales grew by c.34% Diversified product range spans income groups which mitigates weak middle and upper class economy Product Type FY 2017 HY 2018 Traditional Trellidor 73% 68% Clear Guard 14% 12% Rollerstyle 5% 6% Polycarbonate Bar 2% 2% Security Shutter 6% 12% New product sales now 32% of revenue Slide 17

18 TRADING MARGIN - TRELLIDOR DIVISION Reduced trading margin due to input price pressure and changing sales mix. Should improve in H2 Cost of sales costs as % of net sales Labour utilisation good in a weak demand environment New wage increment agreement signed in September 2017 sees lower increment rates than before. Average of c.8% vs c.11% Materials costs will improve in H2 - stronger Rand Steel prices up by 13% on H Aluminium prices up by 9% on H Highly profitable sustainable trading margin Slide 18

19 SALES ANALYSIS TAYLOR DIVISION Concentration of sales in the Western and Southern Cape Geographical presence Branch in Johannesburg Geographic growth opportunity using proven Trellidor model now at c.3% of sales Tough trading conditions revenue up c.2% with volumes down c.2% Geographic expansion opportunity remains Slide 19

20 SALES ANALYSIS TAYLOR DIVISION Turnover well spread by product Constant innovation and development to keep up with trends Product type Strong growth in aluminium shutters in a competitive market Good growth in Roller Blinds and PVC Shutters driven by product enhancements in the year Custom designed and manufactured Weak performance from NMC Mouldings division particularly in Gauteng Well spread product range focus on Lifestyle product set Slide 20


21 TRADING MARGIN TAYLOR DIVISION Cost of sales costs as % of net sales Stronger Rand will benefit input costs in H2 and FY2019 Gross profit margins down due to increased input costs. Selling prices adjusted mid H2 Efficient factory with significant spare capacity. Margins under pressure but plans in place to rectify Slide 21
22 GROUP SUMMARISED CASH FLOW Group summarised cash flow (R'm) FY 2016 HY 2017 FY 2017 HY 2018 EBITDA 81,5 63,5 113,9 65,0 Movement in non cash items (incl provisions) (5,9) 2,1 4,2 0,9 Net working capital movement (3,3) (20,2) (13,4) (18,8) Inventory (9,4) (3,9) (23,1) (1,0) Accounts receivable (3,7) 5,0 3,4 1,0 Accounts payable 9,8 (21,3) 6,3 (18,9) Cash generated from operations 72,3 45,4 104,7 47,1 Tax paid (21,1) (16,1) (33,2) (18,7) Net cash from operations (excl finance costs) 51,2 29,3 71,5 28,4 Net investment in PPE (7,5) (5,9) (8,0) (7,9) FCF 43,7 23,4 63,5 20,5 Net interest costs 0,5 (5,0) (9,1) (4,2) Acquisition of subsidiary - (123,1) (124,0) (30,0) Repayment/raising of debt & equity 49,8 73,5 63,9 (10,0) Investing and financing activities 50,3 (54,7) (69,2) (44,2) Cash available to shareholders 94,0 (31,2) (5,7) (23,7) Dividend paid to shareholders (20,0) (17,1) (28,5) (21,1) Cash movement for the year 74,0 (48,3) (34,2) (44,7) Opening cash balance 15,4 89,4 89,4 55,2 Closing cash balance 89,4 41,1 55,2 10,5 Cash conversion rate (FCF/PAT) of 52% for the year Slide 22


23 GROUP SUMMARISED CASH FLOW Cash conversion Cash conversion cycle in line with expectation for Interims. This should improve by Year End Slide 23
24 GROUP SUMMARISED CASH FLOW New debt servicing ± R15m per year Capital repaid of R10m Interest serviced of R5.0m Interim dividend declared of 11.0 cents per share payable in April 2018 Interim Dividend 11 cents per Share 5% Slide 24
25 GROUP SUMMARISED BALANCE SHEET Summarised balance sheet (R'm) FY 2016 HY 2017 * FY 2017 HY 2018 Non current assets Property, plant and equipment 42,6 50,8 51,5 54,7 Goodwill and other intangibles 4,0 122,8 121,1 118,8 Deferred tax 3,7 1,6 3,7 2,8 Other financial assets 0,4 0,5 0,3 0,9 50,7 175,6 176,6 177,1 Current assets Inventories 30,8 74,6 94,7 95,7 Trade and other receivables 44,4 60,4 61,8 60,8 Cash 89,4 41,0 55,1 10,4 Other financial assets 1,6 1,3 0,8 1,2 166,2 177,4 212,4 168,1 Non current liabilities Debt 23,4 104,5 86,1 77,7 Deferred tax - - 4,4 4,1 23,4 104,5 90,5 81,8 Current liabilities Debt 3,0 46,4 49,9 20,9 Trade payables 37,5 26,9 52,6 33,7 Other (tax + other) 4,0 1,2 4,1 0,4 44,5 74,6 106,6 55,1 Equity 149,0 173,9 191,9 208,2 * Restated See note 5 Interim Results Slide 25
26 PROSPECTS Improved consumer sentiment after ANC elections in December 2017 Stronger Rand positive impact on gross profit margin due to reduced input costs Driving geographic growth in Taylor Continued focus in Africa driving sales in recently appointed franchise areas. Service opportunities arising from elsewhere on an ad hoc basis African economics improving on the back of sustained better commodity prices Strong sales from the UK from two projects commenced in December 2017 Further acquisitions are targeted from FY2019 Efficiency enhancement project at Trellidor business unit with a calculated payback of 2 years. c.r12m Capex on machines and factory space Growth strategies implemented - enhanced foundation to grow Slide 26


27 Thank You
TRELLIDOR HOLDINGS LIMITED AUDITED RESULTS FOR THE YEAR ENDED 30 JUNE 2016
 TRELLIDOR HOLDINGS LIMITED AUDITED RESULTS FOR THE YEAR ENDED 30 JUNE 2016 OVERVIEW Trellidor is the market leading manufacturer of custom made barrier security products Distribution through dedicated
Annual Results. 12 months ended 28 February Agenda
 Annual Results 28 ruary 2015 Bridging y expectations Agenda 2015 2014 2 1 12 month overview Phase 1 of turnaround strategy successfully implemented Closed-out problem contracts Closed non-performing Power
Interim Results. Six months ended 31 August 2016
 Interim Results Six months ended 31 August 2016 Stefanutti Stocks City A multi-disciplinary construction group (Vision) (Mission) 2 www.stefanuttistocks.com y 2 Agenda Six month overview Operational Overview
12 month overview. Operational Overview. Financial Results. Conclusion
 Annual Results 12 months ended 29 ruary 2016 Agenda 12 month overview Operational Overview Financial Results Conclusion 2 1 12 month overview Reasonable financial performance in current market All Business
Period overview Operational Overview Financial Results Conclusion
 Interim Results Six months ended 31 ust 2015 Bridging y expectations Agenda Period overview Operational Overview Financial Results Conclusion Bridging y expectations 2 1 Six month overview Satisfactory
KAP INDUSTRIAL HOLDINGS LIMITED UNAUDITED RESULTS FOR THE SIX MONTHS ENDED 31 DECEMBER 2018
 KAP INDUSTRIAL HOLDINGS LIMITED INTEGRATED INTO EVERY DAY INTRODUCTION JAAP DU TOIT CHAIRMAN AGENDA INTRODUCTION JAAP DU TOIT UNAUDITED INTERIM RESULTS FOR THE SIX STRATEGY MONTHS IMPLEMENTATION ENDED
PRESENTATION TO INVESTORS FOR THE YEAR ENDED 30 SEPTEMBER 2015
 PRESENTATION TO INVESTORS FOR THE YEAR ENDED 30 SEPTEMBER 2015 AGENDA GROUP OVERVIEW Alan Dickson, CEO FINANCIAL OVERVIEW Nick Thomson, CFO SEGMENTAL DISCUSSIONS ICT Mark Taylor Applied electronics Peter
Barloworld Limited. Reviewed interim results to 31 March May 15, 2006
 Barloworld Limited Reviewed interim results to 31 March 2006 May 15, 2006 BARLOWORLD IS A DIVERSIFIED INDUSTRIAL COMPANY Over 26 000 people in 31 countries Barloworld s way of doing business - market-leading
KAP INDUSTRIAL HOLDINGS LIMITED (KAP) UNAUDITED INTERIM RESULTS FOR THE SIX MONTHS ENDED 31 DECEMBER 2017
 UNAUDITED INTERIM RESULTS FOR THE SIX MONTHS ENDED 31 DECEMBER 2017") KAP INDUSTRIAL HOLDINGS LIMITED (KAP) UNAUDITED INTERIM RESULTS FOR THE SIX MONTHS ENDED 31 DECEMBER 2017 WELCOME JAAP DU TOIT CHAIRMAN AGENDA WELCOME UNAUDITED INTERIM RESULTS FOR THE SIX STRATEGY MONTHS
KAP INDUSTRIAL HOLDINGS LIMITED (KAP) UNAUDITED INTERIM RESULTS FOR THE SIX MONTHS ENDED 31 DECEMBER 2017 WELCOME JAAP DU TOIT CHAIRMAN AGENDA WELCOME UNAUDITED INTERIM RESULTS FOR THE SIX STRATEGY MONTHS
Results Presentation for the year ended 30 June 2012
 Results Presentation for the year ended 30 June 2012 Agenda Financial highlights Year at a glance Group at a glance Operational reviews Financial review Industrial Cable Suppliers Strategy and outlook
BELL EQUIPMENT LTD RESULTS FOR THE 12 MONTHS ENDED 31 DECEMBER 2017 AND BUSINESS REVIEW
 BELL EQUIPMENT LTD RESULTS FOR THE 12 MONTHS ENDED 31 DECEMBER 2017 AND BUSINESS REVIEW Financial Highlights for 2017 Revenue up 13% to R6,8 billion NPAT up from R39 million to R272 million HEPS per share
ANALYST PRESENTATION FOR THE YEAR ENDED 31 MARCH 2012
 ANALYST PRESENTATION FOR THE YEAR ENDED 31 MARCH 2012 1 TFG ANALYST PRESENTATION MARCH 2012 AGENDA Overview of the economy and retail environment Review of the year Financial review Divisional review Financial
Summarised Audited Group annual Financial statements. For the 52 weeks ended 26 February
 Summarised Audited Group annual Financial statements For the 52 weeks ended 26 February 2017 Turnover 7.0% R77.5 billion (2016: R72.4 billion) HEPS 18.0% 264.35 cents (2016: 224.04 cents) Total dividend
For personal use only. JB Hi-Fi Limited. HY18 Results Presentation
 JB Hi-Fi Limited HY8 Results Presentation 5 FEBRUARY AUGUST 06 08 PAGE Agenda. Group Performance Overview. JB HI-FI 3. The Good Guys 4. Group Balance Sheet and Cash Flow 5. Outlook Richard Murray Group
RESULTS PRESENTATION FOR THE 52 WEEKS ENDED 25 FEBRUARY 2018
 RESULTS PRESENTATION FOR THE 52 WEEKS ENDED 25 FEBRUARY 2018 1 Chairman s introduction Gareth Ackerman Chairman 2 3 Results overview Bakar Jakoet Chief Finance Officer Progress on our plan Richard Brasher
TRELLIDOR HOLDINGS LIMITED
 TRELLIDOR HOLDINGS LIMITED INTEGRATED ANNUAL REPORT 2016 CONTENTS INTRODUCTION Trellidor s first Integrated Annual Report 3 OVERVIEW Who is Trellidor? 5 Highlights 6 Group structure 8 How Trellidor creates
OVERVIEW Group highlights. The Maslow Hotel
 OVERVIEW Group highlights The Maslow Hotel 2 Key indicators R5 407m R1 489m 334 cps 90 cps GROUP REVENUE GROUP EBITDA ADJ DILUTED HEPS DPS +4% (5%) (18%) (18%) 3 Kalahari Sands Operating environment Pressure
Investors Presentation 10 & 11 May 2005 FOR THE SIX MONTHS ENDED 31 MARCH 2005
 Investors Presentation 10 & 11 May 2005 FOR THE SIX MONTHS ENDED 31 MARCH 2005 FACT SHEET FOR SIX MONTH PERIOD Current market capitalisation R6,9 billion Revenue R3,3 billion EBITDA R460 million EBITDA
Financial results presentation For the period ended 30 June External structural and cyclical impacts on results
 212 Financial results presentation For the period ended 3 June 212 External structural and cyclical impacts on results Macro factor Developing versus developed world Consequence SA and Africa relatively
HomeChoice International PLC summarised group financial statements for the year ended 31 December 2016 and cash dividend declaration
 HomeChoice International PLC summarised group financial statements for the year ended 31 December and cash dividend declaration HomeChoice International PLC 1 Commentary Group highlights sales up 25.1
Unaudited results for the 6 months ended 30 September H Investor Booklet November 2016
 H1 2017 Investor Booklet November 2016 Agenda Overview of Results Financial Review Outlook 2 Overview In the F2016 results presentation (14 July 2016) we said: Dawn board had approved a plan to stop losses
Unaudited results. for the six months ended 30 November ISIN: ZAE Share code: ARH. ARB Holdings Limited
 www.arbhold.co.za ARB Holdings Limited Registration number: 1986/002975/06 Share code: ARH ISIN: ZAE000109435 ( ARB or the Company or the Group ) for the six months ended 30 November 2016 Unaudited results
ANALYST PRESENTATION FOR THE HALF-YEAR ENDED 30 SEPTEMBER 2010
 ANALYST PRESENTATION FOR THE HALF-YEAR ENDED 30 SEPTEMBER 2010 1 Agenda The economy and retail environment Review of the period Financial review Divisional review Financial services Outlook Questions Doug
Annual Results November 2015
 Annual Results 2015 November 2015 Forward looking statements We may make statements that are not historical facts and relate to analyses and other information based on forecasts of future results and estimates
MTN Group Limited Results presentation for the six months ended 30 June 2017
 MTN Group Limited Results presentation for the six months ended 30 June 2017 Disclaimer The information contained in this document has not been verified independently. No representation or warranty express
Grand Parade Investments Limited Registration number: 1997/003548/06 Share code: GPL ISIN: ZAE ("GPI" or "the Company" or "the Group")
") Grand Parade Investments Limited Registration number: 1997/003548/06 Share code: GPL ISIN: ZAE000119814 ("GPI" or "the Company" or "the Group") ABRIDGED AUDITED FINANCIAL STATEMENTS SALIENT FEATURES 120%
Grand Parade Investments Limited Registration number: 1997/003548/06 Share code: GPL ISIN: ZAE000119814 ("GPI" or "the Company" or "the Group") ABRIDGED AUDITED FINANCIAL STATEMENTS SALIENT FEATURES 120%
INTERIM RESULTS FOR THE SIX MONTHS ENDED 30 JUNE TH AUGUST 2016
 INTERIM RESULTS FOR THE SIX MONTHS ENDED 30 JUNE 2016 18 TH AUGUST 2016 AGENDA Commentary & results overview Completion of strategic redesign and renewal Financial review Operational overview Prospects
WILMAR INTERNATIONAL LIMITED 4Q2016 Results Briefing. Feb 20, 2017
 WILMAR INTERNATIONAL LIMITED 4Q2016 Results Briefing Feb 20, 2017 IMPORTANT NOTICE Information in this presentation may contain projections and forward looking statements that reflect the Company s current
RESULTS PRESENTATION
 THE FOSCHINI GROUP LIMITED RESULTS PRESENTATION FOR THE 6 MONTHS ENDED 30 SEPTEMBER RESULTS PRESENTATION FOR THE HALFYEAR ENDED 30 SEPTEMBER AGENDA Economy and retail environment Doug Murray Business
NETCARE LIMITED UNAUDITED INTERIM GROUP RESULTS FOR THE SIX MONTHS ENDED 31 MARCH 2016 CARE DIGNITY TRUTH PARTICIPATION PASSION
 NETCARE LIMITED UNAUDITED INTERIM GROUP RESULTS FOR THE SIX MONTHS ENDED 31 MARCH 2016 Group Overview South Africa United Kingdom Financial Review Guidance GROUP OVERVIEW 4 Group A comprehensive network
AUDITED ANNUAL RESULTS YEAR ENDING 30 JUNE People, Planet, Profit UNAUDITED INTERIM RESULTS FOR THE SIX MONTHS ENDED 31 DECEMBER 2016
 AUDITED ANNUAL RESULTS YEAR ENDING 30 JUNE 2016 People, Planet, Profit UNAUDITED INTERIM RESULTS FOR THE SIX MONTHS ENDED 31 DECEMBER 2016 UNAUDITED INTERIM RESULTS FOR THE SIX MONTHS ENDED 31 DECEMBER
WILMAR INTERNATIONAL LIMITED 2Q2016 Results Briefing. August 11, 2016
 WILMAR INTERNATIONAL LIMITED 2Q2016 Results Briefing August 11, 2016 IMPORTANT NOTICE Information in this presentation may contain projections and forward looking statements that reflect the Company s
Research. ART Argent Industrial Limited Full Year Results and Initiation Report. Valuation: Undervalued
 Aug-11 Nov-11 Feb-12 May-12 Aug-12 Nov-12 Feb-13 May-13 Aug-13 Nov-13 Feb-14 May-14 Aug-14 Nov-14 Feb-15 May-15 Aug-15 Nov-15 Feb-16 May-16 Research RESULTS COMMENTARY Argent released a respectable set
AVI Limited presentation to shareholders & analysts for the year ended June 2018
 AVI Limited presentation to shareholders & analysts for the year ended June 2018 AGENDA Key features and results history Group financial results Business unit performance Prospects Questions and answers
Results presentation. for the 26 weeks ended 26 August 2018
 Results presentation for the 26 weeks ended 26 August 2018 Agenda Chairman s introduction Gareth Ackerman Chairman Results overview Bakar Jakoet Chief Finance Officer Progress on our plan Richard Brasher
2011 FINAL RESULTS PRESENTATION
 2011 FINAL RESULTS PRESENTATION FEBRUARY 2012 1 Agenda 1 Market Conditions 2011 2 Financial Review 3 Operational Review 4 Key Strategic Priorities 5 Outlook for 2012 and Beyond 2 MARKET CONDITIONS 2011
Interim Results 2018
 Interim Results 2018 Forward looking statements We may make statements that are not historical facts and relate to analyses and other information based on forecasts of future results and estimates of amounts
Datatec Group Audited results for the year ended 29 February 2008
 Datatec Group Audited results for the year ended 29 February 2008 1 Datatec Group Highlights Revenue up 27% (12.2% organic) to over $4.0 billion Improved geographic spread of business helps to mitigate
For personal use only
 ACN 072 507 147 ASX & MEDIA RELEASE 25 May 2017 THORN FY17 KEY NUMBERS UP, ISSUES BEING ADDRESSED Consumer leasing and business finance company, Thorn Group Limited (ASX: TGA), has lifted revenue, EBIT
1Q 2005 Group Results 12th May 2005
 1Q 2005 Group Results 12th May 2005 AGENDA TRANSITION p.2 1Q 2005 GROUP RESULTS p.6 1Q 2005 INDUSTRIAL RESULTS p.9 1Q 2005 PIRELLI RE RESULTS p.14 PIRELLI GROUP 2005 OUTLOOK p.18 BACK UP SLIDES p.20 1
CONSOLIDATED PROFIT AND LOSS ACCOUNT CONSTANT EXCHANGE RATES (unaudited)
") 15 CONSOLIDATED PROFIT AND LOSS ACCOUNT CONSTANT EXCHANGE RATES (unaudited) Note: A description of the exchange rate conventions used is given on page 12. US $ Millions constant rates TURNOVER 10,458 10,859
15 CONSOLIDATED PROFIT AND LOSS ACCOUNT CONSTANT EXCHANGE RATES (unaudited) Note: A description of the exchange rate conventions used is given on page 12. US $ Millions constant rates TURNOVER 10,458 10,859
UNAUDITED CONDENSED CONSOLIDATED INTERIM RESULTS
 UNAUDITED CONDENSED CONSOLIDATED INTERIM RESULTS FOR THE SIX MONTHS ENDED 31 DECEMBER 2014 RESULTS HIGHLIGHTS REVENUE 257% to R562.4m EBITDA 276% to R87.2m HEPS 118% to 14.4 cents DPS 3.5 cents 01 UNAUDITED
ALARIS HOLDINGS INTERIM FINANCIAL RESULTS for the 6 months ended 31 December 2017
 ALARIS HOLDINGS INTERIM FINANCIAL RESULTS for the 6 months ended 31 December 2017 AGENDA Slide# Financial Highlights 3 Operational Highlights 4 Reflection on the half year 5 Group Overview 6-15 Financial
Following the implementation of the Acquisition, GPI s total interest in Mac Brothers will be 65.00%.
 GRAND PARADE INVESTMENTS LIMITED (Incorporated in the Republic of South Africa) (Registration Number 1997/003548/06) Share code: GPL ISIN: ZAE000119814 ( GPI or the Company ) SMALL RELATED PARTY TRANSACTION:
Sasol Gas (Pty) Ltd. (Registration number 1964/006005/07)
 Ltd. (Registration number 1964/006005/07)") Unaudited financial information for the year ended 30 June 2017 Unaudited financial information for the year ended 30 June 2017 Contents Page Statement of financial position Income statement Statement
Unaudited financial information for the year ended 30 June 2017 Unaudited financial information for the year ended 30 June 2017 Contents Page Statement of financial position Income statement Statement
For personal use only. JB Hi-Fi Limited. HY17 Results Presentation
 JB Hi-Fi Limited HY7 Results Presentation 3 5 FEBRUARY AUGUST 06 07 PAGE Agenda. Group Performance Overview. JB HI-FI 3. The Good Guys 4. Stores 5. Group Balance Sheet and Cash Flow 6. Outlook Richard
AUDITED RESULTS FOR THE YEAR ENDED 31 DECEMBER 2016
 AUDITED RESULTS FOR THE YEAR ENDED 31 DECEMBER 2016 AGENDA 2 1 Opening remarks / market update 2 Financial results 3 Operational review 4 Strategy update 5 Outlook 1 2 3 4 5 OPENING REMARKS / MARKET UPDATE
APPENDICES NOTICE OF ANNUAL GENERAL MEETING SUMMARY CONSOLIDATED FINANCIAL STATEMENTS OUR GOVERNANCE PROFILE PERFORMANCE REVIEW APPENDICES
 153 INVESTMENT CASE ABOUT THIS REPORT OUR OUR OPERATING ENVIRONMENT OUR STRATEGY AND PERFORMANCE APPENDIX 1: DEFINITIONS Concession arrangement COSO Current ratio Debt to equity ratio Dividend cover Doubtful
Summarised consolidated financial results
 Summarised consolidated financial results For the six months ended 31 March 2018 Revenue increased to Trading profit increased to HEPS increased by R8.8 bn R1.2 bn 10% up by 2 % up by 7% to 132.0 cents
SUMMARISED CONSOLIDATED RESULTS For the year ended 30 June 2016 STRATEGIC & OPERATIONAL OVERVIEW. Canal Walk (Cape Town, Western Cape)
") SUMMARISED CONSOLIDATED RESULTS For the year ended 30 June 2016 STRATEGIC & OPERATIONAL OVERVIEW Canal Walk (Cape Town, Western Cape) 1 STRATEGY & OVERVIEW South African REIT Focused on emerging markets
SUMMARISED CONSOLIDATED RESULTS For the year ended 30 June 2016 STRATEGIC & OPERATIONAL OVERVIEW Canal Walk (Cape Town, Western Cape) 1 STRATEGY & OVERVIEW South African REIT Focused on emerging markets
Profit and dividend announcement
 Limited Profit and dividend announcement for the year ended 30 June 2005 Highlights Revenue +15% EBITDA +19% Fully diluted adjusted HEPS +45% Dividends per share +60% Sun International Limited, Share code:
INSIMBI REFRACTORY AND ALLOY SUPPLIES LIMITED
 INSIMBI REFRACTORY AND ALLOY SUPPLIES LIMITED (Incorporated in the Republic of South Africa) (Registration No: 2002/029821/06) (Income tax reference no: 9078/488/15/3) Share code: ISB ISIN code: ZAE000116828
PRESENTATION OUTLINE. Review of the period Financial results Trading performance Outlook Questions
 PRESENTATION OUTLINE Review of the period Financial results Trading performance Outlook Questions 2 REVIEW OF THE PERIOD DAVID KNEALE REVIEW OF THE PERIOD Strong health & beauty sales performance Increased
THE FOSCHINI GROUP LIMITED RESULTS PRESENTATION
 THE FOSCHINI LIMITED RESULTS PRESENTATION FOR THE HALF-YEAR ENDED 30 SEPTEMBER 2017 RESULTS PRESENTATION FOR THE HALF-YEAR ENDED 30 SEPTEMBER 2017 AGENDA Doug Murray Chief Executive Officer Anthony Thunstrӧm
Summarised annual financial statements
 Summarised annual financial NASPERS INTEGRATED ANNUAL REPORT 125 summarised annual financial Index Statement of responsibility by the board of directors 127 Report of the independent auditor 128 Basis
2005 FULL YEAR RESULTS. March / April 2006
 2005 FULL YEAR RESULTS March / April 2006 DISCLAIMER Safe Harbour Statement This presentation contains forward-looking statements (made pursuant to the safe harbour provisions of the Private Securities
CONSOLIDATED PROFIT AND LOSS ACCOUNT - CONSTANT EXCHANGE RATES (unaudited) Fourth Quarter US $ Millions constant Full Year % Incr./ (Decr.
 Fourth Quarter US $ Millions constant Full Year % Incr./ (Decr.") 16 CONSOLIDATED PROFIT AND LOSS ACCOUNT - CONSTANT EXCHANGE RATES (unaudited) In the profit and loss account given below, the results in both years have been translated at constant exchange rates, being
16 CONSOLIDATED PROFIT AND LOSS ACCOUNT - CONSTANT EXCHANGE RATES (unaudited) In the profit and loss account given below, the results in both years have been translated at constant exchange rates, being
CONSOLIDATED PROFIT AND LOSS ACCOUNT CONSTANT EXCHANGE RATES (unaudited)
") CONSOLIDATED PROFIT AND LOSS ACCOUNT CONSTANT EXCHANGE RATES (unaudited) Note: A description of the exchange rate conventions used is given on page 12. 16 Third Quarter US $ Millions constant rates 11,983
CONSOLIDATED PROFIT AND LOSS ACCOUNT CONSTANT EXCHANGE RATES (unaudited) Note: A description of the exchange rate conventions used is given on page 12. 16 Third Quarter US $ Millions constant rates 11,983
Sun International Limited Profit and dividend announcement for the six months ended 31 December 2009
 Sun International Limited Profit and dividend announcement for the six months ended 31 December ( Sun International or the group or the company ) Registration number 1967/007528/06 Share code: SUI ISIN:
The contribution of British American Tobacco South Africa to the Western Cape economy
 The contribution of British American Tobacco South Africa to the Western Cape economy A study conducted by Quantec Research, 2016 Contents 2 The contribution of British American Tobacco South Africa to
HY17 RESULTS PRESENTATION
 1 HY17 RESULTS PRESENTATION TABLE OF CONTENTS About Cartrack 3 Business trends 4 Strategy overview 6 Segmental performance 13 Financial review 19 Outlook 28 Annexures 32 ABOUT CARTRACK A leading global
PRELIMINARY AUDITED SUMMARISED CONSOLIDATED RESULTS AND CASH DIVIDEND DECLARATION FOR THE YEAR ENDED 30 SEPTEMBER 2018 KEY FEATURES
 RHODES FOOD GROUP HOLDINGS LIMITED (Incorporated in the Republic of South Africa) Registration number: 2012/074392/06 JSE share code: RFG ISIN: ZAE000191979 PRELIMINARY AUDITED SUMMARISED CONSOLIDATED
Niveus Investments Limited. Reg. no: 1996/005744/06. Incorporated in the Republic of South Africa. JSE share code: NIV. ISIN code: ZAE
 Niveus Investments Limited Reg. no: 1996/005744/06 Incorporated in the Republic of South Africa JSE share code: NIV ISIN code: ZAE000169553 ("the Company" or "the Group" or "Niveus") UNAUDITED GROUP INTERIM
2011 Annual Results. November 2011
 2011 Annual Results November 2011 1 Agenda Highlights Group results Operational review Strategic review 2 Highlights HEPS from continuing operations up 21% Dividend increased by 30% to 108 cents per share
WOOLWORTHS HOLDINGS LIMITED
 WOOLWORTHS HOLDINGS LIMITED UNAUDITED INTERIM GROUP RESULTS FOR THE 26 WEEKS ENDED 25 DECEMBER 2017 WOOLWORTHS HOLDINGS LIMITED INTERIM RESULTS 2018 ANALYST PRESENTATION WHL 1 / 2018 WOOLWORTHS HOLDINGS
Adapt IT unaudited condensed consolidated INTERIM GROUP RESULTS. for the six months ended 31 December
 Adapt IT unaudited condensed consolidated INTERIM GROUP RESULTS for the six months ended 31 December 2014 OVERVIEW Adapt IT provides a variety of specialised turnkey IT solutions and services to the education,
CONSOLIDATED PROFIT AND LOSS ACCOUNT - CONSTANT EXCHANGE RATES (unaudited) Fourth Quarter Millions constant Full Year % Incr./ (Decr.
 Fourth Quarter Millions constant Full Year % Incr./ (Decr.") 16 CONSOLIDATED PROFIT AND LOSS ACCOUNT - CONSTANT EXCHANGE RATES (unaudited) In the profit and loss account given below, the results in both years have been translated at constant exchange rates, being
16 CONSOLIDATED PROFIT AND LOSS ACCOUNT - CONSTANT EXCHANGE RATES (unaudited) In the profit and loss account given below, the results in both years have been translated at constant exchange rates, being
INTERIM FINANCIAL RESULTS
 Presentation Tuesday, 14 November 2017 INTERIM FINANCIAL RESULTS For the six months ended 30 September 2017 Contents EXECUTIVE OVERVIEW FINANCIAL REVIEW OPERATIONAL REVIEW OUTLOOK & STRATEGY Presented
ANNUAL FINANCIAL RESULTS INTRODUCTION AND GROUP STRUCTURE FOR THE YEAR ENDED 31 DECEMBER Dr. ENOS BANDA Chairman
 ANNUAL FINANCIAL RESULTS INTRODUCTION AND GROUP STRUCTURE FOR THE YEAR ENDED 31 DECEMBER Management Team Dr. ENOS BANDA Chairman STEVEN JOFFE Chief Executive Officer JARROD FRIEDMAN Financial Director
SIX MONTHS ENDED 30 SEPTEMBER 2018
 PRESENTATION TUESDAY, 20 NOVEMBER 2018 SIX MONTHS ENDED 30 SEPTEMBER 2018 CONTENTS PRESENTED BY Neil Birch Chief Executive Officer Harry Todd Chief Financial Officer 2 EXECUTIVE OVERVIEW 3 RESULTS SUMMARY
SUMMARISED AUDITED CONSOLIDATED RESULTS FOR THE YEAR ENDED 28 FEBRUARY 2018 AND DIVIDEND DECLARATION NUMBER 7
 NVEST FINANCIAL HOLDINGS LIMITED AND ITS SUBSIDIARIES (Incorporated in the Republic of South Africa) (Registration number 2008/015990/06) ( NVest, the Group or the Company ) ISIN Code: ZAE000199865 JSE
WBHO AUDITED RESULTS 2013 AUDITED RESULTS
 2013 AUDITED RESULTS CONTENTS 2 CONTENTS SUBJECT PRESENTER 1. Welcome Louwtjie Nel 2. Operating context and financial highlights Louwtjie Nel 3. Operational review Roads and earthworks Building and civil
AVI Limited presentation to shareholders & analysts for the six months ended 31 December 2017
 AVI Limited presentation to shareholders & analysts for the six months ended 31 December 2017 AGENDA Key features and results history Group financial results Performance and prospects Questions and answers
INTERIM RESULTS PRESENTATION SIX MONTHS TO 30 JUNE 2018
 INTERIM RESULTS PRESENTATION SIX MONTHS TO 30 JUNE 2018 DISCLAIMER The information contained in this presentation has not been independently verified and this presentation contains various forward-looking
Unaudited interim financial results for the six months ended 30 September 2017
 Sephaku Holdings Limited (Incorporated in the Republic of South Africa) (Registration number: 2005/003306/06) Share code: SEP ISIN: ZAE000138459 interim financial results for the six months Cement performance
Edgars 3.3% CNA 9.9% Discount Division 11.8%
 Results for the year ended dd 28 March 2009 Q4 FY 2009 Excluding consolidation of OtC 2 Highlights for 4 th Quarter FY 2009 Retail sales up 7.3% to R4.6bn Divisional retail sales growth: Total Edgars 3.3%
COMPUTERSHARE LIMITED (ASX:CPU) FINANCIAL RESULTS FOR THE HALF YEAR ENDED 31 DECEMBER February 2015
 FINANCIAL RESULTS FOR THE HALF YEAR ENDED 31 DECEMBER February 2015") COMPUTERSHARE LIMITED (ASX:CPU) FINANCIAL RESULTS FOR THE HALF YEAR ENDED 31 DECEMBER 2014 11 February 2015 NOTE: All figures (including comparatives) are presented in US Dollars unless otherwise stated.
COMPUTERSHARE LIMITED (ASX:CPU) FINANCIAL RESULTS FOR THE HALF YEAR ENDED 31 DECEMBER 2014 11 February 2015 NOTE: All figures (including comparatives) are presented in US Dollars unless otherwise stated.
Investor Roadshow Presentation 2016 Financial Results
 By considering it all, PSG sees the bigger picture, which gives you the advantage Investor Roadshow Presentation 2016 Financial Results For the year ended 29 February 2016 14 April 2016 Contents 1. Group
TRUWORTHS INTERNATIONAL. Truworths International Limited. Interim report
 TRUWORTHS INTERNATIONAL Truworths International Limited Interim report for the 26 weeks ended 31 December 2000 CONTINUING OPERATION HIGHLIGHTS Operating profit increased by 20,1% Headline earnings per
+13% Nampak enriches peoples lives every day through the provision of. HEPS from continuing operations. EPS from continuing operations +17%
 Interim report and dividend declaration for the six months ended 31 March 2012 Nampak enriches peoples lives every day through the provision of wine bottles flavoured alcoholic beverages tissue products
ABRIDGED UNAUDITED INTERIM CONSOLIDATED RESULTS FOR THE SIX MONTHS ENDED 30 SEPTEMBER 2018
 Argent Industrial Limited Registration number 1993/002054/06 (Incorporated in the Republic of South Africa) Share code: ART ISIN code: ZAE000019188 ( Argent or the Group or the Company ) ABRIDGED UNAUDITED
Interim results FY2018 GROUP HIGHLIGHTS
 01 Interim results FY2018 GROUP HIGHLIGHTS Trading environment overview Sept 17 headline CPI 5.1% (avg March Sept 5.1%) Interest rates between 10.25% & 10.50% since Jan 16 Labour force up 696k (employed
DATATEC GROUP UNAUDITED INTERIM RESULTS FOR THE 6 MONTHS ENDED 31 AUGUST 2016
 Technology Distribution Integration & Managed Services Consulting & Research UNAUDITED INTERIM RESULTS FOR THE 6 MONTHS ENDED 31 AUGUST 2016 AGENDA Results summary, market conditions & operational strategy
FIRST QUARTER RESULTS. 29 October 2003
 FIRST QUARTER RESULTS 29 October 2003 Chris Lynch Chief Financial Officer Highlights quarter ended 30 September 2003 EBITDA up 10% to US$1,397 million and EBIT up 11% to US$935 million. Attributable profit
Revenue 67,851 59, , ,707. Cost of Sales (58,393) (45,799) (224,661) (188,507) Gross Profit 9,458 14,138 47,534 42,200
 (45,799) (224,661) (188,507) Gross Profit 9,458 14,138 47,534 42,200") CONDENSED CONSOLIDATED STATEMENT OF COMPREHENSIVE INCOME Individual Quarter Cumulative Quarter Current Year Preceding Year Current Year Preceding Year Quarter Corresponding Quarter To Date To Date 30.09.2017
CONDENSED CONSOLIDATED STATEMENT OF COMPREHENSIVE INCOME Individual Quarter Cumulative Quarter Current Year Preceding Year Current Year Preceding Year Quarter Corresponding Quarter To Date To Date 30.09.2017
RPC GROUP PLC 2017 / 18 RESULTS
 RPC THE ESSENTIAL INGREDIENT RPC GROUP PLC 2017 / 18 RESULTS Supplemental Information 1 2018 RPC Group Plc. All Rights Reserved. Key figures Sales ( m) +36% Adjusted Operating Profit ( m) +38% Adjusted
Summary CONSOLIDATED STATEMENT OF CHANGES IN EQUITY. the foschini group UNAUDITED INTERIM CONDENSED CONSOLIDATED RESULTS
 Summary CONSOLIDATED STATEMENT OF CHANGES IN EQUITY for the years 31 March the foschini group limited UNAUDITED INTERIM CONDENSED CONSOLIDATED RESULTS FOR THE HALF-YEAR ENDED 30 SEPTEMBER 1 Summary CONSOLIDATED
HALF YEAR RESULTS ENDING 2 FEBRUARY 2018
 HALF YEAR RESULTS ENDING 2 FEBRUARY 2018 Matt Armitage CEO Brad Gray CFO AGENDA 1 2 3 4 Overview 2018 Half Year Results Strategy Update Summary & Outlook New photo to be supplied by CKD 2 OVERVIEW Positive
JB Hi-Fi Limited Half Year Results Presentation 31 December 2013
 JB Hi-Fi Limited Half Year Results Presentation 31 December 2013 3 February 2014 AGENDA 1. Performance 2. Profit and Loss Statement 3. Trading Performance 4. Store Update 5. HOME 6. Out of Store 7. Cash
INTERIM RESULTS FOR THE SIX MONTH PERIOD ENDED 31 DECEMBER DECEMBER 2018
 INTERIM RESULTS RESULTS INTERIM FOR THE RESULTS YEAR ENDED FOR THE 30 PERIOD JUN 2017 ENDED FOR THE SIX MONTH PERIOD ENDED 31 DECEMBER 2017 31 DECEMBER 2018 GOVERNANCE UPDATE GOVERNANCE UPDATE Executive
July 26, 2017 LafargeHolcim Ltd 2015
 Second Quarter 2017 Results Beat Hess, Chairman and Interim CEO Roland Köhler, Interim COO and Regional Head of Europe, Australia/NZ & Trading Ron Wirahadiraksa, CFO July 26, 2017 LafargeHolcim Ltd 2015
INTERIM RESULTS PRESENTATION FOR THE SIX MONTHS ENDED 31 AUGUST 2017
 INTERIM RESULTS PRESENTATION FOR THE SIX MONTHS ENDED 31 AUGUST 2017 AGENDA BUSINESS TRENDS AND STRATEGY Zak Calisto SEGMENTAL PERFORMANCE Zak Calisto FINANCIAL REVIEW John Edmeston OUTLOOK AND QUESTIONS
THE FOSCHINI GROUP LIMITED RESULTS PRESENTATION
 THE FOSCHINI GROUP LIMITED RESULTS PRESENTATION RESULTS PRESENTATION AGENDA Economy and retail environment Doug Murray Business overview Doug Murray Review of the year Doug Murray Financial review Anthony
OVERVIEW. Comparable HEPS up 4.5% Restaurant sales up 10.4% Comparable profit before tax up 5.0% Interim dividend per share up 6.
 OVERVIEW Restaurant sales up 10.4% (from continuing operations) Comparable HEPS up 4.5% (from continuing operations) Comparable profit before tax up 5.0% (from continuing operations) Interim dividend per
STRONG RELIABLE MACHINES STRONG RELIABLE SUPPORT UNAUDITED INTERIM RESULTS FOR THE PERIOD ENDED 30 JUNE 2018 AND CASH DIVIDEND DECLARATION
 STRONG RELIABLE MACHINES STRONG RELIABLE SUPPORT UNAUDITED INTERIM RESULTS FOR THE PERIOD ENDED 30 JUNE 2018 AND CASH DIVIDEND DECLARATION BELL EQUIPMENT LIMITED Unaudited results for the six month period
2018 Interim Results 30 August 2018
 2018 Interim Results 30 August 2018 Disclaimer Statements in this presentation with respect to each of Total Produce s and Dole Food Company's ("Dole") business, strategies, projected financial figures,
Investor Open Day. Wednesday, 9 th April 2014
 Investor Open Day Wednesday, 9 th April 2014 Agenda 08h00 08h15 Byron Nichles Corporate division and Group strategy 08h15 08h30 Blayne Burke Electrical division 08h30 08h45 Peter Willig Lighting division
CLICKS GROUP LIMITED Registration number: 1996/000645/06 Share code: CLS ISIN: ZAE CUSIP: 18682W205
 CLICKS GROUP LIMITED Registration number: 1996/000645/06 Share code: CLS ISIN: ZAE000134854 CUSIP: 18682W205 INTERIM CONDENSED CONSOLIDATED RESULTS FOR THE SIX MONTHS ENDED 28 FEBRUARY 2017 Group turnover
FINANCIAL RESULTS PRESENTATION H1FY18
 Virtus Health (ASX:VRT) FINANCIAL RESULTS PRESENTATION H1FY18 Tuesday 20 th February, 2018 9.15am AEDT DISCLAIMER The material in this presentation has been prepared by Virtus Health Limited ABN 80 129
SABMiller plc. F 12 first half results US call Six months ended September 30, November 17, 2011
 SABMiller plc F 12 first half results US call Six months ended September 30, 2011 November 17, 2011 Jamie Wilson, Chief Financial Officer Gary Leibowitz, Senior Vice President, IR Forward looking statements