THE FOSCHINI GROUP LIMITED RESULTS PRESENTATION
|
|
|
- Eugene Flowers
- 5 years ago
- Views:
Transcription


1 THE FOSCHINI GROUP LIMITED RESULTS PRESENTATION

2

3 RESULTS PRESENTATION AGENDA Economy and retail environment Doug Murray Business overview Doug Murray Review of the year Doug Murray Financial review Anthony Thunström TFG Financial Services Jane Fisher International expansion Doug Murray Key performance indicators Doug Murray Outlook Doug Murray 2 1

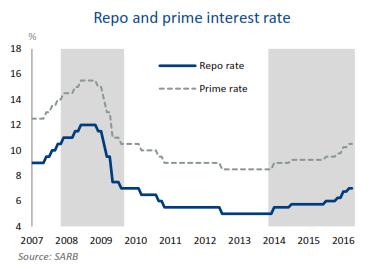
4 ECONOMY AND RETAIL ENVIRONMENT THE ECONOMY AND RETAIL ENVIRONMENT GLOBAL ECONOMY REMAINS UNCERTAIN Brexit US elections and economy Concerns remain with regards to the Chinese economy DOMESTIC ECONOMY Outlook for consumer spending a concern impact of: Rising inflation Interest rate hikes Unemployment Low consumer confidence Political uncertainty Rand extremely volatile Threat of ratings downgrade Increase in CPI during 2 nd half of our financial year 6,6% at end vs 4,6% at end September 2015 Potentially above target range until mid 2017 GDP growth outlook for at 0,4% (BER) Outlook for 2017 at 1,3% (BER) 4 2


5 TRADING ENVIRONMENT Source of graphs: BER Economic Snapshot May 5 TRADING ENVIRONMENT Source of graphs: BER Economic Snapshot May 6 3


6 BUSINESS OVERVIEW BUSINESS OVERVIEW TFG COMPRISES: 22 brands Primarily own brands that are leading household names During the financial year, we added SODA Bloc, Colette, Next and Whistles to our group and rebranded Fashion Express to The FIX We continue to benefit from and leverage our existing infrastructure and leading IT systems ensuring that new brands can be added with minimal capital outlay and investment Broad product offering across various merchandise categories Clothing, jewellery, homeware & furniture, cellphones and cosmetics We have a broad LSM appeal from value to upper end 8 4


7 TFG FOOTPRINT outlets in 31 countries globally TFG South Africa stores TFG rest of Africa 176 stores in 6 countries Phase Eight 542 outlets and Whistles 121 outlets in 24 countries 9 FOOTPRINT (UDING INTERNATIONAL) South Africa Rest of Africa American Swiss Charles & Keith Colette 6 6 DonnaClaire Duesouth Exact Fabiani Foschini GStar Raw hi 4 4 Markham Mat & May Next 2 2 SODA Bloc sportscene Sterns The FIX Totalsports Total
8 FOOTPRINT: REST OF AFRICA All stores in rest of Africa are corporate stores Rest of Africa 176 stores in 6 countries 31 stores opened during the year 16,6% turnover growth Excluding Namibia, 31,6% turnover growth with 14,6% same store turnover growth Namibia impacted by: Angolan oildependent economy slump Further expansion Kenya (2017) Target for 2021: approximately 330 stores 11 FOOTPRINT: INTERNATIONAL Stores Concessions Total outlets UK & Ireland Netherlands 7 7 USA Germany Australia Norway 1 1 Switzerland Hong Kong Malaysia 1 1 Bahrain 1 1 Mexico Latvia* 1 1 Kuwait 2 2 Saudi Arabia 8 8 Italy* 4 4 Qatar 1 1 United Arab Emirates 8 8 Japan* 1 1 Singapore 6 6 Estonia* 1 1 France * 2 2 Sweden 1 8 * New countries for financial year 9 Belgium
9 TURNOVER BY MERCHANDISE CATEGORY Retail turnover by merchandise category % Change % change % same store growth Clothing , , , ,1 41,8 13,0 6,9 Jewellery 1 470, , , ,5 7,0 7,0 3,4 Cellphones 1 672, , , ,3 7,4 7,4 3,5 Homeware & furniture 1 354, , , ,7 11,7 11,7 3,1 Cosmetics 1 093, , , ,2 9,2 9,2 6,6 Total , , , ,8 31,2 11,6 5,7 Cash sales , , , ,0 59,8 18,4 Credit sales 9 042, , , ,8 5,9 5,9 Total , , , ,8 31,2 11,6 Cash sales Represent 48,3% (including Phase Eight: 57,2%) of total sales ( 2015: 45,6% (including Phase Eight: 46,9%)) Strong growth at 18,4% (including Phase Eight: 59,8%) Credit sales was slightly slower in the 2 nd half but full year growth still pleasing at 5,9% up from 4,3% in the previous year 13 TURNOVER: MERCHANDISE CATEGORY CONTRIBUTION 7,9% Cellphones 6,4% Homeware & furniture 5,2% Cosmetics Clothing & footwear Sport 18,8% 7,0% Jewellery 73,5% Clothing and footwear Clothing & footwear Phase Eight 17,1% Clothing & footwear Value 11,0% Clothing & footwear Fashion 26,6% 14 7

10 CASH VS CREDIT TURNOVER GROWTH (UDING ) UDING 25.0% 10,8% 12,3% 11,6% 10,8% Growth in sales (%) 20.0% 15.0% 10.0% 15.8% 20.6% 18.4% 19.6% 5.0% 6.8% 5.1% 5.9% 4.3% 0.0% April 2015 Sept 2015 Oct 2015 FY FY 2015 GROWTH IN CASH SALES GROWTH IN CREDIT SALES 15 REVIEW OF THE YEAR 8
11 REVIEW OF THE YEAR CHANGES IN GROUP STRUCTURE DURING THE YEAR Phase Eight: 12 months trading included (acquired January 2015) Acquired franchise rights for Colette and Next Launched SODA Bloc Rebranded Fashion Express to The FIX Acquired Whistles in CHANGES IN ECOMMERCE Launched Sports division online selling during the year (sportscene, Totalsports and Duesouth) CHANGES IN LEGISLATION AND OPERATING ENVIRONMENT Affordability Regulations mid September 2015 CHANGES IN INTEREST RATE ENVIRONMENT Repo rate increases in July 2015 (25 bps), November 2015 (25 bps), January (50bps) and (25bps) 17 MARCH : SALIENT FEATURES Retail turnover R21,1 bn Retail turnover growth +31,2% Gross margin 49,7% Net bad debt / closing debtors book 13,4% ROE 23,9% Debt / equity recourse 55,6% Debt / equity total 73,5% 18 9
 1 055,8 HEPS from continuing operations excluding acquisition costs growth +17,6% Final distribution (cents per share) 385,0 Growth in final")
12 MARCH : SALIENT FEATURES HEPS from continuing operations including acquisition costs (cents) 1 024,0 HEPS from continuing operations including acquisition costs growth +35,3% HEPS from continuing operations excluding acquisition costs (cents) 1 055,8 HEPS from continuing operations excluding acquisition costs growth +17,6% Final distribution (cents per share) 385,0 Growth in final distribution +18,5% Growth in total distribution +17,5% 19 FINANCIAL REVIEW 10
13 FINANCIAL REVIEW: INCOME STATEMENT HIGHLIGHTS % change % change Revenue , , , ,9 28,1 11,0 Retail turnover , , , ,8 31,2 11,6 Gross margin (%) 49,7 46,9 47,3 46,7 Total trading expenses 9 537, , , ,8 31,5 9,4 Net bad debt 947,7 947, , ,6 (7,4) (7,4) Operating margin (%) 17,0 18,2 17,5 17,7 HEPS from continuing operations excluding acquisition costs (cents) 1 055,8 897,9 17,6 21 TFG EARNINGS & DISTRIBUTIONS CONTINUING OPERATIONS Cents HEPS* DPS * Excludes acquisition costs 22 11
14 REVENUE % change % change Retail turnover , , , ,8 31,2 11,6 Interest income 1 533, , , ,7 12,1 12,1 Other revenue 1 105, , , ,4 1,4 1,4 Group total , , , ,9 28,1 11,0 Retail turnover growth strong Interest income will be dealt with separately Growth in other revenue +1,4% Comprises publishing income, insurance income and income from mobile one2one airtime Will be dealt with separately in Financial Services section 23 GROSS PROFIT % change % change Gross profit , , , ,8 38,1 12,2 Gross margin (%) 49,7 46,9 47,3 46,7 Gross margins broadly consistent in all merchandise categories Excluding Phase Eight, gross margin at 46,9% 24 12
15 INTEREST INCOME 2015 % change Trade receivables retail 1 510, ,7 12,9 Sundry 22,3 30,0 (25,7) Total interest income 1 533, ,7 12,1 Interest income from retail debtors book up 12,9% Repo rate increases during the year Book growth of 8% ( to movement) 89,0% of balances remain interestbearing as customers favour longer term credit plans ( 2015: 89,0%) 25 TRADING EXPENSES % to turnover % to turnover 2015 % change % change Depreciation and amortisation (464,7) (347,1) 2,0 (428,1) (412,7) 2,6 8,5 (15,9) Employee costs (3 210,8) (2 595,5) 14,8 (2 325,2) (2 248,5) 14,3 38,1 15,4 Occupancy costs (2 043,2) (1 758,7) 10,0 (1 585,0) (1 548,0) 9,9 28,9 13,6 Other net operating costs (2 870,8) (2 012,0) 11,5 (1 890,8) (1 769,0) 11,3 51,8 13,7 comp (1 819,2) (1 769,0) 2,8 noncomp (192,8) Trading expenses before net bad debt (8 589,5) (6 713,3) 38,4 (6 229,1) (5 978,2) 38,1 37,9 12,3 Net bad debts (947,7) (947,7) 5,4 (1 023,6) (1 023,6) 6,5 (7,4) (7,4) Total trading expenses (9 537,2) (7 661,0) 43,8 (7 252,7) (7 001,8) 44,6 31,5 9,4 Expenses before bad debt growing at 12,3% Employee costs growth at 15,4% Annual salary and promotional increases approx 7,5% New stores Strategic initiatives i.e. ecommerce, analytics, new brands, African expansion, etc Store occupancy costs up 13,6% Normal lease escalations average 7%, balance is new stores Other net operating costs increased by 13,7% Likeforlike costs approximately 3% Investment in marketing, rewards programme, international merchandise consultants, new account cards, etc Bad debts will be dealt with by Jane Fisher 26 13
16 FINANCE COST % change % change Finance cost (509,0) (409,5) (228,1) (211,3) 123,1 93,8 Level of finance cost in line with management s expectation and interest rate environment 4 interest rate increases during this financial year along with increased level of term funding resulted in higher average cost of borrowings Political uncertainty resulted in higher interest rate spreads Impact of inclusion of UK debt for full year Working capital and capex investment resulted in higher average borrowing levels 27 STOCK 2015 % change Stock 5 116, ,9 34,1 Excluding Phase Eight & Whistles, stock up by 25,9% Impact of: New stores Inflation 8% 9% New brands Investment in faster growing and repositioned brands No concern over quality of stock and levels of markdown 28 14
17 TRADE RECEIVABLES 2015 % change Trade receivables retail 6 695, ,9 8,0 Remains the biggest asset on our balance sheet Growth in book higher than growth in credit turnover Slight lengthening of the book Impact of interest rate increases during the year Continue to be well managed in the current climate Adequate provisioning Jane Fisher will deal with the performance of our receivables in more detail 29 BORROWINGS 2015 Interestbearing debt 8 165, ,5 Less: Cash (888,8) (800,4) Net borrowings TFG including international subsidiaries* 7 276, ,1 Less: International subsidiaries* net borrowings (nonrecourse) (1 770,1) (1 639,2) TFG borrowings excluding international subsidiaries* 5 506, ,9 * International subsidiaries: Phase Eight and Whistles Net borrowings up by R1 billion primarily due to working capital investment which had supported the group s growth TFG recourse debt 55,6% Including nonrecourse international subsidiaries: gearing of 73,5% 30 15
18 CASH GENERATION & UTILISATION Net borrowings at beginning of the year (6 242,1) Cash EBITDA 3 640,5 Increase in creditors 116,8 Other net investing activities 22,9 Cash generated 3 780,2 Taxation paid (921,8) Funds reinvested in the business for growth (2 679,6) Receivables increase (534,2) Inventory increase (1 092,0) Capital expenditure (901,0) Acquisition of Whistles and Colette, net of cash (152,4) Net cash flows from share incentive scheme transactions (175,5) Cash utilised (3 776,9) Forex (movement on revaluation of Phase Eight debt) (290,3) (6 529,1) Dividends paid (747,8) Net borrowings at the end of the year (7 276,9) Sound cash EBITDA of R3 640,5 million ( 2015: R2 849,3 million) Growth of 27,8% Capex at R901,0 million further detail provided on next slide 31 CAPEX 2015 Stores 426,6 293,5 IT 310,0 268,3 Phase Eight* 117,6 21,3 Other 46,8 86,7 Total 901,0 669,8 * Phase Eight spend in 2015 financial year only since acquisition (February 2015) In line with our strategy of growing floor space and market share, the majority of capex relates to opening of new stores Mall of Africa & Mall of The South Increased investment in Sports division with 74 stores opening this year ( 2015: 30 stores) Ongoing investment in IT retail and support systems Investment in additional capacity: Expanding manufacturing capacity Caledon 32 16

19 TFG FINANCIAL SERVICES TFG FINANCIAL SERVICES: INDUSTRY REVIEW Consumer credit index dropped below 50%, reflection of the stress of credit customers Absolute value of household disposable incomes remained higher than in 2014 Subsequent interest rate increases and inflationary pressures have led to sustained pressure on consumers Key economic factors expected going forward: Increasing interest rate environment Reduced disposable income and increased unemployment Increased inflationary pressures Flat GDP growth Proof of Income and Affordability requirements have negatively impacted on our new account growth 34 17
20 TFG FINANCIAL SERVICES: CREDIT PERFORMANCE 2015 % change Interest income 1 510, ,7 12,9% Net bad debt (947,7) (1 023,6) (7,4%) Credit costs (242,9) (220,4) 10,2% EBIT 320,1 93,7 241,6% Interest income Gross book growth of 7,4% ( 2015: 8,5%) Repo rate increases in July 2015 (25 bps), November 2015 (25 bps), January (50bps) and (25bps) Net bad debt and impairment decrease by 7,4% ( 2015: +9,4%) Growth in bad debt slows to 11,4% ( 2015: 19,3%) Lower book growth continues to result in lower impairment charge Credit costs increase by 10,2% ( 2015: 19,2%) Rollout of enhanced security store card accelerated and complete Disputed transactions reduced significantly by 67,3% ( 2015: 5,4% reduction) Investment in retail and credit analytics Collections costs reduced by 7,3% ( 2015: 5,5% increase) Additional ecommerce investment due to launch of 3 brands 35 TFG FINANCIAL SERVICES: CREDIT BOOK Key debtors statistics 2015 % change Number of active accounts ( 000) 2 560, ,5 (4,4%) Credit sales as a % of total retail sales (Africa only) 51,7 54,4 Net debtors book 6 695, ,9 8,0% Active accounts reduce by 4,4% as affordability regulations impact application volumes Credit turnover growth rate for the year improves to 5,9% ( 2015: 4,3%) 1 st half: 6,8% 2 nd half: 5,1% Net debtors book growth for the year has increased to 8,0% ( 2015: 7,0%) 36 18
21 TFG FINANCIAL SERVICES: CREDIT STATISTICS Key debtors statistics 2015 Overdue values % to debtors book 14,0 14,6 Net bad debt write off as a % of credit transactions 8,0 8,0 Net bad debt write off as a % of debtors book 13,4 13,6 Doubtful debt provision as a % of debtors book 13,2 13,6 % able to purchase 81,0 80,9 Improvements in early collections figures reduce overdue portion of debtors balances at statement month end to 14,0% Strong collections and recoveries performance results in improved net bad debt to book ratio of 13,4% Provisioning decreased in line with bad debt experience and improved book construct 37 TFG FINANCIAL SERVICES: CUSTOMER VALUE ADDED PRODUCTS 2015 % change Publishing net income Insurance net income Mobile one2one airtime net income EBIT 182,1 176,8 3,0 198,1 205,3 (3,5) 57,4 68,8 (16,6) 437,6 450,9 (2,9) Negative growth in the opening of new credit accounts impacting on target market due to Affordability Regulations Publishing income Net income growth achieved as a result of cost savings given use of digital marketing and estatements Leading seller in a number of publication segments Two new magazines launched to bring total publications to 13 Insurance income Competitive pricing is well below anticipated regulatory limits Competitive industry One2one Mobile airtime market remains extremely competitive Strong focus on operational excellence and sales Investment in supporting technology and marketing to cash customer base to provide growth going forward 38 19

22 TFG FINANCIAL SERVICES: STRATEGY Challenge Strategy Regulatory environment Increasing use of digital applications system Continual process improvement to increase ease of account opening Credit sales and new account growth Invitational mailings to credit unaware population Investment in analytics and credit capabilities to target growth Rewards initiatives specifically for credit customers Cost of doing business increased Improve efficiencies to fund strategic projects Introduction of monthly service fee Value added product growth Target cash customer base Bundled product offerings 39 INTERNATIONAL EXPANSION 20
23 INTERNATIONAL EXPANSION VISION To be the leading fashion retailer in Africa whilst growing our international footprint WHY Constantly looking for profitable growth opportunities Limited meaningful acquisition opportunities in South Africa Leveraging 92 years of retail experience, systems, infrastructure and brands INTERNATIONAL EXPANSION STRATEGY Underpinned by the strict application of the following criteria: Businesses with a competitive advantage Product uniqueness Business model Clear international rollout strategy High quality management team that is committed to future growth BENEFITS OF GROWING OUR INTERNATIONAL FOOTPRINT Creating value for our shareholders through: Diversification Leveraging our retail experience Additional profit and value created ZAR hedge 41 INTERNATIONAL EXPANSION (CONTINUED) Y1 deliverables: all strategic initiatives achieved Continued UK and international rollout with 108 new outlets opening during the year including 4 new countries (10 outlets closed) Successful launch of One Stock Launch of Studio 8 Development of wholesale model Bedding down of integration of people and processes Delivery of hardcurrency growth Performance for the year: Revenue = R3,6bn Operational EBITDA = 26m (2015 = 24,6m) Earnings accretive in constant currency Y1 Currently trading out of 542 outlets in 23 countries Strategy & outlook: Continued UK and international rollout Launch of TFG Jewellery in UK Integration of Whistles management team and rollout of Phase Eight model into Whistles 42 21


24 INTERNATIONAL EXPANSION CONTINUED WHISTLES Rationale: Strong brand equity Opportunistic acquisition Unique product proposition Clear growth opportunity Obvious synergies with Phase Eight Overview of business: A leading British contemporary fashion brand for men and women Established in 1974 and headquartered in London, United Kingdom The company currently operates through 121 outlets internationally Transaction detail: Purchase price = 4,6m (R100,8m) Enterprise value = 8,8m (R191,1m) Ownership 100% through UK subsidiary, Phase Eight Strategy Realise synergies and economies of scale Leverage existing Phase Eight management and business model 43 KEY PERFORMANCE INDICATORS 22
 28% 30% 23,9 23,4 Space growth (TFG excluding international) (%) 6% 6,6 6,7 Number of rewards customers cash (million) 5,0 5,4 3,6 Number of rewards customers credit (million) 3,5 2,9 2,7 Number")
25 KEY PERFORMANCE INDICATORS 2021 target 2015 Turnover (Rbn) R39 bn 21,1 16,1 Gross margin (%) 47% 48% 49,7 47,3 Operating margin (%) 17% 19% 17,0 17,5 Debt equity ratio recourse (%) 40% 55,6 56,6 ROE (%) 28% 30% 23,9 23,4 Space growth (TFG excluding international) (%) 6% 6,6 6,7 Number of rewards customers cash (million) 5,0 5,4 3,6 Number of rewards customers credit (million) 3,5 2,9 2,7 Number of stores SA Number of stores Africa Number of outlets Phase Eight Number of outlets Whistles* 121 * Targetsetting for Whistles will be completed during the 2017 financial year 45 OUTLOOK 23
")
26 OUTLOOK & GUIDANCE FOR 2017 Cash sales Expected to continue at current levels Credit sales Environment likely to remain challenging Impact of the Affordability Regulations will inhibit new account growth Gross margin to be maintained Product inflation anticipated to be around 8% 9% Continued focus on costs and working capital Space growth In excess of 150 stores planned for 2017 (Africa only) Approximately 6% floor space growth Phase Eight approximately 50 new outlets planned for 2017 Whistles approximately 20 new outlets planned for 2017 Continued focus on key strategic initiatives Omnichannel rollout remains on track with Markham, furniture and Foschini cosmetics due to launch online in 2017 Excluding Phase Eight and Whistles, the turnover growth for the first 7 weeks of the current financial year is at similar levels to last year and broadly in line with management s expectations. Both Phase Eight and Whistles are trading ahead of last year and within management s expectations 47 THANK YOU 24
27 CONDENSED CONSOLIDATED STATEMENT OF FINANCIAL POSITION Reviewed Rm Restated 2015 Audited Rm ASSETS Noncurrent assets Property, plant and equipment 2 335, ,2 Goodwill and intangible assets 5 577, ,0 Participation in export partnerships 8,2 8,4 Deferred taxation asset 527,2 354, , ,3 Current assets Inventory 5 116, ,9 Trade receivables retail 6 695, ,9 Other receivables and prepayments 592,9 624,2 Concession receivables 347,2 156,5 Participation in export partnerships 6,2 13,2 Cash 888,8 800, , ,1 Total assets , ,4 EQUITY AND LIABILITIES Equity attributable to equity holders of The Foschini Group Limited 9 896, ,9 Noncontrolling interest 4,0 2,7 Total equity 9 900, ,6 LIABILITIES Noncurrent liabilities Interestbearing debt 5 026, ,5 Put option liability 48,1 20,3 Cashsettled share incentive scheme 8,5 0,7 Operating lease liability 238,2 223,1 Deferred taxation liability 435,4 345,2 Postretirement defined benefit plan 217,3 192, , ,4 Current liabilities Interestbearing debt 3 139, ,0 Trade and other payables 3 046, ,0 Operating lease liability 10,8 9,0 Taxation payable 23,7 13, , ,4 Total liabilities , ,8 Total equity and liabilities , ,4 25
28 CONDENSED CONSOLIDATED INCOME STATEMENT Continuing operations Year ended 31 Reviewed Rm Year ended Audited Rm % change Revenue , ,0 Retail turnover , ,9 31,2 Cost of turnover (10 613,1) (8 484,2) Gross profit , ,7 Interest income 1 533, ,7 Other income 1 105, ,4 Trading expenses (9 537,2) (7 252,7) Operating profit before onceoff acquisition costs and finance costs 3 596, ,1 28,1 Onceoff acquisition costs (65,9) (292,4) Finance costs (509,0) (228,1) Profit before tax 3 021, ,6 Income tax expense (863,9) (748,8) Profit from continuing operations 2 157, ,8 40,3 Discontinued operations Profit from discontinued operations, net of tax RCS Group 86,2 Profit on disposal of discontinued operation RCS Group 273,2 Profit for the year 2 157, ,2 13,7 Attributable to: Continuing operations 2 155, ,4 Discontinued operations 320,6 Equity holders of The Foschini Group Limited 2 155, ,0 Noncontrolling interest 1,7 39,2 Profit for the year 2 157, ,2 Earnings per ordinary share (cents) Continuing operations (excluding onceoff acquisition costs) Basic 1 073,3 893,3 20,2 Headline 1 055,8 897,9 17,6 Diluted (basic) 1 063,4 885,7 20,1 Diluted (headline) 1 046,0 890,3 17,5 Total Basic 1 041,5 909,4 14,5 Headline 1 024,0 780,3 31,2 Diluted (basic) 1 031,9 901,7 14,4 Diluted (headline) 1 014,5 773,7 31,1 Weighted average ordinary shares in issue (millions) 207,0 204,3 26
29 NOTES
30 DISCLAIMER THIS ANNOUNCEMENT CONTAINS CERTAIN FORWARDLOOKING STATEMENTS WITH RESPECT TO THE FINANCIAL CONDITION AND RESULTS OF OPERATIONS OF THE FOSCHINI GROUP LIMITED AND ITS SUBSIDIARIES, WHICH BY THEIR NATURE INVOLVE RISK AND UNCERTAINTY BECAUSE THEY RELATE TO EVENTS AND DEPEND ON CIRCUMSTANCES THAT MAY OCCUR IN THE FUTURE
31
32
RESULTS PRESENTATION
 THE FOSCHINI GROUP LIMITED RESULTS PRESENTATION FOR THE 6 MONTHS ENDED 30 SEPTEMBER RESULTS PRESENTATION FOR THE HALFYEAR ENDED 30 SEPTEMBER AGENDA Economy and retail environment Doug Murray Business
THE FOSCHINI GROUP LIMITED RESULTS PRESENTATION
 THE FOSCHINI LIMITED RESULTS PRESENTATION FOR THE HALF-YEAR ENDED 30 SEPTEMBER 2017 RESULTS PRESENTATION FOR THE HALF-YEAR ENDED 30 SEPTEMBER 2017 AGENDA Doug Murray Chief Executive Officer Anthony Thunstrӧm
ANALYST PRESENTATION FOR THE YEAR ENDED 31 MARCH 2012
 ANALYST PRESENTATION FOR THE YEAR ENDED 31 MARCH 2012 1 TFG ANALYST PRESENTATION MARCH 2012 AGENDA Overview of the economy and retail environment Review of the year Financial review Divisional review Financial
ANALYST PRESENTATION FOR THE HALF-YEAR ENDED 30 SEPTEMBER 2010
 ANALYST PRESENTATION FOR THE HALF-YEAR ENDED 30 SEPTEMBER 2010 1 Agenda The economy and retail environment Review of the period Financial review Divisional review Financial services Outlook Questions Doug
ANALYST PRESENTATION FOR THE YEAR ENDED 31 MARCH
 ANALYST PRESENTATION FOR THE YEAR ENDED 31 MARCH 2010 AGENDA OVERVIEW OF THE ECONOMY AND RETAIL ENVIRONMENT REVIEW OF THE YEAR FINANCIAL OVERVIEW FINANCIAL REVIEW DIVISIONAL REVIEW FOSCHINI DIVISION FINANCIAL
REVIEWED PRELIMINARY CONDENSED CONSOLIDATED FINANCIAL STATEMENTS
 REVIEWED PRELIMINARY CONDENSED CONSOLIDATED FINANCIAL STATEMENTS FOR THE YEAR ENDED 31 MARCH 2018 SALIENT FEATURES +21,4% GROUP RETAIL TURNOVER Group retail turnover up 21,4% (constant currency +23,0%)
ANNUAL FINANCIAL STATEMENTS Directors Responsibility for and Approval of the Consolidated Annual Financial Statements
 Directors Responsibility for and Approval of the Consolidated Annual Financial Statements for the year ended 31 March 2014 ANNUAL FINANCIAL STATEMENTS 2014 TFG / 2014 ANNUAL FINANCIAL STATEMENTS i CONTENTS
CONTENTS. The reports and statements set out below comprise the consolidated annual financial statements presented to the shareholders:
 THE FOSCHINI GROUP LIMITED CONSOLIDATED ANNUAL FINANCIAL STATEMENTS 2016 CONTENTS The reports and statements set out below comprise the consolidated annual financial statements presented to the shareholders:
Summary CONSOLIDATED STATEMENT OF CHANGES IN EQUITY. the foschini group UNAUDITED INTERIM CONDENSED CONSOLIDATED RESULTS
 Summary CONSOLIDATED STATEMENT OF CHANGES IN EQUITY for the years 31 March the foschini group limited UNAUDITED INTERIM CONDENSED CONSOLIDATED RESULTS FOR THE HALF-YEAR ENDED 30 SEPTEMBER 1 Summary CONSOLIDATED
DIRECTORS RESPONSIBILITY FOR AND APPROVAL OF THE CONSOLIDATED AND SEPARATE ANNUAL FINANCIAL STATEMENTS FOR THE YEAR ENDED 31 MARCH 2015
 ANNUAL FINANCIAL STATEMENTS 2015 CONTENTS The reports and statements set out below comprise of the consolidated and separate annual financial statements presented to the shareholders: Directors Responsibility
TFG INTEGRATED ANNUAL REPORT ABOUT THIS REPORT INVESTMENT CASE OUR STRATEGY AND PERFORMANCE OUR PROFILE
 INVESTMENT CASE ABOUT THIS REPORT OUR OUR OPERATING ENVIRONMENT OUR STRATEGY AND PERFORMANCE Summary consolidated statement of financial position 140 Summary consolidated income statement 141 Summary consolidated
APPENDICES NOTICE OF ANNUAL GENERAL MEETING SUMMARY CONSOLIDATED FINANCIAL STATEMENTS OUR GOVERNANCE PROFILE PERFORMANCE REVIEW APPENDICES
 153 INVESTMENT CASE ABOUT THIS REPORT OUR OUR OPERATING ENVIRONMENT OUR STRATEGY AND PERFORMANCE APPENDIX 1: DEFINITIONS Concession arrangement COSO Current ratio Debt to equity ratio Dividend cover Doubtful
RESULTS PRESENTATION FOR THE YEAR ENDED 31 MARCH
 FOR THE YEAR ENDED 31 MARCH 2018 AGENDA OPERATING CONTEXT Doug Murray BUSINESS OVERVIEW FINANCIAL REVIEW Doug Murray Anthony Thunström Doug Murray Chief Executive Officer Anthony Thunström Chief Financial
ANNUAL FINANCIAL STATEMENTS 2013
 www.tfg.co.za ANNUAL FINANCIAL STATEMENTS CONTENTS The reports and statements set out below comprise the financial statements presented to the shareholders: Directors' Responsibility for and Approval of
APPENDICES. TFG INTEGRATED ANNUAL REPORT
 APPENDICES Appendix 1: Definitions 152 Appendix 2: Consolidated performance table 154 Appendix 3: Subsidiary companies 156 Appendix 4: Shareholdings of The Foschini Group Limited 157 Appendix 5: Exchange
integrated annual report 2014
 integrated ANNUAL REPORT 2014 CONTENTS Scope and boundary of report 2 Introducing TFG 5 Corporate Profile 6 Corporate Structure 8 Performance Summary 10 Footprint 11 The industry within which TFG operates
Mr Price Group Limited Interim Results September 2009
 Interim Results September 2009 Total consumer spending contracted sharply Decline in retail sales in real terms for seven consecutive months Household debt to disposable income at historically high levels
Preliminary Results Announcement. Year ended December 2002
 Preliminary Results Announcement Year ended December 2002 Financial Highlights Turnover up 9.8m to 133.5m, a 7.9% increase, 12.4% at constant currency Operating margin on continuing operations up from
FRENCH CONNECTION GROUP PLC
 13 March FRENCH CONNECTION GROUP PLC Preliminary Results for the year ended 31 January French Connection Group PLC ("French Connection" or "the Group") today announces results for its financial year ended
HALF-YEAR 2016 INVESTOR PRESENTATION
 HALF-YEAR 2016 INVESTOR PRESENTATION AGENDA 1. Performance Highlights HY2016 2. P&L and B/S Details HY2016 3. Outlook Environment 2016 Investor Presentation HY2016 July 22, 2016 2 PERFORMANCE HIGHLIGHTS
BURBERRY IN A SNAPSHOT
 BURBERRY IN A SNAPSHOT B R I T I S H L U X U R Y B R A N D O V E R 1 0, 0 0 0 E M P L O Y E E S W O R L D W I D E Authentic British heritage Made in England Founded in 1856 by Thomas Burberry F T S E 1
UNAUDITED INTERIM GROUP RESULTS FOR THE 26 WEEKS ENDED 29 SEPTEMBER 2018, CASH DIVIDEND DECLARATION
 MR PRICE GROUP LIMITED Registration number 1933/004418/06 Incorporated in the Republic of South Africa ISIN: ZAE 000200457 JSE share code: MRP ( Mr Price or the Company or the Group ) UNAUDITED INTERIM
COMMENTARY. Relative to the pro forma comparable 52-week prior period (refer to note 15).
.") PRELIMINARY REPORT ON THE AUDITED GROUP ANNUAL RESULTS for the 52 weeks ended 1 July 2018 KEY FEATURES COMMENTARY Comparable sale of merchandise # down 0.2% to R17.5 billion Sale of merchandise down 2.9%
PRELIMINARY REPORT ON THE AUDITED GROUP ANNUAL RESULTS for the 52 weeks ended 1 July 2018 KEY FEATURES COMMENTARY Comparable sale of merchandise # down 0.2% to R17.5 billion Sale of merchandise down 2.9%
RESULTS PRESENTATION. Year ended 31 May 2014 IG FY14 RESULTS PRESENTATION P1
 RESULTS PRESENTATION Year ended 31 May 2014 IG FY14 RESULTS PRESENTATION P1 DISCLAIMER This presentation, prepared by IG Group Holdings plc (the Company ), may contain forward-looking statements about
Interim Results 29 September 2018
 Page 0 Interim Results - Supplementary Information 26 weeks ended 29 September 2018 Index Page Results (Press) announcement 2 Press release 3 Interim cash dividend declaration 4 Unaudited results for the
For personal use only. JB Hi-Fi Limited. HY18 Results Presentation
 JB Hi-Fi Limited HY8 Results Presentation 5 FEBRUARY AUGUST 06 08 PAGE Agenda. Group Performance Overview. JB HI-FI 3. The Good Guys 4. Group Balance Sheet and Cash Flow 5. Outlook Richard Murray Group
Interim results FY2018 GROUP HIGHLIGHTS
 01 Interim results FY2018 GROUP HIGHLIGHTS Trading environment overview Sept 17 headline CPI 5.1% (avg March Sept 5.1%) Interest rates between 10.25% & 10.50% since Jan 16 Labour force up 696k (employed
Unaudited results. for the six months ended 30 November ISIN: ZAE Share code: ARH. ARB Holdings Limited
 www.arbhold.co.za ARB Holdings Limited Registration number: 1986/002975/06 Share code: ARH ISIN: ZAE000109435 ( ARB or the Company or the Group ) for the six months ended 30 November 2016 Unaudited results
For personal use only. Lovisa Holdings Limited 2019 HALF YEAR
 Lovisa Holdings Limited 2019 HALF YEAR SHANE FALLSCHEER CHRIS LAUDER MANAGING DIRECTOR CHIEF FINANCIAL OFFICER Some of the information contained in this presentation contains forward - looking statements
Year-end results. 18 May
 Year-end results 18 May Highlights for the year Strong operational performance Good performance across all areas of activity Deepened our core franchise Sound levels of corporate client and private client
AUDITED CONSOLIDATED ANNUAL FINANCIAL STATEMENTS
 AUDITED CONSOLIDATED ANNUAL FINANCIAL STATEMENTS 2018 COMPANY INFORMATION The reports and statements set out below comprise the consolidated annual financial statements presented to the shareholders: 1
DIRECTORATE EXECUTIVE
 TFG S DIRECTORATE & EXECUTIVE MANAGEMENT DIRECTORATE DIRECTORATE EXECUTIVE A D Murray (58) BA, CA Appointed: 2007 Member of: Risk and Social and Ethics committees Meetings attended by invitation: Audit,
Edgars 3.3% CNA 9.9% Discount Division 11.8%
 Results for the year ended dd 28 March 2009 Q4 FY 2009 Excluding consolidation of OtC 2 Highlights for 4 th Quarter FY 2009 Retail sales up 7.3% to R4.6bn Divisional retail sales growth: Total Edgars 3.3%
Annual Results to 31 st January 2014
 Annual Results to 31 st January 2014 o Improvement in performance and key trends o Turnaround gathered momentum in H2 as initiatives gained traction o New team performing well o Reduced operating expenses
Investor Meeting Presentation
 Investor Meeting Presentation November 2014 Investor Meeting Presentation HUGO BOSS November 2014 2 / 54 Agenda Update on Key Strategic Initiatives Nine Months Results 2014 Outlook Investor Meeting Presentation
Presentation of consolidated results. For the 52 weeks ended 30 March 2013
 Presentation of consolidated results For the 52 weeks ended 30 March 2013 1 Agenda Strategic and operational update Financial review Looking forward Jürgen Schreiber CEO Mark Bower Deputy CEO & CFO Jürgen
MAISONS DU MONDE: FULL-YEAR 2018 RESULTS
 PRESS RELEASE MAISONS DU MONDE: FULL-YEAR 2018 RESULTS Strong performance in line with targets Continued solid momentum in online and international sales Focus on strategic pillars to deliver further profitable
TELECONFERENCE Q2 2018
 TELECONFERENCE Q2 2018 Copenhagen, 9 August 2018 1 Disclaimer Certain statements in this presentation constitute forwardlooking statements. Forward-looking statements are statements (other than statements
TWELVE MONTHS END 31 MARCH 2018 MARCO GOBBETTI
 TWELVE MONTHS END 31 MARCH 2018 MARCO GOBBETTI CHIEF EXECUTIVE OFFICER 1 AGENDA INTRODUCTION FINANCIAL RESULTS GUIDANCE STRATEGIC UPDATE Q&A FY 2018 HIGHLIGHTS Results in line with our expectations Group
MR PRICE GROUP LTD Sector: Consumer Discretionary Max Sector Weight: 32%
 Company Results Analysis 24 November 2017 Recommendation: Underweight JSE Capped SWIX weighting: 0.80% Recommended Exposure: 0% JSE Code: MRP Current Share Price: ZAR 20700c MR PRICE GROUP LTD Sector:
INTERIM REPORT FOURTH QUARTER 2017 PANDORA REPORTS 15% REVENUE GROWTH IN LOCAL CURRENCY FOR 2017 AND 37.3% EBITDA MARGIN
 PANDORA A/S Havneholmen 17-19 DK-1561 Copenhagen V Denmark Tel. +45 3672 0044 www.pandoragroup.com CVR: 28 50 51 16 No. 431 COMPANY ANNOUNCEMENT 6 February 2018 INTERIM REPORT FOURTH QUARTER 2017 PANDORA
Annual Results. 12 months ended 28 February Agenda
 Annual Results 28 ruary 2015 Bridging y expectations Agenda 2015 2014 2 1 12 month overview Phase 1 of turnaround strategy successfully implemented Closed-out problem contracts Closed non-performing Power
ESPRIT HOLDINGS LIMITED (Incorporated in Bermuda with limited liability) (Stock Code: 00330)
 (Stock Code: 00330)") Hong Kong Exchanges and Clearing Limited and The Stock Exchange of Hong Kong Limited take no responsibility for the contents of this announcement, make no representation as to its accuracy or completeness
Hong Kong Exchanges and Clearing Limited and The Stock Exchange of Hong Kong Limited take no responsibility for the contents of this announcement, make no representation as to its accuracy or completeness
Roadshow London // Deutsche Bank
 Roadshow London // Deutsche Bank HUGO BOSS Company Handout August 6, 2014 Mark Langer (CFO) & Dennis Weber (Head of Investor Relations) Roadshow London // Deutsche Bank HUGO BOSS August 6, 2014 2 / 52
For personal use only. JB Hi-Fi Limited. HY17 Results Presentation
 JB Hi-Fi Limited HY7 Results Presentation 3 5 FEBRUARY AUGUST 06 07 PAGE Agenda. Group Performance Overview. JB HI-FI 3. The Good Guys 4. Stores 5. Group Balance Sheet and Cash Flow 6. Outlook Richard
AEGIS GROUP PLC 2008 ANNUAL RESULTS. 19 March 2009
 AEGIS GROUP PLC 2008 ANNUAL RESULTS 19 March 2009 AGENDA OVERVIEW OF RESULTS John Napier FINANCIAL REVIEW Alicja Lesniak OUTLOOK John Napier Q&A Aegis Group plc Page 2 OVERVIEW OF RESULTS John Napier,
FINAL RESULTS ANNOUNCEMENT FOR THE YEAR ENDED 31 MARCH 2010 FINANCIAL HIGHLIGHTS. Own stores number reached 764, increased by 11.
 Hong Kong Exchanges and Clearing Limited and The Stock Exchange of Hong Kong Limited take no responsibility for the contents of this announcement, make no representation as to its accuracy or completeness
HSBC Holdings plc Annual Results
 HSBC Holdings plc Forward-looking statements This presentation and subsequent discussion may contain certain forward-looking statements with respect to the financial condition, results of operations and
Wedbush Morgan California Dreamin Santa Monica, CA December 9, 2008
 Wedbush Morgan California Dreamin 2008 Santa Monica, CA December 9, 2008 GUESS?, Inc. Carlos Alberini President & Chief Operating Officer 2 Safe Harbor Statement Except for historical information contained
Income Statement + 2.2% + 7.2% + 3.9% + 14% EPS 142.1p 118.5p + 20% Dividend per share 36.0p 31.0p + 16% Full Price
 July 2013 Income Statement m July 2013 July 2012* Revenue 1,677 1,640 Operating profit 285 266 Interest (13) (15) Profit before tax 272 251 Taxation (55) (60) Profit after tax 217 191 + 2.2% + 7.2% + 14%
ANNUAL RESULTS FOR THE YEAR ENDED 31 AUGUST 2017
 ANNUAL RESULTS FOR THE YEAR ENDED 31 AUGUST 2017 PRESENTATION OUTLINE Review of the year Financial results Trading performance Outlook Questions 2 REVIEW OF THE YEAR DAVID KNEALE REVIEW OF THE YEAR Strong
HUGO BOSS Nine Months Results 2014
 HUGO BOSS Nine Months Results 2014 Mark Langer (CFO) Metzingen, November 4, 2014 Conference Call, Nine Months Results 2014 HUGO BOSS November 4, 2014 2 / 27 BOSS Womenswear fashion show in New York receives
Interim Results. Six months ended 31 August 2016
 Interim Results Six months ended 31 August 2016 Stefanutti Stocks City A multi-disciplinary construction group (Vision) (Mission) 2 www.stefanuttistocks.com y 2 Agenda Six month overview Operational Overview
TELECONFERENCE Q3 2017
 AGENDA BUSINESS HIGHLIGHTS FINANCIAL REVIEW QUESTIONS AND ANSWERS 2 DISCLAIMER Certain statements in this presentation constitute forward-looking statements. Forward-looking statements are statements (other
Roadshow Zurich // MainFirst. HUGO BOSS Company Handout August 6, Roadshow Zurich // MainFirst HUGO BOSS August 7, / 52
 Roadshow Zurich // MainFirst HUGO BOSS Company Handout August 6, 2014 Roadshow Zurich // MainFirst HUGO BOSS August 7, 2014 2 / 52 Agenda Half Year Results 2014 Update on Key Strategic Initiatives Outlook
Roadshow Scandinavia // equinet
 Roadshow Scandinavia // equinet HUGO BOSS Company Handout August 12-14, 2014 Dennis Weber, Head of Investor Relations Roadshow Scandinavia // equinet HUGO BOSS August 12-14, 2014 2 / 52 Agenda Half Year
DUNA HOUSE GROUP Highlights. March 2018
 DUNA HOUSE GROUP 2017 Highlights March 2018 DISCLAIMER This presentation shall not be considered as an offer or an invitation to tender concerning the purchase, subscription or any other transaction of
Investor Presentation Q Results. 9 May 2018
 Investor Presentation Q1 2018 Results 9 May 2018 Forward-looking statements This presentation contains forward-looking statements, including, but not limited to, the statements and expectations contained
Esprit Holdings Limited
 Continuing Growth for Esprit Holdings Limited FY00/01 Interim Results February 28, 2001 www.esprit-intl.com DISCLAIMER: This presentation is not to be construed as an offer to sell or the solicitation
Roadshow Frankfurt // Kepler Cheuvreux
 Roadshow Frankfurt // Kepler Cheuvreux HUGO BOSS Company Handout August 5, 2014 Mark Langer (CFO) & Dennis Weber (Head of Investor Relations) Roadshow Frankfurt // Kepler Cheuvreux HUGO BOSS August 5,
SUMMARY OF AUDITED GROUP RESULTS AND FINAL CASH DIVIDEND DECLARATION FOR THE 52 WEEKS ENDED 28 MARCH 2015
 MR PRICE GROUP LIMITED Registration number 1933/004418/06 Incorporated in the Republic of South Africa ISIN: ZAE 000026951 JSE share code: MPC ( Mr Price or the Company or the Group ) SUMMARY OF AUDITED
H & M Hennes & Mauritz AB
 H & M Hennes & Mauritz AB Three-month report 1 December 2013 28 February 2014 First quarter The H&M Group s sales including VAT increased in local currencies by 12 percent during the first quarter. Converted
TELECONFERENCE FY 2017
 TELECONFERENCE COPENHAGEN, 6 FEBRUARY 2018 1 Disclaimer Certain statements in this presentation constitute forwardlooking statements. Forward-looking statements are statements (other than statements of
3 rd quarter back to growth in September. Robert Jan van de Kraats, CFO. Randstad Holding nv October 31, 2013
 3 rd quarter 2013 back to growth in September Robert Jan van de Kraats, CFO Randstad Holding nv disclaimer & definitions Certain statements in this document concern prognoses about the future financial
SUMMARY GROUP RESULTS AND FINAL CASH DIVIDEND DECLARATION FOR THE 52 WEEKS ENDED 31 MARCH 2018
 MR PRICE GROUP LIMITED Registration number 1933/004418/06 Incorporated in the Republic of South Africa ISIN: ZAE 000200457 JSE share code: MRP ( Mr Price or the Company or the Group ) MR PRICE GROUP LIMITED
JB Hi-Fi Limited. Half Year Results Presentation. 31 December 2003
 JB Hi-Fi Limited Half Year Results Presentation 31 December 2003 AGENDA Highlights 6 months 31 December 2003 2004 Focus Chief Executive Officer Richard Uechtritz Chief Financial Officer Richard Murray
FRENCH CONNECTION GROUP PLC
 19 September FRENCH CONNECTION GROUP PLC Interim Results for the six month period ending Improved performance across all divisions French Connection Group PLC ("French Connection" or "the Group") today
For personal use only 2017 ANNUAL GENERAL MEETING
 2017 ANNUAL GENERAL MEETING 1 ANNUAL GENERAL MEETING Welcome to the Annual General Meeting of Lovisa Holdings Limited Michael Kay Non Executive Independent Chairman FY2017 HIGHLIGHTS FY2017 SNAPSHOT EBIT
Agenda. Review of the period Financial review. Credit management Strategic focus areas Outlook. Group. Truworths. Office Retail Group
 GROUP INTERIM RESULTS for the 26 weeks ended 27 December 2015 Agenda Review of the period Financial review Group Truworths Office Retail Group Credit management Strategic focus areas Outlook 2 Review of
FIVE-YEAR CONSOLIDATED SUMMARY OF PROFITS
 Clicks Group five-year review 2017 FIVE-YEAR CONSOLIDATED SUMMARY OF PROFITS for the year ended 31 August R million Turnover 11.7% 26 809 24 171 22 070 19 150 17 543 Cost of merchandise sold 12.1% (21
Interim Results 1 October 2016
 Interim Results 1 October 2016 Page 0 Interim Results - Supplementary Information 26 weeks ended 1 October 2016 Index Page Results (Press) announcement 2 Press release 3 Interim cash dividend declaration
HUGO BOSS First Half Year Results 2014
 HUGO BOSS First Half Year Results 2014 Claus-Dietrich Lahrs (CEO), Mark Langer (CFO) Metzingen, July 31, 2014 Conference Call, First Half Year Results 2014 HUGO BOSS July 31, 2014 2 / 42 Agenda Half Year
Unaudited group. for the 26 weeks ended 25 December 2016
 group interim REPORT for the 26 weeks ended 25 December Commentary key features Group, including Office Group, excluding Office Retail sales up 21% unchanged Gross margin 52.6% 55.0% Operating margin 24.9%
Ulf Santjer, Tel Dieter Bock, Tel
 For immediate release MEDIA CONTACT: INVESTOR CONTACT: Ulf Santjer, Tel. +49 9132 81 2489 Dieter Bock, Tel. +49 9132 81 2261 Herzogenaurach, Germany, February 10, 2006 PUMA AG announces its consolidated
Results presentation. for the 26 weeks ended 26 August 2018
 Results presentation for the 26 weeks ended 26 August 2018 Agenda Chairman s introduction Gareth Ackerman Chairman Results overview Bakar Jakoet Chief Finance Officer Progress on our plan Richard Brasher
TELECONFERENCE FY 2014 FINANCIAL RESULTS
 TELECONFERENCE FY 2014 FINANCIAL RESULTS 10:00 CET, 17 February 2015 1 DISCLAIMER Certain statements in this presentation constitute forward-looking statements. Forward-looking statements are statements
TRELLIDOR HOLDINGS LIMITED UNAUDITED INTERIM RESULTS FOR THE SIX MONTHS ENDED 31 DECEMBER 2017
 TRELLIDOR HOLDINGS LIMITED UNAUDITED INTERIM RESULTS FOR THE SIX MONTHS ENDED 31 DECEMBER 2017 GROUP HIGHLIGHTS 5% Revenue 5% PAT 5% HEPS 35.2c 5% Interim dividend declared 11.0 cents per share Slide 2
MTN Group Limited Results presentation for the six months ended 30 June 2017
 MTN Group Limited Results presentation for the six months ended 30 June 2017 Disclaimer The information contained in this document has not been verified independently. No representation or warranty express
BREADTALK GROUP LIMITED. Financial Statement and Dividend Announcement For The Year Ended 31 December 2008
 BREADTALK GROUP LIMITED Financial Statement and Dividend Announcement For The Year Ended 31 December 2008 PART I - INFORMATION REQUIRED FOR ANNOUNCEMENTS OF QUARTERLY (Q1, Q2 & Q3), HALF-YEAR AND FULL
Truworths International Ltd. 10 year review, ratios,
 Ltd year review, ratios, share statistics and definitions review, ratios, share statistics and definitions Ten-year review growth % 201* Statements of comprehensive income Sale of merchandise 12 17 47
Investor Presentation HY2017. Maître Chocolatier Suisse Depuis 1845
 Investor Presentation HY2017 Agenda 1. Performance Highlights HY2017 2. P&L and B/S Details HY2017 3. Outlook 2017 Investors Presentation HY2017 July 25th, 2017 2 Performance Highlights HY2017 P&L Statement
Investor Meeting Presentation
 September 2015 HUGO BOSS September 2015 2 Agenda Financial Review First Half Year 2015 Strategic Outlook 2015 and beyond Financial Outlook 2015 HUGO BOSS September 2015 3 Agenda Financial Review First
Summary of Consolidated Financial Statements for Second Quarter of Fiscal Year Ending March 31, 2018(Japan GAAP)
") Summary of Consolidated Financial Statements for Second Quarter of Fiscal Year Ending March 31, 2018(Japan GAAP) November 10, 2017 Listed Exchanges: TSE Name of Listed Company: Ishihara Sangyo Kaisha,
Summary of Consolidated Financial Statements for Second Quarter of Fiscal Year Ending March 31, 2018(Japan GAAP) November 10, 2017 Listed Exchanges: TSE Name of Listed Company: Ishihara Sangyo Kaisha,
Double Tax Treaties. Necessity of Declaration on Tax Beneficial Ownership In case of capital gains tax. DTA Country Withholding Tax Rates (%)
") Double Tax Treaties DTA Country Withholding Tax Rates (%) Albania 0 0 5/10 1 No No No Armenia 5/10 9 0 5/10 1 Yes 2 No Yes Australia 10 0 15 No No No Austria 0 0 10 No No No Azerbaijan 8 0 8 Yes No Yes
Double Tax Treaties DTA Country Withholding Tax Rates (%) Albania 0 0 5/10 1 No No No Armenia 5/10 9 0 5/10 1 Yes 2 No Yes Australia 10 0 15 No No No Austria 0 0 10 No No No Azerbaijan 8 0 8 Yes No Yes
Planning Global Compensation Budgets for 2018 November 2017 Update
 Planning Global Compensation Budgets for 2018 November 2017 Update Planning Global Compensation Budgets for 2018 The year is rapidly coming to a close, and we are now in the midst of 2018 global compensation
AXA 2016 HALF YEAR EARNINGS. Press Conference. Paris - August 3, 2016
 AXA 2016 HALF YEAR EARNINGS Press Conference Paris - August 3, 2016 Certain statements contained herein are forward-looking statements including, but not limited to, statements that are predictions of
HUGO BOSS First Nine Months Results 2011
 HUGO BOSS First Nine Months Results 2011 Mark Langer (CFO) November 2, 2011 Conference Call, First Nine Months Results 2011 HUGO BOSS November 2, 2011 2 / 30 AGENDA OPERATIONAL HIGHLIGHTS FIRST NINE MONTHS
Investor pre-close briefing. 15 September
 Investor pre-close briefing 15 September Proviso Please note that matters discussed in today s presentation may contain forward looking statements which are subject to various risks and uncertainties and
TELECONFERENCE Q FINANCIAL RESULTS
 TELECONFERENCE FINANCIAL RESULTS 10:00 CET, 12 August 2014 1 AGENDA AGENDA Business highlights: Key developments in Market development and sales-out Performance of newly launched products Guidance 2014
INVESTOR MEETING PRESENTATION. Investor Meeting Presentation
 1 Investor Meeting Presentation 2 AGENDA 1 Full Year 2018 Results & Outlook 2019 2 2022 Strategy 3 Backup 3 Group sales (in EUR million) EBITDA (before special items) (in EUR million) 2,733 4%* 2,796 0%
Bernstein Strategic Decisions Conference // London
 Bernstein Strategic Decisions Conference // London HUGO BOSS Company Handout September 17, 2014 Dennis Weber, Head of Investor Relations Bernstein Strategic Decisions Conference // London HUGO BOSS September
EDCON HOLDINGS LIMITED ( EDCON ) UNAUDITED CONDENSED CONSOLIDATED FINANCIAL STATEMENTS AND QUARTERLY REPORT
 UNAUDITED CONDENSED CONSOLIDATED FINANCIAL STATEMENTS AND QUARTERLY REPORT") 26 February 2016 This notice is important and requires your immediate attention. EDCON HOLDINGS LIMITED ( EDCON ) UNAUDITED CONDENSED CONSOLIDATED FINANCIAL STATEMENTS AND QUARTERLY REPORT FOR THE NINE-MONTH
26 February 2016 This notice is important and requires your immediate attention. EDCON HOLDINGS LIMITED ( EDCON ) UNAUDITED CONDENSED CONSOLIDATED FINANCIAL STATEMENTS AND QUARTERLY REPORT FOR THE NINE-MONTH
Full-Year 2016 Results
 7 Full-Year 2016 Results This version published on March 24 th, 2017 solves a printing problem on page 8 of the version dated March 2 nd, 2017 and put online at this date Adjusted revenue up +5.8% to 3,392.8
TRELLIDOR HOLDINGS LIMITED AUDITED RESULTS FOR THE YEAR ENDED 30 JUNE 2016
 TRELLIDOR HOLDINGS LIMITED AUDITED RESULTS FOR THE YEAR ENDED 30 JUNE 2016 OVERVIEW Trellidor is the market leading manufacturer of custom made barrier security products Distribution through dedicated
InterContinental Hotels Group PLC First Quarter Results to 31 March 2010
 InterContinental Hotels Group PLC First Quarter Results to Financial results % change % change CER Total Excluding LDs 1 Total Excluding LDs 1 Revenue 2 $362m $351m 3% 4% 0% 1% Operating profit 2 $83m
Summary of Consolidated Financial Statements for First Quarter of Fiscal Year Ending March 31, 2018(Japan GAAP)
") Summary of Consolidated Financial Statements for First Quarter of Fiscal Year Ending March 31, 2018(Japan GAAP) August 10, 2017 Listed Exchanges: TSE Name of Listed Company: Ishihara Sangyo Kaisha, Ltd.
Summary of Consolidated Financial Statements for First Quarter of Fiscal Year Ending March 31, 2018(Japan GAAP) August 10, 2017 Listed Exchanges: TSE Name of Listed Company: Ishihara Sangyo Kaisha, Ltd.
FY2017 RESULTS. 1 February 2017 to 31 January Inditex continues to roll out its global, fully integrated store and online platform.
 FY2017 RESULTS 1 February 2017 to 31 January 2018 Inditex continues to roll out its global, fully integrated store and online platform. Strong operating performance: Net sales for FY2017 reached 25.3 billion,
TELECONFERENCE Q FINANCIAL RESULTS
 TELECONFERENCE FINANCIAL RESULTS 10:00 CET, 11 November 2014 1 12 AUGUST 2014 AGENDA AGENDA Business highlights: Key developments in Market development and sales-out Performance of newly launched products
Interim Results 17 November 2011
 Interim Results 17 November 2011 Alan Parker Executive Chairman First 100 days Considerations: Group leadership and strategy Business model, at home and abroad Customer attraction in different markets
SPREADING PARISIAN CHIC ACROSS THE WORLD. December, 2017
 SPREADING PARISIAN CHIC ACROSS THE WORLD December, 2017 TODAY S TEAM Daniel Lalonde President & CEO Philippe Gautier CFO & Operations Director / 2 OUR INTERNATIONAL SUCCESS STORY #1 CREATION OF SANDRO