2011 Annual Results. November 2011
|
|
|
- Gyles Murphy
- 6 years ago
- Views:
Transcription

1 2011 Annual Results November
2 Agenda Highlights Group results Operational review Strategic review 2
3 Highlights HEPS from continuing operations up 21% Dividend increased by 30% to 108 cents per share Operating profit from continuing operations up 22% Trading margin improved from 9.1% to 9.8% Net debt reduced from R1.7bn to R0.6bn (March 09 R3.4bn) Gearing reduced to 10% (March 09 58%) Corrugated returned to profit RONA increased from 19% to 20% Dividend yield 5.0% 3
4 4 GROUP RESULTS
5 Group Income Statement Continuing operations Rm % Revenue Operating profit Net finance costs Income from investments Profit before tax Taxation Profit for the period from continuing operations Discontinued operations Profit for the period HEPS continuing 172.4c 142.3c 21 HEPS continuing and discontinued 176.0c 149.7c 18 5
6 Abnormal Items Rm 2011 Impairment of goodwill, plant, property & investments 105 Retrenchment and restructuring 50 Net loss on disposal of businesses 5 Fair value of financial instruments 71 Net profit on disposal of properties 41 TOTAL 48 6
7 Tax Rate (continuing) Rm 2011 Profit before tax Tax 456 Effective tax rate 32.8 Tax rate differential 3.0 Exempt income 2.0 Government incentives 1.2 Deferred tax 0.5 Disallowable expenses and impairments 5.2 Secondary tax on companies 4.1 Prior year adjustment 1.2 Withholding taxes 0.7 Share-based payment expense 0.3 Standard tax rate

8 HEPS/Dividends per Share cents % % 172.4c c 142.3c +98% 83c +30% 108c c 0 HEPS Dividends per share
9 Abridged Balance Sheet Rm Non-current assets Bank balances, deposits and cash Current assets TOTAL ASSETS Total equity Loans and borrowings Retirement benefit obligations Current liabilities Other TOTAL EQUITY AND LIABILITIES
10 Group Condensed Cash Flow Rm Cash generated from operations before working capital Working capital changes 548 Cash generated from operations Net interest paid 163 Tax paid 188 Dividends paid 543 Capex 676 Disposal of businesses and properties 930 Other 85 Cash inflow before financing activities Net borrowings repaid and other 591 Net cash inflow
11 Working Capital Movement Rm Inventories 641 Receivables 330 Payables 423 Total increase in working capital

12 Net Debt : Equity 60% 50% 40% 30% 20% 10% 0% Mar-09 Sep-09 Mar-10 Sep-10 Mar-11 Sep-11 12


13 Key Ratios RONA % ROE % Interest Cover X Trading Margin %
14 14 OPERATIONAL REVIEW
15 15 Rm Revenue Metals & Glass H1 H South Africa Rest of Africa Rm Trading profit Margin % H1 H South Africa Rest of Africa Good performance from diversified canning business SA beverage can volumes similar to last year Food can volumes down Lower exports of bottled wine Kenya and Nigeria performed well Trading loss of R48m in Angola

16 Acquisition of Wiegand s 50% Core business and growth market Good margin and returns Price based on a sustainable EBITDA Multiple of 6 X EBITDA Nampak >7 X EBITDA Earnings accretive 16
17 Paper & Flexibles Rm Revenue H1 H South Africa Rest of Africa Rm Trading profit Margin % H1 H South Africa Rest of Africa Corrugated improved performance Excellent result from flexible Weak demand for folding cartons and sacks Kenya, Nigeria and Zambia all performed well Operational issues with commercial business in Nigeria 17
18 18 Plastics Rm Revenue H1 H South Africa Europe Rm Trading profit Margin % H1 H South Africa Europe Good performance by all businesses Tubs sold loss of R46m last year Break-even in Tubes Europe integration costs
19 Tissue Rm Revenue H1 H South Africa Rm Trading profit Margin % H1 H South Africa ply market down 2-ply volumes improved Gained market share in diapers Selling prices and margins under pressure 19
20 Geographical Segmentation Rm Revenue H1 H South Africa Rest of Africa Europe
21 Geographical Segmentation Rm Trading profit Margin % H1 H South Africa Rest of Africa Europe Other
22 Summary of Results HEPS up 21% Dividend up 30% Trading margin improved Debt and gearing both well down Further improvement in returns 22
23 23 STRATEGIC REVIEW
24 Underperforming Operations 20% of Nampak operations were loss-making or earning returns less than hurdle rates, had been in this position for a number of years and had no sustainable competitive advantages Need to fix/sell/close these operations 24
25 Closed or Sold Europe Cartons & Healthcare Foam Flexpak Redibox Disaki Carmoc Mozambique L & CP Containers Tubs Interpak Books 25
26 Cost Reduction High overhead costs Streamlined group executive structure Reduced head office costs Closed freight forwarding & clearing department Outsourced internal audit IT outsourced effective in


27 Debt High debt levels Reduced debt and gearing Rm 0-1,000-2,000-3,000-4,000-5,000 Mar 09 Sep 09 Mar 10 Sep 10 Mar 11 Sep 11 Total Debt Net Debt 27
28 Grow Core Businesses 80% of Nampak operations are profitable and have sustainable competitive advantages in markets in which they operate Need to grow these core businesses 28


29 Bevcan Potential conversion to aluminium cans New slimline/sleek beverage cans Temperature sensitive cans 29

30 DivFood 2 piece food cans Additional aerosol capacity Printing modernisation Ends manufacturing 30


31 31 2-Piece Food Can Expansion

32 32 2 Piece Food Cans

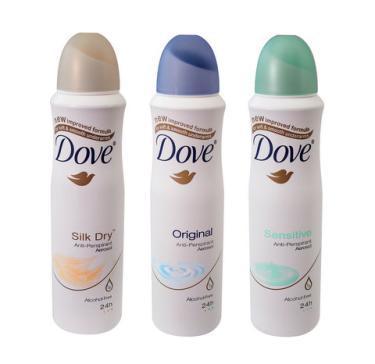
33 33 Aerosol Can Manufacturing Line

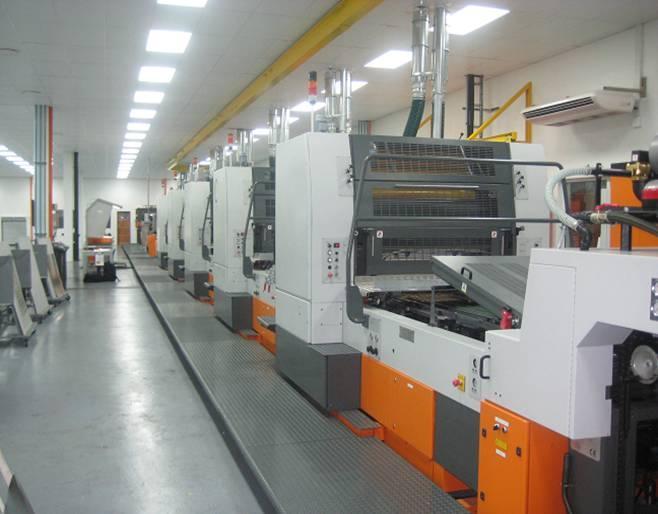
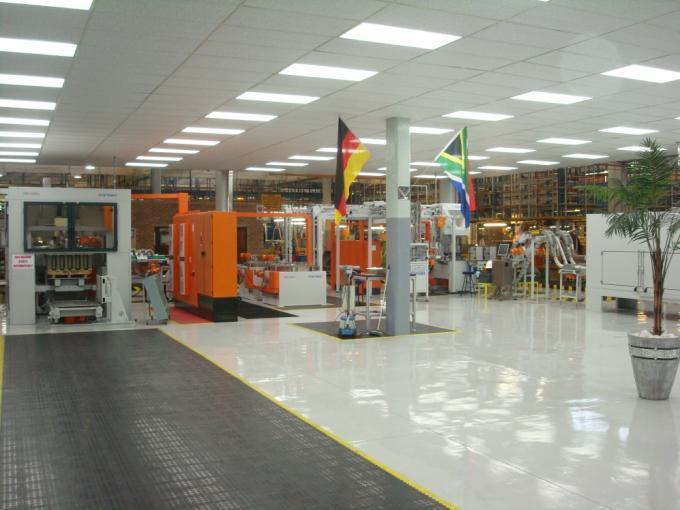
34 Print Modernisation

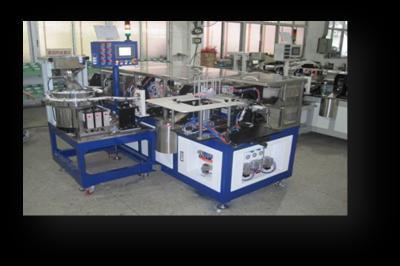
35 END O MAT Line
36 Glass Rebuild of furnace #2 Capacity expansion Acquisition of Wiegand s 50% shareholding R938m 36
37 Acquisition of Wiegand s 50% Glass is a core business and a growth market High barriers to entry both capex and technology Opportunity to grow in South Africa o Market growth o Pack share growth o 3 rd furnace Rest of Africa Environmentally-friendly Financial capability to expand 37


38 Paper & Flexibles Improvement in performance of corrugated o 2009 loss of R242m o 2010 loss of R62m o 2011 return to profitability Rationalisation of production facilities in Cartons & Labels Additional capacity in Flexibles 38

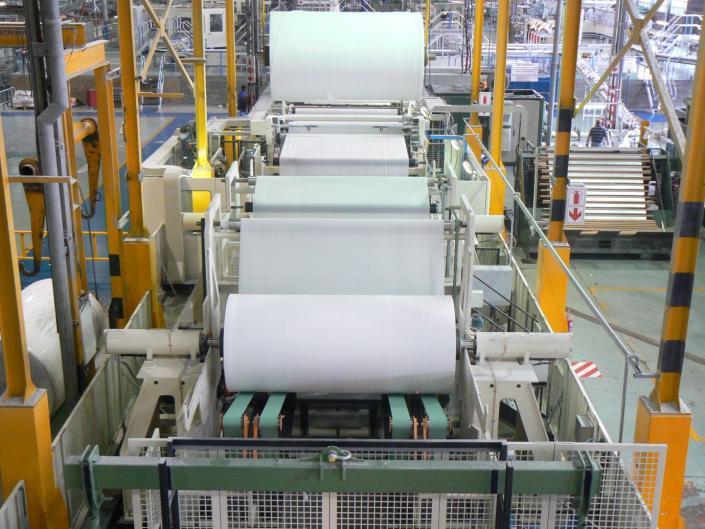
39 Rosslyn Paper Mill : Improved Efficiencies 24% increase in production Proven capability for high performance fluting production 24% 37% reduction in water consumption 33% reduction in starch and chemical consumption 48% 3 rd party maintenance agreement


40 40 Flexibles Pouch Equipment

41 41 Flexibles 7 Layer Co-Extruder
42 Coffee Pouches


43 Plastics New products in Liquid Packaging/Petpak o Bottles o Cartons Wine closure expansion Super Shorty beverage closure New intermediate bulk container at Megapak 43

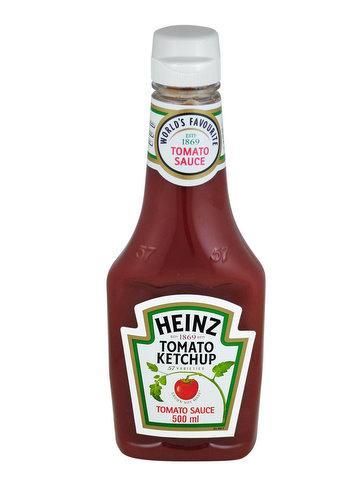
44 44 New Bottles for Heinz


45 45 PET Bottle Growth

46 46 New Liquid Cartons for Clover

47 47 New Liquid Cartons for Clover

48 48 New Wine Closures Equipment

49 49 New Wine Closures
50 50 Super Shorty Beverage Closure
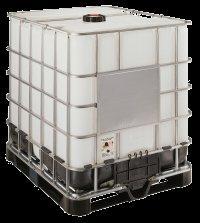

51 51 Intermediate Bulk Container


52 Tissue 2 ply tissue expansion Diaper expansion Refreshed brands and packaging 52


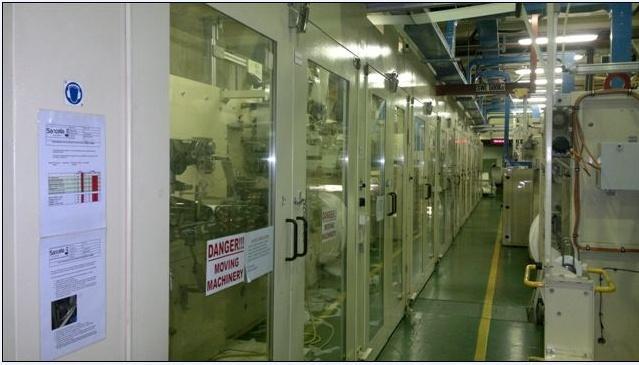
53 53 2-ply Tissue Expansion


54 54 Diaper Expansion
55 55 THE REST OF AFRICA
56 GDP Growth Rates Country Angola Kenya Malawi Nigeria Tanzania Zambia

57 Nigeria Zambia Kenya Angola Malawi Tanzania Revenue in Major Countries Rm

58 West Africa: Well Established Metals factory in Lagos-acquired 57% in 2002 Acquired minority interest in 2011 Cigarette cartons factory in Ibadan established in 2007 Label line installed in 2010 Expanded into commercial market in

59 West Africa Growth Projects Aerosol can line New paint line Cans for milk products Plastic bottles Sorghum beer cartons in Ghana and Nigeria 59
60 60 Angola
 in 1998 Acquired")


61 East Africa Acquired 49% of Bullpak (Kenya) in 1998 Acquired Crown Cork Kenya and Tanzania in 2002 Also 25% of Ethiopia Crown Cork in 2002 Invested in additional sack capacity Expanded into oil can products 61


62 East Africa Growth Projects Crates Closures for CSD and water Metal drums Sorghum beer cartons in Uganda and Tanzania 62


63 Zambia Invested in Zambia in early 1990 s Increased presence with the acquisition of Crown Cork in 2002 Several expansion projects in recent years 63


64 Zambia Growth Projects New PET jar and can for Sugar bags Sorghum beer fillers and printing 64
65 Europe Successful business model Strong cash flows Mega dairy tender unsuccessful Continue to invest in appropriate growth opportunities 65
66 66 NAMPAK PERFORMANCE
67 Nampak vs Alsi to 2009 index ALSI Nampak
68 Jan-09 Apr-09 Jul-09 Oct-09 Jan-10 Apr-10 Jul-10 Oct-10 Jan-11 Apr-11 Jul-11 Oct-11 Nampak vs ALSI 2009 to date Nampak ALSI
69 Jan-09 Apr-09 Jul-09 Oct-09 Jan-10 Apr-10 Jul-10 Oct-10 Jan-11 Apr-11 Jul-11 Oct-11 Nampak Share Price
70 RONA %

71 Trading Margin %

72 Headline Earnings per Share cents % 142.3c +21% 172.4c c

73 Dividends per Share cents % 83c +30% 108c c


74 Net Debt Rm ,000-1,500-2,000-2,500-3,000 Sep 09 Sep 10 Sep 11 74
75 75 OUTLOOK

76 Outlook Nampak is now: o More focused o With low gearing and strong cash generation, and is therefore... Able to invest in growth opportunities Grow with the South African economy and customers Increase the contribution from the rest of Africa 76
77 77 THANK YOU
2010 Annual Results. November 2010
 2010 Annual Results November 2010 1 Agenda Highlights Group results Operational review Strategic Update 2 Highlights Operating profit up 126% Trading margin improved from 5.8% to 8.3% Sale/closure of under-performers
Nampak 2012 Annual Results
 Nampak 2012 Annual Results November 2012 1 Highlights cents 250 Headline Earnings per Share continuing operations 200 150 142.3 172.4 200.8 100 73.9 50 0 2009 2010 2011 2012 2 Highlights Rm 1,800 1,600
Agenda. Salient features. Group financial results. Operational review. The way forward
 2009 Group Results Agenda Salient features Group financial results Operational review The way forward 2 Salient Features Turnover up 6% Volumes down 6% Trading income down 27% Cash from operations R2.2bn
Nampak 2013 Interim Results
 Nampak 2013 Interim Results May 2013 1 Agenda Salient features Group results Operational review Strategic update Outlook 2 Salient Features Revenue up 7%, Africa up 19% Trading profit up 6% Profits from
Nampak 2013 Annual Results
 Nampak 2013 Annual Results November 2013 Summary of Results HEPS up 8% EPS up 13% Operating profit up 8% Africa trading profit up 60% Improvement in working capital management ROE 22% Dividend up 8% to
Interim Results May 2006
 Interim Results May 2006 Agenda Group results Segmental performance Growth prospects Income Statement Rm 2006 2005 % Comments Revenue 7 845 7 910-1 + 4% ex Peters Papers Profit before abnormal items 798
Annual Results November 2015
 Annual Results 2015 November 2015 Forward looking statements We may make statements that are not historical facts and relate to analyses and other information based on forecasts of future results and estimates
+13% Nampak enriches peoples lives every day through the provision of. HEPS from continuing operations. EPS from continuing operations +17%
 Interim report and dividend declaration for the six months ended 31 March 2012 Nampak enriches peoples lives every day through the provision of wine bottles flavoured alcoholic beverages tissue products
Annual Results November 2016
 Annual Results 2016 November 2016 Forward looking statements We may make statements that are not historical facts and relate to analyses and other information based on forecasts of future results and estimates
Interim Results May 2007
 Interim Results May 2007 Salient Features Volume growth in South Africa up 4% Revenue up 11% Costs well-controlled Trading income up 15% HEPS before fair value adjustment up 17% Income Statement Rm 2007
Nampak Limited Audited Group results and dividend declaration for the year ended 30 September 2013
 AUDITED GROUP RESULTS AND DIVIDEND DECLARATION FOR THE YEAR ENDED 30 SEPTEMBER 2013 Nampak Limited Audited Group results and dividend declaration for the year ended 30 September 2013 1 Highlights Trading
Nampak Overview March 2016
 Nampak Overview March 2016 Forward looking statements We may make statements that are not historical facts and relate to analyses and other information based on forecasts of future results and estimates
AUDITED GROUP RESULTS FOR THE YEAR ENDED 30 SEPTEMBER 2007
 AUDITED GROUP RESULTS FOR THE YEAR ENDED 30 SEPTEMBER 2007 Revenue up 12% Trading income up 18% Headline earnings per share up 22% Cash distribution up 20% CONDENSED GROUP INCOME STATEMENT 2007 2006 Change
AUDITED GROUP RESULTS AND DIVIDEND DECLARATION. For the year ended 30 September 2015
 AUDITED GROUP RESULTS AND DIVIDEND DECLARATION For the year ended 30 September 2015 GROUP REVENUE FROM CONTINUING OPERATIONS UP 13% GROUP TRADING PROFIT FROM CONTINUING OPERATIONS UP 10%, IN SPITE OF A
First-half Results June 2016
 First-half Results 2016 June 2016 Forward looking statements We may make statements that are not historical facts and relate to analyses and other information based on forecasts of future results and estimates
UNAUDITED GROUP RESULTS AND DIVIDEND DECLARATION
 UNAUDITED GROUP RESULTS AND DIVIDEND DECLARATION For the half year ended 31 March 2015 GROUP REVENUE FROM CONTINUING OPERATIONS UP 16% GROUP OPERATING PROFIT FROM CONTINUING OPERATIONS DOWN 9%, FOLLOWING
INTERIM REPORT and. cash DISTRIBUTION
 INTERIM REPORT and cash DISTRIBUTION FOR THE SIX MONTHS ENDED 31 MARCH 2008 nampak limited (Registration number 1968/008070/06) (Incorporated in the Republic of South Africa) Share code: NPK ISIN: ZAE
Interim Results 2018
 Interim Results 2018 Forward looking statements We may make statements that are not historical facts and relate to analyses and other information based on forecasts of future results and estimates of amounts
Welcome to Nampak s Investor Day
 Welcome to Nampak s Investor Day Durban: 11 September 2013 1 Programme for the Day Beverage Cans and Glass - Charles Bromley Africa growth Rob Morris Nampak Flexible Clinton Farndell Aerosol investment
nampak limited annual report 2010
 nampak limited annual report 2010 , 1 Financial highlights 2 Segments at a glance 4 Directorate 6 Group executive committee 10 Chairman s review 12 Chief executive s report 18 Operational review 26 Chief
About this report. Scope and boundary of the report. Nampak s management structure. Nampak s reporting approach
 Integrated Annual Report 2011 About this report Nampak s management structure The Nampak group is managed according to raw material and product type in South Africa and according to geography in the rest
Summarised consolidated financial results
 Summarised consolidated financial results For the six months ended 31 March 2018 Revenue increased to Trading profit increased to HEPS increased by R8.8 bn R1.2 bn 10% up by 2 % up by 7% to 132.0 cents
Nampak Annual Report 2003
 Nampak Annual Report 2003 Nampak Limited, PO Box 784324 Sandton 2146, South Africa Nampak Annual Report 2003 It s all part of the package! Nampak contents Packaging solutions 2 Global growth 4 Income statements
31/05/2017 SENS Article
 NAMPAK LIMITED Unaudited group results and ordin 30 May 2017 Close NPK 201705300042A Unaudited group results and ordinary dividend announcement for the half year ended 31 March 2017 Nampak Limited (Registration
AUDITED RESULTS FOR THE YEAR ENDED 31 DECEMBER 2016
 AUDITED RESULTS FOR THE YEAR ENDED 31 DECEMBER 2016 AGENDA 2 1 Opening remarks / market update 2 Financial results 3 Operational review 4 Strategy update 5 Outlook 1 2 3 4 5 OPENING REMARKS / MARKET UPDATE
Mr Price Group Limited Interim Results September 2009
 Interim Results September 2009 Total consumer spending contracted sharply Decline in retail sales in real terms for seven consecutive months Household debt to disposable income at historically high levels
VOLUNTARY TRADING UPDATE FOR THE FIVE MONTHS TO 28 FEBRUARY 2018
 SENS ANNOUNCEMENT - Nampak Limited (Incorporated in the Republic of South Africa) Registration Number: 1968/008070/06 Share Code: NPK ISIN: ZAE 000071676 ( Nampak or the "Group") VOLUNTARY TRADING UPDATE
Unaudited results for the 6 months ended 30 September H Investor Booklet November 2016
 H1 2017 Investor Booklet November 2016 Agenda Overview of Results Financial Review Outlook 2 Overview In the F2016 results presentation (14 July 2016) we said: Dawn board had approved a plan to stop losses
Summarised consolidated financial results
 Summarised consolidated financial results For the year ended 30 September 2017 Group revenue of Trading profit increased to R18.8 bn R2.0 bn HEPS increased by 15% to 123.8 cents per share down by 2 % up
Nampak Limited (Registration number 1968/008070/06) (Incorporated in the Republic of South Africa) Share code: NPK SIN: ZAE
 (Incorporated in the Republic of South Africa) Share code: NPK SIN: ZAE") Nampak Limited (Registration number 1968/008070/06) (Incorporated in the Republic of South Africa) Share code: NPK SIN: ZAE 000071676 Summarised consolidated financial results for the year ended 30 September
Nampak Limited (Registration number 1968/008070/06) (Incorporated in the Republic of South Africa) Share code: NPK SIN: ZAE 000071676 Summarised consolidated financial results for the year ended 30 September
Nampak Limited profile. Contents
 Annual Report 2009 Nampak Limited profile Contents ifc corporate profi le 1 key features of the year 2 group at a glance 4 directorate 6 group executive committee 8 chairman s review 12 chief executive
AUDITED RESULTS FOR THE YEAR ENDED 31 DECEMBER 2015
 AUDITED RESULTS FOR THE YEAR ENDED 31 DECEMBER 2015 AGENDA 2 1 Opening remarks / market update Richard 2 Financial results David 3 Operational review Richard 4 Strategy update Richard 5 Outlook Richard
TRELLIDOR HOLDINGS LIMITED AUDITED RESULTS FOR THE YEAR ENDED 30 JUNE 2016
 TRELLIDOR HOLDINGS LIMITED AUDITED RESULTS FOR THE YEAR ENDED 30 JUNE 2016 OVERVIEW Trellidor is the market leading manufacturer of custom made barrier security products Distribution through dedicated
Mpact Limited Annual Results. 31 December 2013
 Mpact Limited Annual Results 31 December 2013 2013 in context and financial highlights Operating review Financial review Strategy and outlook Appendices 2 2013 in context Muted GDP and consumer spending
Group Results Presentation for the six months ended 31 March 2016
 Group Results Presentation for the six months ended 31 March 2016 Index Overview Financial performance Operational performance Outlook 2 Overview Noel Doyle Chief Operating Officer Disclaimer Forward-looking
Main heading continued
 2 Main heading continued INTEGRATED ANNUAL REPORT 2012 Nampak s sustainability is highly dependent on its ability to produce packaging that benefits all its stakeholders. As Africa s largest packaging
Nampak (NPKJ.J) Share fully priced with growth dependent on Africa CREDIT SUISSE SECURITIES RESEARCH & ANALYTICS
 Share fully priced with growth dependent on Africa CREDIT SUISSE SECURITIES RESEARCH & ANALYTICS") EEMEA/South Africa Equity Research Containers & Packaging Rating UNDERPERFORM* Price (27 Jun 12, R) 25.50 Target price (R) 23.00¹ Market cap. (R m) 15,070.55 Enterprise value (R m) 16,798.2 *Stock ratings
EEMEA/South Africa Equity Research Containers & Packaging Rating UNDERPERFORM* Price (27 Jun 12, R) 25.50 Target price (R) 23.00¹ Market cap. (R m) 15,070.55 Enterprise value (R m) 16,798.2 *Stock ratings
qualities INNOVATIVE DIVERSE RESPONSIVE FLEXIBLE PROACTIVE
 qualities INNOVATIVE DIVERSE RESPONSIVE FLEXIBLE PROACTIVE 1 Nampak Limited Profile 2 Goals 2 Values 3 Financial Summary 5 The Group at a Glance 8Group Structure 9 Chairman s Statement 16 Group Managing
Nampak Annual Report annual report 2004
 Nampak Annual Report 2004 annual report 2004 IFC NAMPAK LIMITED ANNUAL REPORT CONTENTS 1 Nampak profile 2 Chairman s review 8 Group directorate 10 Chief executive s report 30 Chief financial officer s
Barloworld Limited. Reviewed interim results to 31 March May 15, 2006
 Barloworld Limited Reviewed interim results to 31 March 2006 May 15, 2006 BARLOWORLD IS A DIVERSIFIED INDUSTRIAL COMPANY Over 26 000 people in 31 countries Barloworld s way of doing business - market-leading
Standard Bank Group financial results presentation for the year ended 31 December 2015
 Standard Bank Group financial results presentation for the year ended 31 December 215 standardbank.com Financial results presentation Standard Bank Group 215 Macroeconomic environment 17 16 15 14 13 12
EABL F08 Investor Group Briefing
 EABL F08 Investor Group Briefing outperforming in a challenging environment... Gerald Mahinda - Group Managing Director Peter Ndegwa - Group Finance Director 29 August 2008, 16h00 Agenda > Business Review
INTERIM FINANCIAL RESULTS
 Presentation Tuesday, 14 November 2017 INTERIM FINANCIAL RESULTS For the six months ended 30 September 2017 Contents EXECUTIVE OVERVIEW FINANCIAL REVIEW OPERATIONAL REVIEW OUTLOOK & STRATEGY Presented
Unaudited group results for the six months ended 31 March 2018
 Unaudited group results for the six months ended 31 March 2018 Index Listeria update Results overview Financial & operational performance Outlook & conclusion 2 Disclaimer Forward-looking statement This
Tiger Brands Limited. Group Results Presentation. for the year ended 30 September 2015
 Tiger Brands Limited Group Results Presentation for the year ended 30 September 2015 2 Index Strategic review 3 Strategic review Peter Matlare Chief Executive Officer 4 Key strategic deliverables 1 Improve
SIX MONTHS ENDED 30 SEPTEMBER 2018
 PRESENTATION TUESDAY, 20 NOVEMBER 2018 SIX MONTHS ENDED 30 SEPTEMBER 2018 CONTENTS PRESENTED BY Neil Birch Chief Executive Officer Harry Todd Chief Financial Officer 2 EXECUTIVE OVERVIEW 3 RESULTS SUMMARY
Interim Results March Paul Stuiver - CEO
 Interim Results March 2012 Paul Stuiver - CEO 1 Agenda Context Financial Overview Divisional Overview Outlook Questions 2 Context For the six months from October 2011 to March 2012 The positive trend in
Hulamin Limited Interim Results Presentation
 Hulamin Limited Interim Results Presentation For the half-year ended 30 June 2009 Abnormal Market Conditions Sharpest fall in global consumption of aluminium since 1975 oil shock Rolled products and extrusions
Annual Financial Results for the financial year ended 31 March 2018
 PRESENTATION JUNE 2018 Annual Financial Results for the financial year ended 31 March 2018 Contents EXECUTIVE OVERVIEW FINANCIAL REVIEW OPERATING REVIEW OUTLOOK PRESENTED BY: Neil Birch Chief Executive
KAP INDUSTRIAL HOLDINGS LIMITED UNAUDITED RESULTS FOR THE SIX MONTHS ENDED 31 DECEMBER 2018
 KAP INDUSTRIAL HOLDINGS LIMITED INTEGRATED INTO EVERY DAY INTRODUCTION JAAP DU TOIT CHAIRMAN AGENDA INTRODUCTION JAAP DU TOIT UNAUDITED INTERIM RESULTS FOR THE SIX STRATEGY MONTHS IMPLEMENTATION ENDED
Orora Investor Briefing. November 2013
 Orora Investor Briefing November 2013 Contents The demerger of Orora Limited About Orora Limited Strategic Direction of Orora Orora Leadership Board & Management Teams Summary Orora Ltd 2 The demerger
Annual Results. 12 months ended 28 February Agenda
 Annual Results 28 ruary 2015 Bridging y expectations Agenda 2015 2014 2 1 12 month overview Phase 1 of turnaround strategy successfully implemented Closed-out problem contracts Closed non-performing Power
TRELLIDOR HOLDINGS LIMITED UNAUDITED INTERIM RESULTS FOR THE SIX MONTHS ENDED 31 DECEMBER 2017
 TRELLIDOR HOLDINGS LIMITED UNAUDITED INTERIM RESULTS FOR THE SIX MONTHS ENDED 31 DECEMBER 2017 GROUP HIGHLIGHTS 5% Revenue 5% PAT 5% HEPS 35.2c 5% Interim dividend declared 11.0 cents per share Slide 2
Standard Bank Group : J' :ź? WN ī 5' :Tź :TJ' ī ' 'T 55i : 5 ':T J T ': : ' 5 N?5WT'?:N HJ?b' J Ąā 1W: ăāăĉ
 Standard Bank Group OVERVIEW OF STANDARD BANK GROUP AFRICA IS OUR HOME, WE DRIVE HER GROWTH ON-THE-GROUND PRESENCE IN 2 SUB-SAHARAN COUNTRIES OFFICES IN SIX KEY CENTRES 1 216 Branches 9 173 ATMs South
SABMiller plc. Interim results Half year ended 30 September November 2005 also available on website
 SABMiller plc Interim results Half year ended 30 September 2005 10 November 2005 also available on website www.sabmiller.com Forward-looking statements This presentation includes forward-looking statements.
Huhtamaki Strong positions i for profitable growth. CEO Jukka Moisio Pohjola One-on-one Day March 9, 2011
 Huhtamaki Strong positions i for profitable growth CEO Jukka Moisio Pohjola One-on-one Day March 9, 2011 Huhtamaki in 2011 Key Fig gures 201 0 EUR 2.0 Billion in net sales 12,000 People employed Globally
MONDI GROUP RESULTS FOR THE YEAR ENDED 31 DECEMBER February 2011
 MONDI GROUP RESULTS FOR THE YEAR ENDED 31 DECEMBER 21 February 2011 Agenda Highlights Financial overview Operational review Summary Appendices Page 2 Key financial highlights Earnings significantly up
Interim Results. Six months ended 31 August 2016
 Interim Results Six months ended 31 August 2016 Stefanutti Stocks City A multi-disciplinary construction group (Vision) (Mission) 2 www.stefanuttistocks.com y 2 Agenda Six month overview Operational Overview
Financial results presentation For the period ended 30 June External structural and cyclical impacts on results
 212 Financial results presentation For the period ended 3 June 212 External structural and cyclical impacts on results Macro factor Developing versus developed world Consequence SA and Africa relatively
annual report 2007 nampak annual report 2007
 annual report 2007 nampak annual report 2007 www.nampak.com corporate information COMPANY SECRETARY SHARE REGISTRAR NP O Brien BProc Computershare Investor Services 2004 (Pty) Limited AUDITORS 70 Marshall
Strong positions for profitable growth
 Investor Relations January 9, 2013 Strong positions for profitable growth SEB Enskilda Nordic Seminar Copenhagen 2013 CEO Jukka Moisio Huhtamaki 2012 2 EUR 2.0 14,000 billion in net people manufacturing
Preliminary Results Announcement
 Preliminary Results Announcement JIM SUTCLIFFE Chief Executive Introduction 23 rd February Day s agenda UK 09:00 10:00 10:30 11:00 12:00 12:45 SA 11:00 12:00 12:30 13:00 14:00 14:45 OM analyst presentation
Annual Financial Results
 Mittal Steel South Africa Limited Annual Financial Results for the 12 months ended December 2006 market & operations Rick Reato Introduction and Overview Earnings remain strong at R4.6bn - Earnings per
SABMiller plc. Full year results Twelve months ended 31 March Graham Mackay, Chief Executive Jamie Wilson, Chief Financial Officer.
 SABMiller plc Full year results Twelve months ended 31 March 2012 Graham Mackay, Chief Executive Jamie Wilson, Chief Financial Officer 24 May 2012 Forward looking statements This presentation includes
Investor Presentation First Half 2011 Financial Results 6 th Annual Greek Roadshow September 8&9, London
 www.frigoglass.com Investor Presentation First Half 2011 Financial Results 6 th Annual Greek Roadshow September 8&9, London www.frigoglass.com 2 What we do Ice-Cold Merchandisers First Half 2011: Sales
Interim Results Presentation For six months to June Saving our customers money so they can live better
 Interim Results Presentation For six months to June 2017 Saving our customers money so they can live better Agenda 1 Financial review 2 Operational review 3 Strategy & prospects Financial Review Hans van
Nedbank Capital 2010 Investment Conference. 22 September 2010
 Nedbank Capital 2010 Investment Conference 22 September 2010 Agenda Mondi at a glance Group strategy Segment review Summary Presenter David Hathorn Chief Executive Officer Mondi Nedbank Capital 2010 Investment
Results for the First Quarter ended 31 March 2018
 Results for the First Quarter ended 31 March 2018 Athens, Greece, 11 June 2018 Frigoglass SAIC ( Frigoglass or we or the Group ) announces unaudited results for the quarter ended 31 March 2018 First Quarter
Gerresheimer A Leading Partner for the Pharma & Life Science Industry. Eigenkapitalforum Deutsche Börse AG. Frankfurt, November 11, 2008
 Gerresheimer A Leading Partner for the Pharma & Life Science Industry Eigenkapitalforum Deutsche Börse AG Frankfurt, November 11, 2008 Hans-Jürgen Wiecha, CFO 0 Disclaimer This presentation may contain
2011 FINAL RESULTS PRESENTATION
 2011 FINAL RESULTS PRESENTATION FEBRUARY 2012 1 Agenda 1 Market Conditions 2011 2 Financial Review 3 Operational Review 4 Key Strategic Priorities 5 Outlook for 2012 and Beyond 2 MARKET CONDITIONS 2011
FINANCIAL RESULTS PRESENTATION MAY 2010
 FINANCIAL RESULTS PRESENTATION MAY 2010 HIGHLIGHTS POSTITIVES Good physical performance Growth continues Cane up by more than 1mt Sugar up more than 100 000t Strong domestic sales World sugar price up
12 month overview. Operational Overview. Financial Results. Conclusion
 Annual Results 12 months ended 29 ruary 2016 Agenda 12 month overview Operational Overview Financial Results Conclusion 2 1 12 month overview Reasonable financial performance in current market All Business
For personal use only
 Orora Pro Forma Full Year Results Year Ended 30 June 2014 Nigel Garrard Managing Director and CEO Stuart Hutton Chief Financial Officer 25 August 2014 IMPORTANT PLEASE READ Effective 17 December 2013,
ANALYST PRESENTATION FOR THE YEAR ENDED 31 MARCH 2012
 ANALYST PRESENTATION FOR THE YEAR ENDED 31 MARCH 2012 1 TFG ANALYST PRESENTATION MARCH 2012 AGENDA Overview of the economy and retail environment Review of the year Financial review Divisional review Financial
9/22/2010. Growing outside South Africa Clive Tasker, Chief Executive: Standard Bank Africa. Strategy
 Standard d Bank Group Growing outside South Africa Clive Tasker, Chief Executive: Standard Bank Africa Strategy 1 What is our strategy? To build a leading emerging markets financial services organisation
Financial Results 2016
 Financial Results 2016 March 29 th, 2017 Website: www.dairibord.com Presentation Outline Operating Environment A Mandiwanza Performance Highlights Volumes and Revenue Review Financials M Ndoro Outlook
Annual Results Presentation. for the year ended 30 September 2014
 Annual Results Presentation for the year ended 30 September 2014 AGENDA Business Overview Poultry Industry Trends Financial Overview Industry Matters Prospects Q & A 2 2 BUSINESS OVERVIEW 3 THE PERIOD
SABMiller plc. Full year results Twelve months ended 31 March Jamie Wilson, Chief Financial Officer Gary Leibowitz, SVP, Investor Relations
 SABMiller plc Full year results Twelve months ended 31 March 2012 Jamie Wilson, Chief Financial Officer Gary Leibowitz, SVP, Investor Relations 24 May 2012 Forward looking statements This presentation
Investor Presentation Second Quarter and First Half 2012 Financial Results
 What we do Ice-Cold Merchandisers xxx Investor Presentation Second Quarter and First Half 2012 Financial Results Glass Operations xxx Disclaimer This presentation contains forward-looking statements which
UNAUDITED INTERIM RESULTS FOR THE SIX MONTHS ENDED 31 DECEMBER 2013
 UNAUDITED INTERIM RESULTS FOR THE SIX MONTHS ENDED 31 DECEMBER 2013 AGENDA AGENDA GROUP OVERVIEW FINANCIAL REVIEW DIVISIONAL REVIEW OUTLOOK QUESTIONS 2 3 GROUP OVERVIEW GROUP STRUCTURE INDUSTRIAL EQUIPMENT
Period overview Operational Overview Financial Results Conclusion
 Interim Results Six months ended 31 ust 2015 Bridging y expectations Agenda Period overview Operational Overview Financial Results Conclusion Bridging y expectations 2 1 Six month overview Satisfactory
GROUP RESULTS PRESENTATION For the year ended 30 September 2017
 GROUP RESULTS PRESENTATION For the year ended 30 September 2017 Index Overview Financial & operational performance Strategy update 2 Disclaimer Forward-looking statement This document contains forward
MTN Group Limited Results presentation for the six months ended 30 June 2017
 MTN Group Limited Results presentation for the six months ended 30 June 2017 Disclaimer The information contained in this document has not been verified independently. No representation or warranty express
Audited results for the year ended 31 st December th February 2017
 Audited results for the year ended 31 st December 2016 28 th February 2017 Highlights of 2016 Financial results Revenue up 25.1% to 615.1B Strong increase in Q4 EBITDA after price increase EPS up 4.5%
WHAT DRIVES US. Customer perspective Market share Shared Value Brand position STRATEGY: TRANSFORMATIVE PARTNERSHIPS
 FY 2018 RESULTS OUR STRATEGY WHO WE ARE Our Purpose Simplifying your world to enable your progress Our Promise Go Ahead Our Values Inspiring Simple Friendly WHAT DRIVES US Customer perspective Market share
Results for the Third Quarter ended 30 September 2017
 Results for the Third Quarter ended 30 September 2017 Athens, Greece, 24 November 2017 Frigoglass SAIC ( Frigoglass or we or the Group ) announces results for the quarter and nine months ended 30 September
Liberty Holdings Limited Financial results presentation for the year ended 31 December
 Liberty Holdings Limited Financial results presentation 2016 for the year ended 31 December Results agenda Annual results 2016 Group financial Operational activities Conclusion preview and strategic performance
MONDI GROUP Merrill Lynch Pan European Paper & Packaging Forum September 2011 London
 MONDI GROUP Merrill Lynch Pan European Paper & Packaging Forum 2011 20 September 2011 London Mondi s strategic positioning Sector fundamentals Cash flow prioritisation Appendices Mondi September 2011 Page
Thai Plaspac Public Company Limited 3Q 2017 Investor Presentation
 Thai Plaspac Public Company Limited 3Q 2017 Investor Presentation November 15, 2017 Disclaimer This presentation contains forward-looking statements of Thai Plaspac Public Company Limited (the Company
Results for the Third Quarter ended 30 September 2018
 Results for the Third Quarter ended 30 September 2018 Athens, Greece, 16 November 2018 Frigoglass SAIC ( Frigoglass or we or the Group ) announces results for the quarter and nine months ended 30 September
Barloworld Limited. Audited results for the year ended 30 September 2003
 Barloworld Limited Audited results for the year ended 30 September 2003 Barloworld is an international industrial brand management company 23 000 people... in 32 countries providing business solutions
INTERIM RESULTS PRESENTATION FOR THE SIX MONTHS ENDED 31 AUGUST 2017
 INTERIM RESULTS PRESENTATION FOR THE SIX MONTHS ENDED 31 AUGUST 2017 AGENDA BUSINESS TRENDS AND STRATEGY Zak Calisto SEGMENTAL PERFORMANCE Zak Calisto FINANCIAL REVIEW John Edmeston OUTLOOK AND QUESTIONS
RHI Group >> Quarterly Report III/2006
 RHI Group >> Key Figures RHI Group Q1 - Q3 Change in million 2006 2005 in % Revenue 998.6 893.9 11.7 EBITDA 130.5 108.1 20.7 EBITDA margin 13.1% 12.1% 8.1 EBIT 97.5 78.3 24.5 EBIT margin 9.8% 8.8% 11.5
ADVANCED MANUFACTURING
 INTEGRATED REPORT 2017 ADVANCED MANUFACTURING Contents 1 About our report WHO WE ARE 2 This is Nampak 4 How we define value and the stakeholders who help us create it 5 Our operating context 6 How we performed
Financial results: 2007
 Financial results: 2007 Presentation to investors, analysts and media 26 and 27 February 2008 Summary Comparable HEPS -7%, if ignore Pension Fund agreement, Milnerton transaction, SANS closure costs, income
enx Group Limited results presentation
 enx Group Limited results presentation for the year ended 31 August 2018 Disclaimer Certain statements in this presentation regarding enx s business operations may constitute forward looking statements.
3 Operational Review. Strategic Review and Objectives
 UNAUDITED INTERIM RESULTS FOR THE HALF YEAR ENDED 30 JUNE 2012 1 Agenda 1 Introduction 2 Financial Review 3 Operational Review 4 Strategic Review and Objectives 5 Outlook 2 Key Points for H1 2012 Performance
SABMiller plc. First half results. 19 November Graham Mackay, Chief Executive Malcolm Wyman, CFO. Six months ended 30 September 2009
 SABMiller plc First half results Six months ended 30 September 2009 19 November 2009 Graham Mackay, Chief Executive Malcolm Wyman, CFO Forward looking statements This presentation includes forward-looking
Second Quarter 2011 Review. July 28, John V. Faraci Chairman & Chief Executive Officer
 John V. Faraci Chairman & Chief Executive Officer Second Quarter 2011 Review July 28, 2011 Tim S. Nicholls Senior Vice President & Chief Financial Officer Forward-Looking Statements Certain statements
RESULTS PRESENTATION
 THE FOSCHINI GROUP LIMITED RESULTS PRESENTATION FOR THE 6 MONTHS ENDED 30 SEPTEMBER RESULTS PRESENTATION FOR THE HALFYEAR ENDED 30 SEPTEMBER AGENDA Economy and retail environment Doug Murray Business