enx Group Limited results presentation
|
|
|
- Matthew Butler
- 5 years ago
- Views:
Transcription


1 enx Group Limited results presentation for the year ended 31 August 2018
2 Disclaimer Certain statements in this presentation regarding enx s business operations may constitute forward looking statements. All statements other than statements of historical fact included in this presentation, including, without limitation, those regarding the financial position, business strategy, management plans and objectives for future operations of enx are forward looking statements. Forward-looking statements are not intended to be a guarantee of future results, but instead constitute enx s current expectations based on reasonable assumptions. Actual results could differ materially from those projected in our forward-looking statements due to risks, uncertainties and other factors. enx neither intends to nor assumes any obligation to update or revise any forward-looking statements, whether as a result of new information, future events or otherwise. In preparation of this document we used certain publicly available data. While the sources we used are generally regarded as reliable we did not verify their content. enx does not accept any responsibility for using any such information. 2


3 Agenda 01 Who we are 02 Our track record 03 Financial review 04 Outlook 05 Q&A 3

4 01 Who we are 1. Why invest in enx 2. Who is enx 3. Who we represent 4. Our long term strategies 4


5 Why invest in enx Preferred custodian of leading global brands Entrepreneurial and committed management team Diversity across geographies, customers, products and services Dynamic allocation of capital at attractive rates of return - a core competence 5
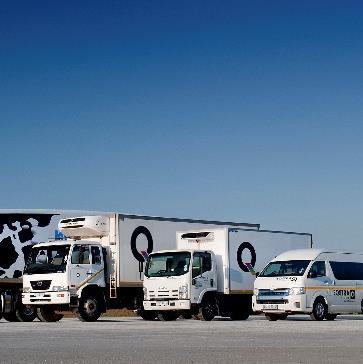
6 Who is enx An entrepreneurial, diversified industrial company with the ambition to be the preferred custodian of leading global brands EQUIPMENT # FLEET PETROCHEMICALS Distribution, leasing, rental, after-market and value-added services for: Forklifts Port and crane equipment Materials handling equipment Full fleet of Fleet management solutions across all vehicle classes: Leasing Fleet management products and services Tracking Insurance and remarketing Manufacturing and distribution of petrochemicals Oil lubricants Chemicals Base oils # Excludes smaller equipment distribution businesses that we intend to divest of 6


7 Who we represent GLOBAL BRAND MARKET POSITION Brand Recognition Marketing Expertise Research and Development Growth Opportunities


8 Our long term strategies Divest: - Fleet - Wood - Power Invest: - Forklift - Petrochemicals Strengthen social licence Continue building market leading OEM partnerships 8

9 Our track record Highlights 2. Our journey 3. Our experienced non-executive directors 4. Our entrepreneurial management team 5. Delivering on our long term priorities 9


10 Highlights First full year of trading since the Eqstra acquisition delivered adjusted headline earnings of R337 million Adjusted HEPS growth of 4% in subdued markets: cps compared to cps zaa- long-term credit rating from S&P, 2 notches improvement vs. GCR Stabilised fleet leasing book Renewed access to debt capital markets, deleveraging and improved maturity profile in South African leasing businesses Acquired three new bolt-on forklift dealers in the UK. ~R76 million investment ExxonMobil accreditation for local blending Acquired minority interest in a ExxonMobil base oil distributor, including strategic storage capacity in Durban port Recovered all monies, R250 million, due by extract 10
11 Our journey 2013 to x or 28% compound growth in ADJUSTED HEPS (cps) # ^ Listed Austro Power business acquired Wild Rose Capital introduced as shareholder of reference Establishment of Petrochemicals segment through acquisition of Centlube Group renamed enx Awarded ExxonMobil distributor-ship Acquisition of Genmatics, WAI and AGL Empowerment transaction and capital raise Acquisition of established EFML and EIE Decoupled from extract Growing Petrochemical segment Expand UK footprint 10 months of results for EIE and EFML # Adjusted for 11:1 consolidation ^ Excluding once-off foreign exchange loss 11


12 Our experienced non-executive directors Mpho Makwana assumed the role of independent non-executive Chair effective 1 January 2018 Allan Joffe appointed as non-executive director on 5 September 2018 Name Mpho Makwana Nopasika Lila Anthony Phillips Paul O Flaherty Steve Booysen Paul Baloyi Lerato Molefe Allan Joffe Position Independent non-executive Chair Audit and risk committee Chair Remuneration committee Chair IT steering committee Chair Asset and liability committee Chair Investment committee Chair Independent Non-executive non-executive director director 12


13 Our management team Steven Joffe* appointed as Chief Executive Officer effective 1 January 2018 Paul Mansour^ appointed Chief Investment Officer effective 1 January 2018 Jarrod Friedman appointed Chief Financial Officer effective 1 September 2018 Name Steven Joffe Paul Mansour Jarrod Friedman Gary Neubert Trevor Williams Christian Neuberger Jacqui Carr Brent Hean Clint Nickall Position CEO CIO CFO EIE Wood Power EFML Chemicals Lubricants Segment enx Group enx Industrial enx Fleet enx Petrochemicals * previously non-executive Chairman ^ previously Executive Deputy Chairman 13
14 Delivering on our long term priorities STRATEGY GOALS ACHIEVED Preferred custodian of OEM brands Strengthen OEM partnerships Local production of ExxonMobil lubricants Grow market share in line with OEM aspirations New product distribution opportunities Differentiate with scale Quest, in house Fleet ERP system Increase volumes through new blending plant New chemical product revenues Geographical diversification Expand European footprint 5-year lubricant blending agreement signed with ExxonMobil 3-year renewal of distributor agreement with ExxonMobil Invested in a ExxonMobil base oil distributor Sales reward recognition from Toyota Industrial Corporation Quest bedded down New revenues generated from ExxonMobil chemical products Acquired three additional forklift dealers in the UK which expanded footprint and grew leasing book 14
15 Delivering on our long term priorities STRATEGY GOALS ACHIEVED Strengthen social licence Achieve minimum level 4 BBBEE contribution at operational level EIE level 4 contributor Lubricants level 3 contributor EFML level 3 contributor Amasondo level 2 contributor Financial discipline Optimal allocation of capital Consistent growth in earnings Strengthen capital structure Improve credit rating Active management of re-financing risk Initiatives underway to focus capital deployment 4% y-o-y growth in HEPS Net debt to equity ratio reduced to 154% A- credit rating from S&P R360 million raised in debt capital markets Refinanced R510 million of bank amortisations Sufficient liquidity for next 18 months of maturities 15

16 Financial review Financial summary 2. Segmental analysis 3. Condensed statement of profit and loss 4. Condensed statement of financial position 5. Condensed statement of cash flows 6. Gross interest-bearing borrowings 7. Capital market evolution 8. Liquidity and funding 16
17 Financial summary Key performance indicators R Revenue Adjusted earning before interest and taxation (EBIT) Adjusted headline earnings Adjusted headline earnings per share (cents) Number of shares in issue Weighed average number of shares in issue (net of treasury) Net asset value per share (cents) - excluding extract asset held for sale in Net tangible asset value per share (cents) - excluding extract asset held for sale in
18 Financial summary Adjustments to EBIT and Headline Earnings explained R 000 EBIT Headline Earnings Earnings before interest and taxation (EBIT)/Headline Earnings Share-based payment expense Restructuring and transaction costs Amortisation of intangible assets Retrenchments costs Impairment of goodwill Taxation effect on adjustments - (18 293) Adjusted EBIT/Headline Earnings Adjusted EBIT cps/headline Earnings cps
19 Segmental analysis 12% 17% 47% Adj. PBT August % Adj. PBT August % enx Equipment enx Fleet 40% enx Equipment enx Fleet enx Petrochemicals enx Petrochemicals Fleet Equipment Leasing assets Interest-bearing liabilities Leasing assets Interest-bearing liabilities 19
20 Segmental analysis EIE* Rm Revenue Adj. EBIT Adj. PBT Leasing assets Total assets Interest-bearing liabilities FY 2018 EIE (SA): 12 months vs. 10 months results Leasing assets 11% Improvement in overhead recovery from aftermarket Successful implementation of Mobile Mechanic 38% 5% 25% 32% REVENUE VALUE CHAIN August 2018 New equipment Value added services Used equipment Rental EIE (UK): Grew national footprint with 3 acquisitions Leasing assets 10% Success with the Konecrane brand breaking into key ports and terminals Grew dealer network * Excludes Power and Wood. 20
21 Segmental analysis FLEET Rm Revenue Adj. EBIT Adj. PBT Leasing assets Total assets Interest-bearing liabilities EFML: FY month vs 10 months of results Leasing book growth 1% after multi-year decline due to capital constraints Strong remarketing profits Growth in value add product revenues Quest stable and efficiencies materialising 22% REVENUE VALUE CHAIN August % Lease/rent VAPs Remarketing 36% 21
22 Segmental analysis 16% 9% PETROCHEMICALS Rm Revenue Adj. EBIT Adj. PBT Inventory Total assets Interest-bearing liabilities % REVENUE VALUE CHAIN August 2018 Lubricants Lubricants: Growth in ExxonMobil volumes ExxonMobil blending accredited Profitability materially impacted by lower blending volumes due to a customer s temporary over stock position Chemicals: FY 2018 Sales volumes and margin increased compared to prior year Results benefited from new products introduced during the year Polymers 28% Rubber Chemicals & additives 22
23 Condensed statement of profit and loss R Revenue Net operating expenses ( ) ( ) Profit before depreciation and amortisation Depreciation and amortisation ( ) ( ) Loss/(profit) on disposal of property, plant and equipment (1 036) 27 IFRS 2 Share based payment expense (26 110) (6 708) Foreign exchanges losses (39 933) (27 085) Operating profit Fair value adjustment of investments - ( ) Impairment of goodwill (56 184) - Share of profit/(loss) from associates (2 620) Net finance costs ( ) ( ) Profit/(loss) before taxation ( ) Taxation (78 448) ( ) Profit/(loss) after taxation ( ) 23
24 Condensed statement of financial position R Goodwill Leasing assets Inventories Trade, other receivables and derivatives Other assets Bank and cash balances Assets held for sale - extract Total assets R Total shareholders interests Interest-bearing borrowings, overdraft, vendor loans Deferred taxation Trade, other payables and derivatives Other liabilities Total equity and liabilities
25 Condensed statement of cash flows R Cash generated from operations before working capital movements Working capital movements Cash generated from operations Net cash flows from interest and taxation ( ) ( ) Net cash flows from operating activities Net cash flows from investing activities ( ) ( ) Net cash flows from financing activities ( ) Net increase in cash and cash equivalents
26 Gross interest-bearing borrowings Funding facilities (R million) Facility size Utilised Unutilised enx Leasing (EIE and EFML) South Africa General banking facility Term facility Liquidity facility Capital market enx Leasing (EIE and EFML) - Rest of world Asset backed funding UK (EIE) General banking facility UK (EIE) 5-5 General banking facility Zambia (EFML) enx Trading General banking facility Term facility Deferred vendor consideration Other Total funding enx Leasing SA Covenants ZAR (x) Level FY2018 HY2018 FY2017 Net total debt : EBITDA Improving EBITA : Net finance charges Improving Net total debt : Equity Improving Loan to Value Improving N/A 26
27 Capital market evolution FY2019 goals: Redeem/refinance R413m April 2019 maturities Future funding strategy dependent on outcome of EFML process Notes issued: R260m 3 year Credit rating: zaa- from S&P Bank term facility refinance: R510m bank term facility amortisation refinance Notes issued: R96m 4 year BBB Investment grade credit rating secured Note maturities: R493m maturing notes redeemed Notes issued: R70m 5 year Syndicated loan: R200m 3 year Note maturities: R612m maturing notes redeemed Note specific liquidity facility: R315m 3.5 year EIE and FML facilities separated from extract Debt restructure alleviates short term liquidity challenges 27
28 Liquidity and funding Funding developments post Aug 2018 Received a zaa- long-term credit rating from S&P R96m 4yr listed notes issued 55bps tighter margin than April 2018 issue R510m refinance of bank term debt amortisations Early redemption of R45m EQS05 that mature in April 2019 Funding outlook Depends on outcome of EFML process Sufficient liquidity to meet next 18 months maturities Continuous drive to identify ways to reduce cost of funding Long-term funding objectives 1. Diversify funding sources 2. Ample liquidity buffers for trading and upcoming maturities 3. Target A credit rating 4. Spread the maturity profile 5. Manage and reduce cost of funding Feb SA maturity profile (R m) Oct SA maturity profile (R m) Active management of refinance risk Bond Debt Term Facility A Bond Debt Term Facility A Term Facility C Liquidity Facility Repmt Term Facility C Liquidity Facility Repmt 28

29 04 Outlook 1. EFML cautionary announcement 2. Segmental outlook 29


30 EFML cautionary announcement Board completed a review of strategic options in respect of ownership interest of EFML Concluded that new owner may potentially be able to optimize EFML value proposition Divestment process has commenced Ultimate outcome will be dependent on price received 30
31 Segmental outlook EQUIPMENT # FLEET PETROCHEMICALS Organic and acquisitive UK growth Stable SA performance and market share growth underpinned by healthy order book Grow in selected African markets on an export, capital-lite, dealer basis Improve efficiencies through use of technology Focus on organic growth of lease book Increase revenues from VAPs Explore opportunities to invest in complementary businesses Utilise IP and technology to improve competitiveness Grow ExxonMobil distribution volumes, supported by local blending Toll blending volume anticipated to recover Increase volumes of polyethylene supplied by ExxonMobil Increase synthetic rubber market share following closure of local manufacturer Introduction of cleaner base oil grades to SA market 31

32 05 Q&A Contacts Steven Joffe, CEO Jarrod Friedman, CFO Paul Mansour, CIO 32
SUMMARISED PRELIMINARY CONSOLIDATED FINANCIAL RESULTS for the year ended 31 August Revenue UP 7.4 billion (2017: R6.
 enx GROUP LIMITED (Incorporated in the Republic of South Africa) (Registration number 2001/029771/06) JSE share code: ENX ISIN: ZAE000222253 ("enx" or "the Group") SUMMARISED PRELIMINARY CONSOLIDATED FINANCIAL
UNAUDITED INTERIM RESULTS FOR THE SIX MONTHS ENDED 31 DECEMBER 2013
 UNAUDITED INTERIM RESULTS FOR THE SIX MONTHS ENDED 31 DECEMBER 2013 AGENDA AGENDA GROUP OVERVIEW FINANCIAL REVIEW DIVISIONAL REVIEW OUTLOOK QUESTIONS 2 3 GROUP OVERVIEW GROUP STRUCTURE INDUSTRIAL EQUIPMENT
Results presentation For the year ending 31 December 2015
 Results presentation For the year ending 31 December 2015 1 Results Presentation March 2016 Agenda 1 2015 Overview & Business Priorities Update Chris Weston, CEO 2 2015 Financial & Operating Review Carole
KAP INDUSTRIAL HOLDINGS LIMITED UNAUDITED RESULTS FOR THE SIX MONTHS ENDED 31 DECEMBER 2018
 KAP INDUSTRIAL HOLDINGS LIMITED INTEGRATED INTO EVERY DAY INTRODUCTION JAAP DU TOIT CHAIRMAN AGENDA INTRODUCTION JAAP DU TOIT UNAUDITED INTERIM RESULTS FOR THE SIX STRATEGY MONTHS IMPLEMENTATION ENDED
KAP INDUSTRIAL HOLDINGS LIMITED (KAP) UNAUDITED INTERIM RESULTS FOR THE SIX MONTHS ENDED 31 DECEMBER 2017
 UNAUDITED INTERIM RESULTS FOR THE SIX MONTHS ENDED 31 DECEMBER 2017") KAP INDUSTRIAL HOLDINGS LIMITED (KAP) UNAUDITED INTERIM RESULTS FOR THE SIX MONTHS ENDED 31 DECEMBER 2017 WELCOME JAAP DU TOIT CHAIRMAN AGENDA WELCOME UNAUDITED INTERIM RESULTS FOR THE SIX STRATEGY MONTHS
KAP INDUSTRIAL HOLDINGS LIMITED (KAP) UNAUDITED INTERIM RESULTS FOR THE SIX MONTHS ENDED 31 DECEMBER 2017 WELCOME JAAP DU TOIT CHAIRMAN AGENDA WELCOME UNAUDITED INTERIM RESULTS FOR THE SIX STRATEGY MONTHS
PRESENTATION TO INVESTORS FOR THE YEAR ENDED 30 SEPTEMBER 2015
 PRESENTATION TO INVESTORS FOR THE YEAR ENDED 30 SEPTEMBER 2015 AGENDA GROUP OVERVIEW Alan Dickson, CEO FINANCIAL OVERVIEW Nick Thomson, CFO SEGMENTAL DISCUSSIONS ICT Mark Taylor Applied electronics Peter
Bank of Queensland Full year results 31 August Bank of Queensland Limited ABN AFSL No
 Bank of Queensland Full year results 31 August 2013 Bank of Queensland Limited ABN 32 009 656 740. AFSL No 244616. Agenda Result overview Stuart Grimshaw Managing Director and CEO Financial detail Anthony
Unaudited results. for the six months ended 30 November ISIN: ZAE Share code: ARH. ARB Holdings Limited
 www.arbhold.co.za ARB Holdings Limited Registration number: 1986/002975/06 Share code: ARH ISIN: ZAE000109435 ( ARB or the Company or the Group ) for the six months ended 30 November 2016 Unaudited results
EVRY ASA Q PRESENTATION CEO BJÖRN IVROTH CFO HENRIK SCHIBLER
 1 EVRY ASA Q1 2018 PRESENTATION CEO BJÖRN IVROTH CFO HENRIK SCHIBLER Agenda Group highlights Business update Financial highlights Business area performance Targets and Concluding remarks Q&A 2 Group highlights
UNAUDITED CONDENSED CONSOLIDATED INTERIM RESULTS
 UNAUDITED CONDENSED CONSOLIDATED INTERIM RESULTS FOR THE SIX MONTHS ENDED 31 DECEMBER 2014 RESULTS HIGHLIGHTS REVENUE 257% to R562.4m EBITDA 276% to R87.2m HEPS 118% to 14.4 cents DPS 3.5 cents 01 UNAUDITED
ANNUAL FINANCIAL RESULTS INTRODUCTION AND GROUP STRUCTURE FOR THE YEAR ENDED 31 DECEMBER Dr. ENOS BANDA Chairman
 ANNUAL FINANCIAL RESULTS INTRODUCTION AND GROUP STRUCTURE FOR THE YEAR ENDED 31 DECEMBER Management Team Dr. ENOS BANDA Chairman STEVEN JOFFE Chief Executive Officer JARROD FRIEDMAN Financial Director
UNAUDITED CONSOLIDATED FINANCIAL RESULTS FOR THE SIX MONTH PERIOD ENDED 30 SEPTEMBER 2016
 BSI Steel Limited (Incorporated in the Republic of South Africa) (Registration number 2001/023164/06) (JSE code: BSS ISIN: ZAE000125134) ("BSI" or "the Company" or "the Group") Salient features - Increase
Hero Acquisitions Ltd
 Hero Acquisitions Ltd (subsidiary of HSS Hire Group plc) FY17 Results APRIL 5 th 2018 Important notice By reading or reviewing this presentation, you agree to be bound by the following limitations: This
Interim Results. 23 April 2014
 Interim Results 23 April 2014 The leading supply chain, trading and distribution partner in our chosen supply markets - delivering consistently strong returns to shareholders 2 Evolution of Smiths News
TELECONFERENCE INTERIM REPORT Q Work, live and thrive in new places around the world. We make it easy
 TELECONFERENCE INTERIM REPORT Q3 2018 Work, live and thrive in new places around the world. TODAY S AGENDA Q3 Highlights 03 Market Trends (Europe, Asia, Australia, Americas) 07 Key financial figures 12
For personal use only
 Investor Presentation Half Year Results to 31 December 2016 24 February 2017 PETER CAUGHEY, CEO & MANAGING DIRECTOR 1 Agenda Overview Financials Business conditions, strategy and outlook 2 Overview 1H17
2017 Half-Year Results
 2017 Half-Year Results Martin Earp, CEO Josée Lemoine, CFO 16 August 2017 Financials Pillars of Growth Summary of Performance H1 2017 Sales Revenue $218.2m 1.7% Demographics Deaths 1 2.8% Australia $44.1m
2 AUGUST Results. Presentation. For the half year ending 30 June Results Presentation August 2017
 2 AUGUST 2017 Results Presentation For the half year ending 30 June 2017 1 Chris Weston CEO 2 Agenda 1H17 Operating & Financial Review and Outlook Carole Cran, CFO Market Overview Chris Weston, CEO 3 The
For personal use only
 23 August 2013 Full Year Results June 2013 We attach an Investor Presentation for the FY13 Full Year Results. As previously announced, a results briefing for analysts will be held at 10:30am Sydney time
SECOND QUARTER 2018 EARNINGS CONFERENCE CALL
 SECOND QUARTER 2018 EARNINGS CONFERENCE CALL Forward Looking Statements & Non-GAAP Disclaimer The following information may contain forward-looking statements, including forward-looking statements within
Transpacific FY15 Half Year Results Presentation
 Transpacific FY15 Half Year Results Presentation Robert Boucher CEO Brendan Gill CFO 20 February 2015 - Disclaimer Forward looking statements - This presentation contains certain forward-looking statements,
DATATEC GROUP AUDITED PROVISIONAL RESULTS FOR THE YEAR ENDED 28 FEBRUARY 2018
 Technology Distribution Integration & Managed Services Consulting & Research AUDITED PROVISIONAL RESULTS FOR THE YEAR ENDED 28 FEBRUARY 2018 AGENDA Results summary, overview & strategic update Jens Montanana,
Hero Acquisitions Limited (subsidiary of HSS Hire Group plc) 9M FY15 Results
 9M FY15 Results") Hero Acquisitions Limited (subsidiary of HSS Hire Group plc) 9M FY5 Results November 205 Agenda John Gill, CEO: Introduction Steve Trowbridge, CFO: 9M Results John Gill, CEO: Summary Q&A Introduction 0.7%
Hero Acquisitions Limited (subsidiary of HSS Hire Group plc) 9M FY5 Results November 205 Agenda John Gill, CEO: Introduction Steve Trowbridge, CFO: 9M Results John Gill, CEO: Summary Q&A Introduction 0.7%
ABOUT CARTRACK STRATEGY REVIEW FINANCIAL PERFORMANCE SEGMENT PERFORMANCE OUTLOOK AND QUESTIONS
 1 AGENDA ABOUT CARTRACK STRATEGY REVIEW FINANCIAL PERFORMANCE SEGMENT PERFORMANCE OUTLOOK AND QUESTIONS 2 ABOUT CARTRACK 3 A LOW-RISK FINANCIAL MODEL AND PROVEN TRACK RECORD Compound 6-yr annuity revenue
FY17 Results. 25 September 2017
 FY17 Results 25 September 2017 Forward Looking Statement This document contains forward looking statements, which reflect management s current views and estimates. The forward looking statements involve
Photo by James Ball - Coffey International Limited FY2013 Half Year Results Presentation. 11 February 2013
 Photo by James Ball - www.dlscape.com Coffey International Limited FY2013 Half Year Results Presentation 11 February 2013 Agenda Financial Performance Business Performance Outlook Presenters John Douglas
Quarter and year ended 31 December Financial results & business update
 Quarter and year ended 31 December 2012 Financial results & business update 26 February 2013 Disclaimer Any remarks that we may make about future expectations, plans and prospects for the company constitute
Aegis Group plc Half Year Results. 27 August 2010
 Aegis Group plc 2010 Half Year Results 27 August 2010 Agenda Introduction John Napier, Chairman Aegis Group overview Jerry Buhlmann, CEO Divisional review Aegis Media - Jerry Buhlmann, CEO Synovate Robert
12 month overview. Operational Overview. Financial Results. Conclusion
 Annual Results 12 months ended 29 ruary 2016 Agenda 12 month overview Operational Overview Financial Results Conclusion 2 1 12 month overview Reasonable financial performance in current market All Business
Investor & Analyst Presentation
 Investor & Analyst Presentation FY18 H1 Results For the six monthsended 31 December 2017 15 th February 2018 Rebekah O Flaherty-CEO I Jonathan Kenny-CFO Agenda 1 2 3 4 5 6 Overview Strategic Priorities
FY 2019 FIRST QUARTER EARNINGS. Adient reports first quarter 2019 financial results
 FY 2019 FIRST QUARTER EARNINGS Adient reports first quarter 2019 financial results > > Q1 GAAP net loss and EPS diluted of $(17)M and $(0.18) respectively; Q1 Adjusted-EPS diluted of $0.31 > > Adjusted-EBIT
Philips Lighting reports 0.5% full year comparable sales growth, 10% operational profitability and EUR 403 million free cash flow
 Philips Lighting reports 0.5% full year comparable sales growth, 10% operational profitability and EUR 403 million free cash flow Q4 & Full Year 2017 presentation February 2, 2018 Important information
Regus Group plc Interim Report Six months ended June 2005
 Regus Group plc Interim Report Six months ended June 2005 Financial Highlights (a) 216.0m TURNOVER (2004: 124.9m) 48.7m CENTRE CONTRIBUTION (2004: 17.5m) 22.3m ADJUSTED EBITA (b) (2004: 1.9m LOSS) 37.4m
BELL EQUIPMENT LTD RESULTS FOR THE 12 MONTHS ENDED 31 DECEMBER 2017 AND BUSINESS REVIEW
 BELL EQUIPMENT LTD RESULTS FOR THE 12 MONTHS ENDED 31 DECEMBER 2017 AND BUSINESS REVIEW Financial Highlights for 2017 Revenue up 13% to R6,8 billion NPAT up from R39 million to R272 million HEPS per share
Salient features - Decrease in NPAT of 66% - HEPS 1.6 cents per share - NTAV 105 cents per share
 BSI Steel Limited (Incorporated in the Republic of South Africa) (Registration number 2001/023164/06) (JSE code: BSS ISIN: ZAE000125134) ("BSI" or "the Company" or "the Group") Salient features - Decrease
Investor & Analyst Presentation Ful YearResults 30 June2016 For personal use only 25th August 2016 Rebekah O Flaherty - CEO I Jonathan Kenny - CFO
 Investor & Analyst Presentation Full YearResults 30 June2016 25th August 2016 Rebekah O Flaherty - CEO I Jonathan Kenny - CFO Agenda 1 Overview 2 Strategic Priorities 3 FY16 Financial Results 4 FY17 Outlook
FY2019 Interim results presentation
 EXPLORE OUR WORLD Established 1975 I Listed JSE limited 1987 ADCORP IS A WORKPLACE SOLUTIONS COMPANY Presented by Innocent Dutiro Chief Executive Officer Cheryl Jane CJ Kujenga Chief Financial Officer
Aegis Group plc. 17 March 2011
 Aegis Group plc 2010 Full Year Results 2010 Full Year Results 17 March 2011 Agenda Introduction John Napier, Chairman Aegis Group overview Jerry Buhlmann, CEO Divisional review Aegis Media - Jerry Buhlmann,
INTERIM RESULTS ANNOUNCEMENT MONDAY, 26 FEBRUARY 2018 AT 10H00 JOHANNESBURG MEDIA PRESENTATION SPEAKER NOTES SASOL CFO PAUL VICTOR
 INTERIM RESULTS ANNOUNCEMENT MONDAY, 26 FEBRUARY 2018 AT 10H00 JOHANNESBURG MEDIA PRESENTATION SPEAKER NOTES SASOL CFO PAUL VICTOR 1 SLIDE 11: TITLE SLIDE Thank you Steve and Bongani, and good morning
INTERIM REPORT Q INVESTOR CONFERENCE CALL. Company announcement no. 5/2017 August 29, 2017
 Company announcement no. 5/2017 August 29, 2017 INTERIM REPORT Q2 2017 INVESTOR CONFERENCE CALL Welltec will discuss its results during an investor conference call today at 5pm CEST. The conference call
Making it happen. 13 June 2017
 Making it happen 13 June 2017 LEGAL NOTICE This presentation has been prepared to inform investors and prospective investors in the secondary markets about the Group and does not constitute an offer of
Unaudited Interim results
 Unaudited Interim results for the six months ended 30 June 2017 CORPORATE INFORMATION Sea Harvest Group Limited (Formerly Sea Harvest Holdings Proprietary Limited) (Incorporated in the Republic of South
HY 2018 Results Presentation August 28, 2018
 HY 2018 Results Presentation August 28, 2018 1 Today s speakers Bert Meulman, CEO CEO since 2004 Joined B&S in 1992, held several leadership positions Shareholding partner since 1995 Gert van Laar, CFO
Northgate plc. Return to growth. Preliminary results Year ended 30 April June Northgate plc
 Northgate plc Return to growth Preliminary results for the year ended 30 April 2014 Northgate plc Preliminary results Year ended 30 April 2013 June 2013 Agenda Group summary Financial review Depreciation
INTERIM RESULTS FOR THE SIX MONTH PERIOD ENDED 31 DECEMBER DECEMBER 2018
 INTERIM RESULTS RESULTS INTERIM FOR THE RESULTS YEAR ENDED FOR THE 30 PERIOD JUN 2017 ENDED FOR THE SIX MONTH PERIOD ENDED 31 DECEMBER 2017 31 DECEMBER 2018 GOVERNANCE UPDATE GOVERNANCE UPDATE Executive
Forward-Looking Statements
 William Blair & Company 27 th Annual Growth Stock Conference June 20, 2007 0 Forward-Looking Statements This presentation contains forward-looking statements that are subject to a number of risks and uncertainties,
Interim Results. Six months ended 31 August 2016
 Interim Results Six months ended 31 August 2016 Stefanutti Stocks City A multi-disciplinary construction group (Vision) (Mission) 2 www.stefanuttistocks.com y 2 Agenda Six month overview Operational Overview
18 October Spatial plc (AIM: SPA) ( 1Spatial, the Group or the Company ) Interim Results for the six month period ended 31 July 2016
 ( 1Spatial, the Group or the Company ) Interim Results for the six month period ended 31 July 2016") 18 October 1Spatial plc (AIM: SPA) ( 1Spatial, the Group or the Company ) Interim Results for the six month period ended The Board of Directors of 1Spatial (the Board ), the AIM Spatial Data company today
18 October 1Spatial plc (AIM: SPA) ( 1Spatial, the Group or the Company ) Interim Results for the six month period ended The Board of Directors of 1Spatial (the Board ), the AIM Spatial Data company today
2017 Full Year Results. Tuesday 21 November 2017
 2017 Full Year Results Tuesday 21 November 2017 Disclaimer Certain information included in the following presentation is forward looking and involves risks, assumptions and uncertainties that could cause
Audited preliminary announcement of consolidated financial results for the year ended 28 February 2014 and a cash dividend declaration
 Wilderness Holdings Limited "Wilderness or the Company or the Group Share code: WIL ISIN: BW0000000868 Registration number: 2004/2986 BSE: Primary Listing JSE: Secondary Listing Audited preliminary announcement
Q Earnings Presentation. Rainer Beaujean, Speaker of the Management Board and CFO April 12, 2018
 Q1 2018 Earnings Presentation Rainer Beaujean, Speaker of the Management Board and CFO April 12, 2018 Disclaimer This presentation may contain certain forward-looking statements, including assumptions,
Group finance director s report
 Group finance director s report Revenue increased by 9,2% on subscriber growth of 28% to 116 million users... Had there been no change in currency rates during the year, revenue growth would have been
AUB GROUP LTD HALF YEAR RESULTS
 AUB GROUP LTD HALF YEAR RESULTS FOR THE PERIOD ENDED 31 DECEMBER 2017 (1H18) 26 FEBRUARY 2018 Page 1 - AUB Group Ltd 1H18 Results NOTICE SUMMARY INFORMATION This document has been prepared by AUB Group
FY12 Results 22 May 2012
 FY12 Results 22 May 2012 DISCLAIMER --- Important Notice This presentation has been prepared by Thorn Group Limited (Thorn). This presentation is not a financial product or investment advice or recommendation,
Responsible investment in growth
 Responsible investment in growth Issued: 17 June 2014 Legal notice This presentation has been prepared to inform investors and prospective investors in the secondary markets about the Group and does not
Half Year Results. for the six months ended 30 November January Chairman Chris Stone CEO Adam Palser CFO Brian Tenner
 Half Year Results for the six months ended 30 November 2017 16 January 2018 Chairman Chris Stone CEO Adam Palser CFO Brian Tenner Agenda Overview and strategy update Financial highlights Financial performance
2018 FOURTH QUARTER EARNINGS CALL
 NORTH AMERICA S LEADING BUILDING MATERIALS DISTRIBUTOR RESIDENTIAL COMMERCIAL INTERIOR SOLAR 2018 FOURTH QUARTER EARNINGS CALL Forward Looking Statements / Non-GAAP Measures This presentation contains
INTERIM RESULTS PRESENTATION SIX MONTHS TO 30 JUNE 2018
 INTERIM RESULTS PRESENTATION SIX MONTHS TO 30 JUNE 2018 DISCLAIMER The information contained in this presentation has not been independently verified and this presentation contains various forward-looking
2018 Interim Results 30 August 2018
 2018 Interim Results 30 August 2018 Disclaimer Statements in this presentation with respect to each of Total Produce s and Dole Food Company's ("Dole") business, strategies, projected financial figures,
Talgo 1H2017 Results July 21,
 Talgo 1H2017 Results July 21, 2017 0 Table of content 1. Operational review (Jose María de Oriol, CEO) Key business highlights 1H2017 Industry record backlog Successful execution of Mecca-Medina project
EVRY ASA Q PRESENTATION CEO BJÖRN IVROTH CFO HENRIK SCHIBLER
 1 EVRY ASA Q3 2018 PRESENTATION CEO BJÖRN IVROTH CFO HENRIK SCHIBLER Agenda Group highlights Business update Financial highlights Business area performance Concluding remarks Q&A 2 Group highlights Q3
WESCO International John Engel Chairman, President and CEO. EPG Conference May 16, 2016
 WESCO International John Engel Chairman, President and CEO Safe Harbor Statement Note: All statements made herein that are not historical facts should be considered as forwardlooking statements within
2018 Full Year Results 20 November 2018
 2018 Full Year Results 20 November 2018 Disclaimer Certain information included in the following presentation is forward looking and involves risks, assumptions and uncertainties that could cause actual
2011 Annual Results. November 2011
 2011 Annual Results November 2011 1 Agenda Highlights Group results Operational review Strategic review 2 Highlights HEPS from continuing operations up 21% Dividend increased by 30% to 108 cents per share
WESCO International John Engel Chairman, President and CEO. William Blair & Company 36 th Annual Growth Stock Conference June 14, 2016
 WESCO International John Engel Chairman, President and CEO William Blair & Company 36 th Annual Growth Stock Conference June 14, 2016 Safe Harbor Statement Note: All statements made herein that are not
Hydrodec Group plc Results Presentation. March Ian Smale, Chief Executive Chris Ellis, Chief Financial Officer
 Hydrodec Group plc 2012 Results Presentation March 2013 Ian Smale, Chief Executive Chris Ellis, Chief Financial Officer 1 PRECAUTIONARY STATEMENT This presentation has been issued by Hydrodec Group plc
Our Transformation Continues. March 21, 2018
 Our Transformation Continues March 21, 2018 Disclosure Regarding Forward-Looking Statements Forward-Looking Statements and Factors That May Affect Future Results: Throughout this presentation, we make
Annual Financial Results for the financial year ended 31 March 2018
 PRESENTATION JUNE 2018 Annual Financial Results for the financial year ended 31 March 2018 Contents EXECUTIVE OVERVIEW FINANCIAL REVIEW OPERATING REVIEW OUTLOOK PRESENTED BY: Neil Birch Chief Executive
JOHN WOOD GROUP PLC GROUP FINANCIAL STATEMENTS. FOR THE YEAR TO 31st DECEMBER Company Registration Number SC 36219
 JOHN WOOD GROUP PLC GROUP FINANCIAL STATEMENTS FOR THE YEAR TO 31st DECEMBER 2017 Company Registration Number SC 36219 1 Consolidated income statement Pre- Exceptional Items Exceptional Items (note 4)
Investor Presentation
 Investor Presentation Cautionary Note Regarding Forward-Looking Statements This presentation contains forward-looking information, including the Company s statements regarding its future outlook. In addition,
Part 1 Executing our strategy
 Entwurf 19.09.018 15h00 Part 1 Executing our strategy Klaus Rosenfeld Chief Executive Officer Capital Markets Day 018 Berlin Disclaimer This presentation contains forward-looking statements. The words
Living our values. Netcare Limited Audited Group Results. for the year ended 30 September 2008 CARE DIGNITY PARTICIPATION TRUTH PASSION
 CARE DIGNITY PARTICIPATION TRUTH PASSION Netcare Limited Audited Group Results for the year ended tember 2008 CARE DIGNITY PARTICIPATION TRUTH PASSION Note regarding forward looking statements The Company
Investor Presentation
 Investor Presentation Cautionary Note Regarding Forward-Looking Statements This presentation contains forward-looking information, including the Company s statements regarding its future outlook. In addition,
STEEL & TUBE HOLDINGS LIMITED. HY18 Interim Results Presentation. For the Six Months to 31 December February 2018
 STEEL & TUBE HOLDINGS LIMITED HY18 Interim Results Presentation For the Six Months to 31 December 2017 23 February 2018 BECOMING A MODERN AND INNOVATIVE COMPANY Providing Strength to New Zealand Steel
Our Transformation Continues Sidoti NDR May 29-30, 2018
 Our Transformation Continues Sidoti NDR May 29-30, 2018 Disclosure Regarding Forward-Looking Statements Forward-Looking Statements and Factors That May Affect Future Results: Throughout this presentation,
Full year results Andrew Wood, CEO WorleyParsons
 Full year results 2015 Andrew Wood, CEO WorleyParsons Disclaimer The information in this presentation about the WorleyParsons Group and its activities is current as at 26 August 2015 and should be read
Kathmandu Holdings Limited
 Kathmandu Holdings Limited New Zealand Stock Exchange Listing Rules Disclosure Half Year Report For the period ending 2018 Contents Appendix 1 Media Announcement Directors Report Interim Report (including
Key features Commentary Condensed group statement of financial position Condensed group statement of profit and loss and other comprehensive income
 UNAUDITED INTERIM RESULTS FOR THE SIX MONTHS ENDED 31 DECEMBER 2018 Key features Commentary Condensed group statement of financial position Condensed group statement of profit and loss and other comprehensive
Headline Earnings Per Share (HEPS), and Earnings Per Share (EPS) increased by 231% to 9.6 cents per share.
, and Earnings Per Share (EPS) increased by 231% to 9.6 cents per share.") HIGHLIGHTS Headline Earnings Per Share (HEPS), and Earnings Per Share (EPS) increased by 231% to 9.6 cents per share. Revenue from continuing operations increased by 12% to R872 million. Net asset value
HIGHLIGHTS Headline Earnings Per Share (HEPS), and Earnings Per Share (EPS) increased by 231% to 9.6 cents per share. Revenue from continuing operations increased by 12% to R872 million. Net asset value
Full year results to 31 December Morgan Sindall Group plc 22 February 2018
 Full year results to 31 December 2017 Morgan Sindall Group plc 22 February 2018 Agenda Introduction John Morgan FY 2017 Financial and Operational Review Steve Crummett Investments John Morgan 2 Summary
ANNUAL REPORT We enable people and organisations to work, live and thrive in new places around the world. We make it easy
 ANNUAL REPORT 2017 We enable people and organisations to work, live and thrive in new places around the world. TODAY S AGENDA Full Year Highlights 03 Q4 Highlights 06 Market Trends (Europe, Asia, Australia,
Segmental operating profit 227.7m Down 17% 1. Reported earnings per share 59.8p Down 4%
 Highlights Revenue 1,649m Down 5% 1 Segmental operating profit 227.7m Down 17% 1 Segmental operating margins 13.8% Down 160bps Operating cash flow 2 246m Up 6% Reported earnings per share 59.8p Down 4%
Alfa Laval AB (publ) Interim report January 1 March 31, 2005
 Interim report January 1 March 31, 2005") Alfa Laval AB (publ) Interim report January 1 March 31, 2005 "Orders received during the first quarter 2005 increased with five percent, excluding exchange rate variations. Alfa Laval further strengthened
Alfa Laval AB (publ) Interim report January 1 March 31, 2005 "Orders received during the first quarter 2005 increased with five percent, excluding exchange rate variations. Alfa Laval further strengthened
H1 16 interim results. 22 September 2015
 H1 16 interim results 22 September 2015 Important notice 2 This presentation may include certain forward-looking statements, beliefs or opinions, including statements with respect to the Company s business,
ARYZTA AG. FY 2016 Results. 26 September 2016
 ARYZTA AG FY 2016 Results 26 September 2016 Forward Looking Statement This document contains forward looking statements which reflect management s current views and estimates. The forward looking statements
Group in Summary MEUR % % Revenue % %
 Handicare Group AB (publ) Torshamnsgatan 35, SE-164 40 Kista Sweden Tel: +46 8 523 281 00 Corp. Reg. No.: 556982-7115 www.handicaregroup.com Year-end report 2017 Continued organic growth and improved margins
BBA Aviation. BBA Aviation 2017 Final Results
 BBA Aviation 2017 Strong execution in favourable market conditions Signature Significant progress on the commercial renegotiations Unique global network of 198 FBOs Investing for future growth Signature
Reditus EBITDA increases 76.9% in 2017
 Reditus EBITDA increases 76.9% in 2017 EBITDA of EUR 4,9 million (vs. EUR 2.8 million in 2016) EBITDA margin of 11.6% (vs. 6.1% in 2016) Net Loss of EUR 1,6 Million (vs. EUR 2,9 Million loss in 2016) Operating
Q Investor Highlights. August 8, 2018
 Q2 2018 Investor Highlights August 8, 2018 Forward Looking Statements This document contains forward-looking statements, that is, information related to future, not past, events. Such statements generally
Investor Day. Corporate Overview. Henry Buckley, President & CEO and Eric Bussières, CFO November 28, 2017
 Investor Day Corporate Overview Henry Buckley, President & CEO and Eric Bussières, CFO November 28, 2017 Preliminary Comments Forward-looking statements: The information provided in this presentation contains
Q Results. Lars Brorsen (CEO) Christoph Hobo (CFO) November 22, 2018
 Christoph Hobo (CFO) November 22, 2018") Q3 2018 Results Lars Brorsen (CEO) Christoph Hobo (CFO) November 22, 2018 Agenda 1. Highlights Q3 2018 2. Market outlook 3. Detailed results review 4. Company outlook 5. Q&A Appendix 1 Business summary
Q3 2018 Results Lars Brorsen (CEO) Christoph Hobo (CFO) November 22, 2018 Agenda 1. Highlights Q3 2018 2. Market outlook 3. Detailed results review 4. Company outlook 5. Q&A Appendix 1 Business summary
CABOT CREDIT MANAGEMENT Financial Results. For the nine months ended 30 September 2018
 CABOT CREDIT MANAGEMENT Financial Results For the nine months ended 30 September 2018 8 November 2018 DISCLAIMER This presentation has been prepared by Cabot Credit Management ( the Company ) solely for
Q Interim Report. October 25, 2018 Panu Routila, President & CEO Teo Ottola, CFO
 Q3 2018 Interim Report October 25, 2018 Panu Routila, President & CEO Teo Ottola, CFO 2 Agenda 1. Group highlights 2. Business Area Service 3. Business Area Industrial Equipment 4. Business Area Port Solutions
/ Ancenis, 30 July 2018 The board of directors of Manitou BF, meeting on this day, closed the accounts for the
 Manitou: 2018 Half-year results H1'18 net sales of 941m* up +17% vs. H1'17 and +18% on a comparable basis** Q2 machine order intake of 371m vs. 408m in Q2'17 H1 machine order intake of 926m vs. 842m in
Availability, Reliability, Ease. 11 December 2018
 Availability, Reliability, Ease 11 December 2018 LEGAL NOTICE This presentation has been prepared to inform investors and prospective investors in the secondary markets about the Group and does not constitute
Q Investor Presentation. March 31, 2013
 Q2 2013 Investor Presentation March 31, 2013 Forward-Looking Information This presentation contains forward-looking statements. All forward-looking statements speak only as of the date of this presentation.
HALF YEAR INVESTORS & ANALYSTS PRESENTATION. July 2018
 2018 HALF YEAR INVESTORS & ANALYSTS PRESENTATION July 2018 2 Important Information This presentation has been prepared by Sterling Bank PLC. It is intended for an audience of professional and institutional
AUDITED RESULTS for the year ended 30 September 2017
 AUDITED RESULTS for the year ended 30 September 2017 0 Introductory video WELCOME Jayendra Naidoo CHAIRMAN LISTING 20 September 2017 Ben la Grange CEO 3 STAR LISTING JSE main board listing completed on
INTERIM FINANCIAL RESULTS
 Presentation Tuesday, 14 November 2017 INTERIM FINANCIAL RESULTS For the six months ended 30 September 2017 Contents EXECUTIVE OVERVIEW FINANCIAL REVIEW OPERATIONAL REVIEW OUTLOOK & STRATEGY Presented
OVERVIEW Group highlights. The Maslow Hotel
 OVERVIEW Group highlights The Maslow Hotel 2 Key indicators R5 407m R1 489m 334 cps 90 cps GROUP REVENUE GROUP EBITDA ADJ DILUTED HEPS DPS +4% (5%) (18%) (18%) 3 Kalahari Sands Operating environment Pressure