Talgo 1H2017 Results July 21,
|
|
|
- Shanon Owens
- 6 years ago
- Views:
Transcription


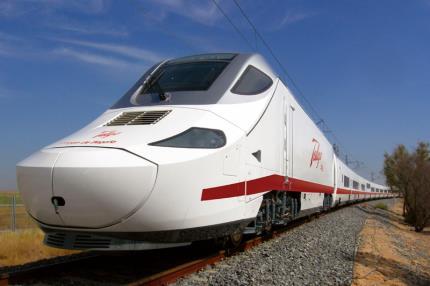


1 Talgo 1H2017 Results July 21,
 Key business highlights 1H2017 Industry record backlog Successful execution of Mecca-Medina project Great achievement of VHS contract in Spain Installed")
2 Table of content 1. Operational review (Jose María de Oriol, CEO) Key business highlights 1H2017 Industry record backlog Successful execution of Mecca-Medina project Great achievement of VHS contract in Spain Installed base continue to grow maintenance revenues Strong awards during Financial Highlights (Eduardo Fernández-Gorostiaga, CFO) 3. Pipeline and Outlook FY2017 (Jose María de Oriol, CEO) APPENDIX 1
3 1.1 Key business highlights 1H2017 Main financial Highlights: o Adjusted Net income reached 32 m, resulting on 15% ROS (13% in 2016). o Adjusted Ebitda reached 50 m in the period, enhancing Ebitda margins to 23%. o Net turnover reached 215 m in 1H2017 (-28% vs 1H2016) according to the current manufacturing cycle of the main contracts under execution. o Significant cash generation cycle to start in 2H2017. o NFD amounted 212 m (1) at June x leverage ratio over the adjusted LTM Ebitda, with optimized repayment schedule through long term financing facilities with low interest rates. Strong NFD reduction expected for FY2017. o 2,747 m contracted backlog as of June 2017, which would increase to 3,300 m if all awarded amount were considered. Operational Highlights: o Execution of current manufacturing backlog on time and budget: all manufacturing and maintenance contracts executed at or above margins target. o Successful execution of all maintenance contracts. o Significant order intake during the first half mainly driven by Spanish VHS contract. o Strong commercial activity in both existing and new opportunities, with a large and active pipeline amounting 9.4 b. (1) Does not include loans with public administrations related to R&D projects. 2
4 1.2 Industry record backlog (6.6x) Backlog evolution ( m) 1H2017 Backlog by business line Times LTM net turnover 4.5x 2, x 2, x 3, % 19.7% Already awarded pending to be signed 77.0% 2,747 m H VHS Optional + 30 VHS Mainten. (1) Total Awarded Manufacturing Maintenance Maint. equip. & other Manufacturing backlog was executed in 1H2017 according to the contracts schedule and customer needs. Increasing manufacturing backlog due to recently awarded Spanish VHS contract. If considered the total contract awards pending to be signed, backlog would increase to 3.3 b. While manufacturing backlog increases in the period to 541 m, 77% of current order book correspond to maintenance services, ensuring long-term cash generation capacity. Maintenance equipment remains as a complementary business line (3.3% of backlog). (1) Maintenance of 30 VHS only includes Talgo s share in the JV to be established with Renfe 3

5 1.3 Successful execution of Mecca-Medina project Scope of the contract: manufacture of 36 VHS Talgo 350 trains, with and an option for 20 additional trains. The contract also includes the maintenance for a period of 12 years. Execution performance: project under execution in line with Company expectations and an degree of progress reaching finalization: 30 trains are already finished, out of which 11 trains have already been sent to Arabia. Additional shipment expected to be done once the Medina depot is finished. Additional trains under manufacturing process and expected to be finished throughout 2017 and 1Q2018. Ongoing static and dynamic tests. Speed-up test to reach the maximum speed of the Project (330 km/h) was successfully completed in 1H2017 (10% above the commercial speed established in 300 km/h). Provisional acceptance is expected for 2018 with start of commercial operations. As a result, the project is being executed in time and budget with no significant risks identified. Significant payment milestones of the project are expected to be reached in 2H2017 and Start of dynamic testing for train certification New infrastructure ready for shipping of additional trains (Medina depot) Expected start of commercial operations (according to last schedule agreed with SRO) 3Q2017 4Q2017 1H2018 4
. o o First 15 trains manufacturing contract was signed in April 2017. These trains will have fixed gauge and will be also certified in France.")

6 1.4 Great achievement of VHS contract in Spain Scope of the contract: manufacture of 30 VHS trains AVRIL and maintenance for a period of 30 years, for a total award amount of 1.2 b (0.9 b for Talgo considering 50% of maintenance). o o First 15 trains manufacturing contract was signed in April These trains will have fixed gauge and will be also certified in France. Additional 15 trains awarded in June 2017 and expected to be signed in the following months. These trains will have Talgo s variable gauge system. Execution performance: project execution already started with schedule of staggered deliveries beginning on The first public tender in which Talgo offered its new AVRIL VHS train, which has been developed during recent years and contains the most advance technology of the industry: o o o Higher power while lowering energy consumption, being the lightest train on the market. Wider coach offering higher capacity in one floor (3+2 seats). Technical advances resulting in high reliability and optimized maintenance costs. Exterior design in Renfe offer Interior 3+2 design in Renfe offer 5
7 1.5 Increasing fleet continue to grow maintenance revenues Talgo provides maintenance services to its manufactured trains and to units produced by third-parties. A strong expertise together with a solid maintenance portfolio provides recurrent activity and long term business stability to the Company. All contracts are being successfully executed, providing high quality of service, high reliability and customer safety, while improvements are continuously implemented increasing operational and cost efficiencies. The size of maintained fleet is expected to continue growing as the contracted manufacturing backlog is delivered (additional coaches in Kazakhstan and Arabia will be added to maintenance portfolio). As of June 2017, the maintained fleet reached 2,736 units, representing +4.6% CAGR in the period H2017. Aver. number of vehicles maintained (#) 1 Company maintenance strategy CAGR: +4.6% Manufacturing 2,288 2,397 2, ,717 2, ,098 2,209 2,259 2,533 2,548 Feed-back On board Operation Expertise H2017 Coaches Powerheads (1) Include both cars and powerheads. Note: Additional c. 80 coaches (stable over the period H2017) manufactured by third parties are maintained by Talgo in Germany. Such cars are around two times longer than Talgo standard coaches. Maintenance 6
8 1.6 Strong awards during 2017 Order intake evolution H2017 ( m) Book-tobill ratio 1.3x 2.1x 0.9x 0.1x 0.1x 1.8x Average H Awarded Signed H2017 In December 2016 RENFE awarded Talgo a project for the manufacture and maintenance of 15 VHS trains for a total consideration of 537 m (1). Manufacturing contract amounting 338 m was signed on April In addition, during 2Q2017 RENFE executed the option ordering 15 additional units, increasing therefore the order to 30 VHS trains for a total considerations of 890 m (1), which is expected to be signed in 2H2017. With all, Talgo has marketed the most advanced technology developed in-house for the high-speed segment (AVRIL) through the largest contract in Europe for a while. (1) Note: considering Talgo 50% share of maintenance 7
9 Table of content 1. Operational review (Jose María de Oriol, CEO) 2. Financial Highlights (Eduardo Fernández-Gorostiaga, CFO) Revenues and Ebitda evolution Significant cash generation cycle starts Comfortable financing structure Scrip Dividend 87% chose to receive shares 3. Pipeline and Outlook FY2017 (Jose María de Oriol, CEO) APPENDIX 8
10 Revenues and Ebitda evolution Net turnover ( m) +40% % Net Turnover reached 215 m in 1H 2017, 28% below than same period of 2016, driven by lower manufacturing activity in accordance with the current manufacturing stages: Contracted manufacturing backlog executed on budget and meeting schedules set with the customers. 1H H H2017 Adj. Ebitda ( m) and Adj. Ebitda margin (%) Net turnover recognition reflect the manufacturing cycle of the main projects under execution. High quality and reliability in maintenance services provided. Adjusted Ebitda reached 50.4 m in 1H2017 in line with manufacturing pace % % 50.4 However, Ebitda margin increased in the same period to 23% driven by costs efficiencies and projects mix, showing: 25% 20% 23% 1H H H 2017 Adj. Ebitda Adj. Ebitda margin Successful performance of the projects under execution and finished. Commitment with returns, enhancing Ebitda margin above the Company target (20%). Adjusted ROS to 15% (13% in 1H2016). 9
11 2.2 Significant cash generation cycle starts Net cash inflows expected for 2H2017 and 2018 driven by the expected delivery process in our current key manufacturing projects (mainly Mecca-Medina project), reducing significantly the Working Capital and the net financial debt of the Company. During 1H2017, Working Capital increased in line with Company expectations: Accounts receivable and payables: main drivers of working capital increase, mainly due to manufacturing projects stage. Inventory higher consumption reflects the late stages of the main manufacturing projects. Advances received: reflects the prepayments related to recent awards. Working Capital performance ( m) ( m) FY2016 1H2017 Accounts receivable Other receivables Assets held for sale Inventories Acc. payables (excl. advances) (162.5) (124.3) Advances received (11.5) (42.5) Other current liabilities (4.5) (4.7) Working capital Free Cash Flow evolution ( m) (19.7) (54.7) (4.5) FY2015 FY2016 1H
12 2.3 Comfortable financing structure Net Financial Debt ( m) (1) Long term bank loans Repayment schedule ( m) NFD / LTM Adj. Ebitda 1.7x 2.0x m x Optimized bank financing profile with long term maturity H2017 FY2017 Expected > 2021 During 1H2017 Talgo continued to take advantage of favorable debt markets to issue long term debt with bullet maturities and attractive interest rates in order to finance both ongoing and forthcoming projects. No additional debt is expected to be issued. Gross bank debt amounted 279 m: Total available credit facility Committed credit lines at June 2017 ( m) 170 m 1H2017 Banco Santander 80 European Investment Bank 32 Long term debt with bullet maturities 166 Accrued debt interests 1 Total banking debt 279 Drawn credit 0 Full availability of credit lines (100% undrawn) (1) Financial Net Debt excludes reimbursable advances with Spanish Public Administration entities related with R&D (22.7 m in June 2017) which are not considered financial debt due to their recurrence. 11
13 2.5 Scrip Dividend 87% chose to receive shares Talgo Started in 1H2017 a shareholders remuneration through two different schemes: Scrip dividend Programme: remuneration system implemented with the aim of allowing shareholders to decide whether they wish to receive all or a portion of their remuneration in cash or in paid-up shares of Talgo. Buy Back Programme: acquisition of shares in the market followed by a share capital reduction through the redemption of the previously acquired shares. Talgo disbursed a total amount of 11.3 m to implement both programmes. Under the item Five on the agenda approved in the General Shareholders Meeting held on May 2017, the Company has implemented a Scrip dividend Programme amounting 10 m. Scrip Dividend Programme Shareholders holding 86.7% of the company shares chose to receive shares, while the remaining 13.3% chose to receive cash payment. As a result, the company paid in cash 1.3 m to those shareholders that requested cash payment, and 1,582,092 new shares issued through a capital increase charged against reserves were given to remaining shareholders. On February 23 rd the Board of Directors resolved to implement a Buy-back Programme of the Company s own shares (1). Buy-back Programme Under this Programme and in accordance with the established terms, through the period April 6 th June 19 th the company acquired 1,852,394 own shares for a total consideration of 10 m. Under the item Six on the agenda approved in the General Shareholders Meeting held on May 2017, the Company is currently implementing a reduction of the share capital through the redemption of the acquired shares, which is expected to finalize in 3Q2017. (1) in accordance with the authorisation granted by the General Shareholders Meeting held on 28 March
14 Table of content 1. Operational review (Jose María de Oriol, CEO) 2. Financial Highlights (Eduardo Fernández-Gorostiaga, CFO) 3. Pipeline and Outlook FY2017 (Jose María de Oriol, CEO) Commercial developments Summary and outlook APPENDIX 13
15 3.1 Commercial developments Talgo pipeline by geography (1) Europe APAC MENA CIS Latam NAFTA 4% 6% 4% Talgo pipeline by segment (1) VHS/HS EMU Passenger Coaches 26% 17% 43% Talgo identified pipeline amounts to 9.4 b 44% 25% 31% Considered pipeline comprises those commercial opportunities in which Talgo is actively working and are expected to be awarded during the period Tenders identified as attainable for Talgo in the: HS/VHS tenders states as the segment with higher growth potential in the next years. Regional commuter trains: increasing number of opportunities worldwide. Passenger coaches opportunities to take into advantage the Talgo natural tilting system for countries under development. Talgo Presence Talgo New segments VHS HS Passenger coaches Regional trains Commuters Metros/undergrounds and light rail and trams Talgo 350 / Talgo Avril Talgo 250 Natural tilting passenger coaches New Talgo EMU (1) maintenance have not been considered in the identified pipeline, which could increase significantly its amount. 14
16 3.2 Summary and Outlook Outlook given in Feb-2017 Performance 1H2017 Expectations for FY2017 Business performance: Manufacturing / Maintenance activity Manufacturing execution will continue in current projects. Maintenance activity to continue providing stability and recurrent revenues. Further internationalization. Proactive commercial activity. Backlog execution in line with current manufacturing cycle of main projects under execution. Successful maintenance services provided. Substantially increased Backlog driven by VHS Spain contract. Manufacturing execution: updated industrial activity driven by manufacturing pace and customer needs. Maintenance activity expected to continue providing stability and recurrent revenues. Further internationalization and proactive commercial activity. Profitability Profitability ratios expected to achieve the Company objectives (>20%). 23% Ebitda margin delivered in 1H2017, above company target. An efficient business model and operational excellence to drive margins above 22% by FY2017. Cash Flow and Capital Structure Improvement of Working Capital expected for Growth capex expected of m. NFD to be reduced in NFD/EBITDA target: x. Working capital remained high as expected. Capex in new products (AVRIL and EMU): 2.2 m. Leverage ratio at 2.0x pending to reflect forthcoming payments. Comfortable long term banking debt profile. Strong improvement of Working Capital profile expected for Capex expected of m. NFD to be reduced in FY2017 as manufacturing milestones are met in ongoing projects. NFD/Ebitda target: x. Dividend / Pay-out Commitment to remunerate shareholders in 1H2017. Start of a share buy back program (1). Dividend programme implemented (Buy-back and Scrip Dividend) Talgo remunerating commitment with shareholders expected to continue in following years. (1) In line with the Relevant Fact published by the Company on Thursday 23 rd in CNMV 15
17 Table of content 1. Operational review (Jose María de Oriol, CEO) 2. Financial Highlights (Eduardo Fernández-Gorostiaga, CFO) 3. Pipeline and Outlook FY2017 (Jose María de Oriol, CEO) Appendix 16
18 Appendix 1. Profit & Loss Profit & Loss Account ( m) 1H17 1H16 1H15 % Change Total net turnover (28.1%) Other income % Procurement costs (92.0) (177.8) (103.7) (48.2%) Personnel costs (1) (51.6) (47.2) (50.8) 9.4% Other operating expenses (27.1) (20.0) (26.7) 35.1% EBITDA (15.5%) % Ebitda margin 22.4% 19.1% 18.3% Other adjustments % Long-term stock compensation plan n.a. Adjusted EBITDA (14.7%) % Adj. Ebitda margin 23.4% 19.7% 25.2% D&A (inc. depreciation provisions) (10.2) (9.8) (9.0) 3.6% EBIT (19.4%) % Ebit margin 17.7% 15.8% 14.1% Other adjustments % Long-term stock compensation plan n.a. AVRIL Amortization % Adjusted EBIT (13.8%) % Adj. Ebit margin 21.3% 17.8% 22.9% Net financial expenses (4.6) (3.3) (2.3) 41.8% Profit before tax (24.0%) Tax (7.4) (9.4) (4.4) (21.1%) Profit for the period (24.7%) Adjusted Profit for the period (18.4%) (1) Include personnel welfare expenses and social expenses. 17
19 Appendix 2. Balance Sheet Balance Sheet June 2017 Dec 2016 June 2016 FIXED ASSETS Tangible + intangible assets Goodwill Other long term assets CURRENT ASSETS Inventories Non- current assets held for sale Accounts receivable Other current assets Cash & cash equivalents TOTAL ASSETS Balance Sheet June 2017 Dec 2016 June 2016 SHAREHOLDERS EQUITY Capital Stock Share premium Consolidated reserves Retained earnings Other equity instruments NON-CURRENT LIABILITIES: Debt with credit institutions Provisions Other financial liabilities Other long-term debts CURRENT LIABILITIES: Accounts payable Debt with credit institutions Other financial liabilities Provisions for other liabilities and other TOTAL S. EQUITY + LIABILITIES
20 Appendix 3. Cash Flow Statement Cash flow statement 1H17 1H16 1H15 % Change million Net income (24.7%) Corporate income tax (21.1%) Depreciation & Amortization % Financial income/financial expenses % Other result adjustments (2.4) (435.7%) Changes in working capital (41.8) (135.6) (113.7) (69.2%) Operating cashflows after changes in WC 3.9 (78.0) (66.9) (105.0%) Net interest expenses (3.9) (3.1) (2.1) 24.3% Provision and pension payments n.a. Income tax paid (4.2) (2.2) (2.3) 89.3% Other collection and payments n.a. Net cash flows from operating activities (4.2) (83.3) (71.3) (95.0%) Investments (4.2) (3.9) (5.9) 6.2% Changes in financial assets and liablities (32.1%) Purchase of non-controlling interests (10.0) 0.0 (23.0) n.a. Dividends payments (1.3) 0.0 (107.4) n.a. Net cash flows from financing activities (47.8%) Net variation in cash & cash eq (15.6) (70.7) (286.4%) 19
21 Disclaimer This presentation has been prepared and issued by Talgo, S.A. (the Company ) for the sole purpose expressed therein. Therefore, neither this presentation nor any of the information contained herein constitutes an offer sale or exchange of securities, invitation to purchase or sale shares of the Company or its subsidiaries or any advice or recommendation with respect to such securities. The content of this presentation is purely for information purposes and the statements it contains may reflect certain forward-looking statements, expectations and forecasts about the Company and/or its subsidiaries at the time of its elaboration. These expectations and forecasts are not in themselves guarantees of future performance as they are subject to risks, uncertainties and other important factors beyond the control of the Company and/or its subsidiaries that could result in final results materially differing from those contained in these statements. This document contains information that has not been audited. In this sense, this information is subject to, and must be read in conjunction with, all other publicly available information. This disclaimer should be taken into consideration by all the individuals or entities to whom this document is targeted and by those who consider that they have to make decisions or issue opinions related to securities issued by the Company. In general, neither the Company or any of its subsidiaries, nor their directors, representatives, associates, subsidiaries, managers, partners, employees or advisors accept any responsibility for this information, the accuracy of the estimations contained herein or unauthorized use of the same. The Company expressly declare that is not obligated to updated or revise such information and/or estimations. 20
22 21
Talgo 1H2017 Results July 21,
 Talgo 1H2017 Results July 21, 2017 0 Table of content 1. Operational review (Jose María de Oriol, CEO) Key business highlights 1H2017 Industry record backlog Successful execution of Mecca-Medina project
talgo.com Introducing Talgo
 talgo.com Introducing Talgo 0 Table of content 1. Global railway rolling stock market 2. Company overview 3. The Talgo proposition: Products and Technology 4. Business Model 5. Financial Overview 6. Four
April 2015 A LEADING TECH COMPANY
 April 2015 A LEADING TECH COMPANY This presentation has been produced by Indra for the sole purpose expressed therein. Therefore, neither this presentation nor any of the information contained herein constitutes
1H17 Results 21 July 2017
 1H17 Results 21 July 2017 Disclaimer This document has been prepared by NATURHOUSE HEALTH S.A. ( NATURHOUSE or the Company ) for its exclusive use during the presentations announcing the Company s results
CONFERENCE CALL DETAILS
 November 7 th, 2018 2 CONFERENCE CALL DETAILS LIVE EVENT: The Company will host a conference call for investors and analysts today at 18:30 (Spanish time). Please find below conference call telephone numbers:
RESULTS 1Q18. May 14 th, 2018
 RESULTS May 14 th, 2018 CONFERENCE CALL DETAILS LIVE EVENT: The Company will host a conference call for investors and analysts today at 12:00 (CET). Please find below conference call telephone numbers:
RESULTS 1H18. July 27 th, 2018
 RESULTS July 27 th, 2018 CONFERENCE CALL DETAILS LIVE EVENT: The Company will host a conference call for investors and analysts today at 12:30 (CEST). Please find below conference call telephone numbers:
1Q18 Key figures SALES 8,671 +3,7% +14,7% EBIT % +16.9% NET PROFIT % +13.4% NET DEBT % BACKLOG 66,677-2,1% +10.
 Key figures Figures in million YoY Var. Like for Like Var. 1 SALES 8,671 +3,7% +14,7% EBIT 473 +7.9% +16.9% NET PROFIT 250 +7.4% +13.4% NET OPERATING CASH FLOW (2) LTM 1,603 +40.9% NET DEBT 359-78.8% BACKLOG
RESULTS 9M17. November 7 th, 2017
 November 7 th, 2017 CONFERENCE CALL DETAILS LIVE EVENT: The Company will host a conference call for investors and analysts today at 18:30 (CET). Please find below conference call telephone numbers: Spain:
RESULTS February 27 th, 2018
 RESULTS 2017 February 27 th, 2018 CONFERENCE CALL DETAILS LIVE EVENT: The Company will host a conference call for investors and analysts today at 18:30 (CET). Please find below conference call telephone
Results Presentation 1Q May 12 th 2017
 Results Presentation 1Q 2017 May 12 th 2017 Executive Summary OPERATING OUTPERFORMANCE 11% Sales & EBIT recovery in CIMIC & margins stability NET PROFIT GROWTH in the HIGH END TARGET 12.6% like-for-like*
Quarter ended December 31, High Yield report
 Quarter ended December 31, 2013 High Yield report Key Highlights Quarterly Recurring EBITDA in line with guidance provided to markets and above market on revenue and booking growth showing the advantages
Interim Report Q4 FY 17
 Interim Report Q4 FY 17 Quarter 4 / Fiscal Year 2017 Sustained positive development Sivantos delivered 3.1% organic growth 1) in Q4 FY2017. The moderate growth rate compared to previous quarters was a
Siemens Gamesa Renewable Energy Q3 18 Results
 Siemens Gamesa Renewable Energy Q3 18 Results 27 July 2018 Disclaimer This material has been prepared by Siemens Gamesa Renewable Energy, and is disclosed solely for information purposes. This document
Interim Report Q1 FY 18
 Interim Report Q1 FY 18 Quarter 1 / Fiscal Year 2018 Continued positive development extends into the new fiscal year Sivantos delivered 3.5% organic growth 1) in Q1 2018 with negative Fx translation effects
RESULTS 1Q17. May 11 th, 2017
 RESULTS May 11 th, 2017 CONFERENCE CALL DETAILS The Company will host a conference call for investors and analysts today at 18:30 (CET). Please find below conference call telephone numbers: Spain: +34
INDRA S NET PROFIT INCREASED BY +23% IN 1H17, TO REACH 38 MILLION EUROS
 Revenues increased by +4% and EBITDA increased by +7% after Tecnocom s integration INDRA S NET PROFIT INCREASED BY +23% IN 1H17, TO REACH 38 MILLION EUROS Revenues in 1H17 totaled 1,379m, growing by +4%
INDRA POSTED NET PROFIT OF 70 MILLION EUROS IN 2016
 In 2015, Indra posted losses of -641m, due to extraordinary adjustments INDRA POSTED NET PROFIT OF 70 MILLION EUROS IN 2016 It s worth highlighting the strong cash generation ( +184m) thanks to the improvement
KION UPDATE CALL Q Gordon Riske, CEO Thomas Toepfer, CFO Wiesbaden, 7 May 2015
 KION UPDATE CALL 2015 Gordon Riske, CEO Thomas Toepfer, CFO Wiesbaden, 7 May 2015 AGENDA 1 Highlights Gordon Riske 2 Market update Gordon Riske 3 Financial update Thomas Toepfer 4 Outlook Gordon Riske
FY 2018 FINANCIAL RESULTS. MILAN March 5 th,2019
 FY 2018 FINANCIAL RESULTS MILAN March 5 th,2019 AGENDA FY 2018 Highlights o Group overview o Results by business o Outlook Financial Results Appendix 2 FY 2018 Financial Highlights Fully combined organic
Q results. 2 May 2018 Dr Frank Hiller, CEO Dr Andreas Strecker, CFO
 Q1 2018 results 2 May 2018 Dr Frank Hiller, CEO Dr Andreas Strecker, CFO AGENDA Key messages & update on E-DEUTZ Financials Outlook Annex 2 Key messages Strong start to the 2018 financial year Exceptional
Financial Results. Full Year March 2017
 Financial Results Full Year 2016 March 2017 Disclaimer This presentation is being furnished to you solely for your information and may not be reproduced or redistributed to any other person. This presentation
2014/15 HALF-YEAR RESULTS
 FOR ALL THE TRAINS IN THE WORLD 2014/15 HALF-YEAR RESULTS H1 2014/15 HIGHLIGHTS H1 2014/15 HIGHLIGHTS A good start of the year: EUR 1,694.5 m order book, +3.3% growth EUR 486.7 m revenues, +9.2% vs H1
Siemens Gamesa Renewable Energy Q Results
 Siemens Gamesa Renewable Energy Q2 208 Results 04 May 208 Disclaimer This material has been prepared by Siemens Gamesa Renewable Energy, and is disclosed solely for information purposes. This document
First Quarter 2016 Performance Summary
 First Quarter 2016 Performance Summary Operational and Financial Highlights - 1Q 2016 Grifols' revenues increase by +5.6% to Euros 959 million, driven by growth of +10.9% for the Bioscience Division The
9M 2018 FINANCIAL RESULTS. Milan November 14 th, 2018
 9M 2018 FINANCIAL RESULTS Milan November 14 th, 2018 1 AGENDA 9M 2018 Highlights o Group overview o Results by business Financial results Appendix 2 9M 2018 Financial Highlights Organic sales growth at
INDRA INCREASED ITS ORDER INTAKE BY +26% AND ITS REVENUES BY +15% IN 1Q18
 INDRA INCREASED ITS ORDER INTAKE BY +26% AND ITS REVENUES BY +15% IN 1Q18 Both T&D and IT posted growth in 1Q18 Net Order Intake Growth in Revenues is backed by the IT business (contribution of Tecnocom
Financial Results 1H August 2016
 Financial Results 1H 2016 August 2016 Disclaimer This presentation is being furnished to you solely for your information and may not be reproduced or redistributed to any other person. This presentation
1Q 2018 Fornebu, April 27, 2018 Luis Araujo and Svein Stoknes
 1Q 2018 Fornebu, April 27, 2018 Luis Araujo and Svein Stoknes Agenda 1Q 2018 Answers Questions Introduction Luis Araujo Chief Executive Officer Financials Svein Stoknes Chief Financial Officer Q&A Session
2016 Amadeus IT Group SA Results. February 26, 2016
 2015 Results February 26, 2016 Disclaimer This presentation may contain certain statements which are not purely historical facts, including statements about anticipated or expected future revenue and earnings
FY 2017 FINANCIAL RESULTS. Milan February 27 th, 2018
 FY 2017 FINANCIAL RESULTS Milan February 27 th, 2018 1 AGENDA FY 2017 Highlights o o Group overview Results by business Financial results Appendix 2 Key Achievements of 2017 General Cable Acquisition Leadership
RESULTS 9M12. MADRID, 14 NOVEMBER
 RESULTS MADRID, 14 NOVEMBER 2012 www.indra.es CONTENTS 1. Introduction - 3 2. Main Figures - 6 3. Analysis of Revenues and Commercial Activity - 7 3.1. Analysis by Segment - 8 3.2. Analysis by Vertical
H Financial Results. Milan July 28th, 2016
 H1 2016 Financial Results Milan July 28th, 2016 Agenda H1 2016 Highlights o o o Group overview Results by business Outlook Financial results Appendix H1 2016 Financial Results 2 H1 2016 Highlights Organic
H FINANCIAL RESULTS. Milan September 18 th, 2018
 H1 2018 FINANCIAL RESULTS Milan September 18 th, 2018 1 AGENDA H1 2018 Highlights o o o Group overview Results by business Outlook Financial results Appendix 2 H1 2018 Financial Highlights Organic sales
2016 Financial and Operating Performance March 16, 2017
 2016 Financial and Operating Performance March 16, 2017 2016 Highlights Solid financial and operating results driven by traffic growth Net Revenue up 1.8% YoY to 865m 2016 underlying EBITDA (net of IPO
FY 2018 Third Quarter Earnings Call
 FY 2018 Third Quarter Earnings Call July 26, 2018 Improving the experience of a world in motion Important information Adient has made statements in this document that are forward-looking and, therefore,
2017 Full Year Results Presentation 16 April 2018
 2017 Full Year Results Presentation 16 April 2018 Disclaimer This information has been prepared solely for the purpose of assisting the recipient (the Recipient ) in starting to conduct its own independent
Applus+ Group Full Year 2017 Results Presentation. 27 February 2018
 Applus+ Group Full Year 2017 Results Presentation 27 February 2018 1 Disclaimer This document may contain statements that constitute forward looking statements about Applus Services, SA ( Applus+ or the
Interim Report Q2 FY 18
 Interim Report Q2 FY 18 Quarter 2 / Fiscal Year 2018 Strong revenue growth driven by Signia Nx Sivantos delivered a strong organic growth 1) of 9.8% in Q2 2018 while nominal growth at 3.6% accounted negative
First Quarter 2017 Earnings Results
 First Quarter 2017 Earnings Results Performance Summary May 3, 2017 Legal Disclaimer The facts and figures contained in this report that do not refer to historical data are future projections and assumptions.
Company Presentation. Cable Conference. ABN AMRO - London, 10th January 2008
 Company Presentation Cable Conference ABN AMRO - London, 10th January 2008 Agenda Company Overview Financials Outlook Appendix 1 A Global Cable Manufacturer The Prysmian Group operates 54 plants, has subsidiaries
4Q 2018 Fornebu, February 8, 2019 Luis Araujo and Svein Stoknes
 4Q 2018 Fornebu, February 8, 2019 Luis Araujo and Svein Stoknes Agenda 4Q 2018 Answers Questions Introduction Luis Araujo Chief Executive Officer Financials Svein Stoknes Chief Financial Officer Q&A Session
Disclaimer. We define EBIT as EBITDA less amortizations.
 H1 2012 2 Disclaimer This document is purely informative and does not intend to be comprehensive. Financial information included in this presentation has been calculated in accordance with International
YEAR END RESULTS 31 MARCH Russell Down, Chief Executive Chris Morgan, Group Finance Director
 YEAR END RESULTS 31 MARCH 2018 Russell Down, Chief Executive Chris Morgan, Group Finance Director Customer service strategy improving performance Revenue (excluding disposals) 371.6m 6.4% FY17: 349.1m
SEMPERIT GROUP INVESTOR PRESENTATION FY 2016
 SEMPERIT GROUP INVESTOR PRESENTATION FY Thomas Fahnemann, CEO Frank Gumbinger, CFO 10 March 2017 1 Agenda Operational Development and Financial Performance Outlook Appendix 2 Investor Presentation FY I
Financial Results FY 2009 VTG AG On a safe track to a sustainable future
 Financial Results FY 2009 VTG AG On a safe track to a sustainable future Hamburg, April 20 th 2010 Speakers: Dr. Heiko Fischer, CEO Dr. Kai Kleeberg, CFO Table of content 1 Executive Summary 2 Top Priorities
Q Results. Lars Brorsen (CEO) Christoph Hobo (CFO) November 22, 2018
 Christoph Hobo (CFO) November 22, 2018") Q3 2018 Results Lars Brorsen (CEO) Christoph Hobo (CFO) November 22, 2018 Agenda 1. Highlights Q3 2018 2. Market outlook 3. Detailed results review 4. Company outlook 5. Q&A Appendix 1 Business summary
Q3 2018 Results Lars Brorsen (CEO) Christoph Hobo (CFO) November 22, 2018 Agenda 1. Highlights Q3 2018 2. Market outlook 3. Detailed results review 4. Company outlook 5. Q&A Appendix 1 Business summary
Amadeus FY 2014 Results
 Amadeus FY 2014 Results February 27, 2015 Disclaimer This presentation may contain certain statements which are not purely historical facts, including statements about anticipated or expected future revenue
Q Presentation. 8 May 2018 Asbjørn Eskild, President and CEO Stephan Révay, CFO
 Q1 2018 Presentation 8 May 2018 Asbjørn Eskild, President and CEO Stephan Révay, CFO Highlights Q1 2018 Organic growth: 2.7% Accessibility +3.3% organically Strong development for Stairlifts: +10% (North
English Version 6M16 MANAGEMENT REPORT (JANUARY JUNE)
") English Version 6M16 MANAGEMENT REPORT (JANUARY JUNE) September 28 th, 2016 Table of Contents 1. Selected consolidated data...3 2. Significant events...4 3. Consolidated income statement...5 3.1. Key operating
English Version 6M16 MANAGEMENT REPORT (JANUARY JUNE) September 28 th, 2016 Table of Contents 1. Selected consolidated data...3 2. Significant events...4 3. Consolidated income statement...5 3.1. Key operating
Financial results & business update. Quarter ended 30 September October 2017
 Financial results & business update Quarter ended 30 September 2017 18 October 2017 Disclaimer 3 Any remarks that we may make about future expectations, plans and prospects for the company constitute forward-looking
2011 Amadeus IT Group SA. Amadeus Q Results May 9, 2013
 Amadeus Q1 213 Results May 9, 213 Disclaimer This presentation may contain certain statements which are not purely historical facts, including statements about anticipated or expected future revenue and
1H15 Results Presentation. July 30, 2015
 1H15 Results Presentation July 30, 2015 1H15 Key facts Sales: Euro 426.9 million +6.7% (+4.0% constant FX) Directly Operated Stores Same Store Sales: +6.4% (2Q15 +7.9%) EBITDA: Euro 26.6 million +28.3%
RESULTS MADRID, 23 FEBRUARY
 RESULTS 2011 MADRID, 23 FEBRUARY 2012 www.indra.es CONTENTS 1. Introduction - 3 2. Main Figures - 7 3. Analysis of Revenues and Commercial Activity - 8 3.1. Analysis by Segment - 9 3.2. Analysis by Vertical
The world s leading infrastructure developer. April 2012
 The world s leading infrastructure developer Investors Presentation Company profile, strategy and key financials April 2012 Grupo ACS The world s leading infrastructure developer Engineering contractor
Interim Results 9-month figures FY 14
 HEIDELBERGER DRUCKMASCHINEN AG, FEBRUARY 5, 214 Interim Results 9-month figures 14 Gerold Linzbach, CEO Dirk Kaliebe, CFO Robin Karpp, Head of IR Interim Results 9-month figures 14 February 5th, 214 Improved
First Half 2016 Performance Summary
 First Half 2016 Performance Summary Operational and Financial Highlights - 1H 2016 Strong positive growth for the four main plasma proteins, that jointly with the others, take the revenues of the Bioscience
3Q 2018 Fornebu, October 24, 2018 Luis Araujo and Svein Stoknes
 3Q 2018 Fornebu, October 24, 2018 Luis Araujo and Svein Stoknes Agenda 3Q 2018 Answers Questions Introduction Luis Araujo Chief Executive Officer Financials Svein Stoknes Chief Financial Officer Q&A Session
t e c h n i c o l o r. c o m
 2017 t e c h n i c o l o r. c o m Forward looking statements THIS PRESENTATION contains certain statements that constitute "forward-looking statements", including but not limited to statements that are
H RESULTS PRESENTATION
 H1 2018 RESULTS PRESENTATION 03.09.2018 H1 2018 RESULTS PRESENTATION DISCLAIMER This presentation (the "Presentation") has been prepared and is issued by, and is the sole responsibility of Telepizza Group,
Q FINANCIAL RESULTS. Milan May 10 th, 2018
 Q1 2018 FINANCIAL RESULTS Milan May 10 th, 2018 1 AGENDA Q1 2018 Highlights o o o Group overview Results by business Outlook Financial results Appendix 2 Q1 2018 Financial Highlights Organic growth recovery
Applus+ Group Results Presentation Third Quarter November 2015
 Applus+ Group Results Presentation Third Quarter 2015 2 November 2015 DISCLAIMER This document may contain statements that constitute forward looking statements about Applus Services, SA ( Applus+ or the
RESULTS 9M17 MADRID, NOVEMBER 7 TH
 RESULTS 9M17 MADRID, NOVEMBER 7 TH 2017 www.indracompany.com CONTENTS 1. Introduction & Key Figures 3 2. Analysis of the Consolidated Financial Statements (IFRS) 5 3. Analysis by Vertical Markets 8 4.
BAML Conference - Miami
 BAML Conference - Miami Francois Luscan, President & CEO Xavier Leclerc de Hauteclocque, CFO December 3, 2013 Forward Looking Statement This presentation may include forward-looking statements. Forward-looking
Amadeus Jan - June 2015 Results
 Amadeus Jan - June 2015 Results July 31, 2015 Disclaimer This presentation may contain certain statements which are not purely historical facts, including statements about anticipated or expected future
FY 2018 FIRST QUARTER EARNINGS. Adient s Q1 results impacted by headwinds in Seat Structures & Mechanisms (SS&M) business $4,204M $102M
 business $4,204M $102M") FY 2018 FIRST QUARTER EARNINGS Adient s Q1 results impacted by headwinds in Seat Structures & Mechanisms (SS&M) business > > Q1 GAAP net income and EPS diluted of $(216)M and $(2.32), respectively; Q1
FY 2018 FIRST QUARTER EARNINGS Adient s Q1 results impacted by headwinds in Seat Structures & Mechanisms (SS&M) business > > Q1 GAAP net income and EPS diluted of $(216)M and $(2.32), respectively; Q1
HMS Group 3 months 2018 IFRS Results Webcast presentation. 8 June 2018
 HMS Group 3 months 2018 IFRS Results Webcast presentation 8 June 2018 Financial results Business & Outlook 2 FINANCIAL HIGHLIGHTS HIGHLIGHTS Rub bn 2018 3m 2017 3m chg, yoy Revenue 8,726 9,760-11% EBITDA
COMISIÓN NACIONAL DEL MERCADO DE VALORES Paseo de la Castellana, Madrid. Madrid, 13 de mayo de Muy Sres. nuestros:
 COMISIÓN NACIONAL DEL MERCADO DE VALORES Paseo de la Castellana, 19 28046 Madrid Madrid, 13 de mayo de 2013 Muy Sres. nuestros: ACCIONA adjunta presentación en ingles que se seguirá en la multiconferencia
Strong performance, delivering a record free cash flow Full Year Results 2012
 Strong performance, delivering a record free cash flow Full Year Results 2012 Vernier, 5 th February 2013 Gilles Andrier CEO Full Year Results 2012 Financial Highlights Sales CHF 4.3 billion, up 6.6% in
RESULTS 1Q18 MADRID, MAY 14 TH
 RESULTS 1Q18 MADRID, MAY 14 TH 2018 www.indracompany.com CONTENTS 1. Introduction & Key Figures 3 2. Analysis of the Consolidated Financial Statements (IFRS) 5 3. Analysis by Vertical Markets 8 4. Analysis
1Q Performance Summary
 1Q 2015 - Performance Summary Operational and Financial Highlights - 1Q 2015 Net profit up by +6.2% to Euros 128.5 million Income grows by +13.8% (+1.1% cc*) to Euros 908.4 million, driven by sales of
VOLVO CAR GROUP results presentation January March 2018
 VOLVO CAR GROUP results presentation January March 2018 Patrik Tolf, Deputy CFO & head of Group Finance Nils Mösko, vice president & Head of investor relations DISCLAIMER By accepting this document, the
AIRBUS GROUP 2016 CAPITAL MARKETS UPDATE
 AIRBUS GROUP 2016 CAPITAL MARKETS UPDATE LONDON, 24 FEBRUARY 2016 HARALD WILHELM Chief Financial Officer SAFE HARBOUR STATEMENT 2 DISCLAIMER This presentation includes forward-looking statements. Words
Amadeus Jan - Sep 2014 Results
 Amadeus Jan - Sep 2014 Results November 6, 2014 Disclaimer This presentation may contain certain statements which are not purely historical facts, including statements about anticipated or expected future
FINANCIAL ANALYSTS MEETING
 RECTICEL - FY2011 Results FINANCIAL ANALYSTS MEETING Speakers: Olivier Chapelle, CEO Jean-Pierre Mellen, CFO Brussels, 02 March 2012-1 - Agenda 1. Highlights 2. FY2011 consolidated results 3. FY2011 comments
Agenda. 1. Highlights FY 2012 Results. 2. Operational Performance Priorities for Financials. 5. Conclusion
 1MARCH 2013 Legal Disclaimer Information in this presentation may involve guidance, expectations, beliefs, plans, intentions or strategies regarding the future. These forward-looking statements involve
1,633m 2013 Revenues 2013 ANNUAL RESULTS. 13 March ,427 Employees in % of Revenues for International in 2013
 1,633m 2013 Revenues 2013 ANNUAL RESULTS 13 March 2014 55% of Revenues for International in 2013 20,427 Employees in 2013 Disclaimer This presentation contains forward-looking statements (as defined in
3. ANALYSIS BY SEGMENT
 3. ANALYSIS BY SEGMENT SOLUTIONS & Book-to-bill & 1,894 +9% 2,070 1.22x +5% 1.29x 1,811 +4% 1,881 1.05x +5% 1.10x have grown 4% versus the previous year, showing a strong growth in Transport & Traffic,
Quarterly EBITDA grew 23% to 111 million, with the positive impact of pulp and paper prices and sale of pellets business
 0 11 Highlights 1 st Quarter 2018 (vs. 1 st Quarter 2017) Quarterly EBITDA grew 23% to 111 million, with the positive impact of pulp and paper prices and sale of pellets business Navigator concluded the
INTERIM RESULTS PRESENTATION SIX MONTHS TO 30 JUNE 2018
 INTERIM RESULTS PRESENTATION SIX MONTHS TO 30 JUNE 2018 DISCLAIMER The information contained in this presentation has not been independently verified and this presentation contains various forward-looking
O&M in the Last Mile Ezentis manages, maintains and deploys infrastructure for telecommunications and utilities companies.
 1 O&M in the Last Mile Ezentis manages, maintains and deploys infrastructure for telecommunications and utilities companies. Focus on Latin America where Ezentis activity represents 91,3% of total Group
BEFESA BEFESA. Fiscal Year 2016 Earnings Presentation
 BEFESA Fiscal Year 2016 Earnings Presentation 6 th April 2017 Introduction Business Highlights Steel Dust Recycling Services Aluminium Salt Slags Services Financials Business Outlook Q&A Appendix Wolf
FY 2016 Financial Results. Milan March 1st 2017
 FY 2016 Financial Results Milan March 1st 2017 Agenda FY 2016 Highlights o o Group overview Results by business Financial results Appendix FY 2016 Financial Results 2 FY 2016 Highlights Adj. EBITDA at
Presentation to Investors. December 2013
 Presentation to Investors December 2013 Who we are Engineering contractor and greenfield developer Revenues 2012 > 38 bn Current Backlog 67 bn Civil Engineering Industrial Engineering Construction Environment
Fourth Quarter 2016 Performance Summary
 Fourth Quarter 2016 Performance Summary Operational and Financial Highlights - 2016 Net profit rises by +2.5% to Euros 545.5 million Recurring sales (excluding Raw Materials and Others) rise by +4.5% (+4.6%
Melexis Q results Third quarter sales growth of 15%
 Press release - Melexis Q3 2018 results Third quarter sales growth of 15% Intermediate declaration by the Board of Directors Ieper, Belgium October 24 th, 2018, 07.00 hrs CET CONFORM IFRS Q3 2018 Q3 2017
Third Quarter 2016 Performance Summary
 Third Quarter 2016 Performance Summary Operational and Financial Highlights - 9M 2016 Sales of the Bioscience Division grow by +6.5%, increasing Grifols revenues to EUR 2,951.7 million over EUR 1,000 million
INDRA S NET PROFIT INCREASED BY +82% IN 2017, TO REACH 127 MILLION EUROS
 EPS also up +73% vs 2016 INDRA S NET PROFIT INCREASED BY +82% IN 2017, TO REACH 127 MILLION EUROS In reported terms, including Tecnocom, Order Intake increased by +18%, revenues by +11% and EBIT by +21%
SEMPERIT GROUP Q / Q INVESTOR PRESENTATION. Dr Martin Füllenbach, CEO Frank Gumbinger, CFO 21 November 2018
 SEMPERIT GROUP Q1-3 / Q3 INVESTOR PRESENTATION Dr Martin Füllenbach, CEO Frank Gumbinger, CFO 21 November 1 Agenda Restructuring and Transformation update (p.3) Operational Highlights (p.9) Financial performance
Results Presentation 3Q November 14 th 2017
 Results Presentation 3Q 2017 November 14 th 2017 Executive Summary SUSTAINED TOP LINE GROWTH with improved operating efficiency +26% (AUD) top line growth in CIMIC Stable global operating margins Strong
FY 2017 SECOND QUARTER EARNINGS. Adient delivers strong Q2 results; increases full year earnings expectations $286M $192M $2.04 $4,212M $235M 7.
 FY 2017 SECOND QUARTER EARNINGS Adient delivers strong Q2 results; increases full year earnings expectations > > GAAP net income and EPS diluted increased to $192M and $2.04, respectively; adjusted-eps
AIRBUS 9m Results 2018
 AIRBUS 9m Results 2018 31 October 2018 Harald Wilhelm Chief Financial Officer SAFE HARBOUR STATEMENT 2 DISCLAIMER This presentation includes forward-looking statements. Words such as anticipates, believes,
SEMPERIT GROUP FY 2017 / Q INVESTOR PRESENTATION. Dr Martin Füllenbach, CEO Frank Gumbinger, CFO 16 March 2018
 SEMPERIT GROUP FY / Q4 INVESTOR PRESENTATION Dr Martin Füllenbach, CEO Frank Gumbinger, CFO 16 March 2018 Transformation process initiated Challenges and Timeline Sempermed Group ( Group (2) Cost efficiency
Conference Call Half Year Closing Zurich, 22 August 2013
 Conference Call Half Year Closing 2013 Zurich, 22 August 2013 Disclaimer This communication contains statements that constitute forward-looking statements. In this communication, such forward-looking statements
Q Earnings Presentation. Rainer Beaujean, Speaker of the Management Board and CFO April 12, 2018
 Q1 2018 Earnings Presentation Rainer Beaujean, Speaker of the Management Board and CFO April 12, 2018 Disclaimer This presentation may contain certain forward-looking statements, including assumptions,
Q SALES AND RESULTS
 Q1 2018 SALES AND RESULTS 9 th May 2018 1 Q1 2018 Main Financial Aspects Solid revenue growth of +4.9% (+6.8% at constant exchange rates) reaching 345m (+ 16m) in the first quarter of the year. In the
INTERIM REPORT JANUARY MARCH President and CEO Håkan Buskhe 25 April, 2013
 INTERIM REPORT JANUARY MARCH 2013 President and CEO Håkan Buskhe 25 April, 2013 JANUARY - MARCH IN BRIEF 2013 2013 Sweden International 2013 %-Change 2012 bookings 18,865 372 4,000 backlog 47,059 32 35,657
AIRBUS H1 Results 2018
 AIRBUS H1 Results 2018 26 July 2018 Tom Enders Chief Executive Officer Harald Wilhelm Chief Financial Officer SAFE HARBOUR STATEMENT 2 DISCLAIMER This presentation includes forward-looking statements.
RESULTS 2016 MADRID, FEBRUARY 23 RD
 RESULTS 2016 MADRID, FEBRUARY 23 RD 2017 www.indracompany.com CONTENTS 1. Introduction & Key Figures 3 2. Analysis of the Consolidated Financial Statements (IFRS) 5 3. Analysis by Vertical Markets 8 4.
9M 2018 FINANCIAL RESULTS. November 7, 2018
 9M 2018 FINANCIAL RESULTS November 7, 2018 DISCLAIMER This document has been prepared by Maire Tecnimont S.p.A. (the Company ) solely for use in the presentation of its financial results. This document