For personal use only
|
|
|
- Donna Daniels
- 5 years ago
- Views:
Transcription
1 23 August 2013 Full Year Results June 2013 We attach an Investor Presentation for the FY13 Full Year Results. As previously announced, a results briefing for analysts will be held at 10:30am Sydney time today at: The Swissôtel Level 24 Lounge 68 Market Street Sydney NSW Details for investors who wish to dial-in to the briefing are: Australia toll free: International toll free: Hong Kong Japan New Zealand Singapore United Kingdom United States For those countries not listed above, the Australian toll number is: Conference ID Number is All telephone participants will be asked for their full name and Conference ID when joining the call. For further information, please contact: Paul White Paul Lewis Corporate Affairs Chief Financial Officer

2 Qube Holdings Limited Investor Presentation FY 13 Full Year Results
3 Disclaimer Important Notice ABN The information contained in this Presentation or subsequently provided to the recipient whether orally or in writing by, or on behalf of Qube Holdings Limited (Qube) or any of its directors, officers, employees, agents, representatives and advisers (the Parties) is provided to the recipient on the terms and conditions set out in this notice. The information contained in this Presentation has been furnished by the Parties and other sources deemed reliable but no assurance can be given by the Parties as to the accuracy or completeness of this information. To the full extent permitted by law: (a) no representation or warranty (express or implied) is given; and (b) no responsibility or liability (including in negligence) is accepted, by the Parties as to the truth, accuracy or completeness of any statement, opinion, forecast, information or other matter (whether express or implied) contained in this Presentation or as to any other matter concerning them. To the full extent permitted by law, no responsibility or liability (including in negligence) is accepted by the Parties: (a) for or in connection with any act or omission, directly or indirectly in reliance upon; and (b) for any cost, expense, loss or other liability, directly or indirectly, arising from, or in connection with, any omission from or defects in, or any failure to correct any information, in this Presentation or any other communication (oral or written) about or concerning them. The delivery of this Presentation does not under any circumstances imply that the affairs or prospects of Qube or any information have been fully or correctly stated in this Presentation or have not changed since the date at which the information is expressed to be applicable. Except as required by law and the ASX listing rules, no responsibility or liability (including in negligence) is assumed by the Parties for updating any such information or to inform the recipient of any new information of which the Parties may become aware. Notwithstanding the above, no condition, warranty or right is excluded if its exclusion would contravene the Trade Practices Act 1974 or any other applicable law or cause an exclusion to be void. The provision of this Presentation is not and should not be considered as a recommendation in relation to an investment in Qube or that an investment in Qube is a suitable investment for the recipient. References to underlying and pro-forma information are to non-ifrs financial information prepared in accordance with ASIC Regulatory Guide 230 (Disclosing non-ifrs financial information) issued in December Non-IFRS financial information has not been subject to audit or review.
4 Key Messages Qube is a stronger business with improved quality of earnings, strong cashflow generation and substantial future growth potential from strategic assets. Statutory Qube NPAT of $77.3 million and earnings per share of 8.4 cents. Record underlying Qube NPAT of $74.0 million ($78.3 million pre-amortisation), a 20% increase on FY 12 pro-forma Qube NPAT. Underlying EBITA up 58% to $128.8 million on FY 12 pro-forma EBITA. Underlying earnings per share up 13% to 8.0 cents (8.5 cents pre-amortisation). Record earnings and improved margins from all divisions. Result benefitted from prior year investment, organic growth and focus on efficiencies. Continued improvement in safety performance. Final dividend of 2.3 cents (fully franked), with the full year dividend increasing by 10% over FY 12. Earnings growth expected to continue in FY 14 despite challenging economic environment. The underlying and pro-forma information excludes non-cash and non-recurring items in order to more accurately reflect the underlying financial performance of Qube. References to underlying and pro-forma information are to non-ifrs financial information prepared in accordance with ASIC Regulatory Guide 230 (Disclosing non-ifrs financial information) issued in December Non-IFRS financial information has not been subject to audit or review. 3
5 Key Financial Outcomes Statutory Results Year ended 30 June 2013 ($m) 2012 ($m) Change From Prior Year (%) Revenue 1, % EBITDA % EBITA >1000% EBIT (0.6) N/A Net Interest Expense (32.7) (14.4) 127% Share of Profit of Associates % Profit After Tax 81.0 (1.5) >1000% Non-Controlling Interest (3.7) (1.1) 236% Profit After Tax Attributable to Shareholders 77.3 (2.5) N/A Earnings Per Share (cents) 8.4 (0.3) N/A Full Year Dividend Per Share (cents) % EBITDA Margin 17.2% N/A N/A EBITA Margin 12.3% N/A N/A Note: The prior period's statutory results were impacted by the Qube Restructure and therefore are not comparable to the current period's results. Consistent with its disclosure at 30 June 2013, the Company has changed the classification of some of its income and major expense items to better reflect the operations of the Group. The comparative prior period information has been reclassified accordingly and there is no change to the net result. 4
6 Key Financial Outcomes Underlying Results Year ended 30 June 2013 ($m) 2012 ($m) Change From Prior Year (%) Underlying Pro-forma Revenue 1, % EBITDA % EBITA % EBIT % Net Interest Expense (33.7) (13.1) 157% Share of Profit of Associates % Profit After Tax % Non-Controlling Interest (3.7) (0.3) N/A Profit After Tax Attributable to Shareholders % Profit After Tax Attributable to Shareholders Pre-Amortisation % Earnings Per Share (cents) % Earnings Per Share Pre-Amortisation (cents) % Full Year Dividend Per Share (cents) % EBITDA Margin 17.1% 13.5% 3.6% EBITA Margin 12.1% 9.7% 2.4% The underlying and pro-forma information excludes non-cash and non-recurring items in order to more accurately reflect the underlying financial performance of Qube. References to underlying and pro-forma information are to non-ifrs financial information prepared in accordance with ASIC Regulatory Guide 230 (Disclosing non-ifrs financial information) issued in December Non-IFRS financial information has not been subject to audit or review. 5
7 Key Financial Outcomes $m Underlying Revenue 1,100 1, % 1, FY 12 Pro-forma Revenue Growth in Logistics division Growth in Ports & Bulk division Growth in Strategic Assets division FY 13 Underlying Revenue The underlying and pro-forma information excludes non-cash and non-recurring items in order to more accurately reflect the underlying financial performance of Qube. References to underlying and pro-forma information are to non-ifrs financial information prepared in accordance with ASIC Regulatory Guide 230 (Disclosing non-ifrs financial information) issued in December Non-IFRS financial information has not been subject to audit or review. 6
8 Key Financial Outcomes $m Underlying EBITDA (0.9) % FY 12 Pro-forma EBITDA Growth in Logistics division Growth in Ports & Bulk division Growth in Strategic Assets division Growth in Corporate and Other FY 13 Underlying EBITDA The underlying and pro-forma information excludes non-cash and non-recurring items in order to more accurately reflect the underlying financial performance of Qube. References to underlying and pro-forma information are to non-ifrs financial information prepared in accordance with ASIC Regulatory Guide 230 (Disclosing non-ifrs financial information) issued in December Non-IFRS financial information has not been subject to audit or review. 7

9 Key Financial Outcomes $m Underlying EBITA (1.0) % FY 12 Pro-forma EBITA Growth in Logistics division Growth in Ports & Bulk division Growth in Strategic Assets division Growth in Corporate and Other FY 13 Underlying EBITA The underlying and pro-forma information excludes non-cash and non-recurring items in order to more accurately reflect the underlying financial performance of Qube. References to underlying and pro-forma information are to non-ifrs financial information prepared in accordance with ASIC Regulatory Guide 230 (Disclosing non-ifrs financial information) issued in December Non-IFRS financial information has not been subject to audit or review. 8
10 Key Financial Outcomes Year ended 30 June 2013 Logistics ($m) Ports & Bulk ($m) Strategic Assets ($m) Corporate and Other ($m) Total ($m) Year ended 30 June 12 ($m) Change (%) Statutory Revenue (0.0) 1, % EBITDA (8.6) % EBITA (8.6) >1000% Underlying Pro-forma Revenue , % EBITDA (8.4) % EBITA (8.4) % The underlying and pro-forma information excludes non-cash and non-recurring items in order to more accurately reflect the underlying financial performance of Qube. References to underlying and pro-forma information are to non-ifrs financial information prepared in accordance with ASIC Regulatory Guide 230 (Disclosing non-ifrs financial information) issued in December Non-IFRS financial information has not been subject to audit or review. 9
11 Enhanced Focus on Safety LTI LTIFR Qube Group > 60% improvement in LTIFR from FY 10 to FY LTIFR Lost Time Injury Frequency Rate LTI Lost Time Injury 10

12 Logistics Division 11
13 Logistics Division Year ended 30 June 2013 ($m) 2012 ($m) Change From Prior Year (%) Underlying Pro-forma Revenue % EBITDA % Depreciation (23.1) (17.9) 29% EBITA % Amortisation (1.7) (1.7) 0% EBIT % Share of Profit of Associates % EBITDA Margin (%) 13.6% 12.4% 1.2% EBITA Margin (%) 9.3% 8.7% 0.6% The underlying and pro-forma information excludes non-cash and non-recurring items in order to more accurately reflect the underlying financial performance of Qube. References to underlying and pro-forma information are to non-ifrs financial information prepared in accordance with ASIC Regulatory Guide 230 (Disclosing non-ifrs financial information) issued in December Non-IFRS financial information has not been subject to audit or review. 12
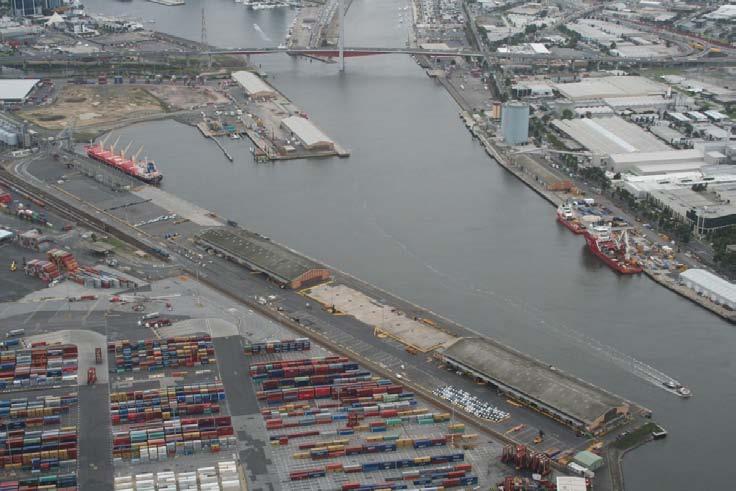
14 Logistics Division Strong result despite difficult economic environment. Further diversification into logistics solutions for rural exports. Continued growth in rail business. Results impacted by loss of a major contract in South Australia and reduced work trains activity due to mining slowdown. Focus continues to be on targeted opportunities to deliver value-added solutions. Scope for further margin improvement from operating efficiencies, cost initiatives and increased scale. Initial stage of Vic Dock development completed. Expanding scope of development to facilitate additional growth. Continued investment on equipment and facilities to deliver quality customer solutions. 13
15 Logistics Division $m H1-FY 12 H2-FY 12 H1-FY 13 H2-FY 13 Pro-Forma / Underlying Revenue Pro-Forma / Underlying EBITDA Margin (%) 16% 14% 12% 10% 8% 6% 4% 2% 0% The Logistics business continues to experience seasonality consistent with past trends. The six months to December (H1) is a relatively stronger period for the business than the six months to June (H2). Revenue and earnings growth was achieved in both H1 and H2 (compared to the corresponding periods in FY 12). There was continued margin improvement in the Logistics division on the prior year. The underlying and pro-forma information excludes non-cash and non-recurring items in order to more accurately reflect the underlying financial performance of Qube. References to underlying and pro-forma information are to non-ifrs financial information prepared in accordance with ASIC Regulatory Guide 230 (Disclosing non-ifrs financial information) issued in December Non-IFRS financial information has not been subject to audit or review. 14
16 Logistics Division $m $m FY 11-FY 13 CAGR* Revenue +23% EBITDA +34% *Compound Annual Growth Rate based on pro-forma / underlying revenue and EBITDA. 0 FY 11 FY 12 FY 13 0 Pro-Forma / Underlying Revenue Pro-Forma / Underlying EBITDA The underlying and pro-forma information excludes non-cash and non-recurring items in order to more accurately reflect the underlying financial performance of Qube. References to underlying and pro-forma information are to non-ifrs financial information prepared in accordance with ASIC Regulatory Guide 230 (Disclosing non-ifrs financial information) issued in December Non-IFRS financial information has not been subject to audit or review. 15
17 Logistics Division FY 13 Indicative Revenue Segmentation By State (%) By Activity (%) 10.0% 1.5% 13.7% 1.6% Transport 8.2% 25.6% 37.3% NSW VIC QLD SA WA Global Forwarding 18.5% 44.3% Rail Freight Handling / Warehouse Container Handling Freight Forwarding 17.4% 21.9% The business is well diversified by geography and service. 16


18 Ports & Bulk Division 17
19 Ports & Bulk Division Year ended 30 June 2013 ($m) 2012 ($m) Change From Prior Year (%) Underlying Pro-forma Revenue % EBITDA % Depreciation (29.7) (13.5) 120% EBITA % Amortisation (4.0) (4.0) 0% EBIT % Share of Profit of Associates % EBITDA Margin (%) 19.1% 15.8% 3.3% EBITA Margin (%) 13.2% 12.0% 1.2% The underlying and pro-forma information excludes non-cash and non-recurring items in order to more accurately reflect the underlying financial performance of Qube. References to underlying and pro-forma information are to non-ifrs financial information prepared in accordance with ASIC Regulatory Guide 230 (Disclosing non-ifrs financial information) issued in December Non-IFRS financial information has not been subject to audit or review. 18
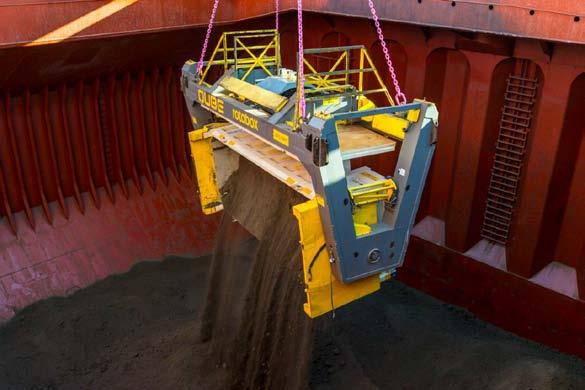
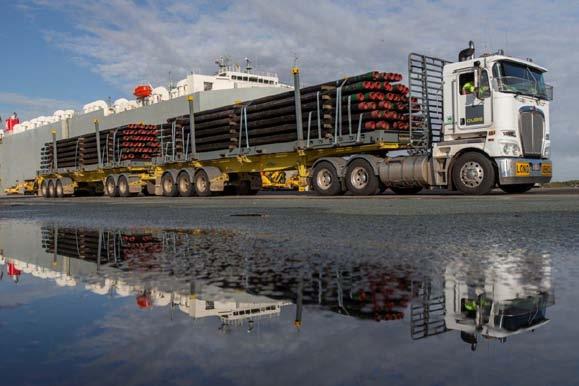
20 Ports & Bulk Division Record results with substantial growth in revenue and earnings. Increasing diversification by geography, product and customer. Strong interest in Qube s mine-to-ship solutions. Ramp up of several new bulk contracts in the period. Utah Point continued to increase volumes. Giacci performing in line with expectations. Benefitted from strong volumes of imported motor vehicles. 19
21 Ports & Bulk Division $m H1-FY 12 H2-FY 12 H1-FY 13 H2-FY 13 Pro-Forma / Underlying Revenue Pro-Forma / Underlying EBITDA Margin (%) 25% 20% 15% 10% 5% 0% The Ports & Bulk division is not as seasonal as the Logistics division. Revenue and earnings growth was achieved in both H1 and H2 (compared to the corresponding periods in FY 12). There was also continued margin improvement in the Ports & Bulk division on the prior year. The underlying and pro-forma information excludes non-cash and non-recurring items in order to more accurately reflect the underlying financial performance of Qube. References to underlying and pro-forma information are to non-ifrs financial information prepared in accordance with ASIC Regulatory Guide 230 (Disclosing non-ifrs financial information) issued in December Non-IFRS financial information has not been subject to audit or review. 20
22 Ports & Bulk Division $m $m FY 11-FY 13 CAGR* Revenue +38% EBITDA +64% *Compound Annual Growth Rate based on pro-forma / underlying revenue and EBITDA. 0 FY 11 FY 12 FY 13 0 Pro-Forma / Underlying Revenue Pro-Forma / Underlying EBITDA The underlying and pro-forma information excludes non-cash and non-recurring items in order to more accurately reflect the underlying financial performance of Qube. References to underlying and pro-forma information are to non-ifrs financial information prepared in accordance with ASIC Regulatory Guide 230 (Disclosing non-ifrs financial information) issued in December Non-IFRS financial information has not been subject to audit or review. 21
23 Ports & Bulk Division FY 13 Indicative Revenue Segmentation By State (%) By Product (%) 43.0% 10.0% 12.0% 11.5% 11.0% 12.5% NSW VIC QLD SA WA Other 3% 7% 11% 9% 3% 3% 2% 2% 2% 5% 4% 4% 20% 11% 14% Iron Ore Concentrates Mineral Sands Coal Bulk Other Bulk Scrap Containers Forest Products General Cargo Metal Products MV's/Mach'y/Boats/WHSS Oil & Gas Facility Operations Ancillary Services Sundry Income The business is well diversified by geography and product. 22


24 Ports & Bulk Division 23
25 Ports & Bulk Division Associates Year ended 30 June 2013 ($m) 2012 ($m) Change From Prior Year (%) Qube share of associates' NPAT Underlying Pro-forma AAT % NSS % Prixcar % Total % The underlying and pro-forma information excludes non-cash and non-recurring items in order to more accurately reflect the underlying financial performance of Qube. References to underlying and pro-forma information are to non-ifrs financial information prepared in accordance with ASIC Regulatory Guide 230 (Disclosing non-ifrs financial information) issued in December Non-IFRS financial information has not been subject to audit or review. 24
26 Ports & Bulk Division Associates The associates contributed significantly to Qube s results. AAT benefitted from continued strength in motor vehicle sales and imports. NSS secured project work and other new business to offset termination of major contract (QNI). Prixcar was impacted by integration costs relating to the acquisition of Toll s vehicle distribution business in July 12 as well as the decline in sales of domestically manufactured vehicles. Statutory result includes an impairment of $10.5 million in the value of Qube s investment in NSS due to the reduced medium-long term earnings outlook from the termination of the QNI contract. Expect lower overall contribution from associates in FY
27 Strategic Assets Division Year ended 30 June 2013 ($m) 2012 ($m) Change From Prior Year (%) Underlying Pro-forma Revenue % EBITDA % Depreciation % EBITA % Amortisation (0.4) (0.4) 0% EBIT % Share of Profit of Associates N/A NCI Share of Qube's NPAT (3.7) (0.3) >1000% EBITDA Margin (%) 76.4% 77.3% -0.9% EBITA Margin (%) 76.4% 77.3% -0.9% The financial results for FY 13 are not directly comparable to the pro-forma results for FY 12 in relation to the Moorebank investment: In FY 13, Qube consolidated 100% of the Moorebank investment and recognised a non-controlling interest (NCI) for the 33.3% it does not own. In FY 12 Pro-forma, Qube equity accounted its 30% interest until 8 June 12 from which time Moorebank was consolidated (as noted above). The underlying and pro-forma information excludes non-cash and non-recurring items in order to more accurately reflect the underlying financial performance of Qube. References to underlying and pro-forma information are to non-ifrs financial information prepared in accordance with ASIC Regulatory Guide 230 (Disclosing non-ifrs financial information) issued in December Non-IFRS financial information has not been subject to audit or review. 26
28 Strategic Assets Division Both strategic properties continue to generate strong reliable commercial yields. Moorebank lease extended to March 18. Minto lease to be extended to August 16. Discussions continuing with relevant stakeholders for development of whole of Moorebank precinct. NSW and Commonwealth planning process nearing completion for SIMTA (Moorebank) site. Statutory result includes $9.1 million profit from upwards fair value revaluation of Minto. 27
29 Cashflow and Financing Strong cashflow generated in the period with high cash conversion. Net debt increased by around $140 million due to acquisitions and significant growth capex. Refinancing of Strategic Assets debt with new $120 million facility completed in June 13. Leverage at bottom end of Qube s target range of 30-40%. Post year end, completed extension and repricing of $550 million syndicated debt facility. No material near term debt maturities. Substantial undrawn debt capacity and strong cashflow to fund growth. Qube will maintain a disciplined approach to acquisitions and other growth capex. 28
30 Cashflow and Financing Year ended 30 June 2013 $m Underlying EBITDA Net operating working capital (2.9) Operating cashflow pre tax and interest Cash tax paid (11.1) Cash dividends received 10.4 Cash net interest paid (33.1) Operating cashflow Net spend on property, plant and equipment (176.3) Net spend on business acquisitions & investments (72.6) Free cashflow after capex (104.1) Net proceeds from financing 77.6 Proceeds from issue of units to non-controlling interests 1.8 Dividends paid (net of DRP) (30.4) Distributions paid to non-controlling interests (5.5) Other (0.3) Change in cash (60.8) Opening cash Closing cash 57.7 Cash conversion 98% 29
31 Cashflow and Financing $m Change in Net Debt (178.7) (10.4) Net Debt at Jun 2012 Operating Cashflow Dividends Received Capex Net Interest Paid Tax Paid Dividends Paid* Other Net Debt at Jun 2013 *Dividends Paid Net of DRP 30
32 Financing Facility Type Maturity of Facility Balance at 30 June 13 ($m)* Balance at 30 June 12 ($m)* Term Loan - Strategic Properties Jun Term Loan Aug Revolver and Multi-Option Aug Finance Leases Various Gross Debt Less: Cash (57.7) (118.6) Net Debt Qube has cash and undrawn debt facilities of around $260 million to fund growth. Qube recently completed an amendment to its $550 million debt facility extending the overall tenor of its facilities and improving the pricing. Qube Shareholders Equity 1, ,013.3 Net Debt / (Net Debt + Equity) 30.4% 24.3% *Excludes bank guarantees and letters of credit issued under Qube's facilities 31
33 Capex $m Disciplined approach to new investment Lower H2 capex as focus was on integrating previous acquisitions. H1 capex includes MIST/ITG business and property acquisitions ($95 million) and Prixcar investment ($20 million). 50 Continued capex undertaken in H2 for Vic Dock development and Ports & Bulk contracts. 0 H1-FY 13 Capex by Division H1-FY 13 Capex by Type H2-FY 13 Capex by Division H2-FY 13 Capex by Type Substantial pipeline of potential new projects / contracts / acquisitions. Logistics Ports & Bulk Strategic Growth Maintenance New growth capex to be underpinned by contracts and/or be very strategic. 32
34 FY 13 Summary Record financial results in both divisions. Substantial interest in Qube s integrated logistics solutions. Qube now firmly established as a leading provider of integrated logistics solutions for import and export freight. Strength in management experience and market knowledge. Successfully building a portfolio of strategic assets. Diversifying by geography, customer, service and product. Differentiated by innovative customer focused logistics solutions. National footprint. Continued improvement in safety, health and environmental performance. Conservative balance sheet with capacity to fund growth. 33
35 Outlook Increased contribution from new contracts / capex during FY 14. Improved asset utilisation and cost efficiencies to grow margins. Continued focus on opportunities at Webb Dock (in Melbourne) and Moorebank (in Sydney). In FY 14, Qube expects: strength in bulk export volumes to continue solid levels of new vehicle sales although lower growth rate than FY 13 (subject to legislative risks) overall container volumes through the ports to grow at below historical rates limited improvement in general and project cargo volumes Notwithstanding the difficult economic conditions, Qube anticipates continuing its record of delivering revenue growth and increased earnings per share in FY 14. Challenging conditions create opportunities for Qube to differentiate its services, provide value-added solutions and undertake quality acquisitions. Well positioned for sustainable long term growth. 34

36 Questions 35
37 Appendix 1 Reconciliation of 30 June 2013 Statutory Results to Underlying Results Year ended 30 June 2013 Logistics ($m) Ports & Bulk ($m) Strategic Assets ($m) Corporate and Other ($m) Consolidated ($m) Net profit / (loss) before tax (34.3) Add / (Subtract): Net interest expense Depreciation and amortisation Share of profit of associates (0.4) (15.1) (15.5) EBITDA (8.6) Fair value adjustments (net) (9.1) 0.2 (8.9) Impairment losses on investment in associates Costs of legacy incentive schemes Release of contingent consideration payable 0.0 (8.0) (8.0) Underlying EBITDA (8.4) Depreciation (23.1) (29.7) (52.8) Underlying EBITA (8.4) The underlying and pro-forma information excludes non-cash and non-recurring items in order to more accurately reflect the underlying financial performance of Qube. References to underlying and pro-forma information are to non-ifrs financial information prepared in accordance with ASIC Regulatory Guide 230 (Disclosing non- IFRS financial information) issued in December Non-IFRS financial information has not been subject to audit or review. 36
38 Appendix 2 Reconciliation of 30 June 2012 Statutory Results to Pro-forma Results Year ended 30 June 2012 Logistics ($m) Ports & Bulk ($m) Strategic Assets ($m) Corporate and Other ($m) Consolidated ($m) Net profit / (loss) before tax (5.2) (55.3) (1.8) Add / (Subtract): Net interest expense (4.5) 14.4 Depreciation and amortisation Share of profit of associates (0.3) (12.5) (0.4) 0.0 (13.2) EBITDA (59.8) 35.6 Fair value adjustments (net) Non-recurring Qube Restructure items (excluding stamp duty) Stamp Duty Refinancing costs Costs of legacy incentive schemes Adjusted EBITDA (7.3) Pro-forma EBITDA for 2 months to 31 August (0.2) 7.6 Pro-forma EBITDA (7.5) Depreciation (17.9) (13.5) (31.4) Pro-forma EBITA (7.5) 81.3 The underlying and pro-forma information excludes non-cash and non-recurring items in order to more accurately reflect the underlying financial performance of Qube. References to underlying and pro-forma information are to non-ifrs financial information prepared in accordance with ASIC Regulatory Guide 230 (Disclosing non- IFRS financial information) issued in December Non-IFRS financial information has not been subject to audit or review. 37
39 Appendix 3 Explanation of Underlying Information Underlying Revenue is revenue from external customers adjusted to exclude non-cash items such as fair value adjustments on investment properties and other non-recurring items such as release of contingent consideration payable. EBITDA is statutory net profit before tax adjusted to remove share of profit of associates, net finance costs, depreciation and amortisation. Underlying EBITDA is EBITDA adjusted to remove non-cash items such as fair value adjustments on investment properties and other non-recurring items such as impairments and release of contingent consideration payable. Underlying EBITA is Underlying EBITDA adjusted to remove depreciation. References to underlying and pro-forma information are to non-ifrs financial information prepared in accordance with ASIC Regulatory Guide 230 (Disclosing non-ifrs financial information) issued in December Non-IFRS financial information has not been subject to audit or review. 38
40 Appendix 4 Explanation of Pro-forma Information The statutory results for the twelve months to 30 June 2012 to were impacted by the Qube restructure completed in the period which involved significant transaction costs and changes to accounting measurements. Therefore, the statutory results do not reflect the underlying financial performance of Qube in the period and are not comparable to the current period s results. The pro-forma and underlying results exclude non-cash and non-recurring items in order to more accurately reflect the underlying financial performance of Qube. References to underlying and pro-forma information are to non-ifrs financial information prepared in accordance with ASIC Regulatory Guide 230 (Disclosing non-ifrs financial information) issued in December Non-IFRS financial information has not been subject to audit or review. The pro-forma information for the twelve months to 30 June 2012 has been prepared on the following basis: Qube owned its current interest in Qube Logistics, Qube Ports & Bulk, AAT, NSS, Prixcar and Minto Properties for the entire reporting period. Qube accounted for its investment in Moorebank Industrial Property Trust (MIPT) as an associate until 8 June 2012 and has consolidated MIPT from 8 June 2012 (with a corresponding non-controlling interest recognised from 8 June 2012). Qube operated as a company for the entire reporting period. The one-off costs relating to the restructure have been excluded. Other non-cash items and non-operating items have been excluded. 39
41 Appendix 5 Tax Expense Reconciliation Year ended 30 June 2013 Statutory ($m) Underlying ($m) Net Profit Before Tax Prima-facie tax at 30% Non-deductible Items Profit of associates (4.7) (4.7) Reset of tax cost bases for property, plant and equipment Sundry items (0.1) - NSS impairment Giacci deferred consideration (2.4) - Minto fair value adjustment (2.7) - Tax Expense Effective Tax Rate 26.3% 25.5% Effective Tax Rate (ex associates) 30.6% 30.0% The underlying and pro-forma information excludes non-cash and non-recurring items in order to more accurately reflect the underlying financial performance of Qube. References to underlying and pro-forma information are to non-ifrs financial information prepared in accordance with ASIC Regulatory Guide 230 (Disclosing non-ifrs financial information) issued in December Non-IFRS financial information has not been subject to audit or review. 40
Qube Holdings Limited
 Qube Holdings Limited Investor Presentation FY 18 Interim Results 1 Disclaimer Important Notice ABN 141 497 230 53 The information contained in this Presentation or subsequently provided to the recipient
Qube Holdings Limited Investor Presentation FY 15 Full Year Results
 Qube Holdings Limited Investor Presentation FY 15 Full Year Results Disclaimer Important Notice ABN 141 497 230 53 The information contained in this Presentation or subsequently provided to the recipient
For personal use only
 QUBE HOLDINGS LIMITED 2014 ANNUAL GENERAL MEETING CHAIRMAN S SPEECH Good morning ladies and gentlemen. Welcome to this annual general meeting of shareholders of Qube Holdings Limited. My name is Chris
Qube Holdings Limited Investor Presentation FY 16 Interim Results
 Qube Holdings Limited Investor Presentation FY 16 Interim Results 1 Disclaimer Important Notice ABN 141 497 230 53 The information contained in this Presentation or subsequently provided to the recipient
Qube delivers another solid financial performance Further progress on Moorebank Project with strong tenant interest
 22 February 2018 ASX and Media Announcement Qube delivers another solid financial performance Further progress on Moorebank Project with strong tenant interest Underlying NPAT of $53.7 million ($61.6 million
Qube Holdings Limited Investor Presentation FY 16 Full Year Results
 Qube Holdings Limited Investor Presentation FY 16 Full Year Results 1 Disclaimer Important Notice ABN 141 497 230 53 The information contained in this Presentation or subsequently provided to the recipient
Qube delivers revenue and earnings growth while completing strategic acquisitions for the future
 23 August 2017 ASX Announcement Qube delivers revenue and earnings growth while completing strategic acquisitions for the future Both operating divisions up and Moorebank on track with Target Australia
Results for Announcement to the Market FY19 Half Year Report
 21 February 2019 Results for Announcement to the Market FY19 Half Year Report We attach the following for the half year ended : FY19 Half Year Report (Appendix 4D) Interim Financial Report For further
A S X A N N O U N C E M E N T
 A S X A N N O U N C E M E N T DATE: 24 February 2016 Attached is the Presentation regarding Pact s Half year Financial Results for the half year ended 31 December 2015. The Presentation will occur at 10am
AUB GROUP LTD FULL YEAR RESULTS
 AUB GROUP LTD FULL YEAR RESULTS FOR THE PERIOD ENDED 30 JUNE 207 (FY7) 28 TH AUGUST 207 Page - AUB Group Ltd FY7 Results NOTICE SUMMARY INFORMATION This document has been prepared by AUB Group Limited
 ASX ANNOUNCEMENT DATE: 22 February 2017 Attached is the Presentation regarding Pact s Half year Financial Results for the half year ended 31 December 2016. The Presentation will occur at 10am (Melbourne
2011 Interim Results. Keith Gordon, Managing Director & Chief Executive Officer Stephen Gobby, Chief Financial Officer
 2011 Interim Results Keith Gordon, Managing Director & Chief Executive Officer Stephen Gobby, Chief Financial Officer Emeco 2011 Interim Results Overview Financials Strategy & Outlook Questions Appendices
Half Year Results. For the 6 Months to 31 December Managing Director & CEO: Dr Paul Dalgleish. Chief Financial Officer: Mr Andrew Phipps
 Half Year Results For the 6 Months to 31 December 2013 Managing Director & CEO: Dr Paul Dalgleish Chief Financial Officer: Mr Andrew Phipps 18 February 2014 1 Delivering Returns To Shareholders Revenue
AUB GROUP LTD HALF YEAR RESULTS
 AUB GROUP LTD HALF YEAR RESULTS FOR THE PERIOD ENDED 31 DECEMBER 2017 (1H18) 26 FEBRUARY 2018 Page 1 - AUB Group Ltd 1H18 Results NOTICE SUMMARY INFORMATION This document has been prepared by AUB Group
25 February The Manager Market Announcements Australian Securities Exchange Limited 20 Bridge Street SYDNEY NSW 2000.
 Level 1 157 Grenfell Street Adelaide SA 5000 GPO Box 2155 Adelaide SA 5001 Adelaide Brighton Ltd ACN 007 596 018 Telephone (08) 8223 8000 International +618 8223 8000 Facsimile (08) 8215 0030 www.adbri.com.au
For personal use only
 FY16 FULL YEAR RESULTS REVIEW Agenda GROUP RESULTS OVERVIEW BUSINESS UNIT REVIEW OUTLOOK Eastlands Shopping Centre BSA completed the mechanical services upgrade and extension to one 29/08/2016 BSA Limited
13 APRIL WestConnex M4 East, New South Wales. Refer to ASX/Media Release for further information
 ANALYST AND INVESTOR PRESENTATION 1Q17 RESULTS Marcelino Fernández Verdes, Executive Chairman Adolfo Valderas, Chief Executive Officer Angel Muriel, Chief Financial Officer WestConnex M4 East, New South
For personal use only
 11 May 2017 The Manager Company Announcements Office ASX Limited 20 Bridge Street SYDNEY NSW 2000 GRAINCORP LIMITED: GNC INVESTOR PRESENTATION FINANCIAL HALF YEAR ENDED 31 MARCH 2017 Please find attached
Downer Half Year Results 21 February 2018 INVESTOR PRESENTATION
 Downer Half Year Results 21 February 218 INVESTOR PRESENTATION OVERVIEW Total revenue 1 $6.1 billion, up 69.3% (up 2.6% on a pro forma basis) Underlying Earnings Before Interest, Tax and Amortisation of
For personal use only
 A S X A N N O U N C E M E N T DATE: 24 August 2016 FY2016 RESULTS PRESENTATION Attached is the Presentation regarding Pact s Financial Results for the year ended 30 June 2016. The Presentation will occur
$128 Million Equity Raising. May 2007
 $128 Million Equity Raising May 2007 Disclaimer Any reproduction or distribution of this Presentation, in whole or in part, or any disclosure of its contents, or use of any information contained in this
For personal use only
 HY14 Results 15 May 2014 Disclaimer This presentation includes both information that is historical in character and information that consists of forward looking statements. Forward looking statements are
Transpacific FY15 Half Year Results Presentation
 Transpacific FY15 Half Year Results Presentation Robert Boucher CEO Brendan Gill CFO 20 February 2015 - Disclaimer Forward looking statements - This presentation contains certain forward-looking statements,
Photo by James Ball - Coffey International Limited FY2013 Half Year Results Presentation. 11 February 2013
 Photo by James Ball - www.dlscape.com Coffey International Limited FY2013 Half Year Results Presentation 11 February 2013 Agenda Financial Performance Business Performance Outlook Presenters John Douglas
FY2013 Results Presentation By Chris Sutherland, Managing Director 29 May 2013
 FY2013 Results Presentation By Chris Sutherland, Managing Director 29 May 2013 Important notice and disclaimer The information contained in this presentation is for information purposes p only and does
Credit Suisse Annual Asian Investment Conference
 Adelaide Brighton Limited Credit Suisse Annual Asian Investment Conference Hong Kong, 27 30 March 2017 Martin Brydon Chief Executive Officer and Managing Director Adelaide Brighton Limited Overview of
For personal use only
 Affinity Education Group (ASX:AFJ) Morgans Conference 10 October 2014 Disclaimer This presentation contains general information in summary form which is current as at 10 October 2014. It presents financial
2017 FULL YEAR RESULTS
 2017 FULL YEAR RESULTS ESTABLISHING LEADING POSITIONS IN NEW GROWTH SECTORS Malcolm Bundey Managing Director and CEO Richard Betts Chief Financial Officer 16 August 2017 Pact Group Holdings Ltd ABN: 55
For personal use only
 Preliminary Final Report Appendix 4E Results for announcement to the market Pulse Health Limited (ACN 104 113 760) This Preliminary Final Report is provided to the Australian Securities Exchange (ASX)
For personal use only
 Affinity Education Group Full Year 2014 Results 27 February 2015 2014 Highlights FY 2014 Earnings Growth Underlying EBITDA of $17.9m (1) and underlying NPAT of $11.4m (1) Underlying EPS of 8.1 cents (1)
FY17 Results Presentation. Chris Sutherland, Managing Director 24 May 2017
 FY17 Results Presentation Chris Sutherland, Managing Director 24 May 2017 Important notice and disclaimer The information contained in this presentation is for information purposes only and does not constitute
For personal use only
 FY18 Half Year Results For the six months ended 31 December 2017 21 February 2018 Disclaimer Forward looking statements This presentation contains certain forward-looking statements, including with respect
KAPLAN FUNDS MANAGEMENT PTY LIMITED (ABN )
") KAPLAN FUNDS MANAGEMENT PTY LIMITED (ABN 98 079 218 643) ASX and Media Announcement 14 April 2010 Update on Acquisition of Kaplan Equity Limited Kaplan Funds Management Pty Limited (KFM), manager of the
KAPLAN FUNDS MANAGEMENT PTY LIMITED (ABN 98 079 218 643) ASX and Media Announcement 14 April 2010 Update on Acquisition of Kaplan Equity Limited Kaplan Funds Management Pty Limited (KFM), manager of the
Following is a presentation that is to be given at the CLSA Investors Forum in Hong Kong on 25 September 2013.
 24 September 2013 The Manager Company Announcements Office Australian Securities Exchange Dear Sir, CLSA INVESTORS FORUM PRESENTATION Following is a presentation that is to be given at the CLSA Investors
For personal use only. Transfield Services Limited
 Transfield Services Limited Half Year Results 26 February 2015 Disclaimer and Important Information 2 This presentation is for information purposes only and is a summary only. It should be read in conjunction
EBOS Group Ltd. For personal use only. Results presentation Financial Year ended 30 June August 2016
 EBOS Group Ltd Results presentation Financial Year ended 30 June 2016 Patrick Davies John Cullity Chief Executive Officer Chief Financial Officer 25 August 2016 Disclaimer The information in this presentation
The attached Revised FY2018 Results Presentation corrects this error.
 29 November 2018 Company Announcements Office Australian Securities Exchange Limited Exchange Centre 20 Bridge Street Sydney NSW 2000 Aristocrat Leisure Limited Formatting Error Revised FY2018 Results
AUB GROUP LTD FULL YEAR RESULTS FOR THE PERIOD ENDED 30 JUNE 2018 (FY18) 27 AUGUST 2018
 27 AUGUST 2018") AUB GROUP LTD FULL YEAR RESULTS FOR THE PERIOD ENDED 30 JUNE 2018 (FY18) 27 AUGUST 2018 NOTICE SUMMARY INFORMATION This document has been prepared by AUB Group Limited(ABN 60 000 000 715)(AUB). It is a
AUB GROUP LTD FULL YEAR RESULTS FOR THE PERIOD ENDED 30 JUNE 2018 (FY18) 27 AUGUST 2018 NOTICE SUMMARY INFORMATION This document has been prepared by AUB Group Limited(ABN 60 000 000 715)(AUB). It is a
Cameron Judson, CEO Glynn Wright, CFO. McGrath Limited (ASX: MEA) Results for the 6 months ended 31 December February 2018
 Results for the 6 months ended 31 December February 2018") Cameron Judson, CEO Glynn Wright, CFO McGrath Limited (ASX: MEA) Results for the 6 months ended 31 December 2017 15 February 2018 1H18 A SNAPSHOT REVENUE DOWN 23% TO $51.6M GOODWILL IMPAIRMENT ($21.8)
Cameron Judson, CEO Glynn Wright, CFO McGrath Limited (ASX: MEA) Results for the 6 months ended 31 December 2017 15 February 2018 1H18 A SNAPSHOT REVENUE DOWN 23% TO $51.6M GOODWILL IMPAIRMENT ($21.8)
For personal use only
 DWS Limited 2018 Full Year Results Presentation Contents Introduction Danny Wallis (CEO) / Stuart Whipp (CFO) Results Highlights Full Year Results Capital Management Operations Update Summary and Outlook
For personal use only
 18 OCTOBER 2016 3Q CASH FLOW FROM OPERATING ACTIVITIES UP 7.3% YOY TO $533M, AN EBITDA CONVERSION RATE OF 192% IN LAST 12 MONTHS (LTM), WHICH ADJUSTS FOR SEASONALITY, EBITDA CONVERSION RATE OF 107% 9M16
FY16 Financial Results Investor Presentation. August 2016
 FY16 Financial Results Investor Presentation August 2016 FY16 Results Summary Improvement on FY15 across all key earnings metrics EPS growth and improved shareholder returns Revenue EBITDA PBT EPS Dividend
ASG GROUP DELIVERS SOLID GROWTH ACROSS ALL KEY FINANCIAL INDICATORS
 ASG GROUP LIMITED ASX ANNOUNCEMENT: H1 RESULTS RELEASE DATE: 28 TH FEBRUARY 2012 ASG GROUP DELIVERS SOLID GROWTH ACROSS ALL KEY FINANCIAL INDICATORS Financial Highlights: Revenue of $76.04 million, an
For personal use only
 Mantra Group H1FY2015 Results Presentation 26 February 2015 Important notice and disclaimer Important notice and disclaimer This document is a presentation of general background information about the activities
HALF YEAR RESULTS 19 FEBRUARY 2016
 HALF YEAR RESULTS 19 FEBRUARY 2016 Overview Market conditions remain challenging - operating environment likely to remain subdued over the near term due to ongoing pressure on commodity prices Continued
Highlights Delivering Returns To Shareholders RCR Businesses RCR s Acquisition of Norfolk (ASX: NFK) - Strategic Rationale - Overview Post Norfolk
 - Strategic Rationale - Overview Post Norfolk") RCR Investor Presentation ASX Hong Kong & Singapore Conference Managing Director & CEO: Dr Paul Dalgleish 14 May 2013 1 Agenda Highlights Delivering Returns To Shareholders RCR Businesses RCR s Acquisition
RCR Investor Presentation ASX Hong Kong & Singapore Conference Managing Director & CEO: Dr Paul Dalgleish 14 May 2013 1 Agenda Highlights Delivering Returns To Shareholders RCR Businesses RCR s Acquisition
Work in hand 4 increased to $42.0 billion
 Highlights Underlying NPATA up 58.9% to $296.5m Up 6.7% on a pro forma basis 1 Guidance met for seventh consecutive year Revenue 2 up 61.5% to $12.6bn (up 16.7% on a pro forma basis) Final dividend increased
FIRST HALF FINANCIAL YEAR 2018 RESULTS PRESENTATION
 FIRST HALF FINANCIAL YEAR 2018 RESULTS PRESENTATION 15 February 2018 Steve Gostlow, Managing Director 2 Our corporate ideals are based on safety, reliability and sustainability. 1H18 - Highlights Safety
HALF YEAR RESULTS 27 FEBRUARY 2017
 HALF YEAR RESULTS 27 FEBRUARY 2017 Important Notice and Disclaimer DISCLAIMER AS TO FORWARD LOOKING STATEMENTS This presentation contains forward looking statements, including statements of current intention,
For personal use only. NRW HOLDINGS Macquarie Western Australia Forum 2018
 NRW HOLDINGS Macquarie Western Australia Forum 2018 1 RESULTS OVERVIEW Revenue: $754.3M (1) double the same period last year. EBITDA (2): $93.5M compared to $58.9M in the prior comparative period. Net
Macquarie Securities Western Australia Forum. 15 October 2014
 Macquarie Securities Western Australia Forum 15 October 2014 Disclaimer Summary information This presentation contains summary information of TOX Solutions Limited ( TOX ) and is dated 15 October 2014.
Affinity Education Group. Half Year Results
 Affinity Education Group Half Year Results 29 August 2014 Disclaimer This presentation contains general information in summary form which is current as at 29 August 2014. It presents financial information
Sigma Pharmaceuticals Limited
 Investor Relations Contact: Gary Woodford Corporate Affairs Manager Gary.Woodford@signet.com.au Phone: 03 9215 9632 Mobile: 0417 399 204 Mark Hooper CEO and Managing Director Gary Woodford Corporate Affairs
FY18 Results Presentation 22 August Focus on execution. Results for the year ended 30 June August 2018
 Focus on execution Results for the year ended 30 June 2018 Disclaimer Basis of Preparation of Slides Included in this presentation is data prepared by the management of Seven Group Holdings Limited ( SGH
2017 Full Year Results Presentation
 2017 Full Year Results Presentation Australia's leading supplier of aluminium products and solutions 5 plants; 8 extrusion presses 18 distribution centres Australia-wide Annual extrusion capacity 70k tonnes
Watpac Limited. 31 December 2016 Half Year Results Presentation. 16 February 2017
 Watpac Limited 31 December 2016 Half Year Results Presentation 16 February 2017 1H FY17 Group financial summary Construction earnings down; Civil & Mining improves and project funding capacity substantially
For the Financial Year Ended 30 June 2013
 Annual Results For the Financial Year Ended 30 June 2013 Record Profit Record Revenue Record Cash Record Year Managing Director & CEO: Paul Dalgleish Chief Financial Officer: Andrew Walsh 22 August 2013
For personal use only GTN Limited Results for the 12 months ending 30 June 2016
 GTN Limited Results for the 12 months ending 30 June 2016 Highlights: Revenue $166.1 million, +8% on FY 2015 (+1% on Prospectus Forecast of $164.1 million) Statutory NPAT ($17.2) million (exceeds FY 2015
FY2017 Result Presentation. 21 August 2017
 FY2017 Result Presentation 21 August 2017 The Hansen journey growing and diversifying by geography, industry, propriety products and customer Early 1990 s Today Revenue by geography Industry verticals
For personal use only
 FY15 FULL YEAR RESULTS REVIEW Progressing to plan Agenda GROUP RESULTS OVERVIEW BUSINESS UNIT REVIEW OUTLOOK 150 Collins Street, Westpac Building. Mechanical work was completed by Allstaff Airconditioning
Engenco Limited Investor Presentation FY17. Presented by: Vince De Santis (Chairman) Kevin Pallas (Managing Director & CEO)
 Kevin Pallas (Managing Director & CEO)") Engenco Limited Investor Presentation Presented by: Vince De Santis (Chairman) Kevin Pallas (Managing Director & CEO) Company $8,269,000 Highlights Total profit for the period Revenue (from continuing
Engenco Limited Investor Presentation Presented by: Vince De Santis (Chairman) Kevin Pallas (Managing Director & CEO) Company $8,269,000 Highlights Total profit for the period Revenue (from continuing
Appendix 4D. Half Year Report Half year ended 31 December (previous period) December December 2016
 December December 2016") Rubicor Group Limited Half Year Report Half Year Ended 31 December 2017 Appendix 4D Half Year Report Half year ended 31 December 2017 Name of entity Rubicor Group Limited ABN Half year ended (current period)
Rubicor Group Limited Half Year Report Half Year Ended 31 December 2017 Appendix 4D Half Year Report Half year ended 31 December 2017 Name of entity Rubicor Group Limited ABN Half year ended (current period)
For personal use only
 Investor Presentation Capital Raising 25 March 2019 1 2 3 4 5 6 7 Strategic rationale Acquisitions Sources & application of funds Financials Offer details Risks Contact details Executive summary Acquisitions
OVERVIEW. Operating cash flow $447.8 million, EBITDA conversion 92.8% Total revenue 1 $7,394 million, down 0.5%
 OVERVIEW Total revenue 1 $7,394 million, down 0.5% Earnings Before Interest and Tax (EBIT) $276.9 million, down 10.6%. Down 1.5% adjusting for $13 million Capital Metro bid costs and $15 million reduction
For personal use only
 SUMMARY OF 1H19 GROUP OUTCOMES Strong first half performance UNDERLYING PROFIT BEFORE TAX (UPBT) 1H19 $112.3m up $30.4m on 1H18 Highest 1H underlying result in 11 years Delivered despite $88.2m fuel and
PMP LIMITED INVESTOR PRESENTATION. Results for the 12 months ended 30 June August Peter George, CEO Geoff Stephenson, CFO
 PMP LIMITED ABN 39 050 148 644 Results for the 12 months ended 30 June 2017 28 August 2017 Peter George, CEO Geoff Stephenson, CFO INVESTOR PRESENTATION 2017 FULL YEAR RESULTS Contents Pages Delivering
Aristocrat Leisure Limited Investor Presentation 29 November Results Presentation 12 months to 30 September 2018
 Aristocrat Leisure Limited Investor Presentation 29 November 2018 Results Presentation 12 months to 30 September 2018 Disclaimer This document and any oral presentation accompanying it has been prepared
Inghams Group Limited. FY2018 Results Presentation
 Inghams Group Limited FY2018 Results Presentation 22 AUGUST 2018 Important notice and disclaimer Disclaimer The material in this presentation is general background information about the activities of Inghams
Watpac Limited. 30 June 2018 Full Year Results Presentation. 23 August 2018
 Watpac Limited 30 June 2018 Full Year Results Presentation 23 August 2018 Full year group snapshot Capital Earnings Asset Values Work-in-hand Strategy Strong liquidity maintained Full repayment of equipment
Cleanaway Waste Management Limited
 Cleanaway Waste Management Limited Australia s leading total waste management services company FY16 Results Presentation For the twelve months ended 30 June 2016 19 August 2016 Vik Bansal CEO and Managing
FY18 FULL YEAR RESULTS REVENUE UP 18%, NPAT UP 43%, FREE CASH FLOW UP 87% FINAL DIVIDEND UP 27%
 FY18 FULL YEAR RESULTS REVENUE UP 18%, NPAT UP 43%, FREE CASH FLOW UP 87% FINAL DIVIDEND UP 27% All operating divisions organically increased revenue and earnings Strong cash flow and cash conversion Acquisition
Adelaide Brighton Ltd ACN
 Level 1 157 Grenfell Street Adelaide SA 5000 GPO Box 2155 Adelaide SA 5001 Adelaide Brighton Ltd ACN 007 596 018 Telephone (08) 8223 8000 International +618 8223 8000 Facsimile (08) 8215 0030 www.adbri.com.au
For personal use only
 COMPANY ANNOUNCEMENT 23 FEBRUARY 2016 AUSTAL DELIVERS STRONG CASHFLOW, DOUBLES INTERIM DIVIDEND Summary: Revenue of $747.4 million (FY2015 H1: $680.2 million) EBIT of $29.0 million (FY2015 H1: $45.0 million,
For personal use only
 22 August 2018 Company Announcements Office Australian Securities Exchange Limited 20 Bridge Street SYDNEY NSW 2000 By electronic lodgment Total Pages: 6 (including covering letter) Dear Sir / Madam APPENDIX
FY17 RESULTS. Tuesday 20 February 2018
 FY17 RESULTS Tuesday 20 February 2018 Agenda 2017 Highlights Results 2018 Observations Out-of-Home industry APN Outdoor Contract renewals Focus and objectives Trading update 2 2017 Highlights 3 2017 highlights
Boom Logistics Limited. Half Year Results Presentation. 25 February Boom Logistics Limited. Half Year Results Presentation.
 Boom Logistics Limited Half Year Results Presentation 25 February 2011 Boom Logistics Limited Half Year Results Presentation 25 February 2011 Summary $5.1m trading NPAT for 1H11, up $4.6m from prior corresponding
KAPLAN FUNDS MANAGEMENT PTY LIMITED (ABN )
") KAPLAN FUNDS MANAGEMENT PTY LIMITED (ABN 98 079 218 643) ASX and Media Announcement 5 February 2010 KIL acquisition to double the size of logistics investments assets to increase to around $445 million.
KAPLAN FUNDS MANAGEMENT PTY LIMITED (ABN 98 079 218 643) ASX and Media Announcement 5 February 2010 KIL acquisition to double the size of logistics investments assets to increase to around $445 million.
For personal use only. FY2014 Half Year Results Presentation Period Ended 31 December 2013
 FY2014 Half Year Results Presentation Period Ended 31 December 2013 Company Overview Australia s largest automotive retailer by sales, profitability, market capitalisation and workforce 152 franchises
Annual General Meeting 14 November 2013
 Annual General Meeting 14 November 2013 Disclaimer and additional information This presentation has been prepared by and concerns Calibre Group Limited (Calibre), and consists of these slides and any accompanying
For personal use only
 Appendix 4D Half-year report 1. Company details Name of entity: ABN: 57 155 848 589 Reporting period: For the half-year ended 30 June 2016 Previous period: For the half-year ended 30 June 2015 2. Results
INDEPENDENCE GROUP NL FY18 Results Presentation
 INDEPENDENCE GROUP NL FY18 Results Presentation Nova and Tropicana drive record financial results 29 August 2018 ASX:IGO / ADR:IIDY Cautionary Statements & Disclaimer This presentation has been prepared
Brookfield Infrastructure Partners L.P. Proposed Investment in Asciano Limited Conference Call Presentation August 2015
 Proposed Investment in Asciano Limited Conference Call Presentation August 2015 Notice to Readers 2 This presentation regarding ( BIP ), alongside its institutional partners ( Brookfield ) proposed investment
GRAINCORP LIMITED: GNC INVESTOR PRESENTATION FINANCIAL YEAR ENDED 30 SEPTEMBER 2017
 21 November 2017 The Manager Company Announcements Office ASX Limited 20 Bridge Street SYDNEY NSW 2000 GRAINCORP LIMITED: GNC INVESTOR PRESENTATION FINANCIAL YEAR ENDED 30 SEPTEMBER 2017 Please find attached
Cover-More Group. UBS Australasia Conference. November 2015
 Cover-More Group UBS Australasia Conference November 2015 Executive summary: FY15 overview Cover-More delivered another year of double digit earnings growth, with offshore business growing substantially.
For personal use only
 P NOT FOR DISTRIB NOT FOR DISTRIBUTION OR RELEASE IN THE UNITED STATES UTION OR RELEASE IN THE UNITED STATES Downer EDI Limited ABN 97 003 872 848 Triniti Business Campus 39 Delhi Road North Ryde NSW 2113
1H18 Results Presentation Sid Takla Interim Chief Executive Officer Lyndal York Chief Financial Officer
 1H18 Results Presentation Sid Takla Interim Chief Executive Officer Lyndal York Chief Financial Officer 21 August 2018 Important Notice and Disclaimer This presentation has been prepared by Asaleo Care
Australia and New Zealand Banking Group Limited
 Australia and New Zealand Banking Group Limited ABN 11 005 357 522 31 March 2017 Consolidated Financial Report Dividend Announcement and Appendix 4D The Consolidated Financial Report and Dividend Announcement
Financial Results Full year ended 30 June August 2016
 Financial Results Full year ended 30 June 2016 25 August 2016 Agenda Results Overview Galdino Claro, Group CEO Financial Results Fred Knechtel, Group CFO Strategic Progress & Outlook Galdino Claro, Group
COLLINS FOODS LIMITED. MORGANS ANNUAL QLD CONFERENCE 8 October 2014
 COLLINS FOODS LIMITED MORGANS ANNUAL QLD CONFERENCE 8 October 2014 Page 1 Chief Executive Officer Graham Maxwell Collins Foods Limited 170 KFC restaurants across Queensland, Western Australia and Northern
ASX Announcement. Appendix 4D and 31 December 2012 Half Year Financial Report. 21 February 2013
 ASX Announcement 21 February 2013 The Manager Company Announcements ASX Limited Exchange Centre 20 Bridge Street SYDNEY NSW 2000 Appendix 4D and 2012 Half Year Financial Report Attached for release to
Bradken Limited 2014 Half Year Results
 Presenters BRIAN HODGES Managing Director STEVE PERRY Chief Financial Officer Bradken Limited 2014 Half Year Results Tuesday, 11 th February 2014 2014 Half Year Results 1. Key Outcomes Brian Hodges 2.
National Tyre & Wheel Limited Appendix 4D Half-year report for the period ended 31 December 2017
 National Tyre & Wheel Limited Appendix 4D Half-year report for the period ended 31 December 2017 1. Company details Name of entity: National Tyre & Wheel Limited and its controlled entities ABN: 97 095
FY2015 Annual Results August Brett McKeon - CEO David Bailey - CFO
 FY2015 Annual Results August 27 2015 Brett McKeon - CEO David Bailey - CFO FY2015 Financial Results Highlights Delivery on FY15 Prospectus forecasts Pro forma NPAT $19.3 million up 8.4% against IPO forecast
Credit Opinion: Ascendas Real Estate Investment Trust
 Credit Opinion: Ascendas Real Estate Investment Trust Global Credit Research - 28 May 2012 Singapore Ratings Category Outlook Corporate Family Rating Senior Unsecured Moody's Rating Stable A3 Baa1 Contacts
Genex Power (GNX) COMPANY REPORT. NAIF lined up for Stage 2
 COMPANY REPORT. NAIF lined up for Stage 2") 21 June 2018 INTERNAL ONLY RECOMMENDATIONS Rating BUY Risk Speculative Price Target $0.37 Share Price $0.31 SNAPSHOT Monthly Turnover $2.5mn Market Cap $91mn Shares Issued 303.9mn 52-Week High $0.43 52-Week
21 June 2018 INTERNAL ONLY RECOMMENDATIONS Rating BUY Risk Speculative Price Target $0.37 Share Price $0.31 SNAPSHOT Monthly Turnover $2.5mn Market Cap $91mn Shares Issued 303.9mn 52-Week High $0.43 52-Week
Genworth Mortgage Insurance Australia
 Genworth Mortgage Insurance Australia 1Q 2016 Financial results presentation 29 April 2016 2016 Genworth Mortgage Insurance Australia Limited. All rights reserved. Disclaimer This presentation contains
30 June 2015 Full Year Results Presentation August 2015
 30 June 2015 Full Year Results Presentation August 2015 FY15 Results Significant restructuring and capital management to support profit recovery in FY16. Statutory EBIT loss of $33.2m Statutory NPAT loss
PMP LIMITED INVESTOR PRESENTATION. Results for the 12 months ended 30 June August Peter George, CEO Geoff Stephenson, CFO
 PMP LIMITED ABN 39 050 148 644 Results for the 12 months ended 30 June 2016 29 August 2016 Peter George, CEO Geoff Stephenson, CFO INVESTOR PRESENTATION 2016 FULL YEAR RESULTS Contents Pages FY16 Highlights
Please find attached Presenters Notes for the Presentation of Results for the financial half-year ended 31 December 2017.
 21 February 2018 Company Announcements Office Australian Securities Exchange Limited Level 6, 20 Bridge Street Sydney NSW 2000 By electronic lodgment Total Pages: 12 (including covering letter) Dear Sir
FY19 half year results
 FY19 half year results For the six months ended 31 December 2018 14 February 2019 Gordon Ballantyne Managing Director & Chief Executive Officer Michael Sammells Chief Financial Officer 1 1HFY19 returned