Qube Holdings Limited
|
|
|
- Basil Henry Sims
- 5 years ago
- Views:
Transcription


1 Qube Holdings Limited Investor Presentation FY 18 Interim Results 1
2 Disclaimer Important Notice ABN The information contained in this Presentation or subsequently provided to the recipient whether orally or in writing by, or on behalf of Qube Holdings Limited (Qube) or any of its directors, officers, employees, agents, representatives and advisers (the Parties) is provided to the recipient on the terms and conditions set out in this notice. The information contained in this Presentation has been furnished by the Parties and other sources deemed reliable but no assurance can be given by the Parties as to the accuracy or completeness of this information. To the full extent permitted by law: (a) no representation or warranty (express or implied) is given; and (b) no responsibility or liability (including in negligence) is accepted, by the Parties as to the truth, accuracy or completeness of any statement, opinion, forecast, information or other matter (whether express or implied) contained in this Presentation or as to any other matter concerning them. To the full extent permitted by law, no responsibility or liability (including in negligence) is accepted by the Parties: (a) for or in connection with any act or omission, directly or indirectly in reliance upon; and (b) for any cost, expense, loss or other liability, directly or indirectly, arising from, or in connection with, any omission from or defects in, or any failure to correct any information, in this Presentation or any other communication (oral or written) about or concerning them. The delivery of this Presentation does not under any circumstances imply that the affairs or prospects of Qube or any information have been fully or correctly stated in this Presentation or have not changed since the date at which the information is expressed to be applicable. Except as required by law and the ASX listing rules, no responsibility or liability (including in negligence) is assumed by the Parties for updating any such information or to inform the recipient of any new information of which the Parties may become aware. Notwithstanding the above, no condition, warranty or right is excluded if its exclusion would contravene the Competition and Consumer Act 2010 or any other applicable law or cause an exclusion to be void. The provision of this Presentation is not and should not be considered as a recommendation in relation to an investment in Qube or that an investment in Qube is a suitable investment for the recipient. References to underlying information is to non-ifrs financial information prepared in accordance with ASIC Regulatory Guide 230 (Disclosing non-ifrs financial information) issued in December Non-IFRS financial information has not been subject to audit or review. 2
3 Table of contents FY 18 Interim Results Highlights Divisional Summary Key Financial Information Outlook Appendices - Additional Financial Information 3

4 FY 18 Interim Results Highlights 4

 Increased earnings from the Strategic Assets division driven by a full six months contribution from AAT and high")
5 FY 18 Interim Results Highlights Half year in review Pleasing financial performance reflecting Qube s strong market positions, diversified activities and healthy volumes across most areas of Qube s business: o o o o o Very strong Ports & Bulk result with solid volumes in both ports and bulk activities Revenue growth but minor decline in earnings for the Logistics division from temporary and/or largely expected factors (i.e. Sydney Haulage exit related costs and low grain volumes) Increased earnings from the Strategic Assets division driven by a full six months contribution from AAT and high volumes of motor vehicles and mining related vehicles Earnings from Patrick benefitted from a full six months contribution, strong market growth, a customer win as well as acquisition cost savings / synergies (to help offset prior year major contract loss) Underlying earnings decline reflects the $22.2 million net pre-tax contribution from Qube s Asciano shareholding realised in the prior corresponding period as part of the completion of the Patrick acquisition Positive progress on the Moorebank Logistics Park project: o o o Construction and development activities well underway Executed warehouse agreement for lease and logistics contract with Target Australia In February 2018, reached in-principle agreement (currently being documented) with a key prospective tenant that has significant import volumes to reserve 150,000m 2 of area at Moorebank Underlying revenue $811.9 million (+7.1%) Underlying EBITDA $134.3 million (-2.5%) Underlying NPATA* $61.6 million (-9.0%) Statutory revenue $797.2 million (+5.6%) Statutory EBITDA $128.4 million (-6.3%) Statutory NPATA* $53.1 million (-0.6%) Interim dividend 2.70 cents (fully franked and in line with pcp) *Note: Adjusting for Qube s amortisation and Qube s share of Patrick s amortisation. The underlying information excludes certain non-cash and non-recurring items in order to more accurately reflect the underlying financial performance of Qube. References to underlying information are to non-ifrs financial information prepared in accordance with ASIC Regulatory Guide 230 (Disclosing non-ifrs financial information) issued in December Non-IFRS financial information has not been subject to audit or review.
 36.2 35.9 + 15.2% 35.5 (0.2) 811.9 140 120 100 80 60 40 20 137.8 (22.2) 115.6 (2.6) 6.8 14.7 + 16.2% (0.2) 134.")
6 $ million $ million FY 18 Interim Results Highlights Solid overall financial performance in the period Underlying revenue (+7.1%) Underlying EBITDA (-2.5%) (53.3) % 35.5 (0.2) (22.2) (2.6) % (0.2) Revenue growth in all divisions Growth in earnings in the Ports & Bulk and Strategic Assets divisions Logistics division s earnings impacted by short term factors Prior year earnings included contribution from Qube s Asciano shareholding realised in the period 0 H1 FY 17 Net contribution from Asciano shareholding H1 FY 17 (adjusted) Logistics Ports & Bulk Strategic Assets Corporate H1 FY 18 0 H1 FY 17 Net H1 contribution FY 17 from (adjusted) Asciano shareholding Logistics Ports & Bulk Strategic Assets Corporate H1 FY 18 The underlying information excludes certain non-cash and non-recurring items in order to more accurately reflect the underlying financial performance of Qube. References to underlying information are to non-ifrs financial information prepared in accordance with ASIC Regulatory Guide 230 (Disclosing non-ifrs financial information) issued in December Non-IFRS financial information has not been subject to audit or review. 6
 Net contribution from Asciano shareholding 52.2 H1 FY 17 (adjusted) (0.5) Logistics* 5.2 Ports & Bulk* 8.3 + 18.0% Strategic Assets* 1.3 (3.7) Patrick** (1.2) 61.")
7 $ million $ per share FY 18 Interim Results Highlights Solid overall financial performance in the period (continued) Underlying NPAT pre-amortisation (NPATA) (-9.0%) 67.7 H1 FY 17 (15.5) Net contribution from Asciano shareholding 52.2 H1 FY 17 (adjusted) (0.5) Logistics* 5.2 Ports & Bulk* % Strategic Assets* 1.3 (3.7) Patrick** (1.2) 61.6 Other Corporate H1 Associates FY Underlying EPS pre-amortisation (EPSA) (-24.0%) 5.0 H1 FY 17 (1.1) Net contribution from Asciano shareholding H1 FY 17 (adjusted) +2.6% H1 FY 18 (actual) H1 FY 18 (excl. net impact of Jun17 capital raising)*** The underlying NPATA reflects: o Overall earnings growth from the operating divisions and the Strategic Assets division as well as an increased contribution from Patrick o A reduced contribution from the other Associates (mainly relating to AAT which was an associate for 5 months in the pcp) The decline in NPATA and EPSA from the prior corresponding period primarily reflects: o The inclusion in the prior period of a net contribution from Qube s Asciano shareholding ($15.5 million NPATA); and o The dilutionary impact of the $350 million capital raising completed in June 2017 (with the related earnings to flow in the future) *Note: Excluding earnings from divisional Associates. **Note: Qube s share of Patrick s underlying NPAT (pre-amortisation) and post tax interest income on shareholder loan. ***Note: H1 FY 18 EPSA calculated by excluding full period impact of dilution of number of shares attributable to the June 2017 capital raising and excluding the associated interest savings. The underlying information excludes certain non-cash and non-recurring items in order to more accurately reflect the underlying financial performance of Qube. References to underlying information are to non-ifrs financial information prepared in accordance with ASIC Regulatory Guide 230 (Disclosing non-ifrs financial information) issued in December Non-IFRS financial information has not been subject to audit or review. 7

8 FY 18 Interim Results Highlights Focus on Safety LTIFR* Qube Holdings LTI FY 07 FY 08 FY 09 FY 10 FY 11 FY 12 FY 13 FY 14 FY 15 FY 16 FY17 H1 FY 18 *Note: Lost Time Injury Frequency Rate Continued improvement in LTIFR in H1 FY 18 as a result of Qube s Zero Harm programs Continued integration of risk management practices into the business through the use of telematics in the trucks that monitor vehicle performance and driver behaviour Qube has focused critical risks and robust incident and injury management processes 8
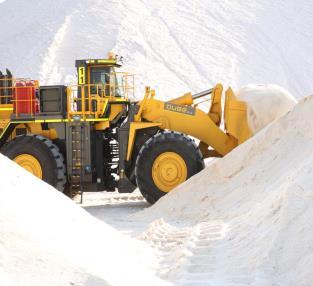
9 Divisional Summary Ports & Bulk Division Financial Highlights Underlying revenue growth of 9.9% to $399.6 million Underlying EBITA growth of 20.0% to $42.0 million Total capex of around $39.1 million Strong earnings contribution and pleasing margin improvement from scale and investment in equipment and infrastructure Ports activities benefitted from growth in a range of products with high volumes across forestry products, vehicles, cement, steel and improvement in oil and gas related activities Bulk activities benefitted from steady or increasing volumes across most bulk commodities and locations although Utah Point volumes and earnings were lower (as expected) due to the end of mine life of a key customer s mine The underlying information excludes certain non-cash and non-recurring items in order to more accurately reflect the underlying financial performance of Qube. References to underlying information are to non-ifrs financial information prepared in accordance with ASIC Regulatory Guide 230 (Disclosing non-ifrs financial information) issued in December Non-IFRS financial information has not been subject to audit or review. 9
10 Divisional Summary Ports & Bulk Division Indicative Revenue Segmentation SA 5.3% NT 3.1% H1 FY 18 Revenue by region H1 FY 17 NZ 14.0% Asia 1.4% QLD 12.8% NSW 8.6% VIC 9.6% SA 5.5% NT 2.2% NZ 14.1% Asia 0.8% QLD 12.0% NSW 7.4% VIC 11.0% WA 41.4% TAS 3.8% WA 44.0% TAS 3.0% Facility Operations 5.3% Oil & Gas 7.5% Vehicles/ Machinery/ Boats/ WHSS 6.6% Ancilliary Services 7.2% Forest Products 16.0% Other 8.5% Iron Ore 10.0% Concentrate 8.0% Coal 4.4% Bulk Scrap & Others 15.4% Mineral sand 11.1% Revenue by product Ancilliary Services 6.6% Facility Operations 4.9% Vehicles/ Machinery/ Boats/ WHSS 6.5% Forest Products 16.5% The underlying information excludes certain non-cash and non-recurring items in order to more accurately reflect the underlying financial performance of Qube. References to underlying information are to non-ifrs financial information prepared in accordance with ASIC Regulatory Guide 230 (Disclosing non-ifrs financial information) issued in December Non-IFRS financial information has not been subject to audit or review. Oil & Gas 7.3% Other 6.9% Iron Ore 14.0% Coal 4.3% Bulk Scrap & Others 14.6% Concentrate 7.5% Mineral sand 10.9% 10
11 Divisional Summary Logistics Division Financial Highlights Underlying revenue growth of 11.0% to $365.0 million Underlying EBITA reduction of 1.9% to $36.0 million Total capex of around $111.0 million which was predominantly growth related, including $88.2 million (net) for the MCS acquisition completed on 27 December 2017 Maintained its strong market position despite continued rate and cost pressures Solid earnings contribution across all States other than NSW which was impacted by: o Very low grain volumes due to drought impacting bulk rail and containerised grain export volumes o Cost inefficiencies as a result of the exit from the Sydney Haulage site during FY 17 MCS acquisition completed on 27 December 2017 will provide a site with a rail terminal and empty container park operations to replace the Sydney Haulage site and improve efficiency Pleasing progress being made securing tenants for future Qube Logistics Moorebank warehouse The underlying information excludes certain non-cash and non-recurring items in order to more accurately reflect the underlying financial performance of Qube. References to underlying information are to non-ifrs financial information prepared in accordance with ASIC Regulatory Guide 230 (Disclosing non-ifrs financial information) issued in December Non-IFRS financial information has not been subject to audit or review. 11
12 Divisional Summary Logistics Division Indicative Revenue Segmentation H1 FY 18 Revenue by region H1 FY 17 SA 7.7% WA 10.2% Global Forwarding 1.5% QLD 23.1% SA 6.9% WA 10.5% Global Forwarding 1.6% QLD 24.3% VIC 31.3% NSW 26.2% VIC 23.1% NSW 33.6% Revenue by product Manufacturing 22.3% Other 9.7% Container handling & terminal services 19.1% Retail 15.5% Manufacturing 21.3% Other 11.3% Container handling & terminal services 18.8% Retail 12.9% Mining 3.0% Food processing Agriculture Mining 4.2% Food processing Agriculture 22.6% 10.5% 19.9% 8.9% The underlying information excludes certain non-cash and non-recurring items in order to more accurately reflect the underlying financial performance of Qube. References to underlying information are to non-ifrs financial information prepared in accordance with ASIC Regulatory Guide 230 (Disclosing non-ifrs financial information) issued in December Non-IFRS financial information has not been subject to audit or review. 12
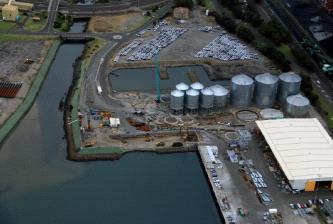
13 Divisional Summary Strategic Assets Division Financial Highlights Indicative Revenue Segmentation (by business) Underlying revenue growth from $11.7 million to $47.2 million Underlying EBITA growth from $2.9 million to $15.0 million Total capex of around $73.9 million H1 FY 18 Minto Moorebank 4.2% 8.3% Minto 24.8% H1 FY 17 Increased revenue and earnings compared to pcp driven by full period contribution from AAT compared to only 1 month in the pcp AAT* 87.5% AAT* 50.0% Modest rental income and earnings from Minto Properties and Moorebank in the period Moorebank 25.2 % Capex reflects ramp up of the development of the Moorebank Logistics Park and construction associated with new leases secured at Minto during FY 17 *Note: One-month contribution from AAT in H1 FY 17 vs six-month contribution in H1 FY 18 due to consolidation from 1 December The underlying information excludes certain non-cash and non-recurring items in order to more accurately reflect the underlying financial performance of Qube. References to underlying information are to non-ifrs financial information prepared in accordance with ASIC Regulatory Guide 230 (Disclosing non-ifrs financial information) issued in December Non-IFRS financial information has not been subject to audit or review. 13
14 Divisional Summary Strategic Assets Division AAT Moorebank Minto Underlying revenue growth to $41.3 million Underlying EBITA growth to $14.7 million Underlying revenue growth to $3.9 million Underlying EBITA reduction to $(1.2) million Total capex of around $61.8 million Underlying revenue reduction to $2.0 million Underlying EBITA reduction to $1.5 million Total capex of around $11.1 million Strong financial performance during the period from high volumes of motor vehicles and mining related vehicles Exited the Webb Dock site in Melbourne in late December 2017 but has recently finalised new arrangements to operate at Appleton Dock for break bulk and oil and gas related activities H1 FY 18 revenue and earnings reflect: o Increased earnings from managing the procurement of contractors for capital works on behalf of MIC o Increased rental income from the existing warehouses o Increased corporate costs to develop and implement the project Temporary revenue and earnings decline whilst construction progresses for the two new leases secured during FY 17 with Ceva and Mazda Full upgrade of the site expected to be completed by Q3 FY 18 Minto expected to be fully leased by start of FY 19 resulting in increased rental income The underlying information excludes certain non-cash and non-recurring items in order to more accurately reflect the underlying financial performance of Qube. References to underlying information are to non-ifrs financial information prepared in accordance with ASIC Regulatory Guide 230 (Disclosing non-ifrs financial information) issued in December Non-IFRS financial information has not been subject to audit or review. 14
 Approval granted on 31 January 2018 o Moorebank Precinct West Stage 2 (lodged October 2016) Approval currently expected by mid 2018 Capex Substantial progress with")
")

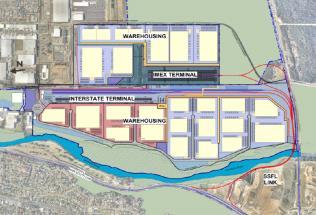
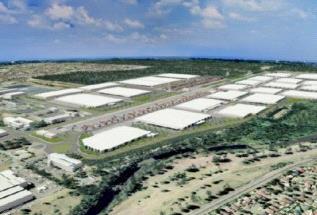
15 Divisional Summary Strategic Assets Division Moorebank Update Approvals Commercial Applications have been lodged with the Department of Planning and Environment regarding: o Moorebank Precinct East Stage 2 (lodged December 2016) Approval granted on 31 January 2018 o Moorebank Precinct West Stage 2 (lodged October 2016) Approval currently expected by mid 2018 Capex Substantial progress with construction and development activities: o Land preparation and construction of the Rail Link (MIC funded) target completion by end of calendar year 2018 and first quarter of calendar year 2019, respectively Agreement for lease signed with Target Australia and detailed warehouse design significantly progressed In February 2018, reached an in-principle agreement (currently being documented) with a key prospective tenant : o Under the terms that have been agreed, Qube will reserve 150,000 m 2 of land at Moorebank for up to 7 years for the future construction of a major warehouse o Counterparty is a major company with operations in Australia and internationally that has significant import volumes o Parties working together on the planning of the operational requirements with the aim of agreeing commercial terms of a binding agreement by 2022 o Agreed fee expected to be payable to Qube from Q3 FY 18 Continued positive engagement with a range of other prospective tenants o IMEX below rail capex - Stage 1 (Qube funded) target completion by end of calendar year On track to commence operations of IMEX Rail Terminal in Q1 calendar 2019 o Precinct Enabling Infrastructure works (Qube funded) ongoing based on timing of warehouse development 15
16 Divisional Summary Associates Patrick (50%) Financial highlights Financial performance Underlying revenue growth of 31.5%* to $286.2 million (on 100% basis) Increase in Qube s share of underlying NPAT pre-amortisation (50%) of 8.5%* to $16.6 million** *Note: Reflecting 6 months contribution compared to 4.5 months in the pcp. **Note: Based on Qube s share of Patrick s underlying NPAT (pre- amortisation) and post tax interest income on shareholder loan. Volumes Very strong market growth (around 7% increase in market lifts in the six months to December 2017) Patrick s volumes in the period exceeded internal expectations as a result of a new service win, organic growth from key customers, subcontracted volumes from other stevedores, empty evacuations and ad-hoc calls Patrick s volumes also reflected the full period impact of the loss of the large A3 contract in October 2016 No contracts lost during the period to 31 December 2017 Solid financial performance in the period reflects: o o o Continued realisation of acquisition case synergies / cost savings Benefit of the infrastructure levy introduced / increased in July to mitigate cost increases Pleasing volumes partly offset by impact of continued competitive pressures on rates despite strong market growth which is essentially a result of continued consolidation of shipping lines and services to Australia Operational update On track with planned productivity improvements and achieving additional acquisition case cost savings Planning for rail terminal automation at Port Botany which will provide significant operational efficiencies Rent reviews and lease extension negotiations at Port of Melbourne well progressed Infrastructure surcharges increased at all ports (effective March 2018) to mitigate continued cost increases and reflecting past investment in landside interface infrastructure The underlying information excludes certain non-cash and non-recurring items in order to more accurately reflect the underlying financial performance of Qube. References to underlying information are to non-ifrs financial information prepared in accordance with ASIC Regulatory Guide 230 (Disclosing non-ifrs financial information) issued in December Non-IFRS financial information has not been subject to audit or review. 16
17 Divisional Summary Other Associates Ports & Bulk division Strategic Assets division NSS (50%) Qube Underlying NPAT $0.8 million Benefitting from improving activity in North Queensland Increased earnings expected in FY 18 compared to the pcp Quattro (39.9%) Qube Underlying NPAT $(1.0) million Unfavourable seasonal conditions resulted in poor grain harvest Minimal grain exports in H1 resulting in decrease in earnings compared to pcp Unchanged market conditions expected in H2 resulting in an expected loss in FY 18 Prixcar (25%) Qube Underlying NPAT $(1.0) million Weak performance of the transport component of the business resulted in Qube further impairing its investment in Prixcar by $6.0 million Continued focus on cost reductions and operational improvements including the recent appointment of a new senior management team (CEO, CFO, CIO) Loss expected in FY 18 due to the turnaround taking longer than anticipated TQ Holdings (50%) Qube Underlying NPAT $(0.1) million Continuing to assess multiple strategic and/or partnering options for development and operation of Port Kembla fuel terminal Minimal earnings contribution from TQ Holdings expected in FY 18 The underlying information excludes certain non-cash and non-recurring items in order to more accurately reflect the underlying financial performance of Qube. References to underlying information are to non-ifrs financial information prepared in accordance with ASIC Regulatory Guide 230 (Disclosing non-ifrs financial information) issued in December Non-IFRS financial information has not been subject to audit or review. 17

18 Key Financial Information 18
19 Key Financial Information Statutory Results H1 FY 18 H1 FY 17 Change From Prior Corresponding Period (%) Revenue % EBITDA (6.3%) EBITA (10.6%) EBIT (13.1%) Net Finance Costs (8.0) (4.5) (77.8%) Share of Profit of Associates 3.0 (22.7) N/A Profit After Tax Attributable to Shareholders (5.4%) Profit After Tax Attributable to Shareholders Pre-Amortisation* (0.6%) Diluted Earnings Per Share (cents)** (20.0%) Diluted Earnings Per Share Pre-Amortisation (cents)** (15.4%) Interim Dividend Per Share (cents) EBITDA Margin 16.1% 18.2% (2.1%) EBITA Margin 9.8% 11.5% (1.7%) *Note: Profit After Tax Attributable to Shareholders Pre-Amortisation includes an adjustment for Qube s proportionate share of Patrick amortisation net of tax. **Note: The H1 FY 17 earnings per share metrics have been restated to include the dilutive impact of the discount element of the entitlement offer. Statutory earnings include the following items which have been excluded from the underlying earnings: Impairment of Qube s equity investment in Prixcar of $6.0 million Fair value gain relating to the Minto investment property of $5.8 million ISO Acquisition earn out payment of $3.8 million Write off of unamortised debt establishment costs on early termination of syndicated debt facility of $3.0 million Other items totalling approximately $1.7 million (net impact before tax) 19
20 Key Financial Information Underlying Results H1 FY 18 H1 FY 17 Change From Prior Corresponding Period (%) Revenue % EBITDA (2.5%) EBITA (4.6%) EBIT (6.7%) Net Finance Costs (5.2) (6.8) 23.5% Share of Profit of Associates (64.7%) Profit After Tax Attributable to Shareholders (13.5%) Profit After Tax Attributable to Shareholders Pre-Amortisation* (9.0%) Diluted Earnings Per Share (cents)** (26.1%) Diluted Earnings Per Share Pre-Amortisation (cents)** (24.0%) Interim Dividend Per Share (cents) EBITDA Margin 16.5% 18.2% (1.7%) EBITA Margin 10.3% 11.6% (1.3%) Solid financial performance from all divisions Prior period included the net Asciano contribution ($22.2 million EBITDA, $15.5 million NPAT) Net Finance Costs comprises interest expense of $18.4 million offset by $13.2 million of interest income (mainly relating to Patrick shareholder loan) Reduced contribution from Associates mainly due to AAT ceasing to be an Associate from 1 December 2016 as well as lower NPAT contributions from most of the other Associates *Note: Profit After Tax Attributable to Shareholders Pre-Amortisation includes an adjustment for Qube s proportionate share of Patrick amortisation net of tax. **Note: The H1 FY 17 earnings per share metrics have been restated to include the dilutive impact of the discount element of the entitlement offer. The underlying information excludes certain non-cash and non-recurring items in order to more accurately reflect the underlying financial performance of Qube. References to underlying information are to non-ifrs financial information prepared in accordance with ASIC Regulatory Guide 230 (Disclosing non-ifrs financial information) issued in December Non-IFRS financial information has not been subject to audit or review. 20
21 Key Financial Information Segment Breakdown H1 FY 18 Logistics Ports & Bulk Strategic Assets Corporate and Other Total H1 FY 17 Change (%) Statutory Revenue % EBITDA (9.6) (6.3%) EBITA (1.6) (9.7) (10.6%) EBIT (3.5) (9.7) (13.1%) Underlying Revenue % EBITDA (9.1) (2.5%) EBITA (9.2) (4.6%) EBIT (9.2) (6.7%) The underlying information excludes certain non-cash and non-recurring items in order to more accurately reflect the underlying financial performance of Qube. References to underlying information are to non-ifrs financial information prepared in accordance with ASIC Regulatory Guide 230 (Disclosing non-ifrs financial information) issued in December Non-IFRS financial information has not been subject to audit or review. 21
22 Key Financial Information Balance Sheet As at 31-Dec Jun-17 Change Cash and equivalents (68.0) Receivables Other current assets (4.1) Total current assets (62.9) Investment in equity accounted investments (14.1) Loans and receivables (15.6) Property, plant and equipment Investment property Intangible assets Other non-current assets Total non-current assets 3, , Total assets 3, , Trade and other payables (21.4) Borrowings Tax payable Derivative financial instruments (0.2) Provisions Total current liabilities (16.5) Trade and other payables (4.2) Borrowings* Deferred tax liabilities (0.9) Other non-current liabilities Total non-current liabilities Total liabilities 1, , Net assets 2, , Net debt* Net debt / (Net debt + Equity) 22.6% 19.0% 3.6% Qube s balance sheet remains strong with net assets of over $2.6 billion diversified geographically and by asset type including infrastructure, property, warehouses, rolling stock, trucks, cranes and containers Continued investment during the period on equipment to support new contracts, the development of Moorebank and Minto and the MCS acquisition Leverage remains well below Qube s long term target range (30-40%), providing substantial capacity to continue to invest in suitable growth opportunities *Note: Borrowings and net debt are net of capitalised establishment costs of $9.5 million at June 2017 and $12.0 million at December
23 $ million Key Financial Information Cashflow Change in Net Debt for Six Months to 31 December Sub Note Senior Debt (net of cash) Net Debt at Jun 2017* (123.9) Operating Cashflow (1.5) Dividends and Distributions Received from Associates Capex (net of disposal of assets) *Note: Net debt including finance lease liabilities but pre-deduction of capitalised establishment costs of $9.5 million at June 2017 and $12.0 million at December **Note: Dividends paid are net of the dividend reinvestment plan Net Interest Paid 16.1 Tax Paid 42.7 Dividends and Distributions Paid** (5.9) Other Sub Note Senior Debt (net of cash) Net Debt at Dec 2017* Businesses continued to generate strong operating cashflow with a cash conversion ratio of around 92% Largest capital expenditure (cash components) included the MCS acquisition completed on 27 December 2017 ($88.2 million) and the capex for the development of the Moorebank Logistics Park ($57.3 million) 23
24 $ million Key Financial Information Funding 1, Debt Maturity Profile at 31 December 2017* FY18 FY19 FY20 FY21 FY22 FY23 FY24 FY25 FY26 FY27 FY28 FY29 FY30 Bank facilities Subordinated Loan Note CEFC facility USPP *Note: Average maturity of around 5.4 years at 31 December Qube completed several funding initiatives in the period increasing Qube s liquidity, extending the average tenor of its debt and diversifying its funding sources These initiatives included the completion of its inaugural USPP Note issuance (US$150 million) and establishment of new 5 year bilateral debt facilities to replace its previous syndicated and bilateral debt facilities As at 31 December 2017, Qube had available, undrawn debt facilities of approximately $749 million to fund its growth Qube will continue to maintain a prudent capital structure consistent with its stated long term target leverage ratio of 30%-40% 24

25 Outlook Expect similar economic and operating environment for the remainder of FY 18 with stable volumes in most areas of the business Limited ability to secure rate increases due to competitive environment Continued cost focus and leveraging scale and past investment to deliver a superior customer service and maximise margins Qube will continue to invest capital and focus management resources in developing its strategic assets. In the shorter term, while Qube is undertaking the investment, its earnings will not reflect the substantial value that is being created Qube is continuing to trade in line with management expectations and currently expects to deliver an increase in underlying NPAT (preamortisation) in FY 18 25

26 Questions 26
27 Additional Financial Information (Appendices) 27
28 Appendix 1 Reconciliation of H1 FY 18 Statutory Results to Underlying Results H1 FY 18 Logistics Ports & Bulk Strategic Assets Corporate and Other Patrick Consolidated Statutory net profit / (loss) before income tax (4.7) (30.0) Share of (profit) / loss of equity accounted investments (4.3) (3.0) Finance cost (0.2) (12.5) 8.0 Depreciation and amortisation Statutory EBITDA (9.6) Impairment of investment in associate Fair value gain on investment property - - (5.8) - - (5.8) Intercompany trading - (22.4) Other adjustments (net) Underlying EBITDA (9.1) Depreciation (14.4) (32.7) (3.3) (0.1) - (50.5) Underlying EBITA (9.2) Amortisation (1.4) (2.8) (1.9) - - (6.1) Underlying EBIT (9.2) Underlying net Interest income/(expense) 0.2 (0.3) (0.1) (17.5) 12.5 (5.2) Underlying share of profit/(loss) of equity accounted investments - (0.2) (1.1) Underlying net profit / (loss) before income tax (26.7) The underlying information excludes certain non-cash and non-recurring items in order to more accurately reflect the underlying financial performance of Qube. References to underlying information are to non-ifrs financial information prepared in accordance with ASIC Regulatory Guide 230 (Disclosing non-ifrs financial information) issued in December Non-IFRS financial information has not been subject to audit or review. 28
29 Appendix 2 Reconciliation of H1 FY 17 Statutory Results to Underlying Results H1 FY 17 Logistics Ports & Bulk Strategic Assets Corporate and Other Patrick Consolidated Statutory net profit / (loss) before income tax (0.2) (0.5) (15.5) 55.4 Share of (profit) / loss of equity accounted investments - (2.3) (0.1) Finance (income) / cost (0.2) 0.7 (0.1) 13.7 (9.6) 4.5 Depreciation and amortisation Statutory EBITDA Stamp duty Restructure costs Other - (2.8) Underlying EBITDA Depreciation (16.3) (32.9) (0.7) (0.1) - (50.0) Underlying EBITA Amortisation (1.4) (2.9) (0.2) - - (4.5) Underlying EBIT Underlying net Interest income/(expense) 0.2 (0.7) 0.1 (16.0) 9.6 (6.8) Underlying share of profit/(loss) of equity accounted investments (25.1) (22.7) Underlying adjustments: Stamp duty One-off transition costs Other non recurring restructure costs Underlying share of profit / (loss) of equity accounted investments Underlying net profit / (loss) before income tax (2.8) The underlying information excludes certain non-cash and non-recurring items in order to more accurately reflect the underlying financial performance of Qube. References to underlying information are to non-ifrs financial information prepared in accordance with ASIC Regulatory Guide 230 (Disclosing non-ifrs financial information) issued in December Non-IFRS financial information has not been subject to audit or review. 29
30 Appendix 3 Logistics Division Underlying Results H1 FY 18 Underlying H1 FY 17 Underlying Change From Prior Corresponding Period (%) Revenue % EBITDA (4.9%) Depreciation (14.4) (16.3) 11.7% EBITA (1.9%) Amortisation (1.4) (1.4) - EBIT (2.0%) Share of Profit of Associates - - N/A EBITDA Margin (%) 13.8% 16.1% (2.3%) EBITA Margin (%) 9.9% 11.2% (1.3%) The underlying information excludes certain non-cash and non-recurring items in order to more accurately reflect the underlying financial performance of Qube. References to underlying information are to non-ifrs financial information prepared in accordance with ASIC Regulatory Guide 230 (Disclosing non-ifrs financial information) issued in December Non-IFRS financial information has not been subject to audit or review. 30
31 Appendix 4 Ports & Bulk Division Underlying Results H1 FY 18 Underlying H1 FY 17 Underlying Change From Prior Corresponding Period (%) Revenue % EBITDA % Depreciation (32.7) (32.9) 0.6% EBITA % Amortisation (2.8) (2.9) 3.4% EBIT % Share of Profit of Associates (0.2) 2.3 N/A EBITDA Margin (%) 18.7% 18.7% - EBITA Margin (%) 10.5% 9.6% 0.9% The underlying information excludes certain non-cash and non-recurring items in order to more accurately reflect the underlying financial performance of Qube. References to underlying information are to non-ifrs financial information prepared in accordance with ASIC Regulatory Guide 230 (Disclosing non-ifrs financial information) issued in December Non-IFRS financial information has not been subject to audit or review. 31
32 Appendix 5 Strategic Assets Division Underlying Results H1 FY 18 Underlying H1 FY 17 Underlying Change From Prior Corresponding Period (%) Revenue % EBITDA % Depreciation (3.3) (0.7) (371.4%) EBITA % Amortisation (1.9) (0.2) (850.0%) EBIT % Share of Profit of Associates (1.1) 0.1 N/A EBITDA Margin (%) 38.8% 30.8% 8.0% EBITA Margin (%) 31.8% 24.8% 7.0% The underlying information excludes certain non-cash and non-recurring items in order to more accurately reflect the underlying financial performance of Qube. References to underlying information are to non-ifrs financial information prepared in accordance with ASIC Regulatory Guide 230 (Disclosing non-ifrs financial information) issued in December Non-IFRS financial information has not been subject to audit or review. 32
33 Appendix 6 Patrick Underlying Results H1 FY 18 Underlying (6 months) H1 - FY 17* Underlying (4.5 months) Change From Prior Corresponding Period (%) 100% Revenue % EBITDA % Depreciation (36.4) (26.5) (37.4%) EBITA % Amortisation (10.2) (7.1) (43.7%) EBIT % Interest Expense (Net) - External (17.1) (12.9) (32.6%) Interest Expense Shareholders (24.9) (19.4) (28.4%) NPAT (29.5%) NPAT (pre-amortisation) (8.2%) *Note: Underlying results for the 4.5-month period from 18 August 2016 to 31 December EBITDA Margin (%) 35.2% 38.3% (3.1%) EBITA Margin (%) 22.5% 26.1% (3.6%) EBIT Margin (%) 18.9% 22.8% (3.9%) Qube (50%) Qube share of NPAT (29.5%) Qube share of NPAT (pre-amortisation) (8.1%) Qube interest income net of tax from Patrick % Total Qube share of NPAT from Patrick % Total Qube share of NPAT (pre-amortisation) from Patrick % The underlying information excludes certain non-cash and non-recurring items in order to more accurately reflect the underlying financial performance of Qube. References to underlying information are to non-ifrs financial information prepared in accordance with ASIC Regulatory Guide 230 (Disclosing non-ifrs financial information) issued in December Non-IFRS financial information has not been subject to audit or review. 33
34 Appendix 7 Other Associates Underlying Results Qube Share of Profit of Associates H1 FY 18 Underlying H1 FY 17 Underlying Change From Prior Corresponding Period (%) *Note: Five month contribution from AAT in H1 FY 17. AAT has been consolidated in Strategic Assets results from 1 December AAT* N/A NSS % PEL - (1.3) N/A Prixcar (1.0) (0.3) (233.3%) Total Ports & Bulk Division (0.2) 2.3 N/A Quattro (1.0) 0.1 N/A TQ Holdings (0.1) - N/A Total Strategic Assets Division (1.1) 0.1 N/A Total (1.3) 2.4 N/A The underlying information excludes certain non-cash and non-recurring items in order to more accurately reflect the underlying financial performance of Qube. References to underlying information are to non-ifrs financial information prepared in accordance with ASIC Regulatory Guide 230 (Disclosing non-ifrs financial information) issued in December Non-IFRS financial information has not been subject to audit or review. 34
35 Appendix 8 Corporate Underlying Results H1 FY 18 Underlying H1 - FY 17* Underlying Change From Prior Corresponding Period (%) *Note: H1 FY 17 results reflect the impact of Asciano special dividend paid to Qube (excluding value of franking credits on special dividend) and the loss on sale of Qube s Asciano shares. Revenue N/A EBITDA (9.1) 13.3 N/A Depreciation (0.1) (0.1) N/A EBITA (9.2) 13.2 N/A Amortisation - - N/A EBIT (9.2) 13.2 N/A The underlying information excludes certain non-cash and non-recurring items in order to more accurately reflect the underlying financial performance of Qube. References to underlying information are to non-ifrs financial information prepared in accordance with ASIC Regulatory Guide 230 (Disclosing non-ifrs financial information) issued in December Non-IFRS financial information has not been subject to audit or review. 35
36 Appendix 9 Explanation of Underlying Information Underlying revenues and expenses are statutory revenues and expenses adjusted to exclude certain non-cash and non-recurring items such as fair value adjustments on investment properties, cost of legacy incentive schemes and impairments to reflect core earnings. Income tax expense is based on a prima-facie 30% tax charge on profit before tax and associates References to underlying information are to non-ifrs financial information prepared in accordance with ASIC Regulatory Guide 230 (Disclosing non-ifrs financial information) issued in December Non-IFRS financial information has not been subject to audit or review 36
Qube delivers another solid financial performance Further progress on Moorebank Project with strong tenant interest
 22 February 2018 ASX and Media Announcement Qube delivers another solid financial performance Further progress on Moorebank Project with strong tenant interest Underlying NPAT of $53.7 million ($61.6 million
Qube Holdings Limited Investor Presentation FY 15 Full Year Results
 Qube Holdings Limited Investor Presentation FY 15 Full Year Results Disclaimer Important Notice ABN 141 497 230 53 The information contained in this Presentation or subsequently provided to the recipient
Qube delivers revenue and earnings growth while completing strategic acquisitions for the future
 23 August 2017 ASX Announcement Qube delivers revenue and earnings growth while completing strategic acquisitions for the future Both operating divisions up and Moorebank on track with Target Australia
For personal use only
 23 August 2013 Full Year Results June 2013 We attach an Investor Presentation for the FY13 Full Year Results. As previously announced, a results briefing for analysts will be held at 10:30am Sydney time
Qube Holdings Limited Investor Presentation FY 16 Interim Results
 Qube Holdings Limited Investor Presentation FY 16 Interim Results 1 Disclaimer Important Notice ABN 141 497 230 53 The information contained in this Presentation or subsequently provided to the recipient
Qube Holdings Limited Investor Presentation FY 16 Full Year Results
 Qube Holdings Limited Investor Presentation FY 16 Full Year Results 1 Disclaimer Important Notice ABN 141 497 230 53 The information contained in this Presentation or subsequently provided to the recipient
For personal use only
 QUBE HOLDINGS LIMITED 2014 ANNUAL GENERAL MEETING CHAIRMAN S SPEECH Good morning ladies and gentlemen. Welcome to this annual general meeting of shareholders of Qube Holdings Limited. My name is Chris
Results for Announcement to the Market FY19 Half Year Report
 21 February 2019 Results for Announcement to the Market FY19 Half Year Report We attach the following for the half year ended : FY19 Half Year Report (Appendix 4D) Interim Financial Report For further
Transpacific FY15 Half Year Results Presentation
 Transpacific FY15 Half Year Results Presentation Robert Boucher CEO Brendan Gill CFO 20 February 2015 - Disclaimer Forward looking statements - This presentation contains certain forward-looking statements,
25 February The Manager Market Announcements Australian Securities Exchange Limited 20 Bridge Street SYDNEY NSW 2000.
 Level 1 157 Grenfell Street Adelaide SA 5000 GPO Box 2155 Adelaide SA 5001 Adelaide Brighton Ltd ACN 007 596 018 Telephone (08) 8223 8000 International +618 8223 8000 Facsimile (08) 8215 0030 www.adbri.com.au
2011 Interim Results. Keith Gordon, Managing Director & Chief Executive Officer Stephen Gobby, Chief Financial Officer
 2011 Interim Results Keith Gordon, Managing Director & Chief Executive Officer Stephen Gobby, Chief Financial Officer Emeco 2011 Interim Results Overview Financials Strategy & Outlook Questions Appendices
Downer Half Year Results 21 February 2018 INVESTOR PRESENTATION
 Downer Half Year Results 21 February 218 INVESTOR PRESENTATION OVERVIEW Total revenue 1 $6.1 billion, up 69.3% (up 2.6% on a pro forma basis) Underlying Earnings Before Interest, Tax and Amortisation of
Credit Suisse Annual Asian Investment Conference
 Adelaide Brighton Limited Credit Suisse Annual Asian Investment Conference Hong Kong, 27 30 March 2017 Martin Brydon Chief Executive Officer and Managing Director Adelaide Brighton Limited Overview of
FY17 RESULTS. Tuesday 20 February 2018
 FY17 RESULTS Tuesday 20 February 2018 Agenda 2017 Highlights Results 2018 Observations Out-of-Home industry APN Outdoor Contract renewals Focus and objectives Trading update 2 2017 Highlights 3 2017 highlights
A S X A N N O U N C E M E N T
 A S X A N N O U N C E M E N T DATE: 24 February 2016 Attached is the Presentation regarding Pact s Half year Financial Results for the half year ended 31 December 2015. The Presentation will occur at 10am
For personal use only
 HY14 Results 15 May 2014 Disclaimer This presentation includes both information that is historical in character and information that consists of forward looking statements. Forward looking statements are
Business Update. USPP Conference Miami. Luis Damasceno Group CFO Michael Williams Group Finance Director & Treasurer January 2019
 Business Update USPP Conference Miami Luis Damasceno Group CFO Michael Williams Group Finance Director & Treasurer 23-25 January 2019 www.alsglobal.com IMPORTANT NOTICE AND DISCLAIMER This presentation
For personal use only. FY2017 H1 Results February 2017
 For personal use only FY2017 H1 Results February 2017 The half year in review Broader automotive market supported by record new vehicle sales in Australia and New Zealand Strong Automotive earnings growth
2017 FULL YEAR RESULTS
 2017 FULL YEAR RESULTS ESTABLISHING LEADING POSITIONS IN NEW GROWTH SECTORS Malcolm Bundey Managing Director and CEO Richard Betts Chief Financial Officer 16 August 2017 Pact Group Holdings Ltd ABN: 55
Photo by James Ball - Coffey International Limited FY2013 Half Year Results Presentation. 11 February 2013
 Photo by James Ball - www.dlscape.com Coffey International Limited FY2013 Half Year Results Presentation 11 February 2013 Agenda Financial Performance Business Performance Outlook Presenters John Douglas
OVERVIEW. Operating cash flow $447.8 million, EBITDA conversion 92.8% Total revenue 1 $7,394 million, down 0.5%
 OVERVIEW Total revenue 1 $7,394 million, down 0.5% Earnings Before Interest and Tax (EBIT) $276.9 million, down 10.6%. Down 1.5% adjusting for $13 million Capital Metro bid costs and $15 million reduction
For personal use only
 FY18 Half Year Results For the six months ended 31 December 2017 21 February 2018 Disclaimer Forward looking statements This presentation contains certain forward-looking statements, including with respect
Cleanaway Waste Management Limited
 Cleanaway Waste Management Limited Australia s leading total waste management services company FY16 Results Presentation For the twelve months ended 30 June 2016 19 August 2016 Vik Bansal CEO and Managing
Boom Logistics Limited. Half Year Results Presentation. 25 February Boom Logistics Limited. Half Year Results Presentation.
 Boom Logistics Limited Half Year Results Presentation 25 February 2011 Boom Logistics Limited Half Year Results Presentation 25 February 2011 Summary $5.1m trading NPAT for 1H11, up $4.6m from prior corresponding
Half Year Results. For the 6 Months to 31 December Managing Director & CEO: Dr Paul Dalgleish. Chief Financial Officer: Mr Andrew Phipps
 Half Year Results For the 6 Months to 31 December 2013 Managing Director & CEO: Dr Paul Dalgleish Chief Financial Officer: Mr Andrew Phipps 18 February 2014 1 Delivering Returns To Shareholders Revenue
Interim Results Presentation. For the six months ended 31 December 2018
 Interim Results Presentation For the six months ended 31 December 2018 1 STEEL & TUBE IS One of New Zealand s leading providers of steel solutions, and a proud New Zealand company, with over 65 years of
HALF YEAR RESULTS 27 FEBRUARY 2017
 HALF YEAR RESULTS 27 FEBRUARY 2017 Important Notice and Disclaimer DISCLAIMER AS TO FORWARD LOOKING STATEMENTS This presentation contains forward looking statements, including statements of current intention,
 ASX ANNOUNCEMENT DATE: 22 February 2017 Attached is the Presentation regarding Pact s Half year Financial Results for the half year ended 31 December 2016. The Presentation will occur at 10am (Melbourne
Adelaide Brighton Ltd ACN
 Level 1 157 Grenfell Street Adelaide SA 5000 GPO Box 2155 Adelaide SA 5001 Adelaide Brighton Ltd ACN 007 596 018 Telephone (08) 8223 8000 International +618 8223 8000 Facsimile (08) 8215 0030 www.adbri.com.au
Fourth Quarter 2017 Earnings Call
 Fourth Quarter 2017 Earnings Call February 8, 2018 1 Forward-Looking Statements This presentation contains forward-looking statements regarding future events and the future performance of that involve
13 APRIL WestConnex M4 East, New South Wales. Refer to ASX/Media Release for further information
 ANALYST AND INVESTOR PRESENTATION 1Q17 RESULTS Marcelino Fernández Verdes, Executive Chairman Adolfo Valderas, Chief Executive Officer Angel Muriel, Chief Financial Officer WestConnex M4 East, New South
2015 Annual General Meeting. October2015
 2015 Annual General Meeting October2015 FY15 Results Significant restructuring and capital management to support profit recovery in FY16. Statutory EBIT loss of $33.2m Statutory NPAT loss of $36.9m Trading
Bradken Limited 2014 Half Year Results
 Presenters BRIAN HODGES Managing Director STEVE PERRY Chief Financial Officer Bradken Limited 2014 Half Year Results Tuesday, 11 th February 2014 2014 Half Year Results 1. Key Outcomes Brian Hodges 2.
For personal use only
 Annual General Meeting Managing Director Presentation Jamie Pherous 31 October 2011 Disclaimer While every care has been taken in the preparation of this presentation, Corporate Travel Management (CTM)
For personal use only
 11 May 2017 The Manager Company Announcements Office ASX Limited 20 Bridge Street SYDNEY NSW 2000 GRAINCORP LIMITED: GNC INVESTOR PRESENTATION FINANCIAL HALF YEAR ENDED 31 MARCH 2017 Please find attached
For personal use only
 DWS Limited 2018 Full Year Results Presentation Contents Introduction Danny Wallis (CEO) / Stuart Whipp (CFO) Results Highlights Full Year Results Capital Management Operations Update Summary and Outlook
STEEL & TUBE HOLDINGS LIMITED. HY18 Interim Results Presentation. For the Six Months to 31 December February 2018
 STEEL & TUBE HOLDINGS LIMITED HY18 Interim Results Presentation For the Six Months to 31 December 2017 23 February 2018 BECOMING A MODERN AND INNOVATIVE COMPANY Providing Strength to New Zealand Steel
The attached Revised FY2018 Results Presentation corrects this error.
 29 November 2018 Company Announcements Office Australian Securities Exchange Limited Exchange Centre 20 Bridge Street Sydney NSW 2000 Aristocrat Leisure Limited Formatting Error Revised FY2018 Results
AUB GROUP LTD FULL YEAR RESULTS
 AUB GROUP LTD FULL YEAR RESULTS FOR THE PERIOD ENDED 30 JUNE 207 (FY7) 28 TH AUGUST 207 Page - AUB Group Ltd FY7 Results NOTICE SUMMARY INFORMATION This document has been prepared by AUB Group Limited
FY16 Financial Results Investor Presentation. August 2016
 FY16 Financial Results Investor Presentation August 2016 FY16 Results Summary Improvement on FY15 across all key earnings metrics EPS growth and improved shareholder returns Revenue EBITDA PBT EPS Dividend
Sigma Pharmaceuticals Limited
 Investor Relations Contact: Gary Woodford Corporate Affairs Manager Gary.Woodford@signet.com.au Phone: 03 9215 9632 Mobile: 0417 399 204 Mark Hooper CEO and Managing Director Gary Woodford Corporate Affairs
For personal use only
 DWS Limited 2016 Half Year Results Presentation Contents Introduction Danny Wallis (CEO) / Stuart Whipp (CFO) Results Highlights Half Year Results Capital Management Operations Update DWS Growth Strategy
16.1c c c
 1 2016 Interim Result Highlights Successful delivery, ahead of PDS 2 Exceeded revised earnings guidance Six months to 31 Dec 15 Solid capital management 7.97c 7.65c $2.15 28.3% Earnings per unit Distribution
Full Year Results Presentation 22 August 2011
 Full Year Results Presentation 22 August 2011 Summary $5.4m trading NPAT profit, a 32% increase on FY10 trading NPAT of $4.1m. $37.7m reported NPAT loss for FY11, including $39.1m one-off impairments and
For personal use only. Transfield Services Limited
 Transfield Services Limited Half Year Results 26 February 2015 Disclaimer and Important Information 2 This presentation is for information purposes only and is a summary only. It should be read in conjunction
FIRST HALF FINANCIAL YEAR 2018 RESULTS PRESENTATION
 FIRST HALF FINANCIAL YEAR 2018 RESULTS PRESENTATION 15 February 2018 Steve Gostlow, Managing Director 2 Our corporate ideals are based on safety, reliability and sustainability. 1H18 - Highlights Safety
Genex Power (GNX) COMPANY REPORT. NAIF lined up for Stage 2
 COMPANY REPORT. NAIF lined up for Stage 2") 21 June 2018 INTERNAL ONLY RECOMMENDATIONS Rating BUY Risk Speculative Price Target $0.37 Share Price $0.31 SNAPSHOT Monthly Turnover $2.5mn Market Cap $91mn Shares Issued 303.9mn 52-Week High $0.43 52-Week
21 June 2018 INTERNAL ONLY RECOMMENDATIONS Rating BUY Risk Speculative Price Target $0.37 Share Price $0.31 SNAPSHOT Monthly Turnover $2.5mn Market Cap $91mn Shares Issued 303.9mn 52-Week High $0.43 52-Week
Full Year Results to 31 January 2018 Announced 22 March 2018
 Sigma Healthcare Limited Full Year Results to 31 January 2018 Announced 22 March 2018 ASX Ticker: SIG Important Notice The material provided is a presentation of general information about Sigma s activities
FULL YEAR RESULTS PRESENTATION
 ASX Announcement 26 August 2016 FULL YEAR RESULTS PRESENTATION Attached is the presentation regarding the financial results of The Star Entertainment Group Limited (The Star Entertainment Group) for the
For personal use only
 Mantra Group H1FY2015 Results Presentation 26 February 2015 Important notice and disclaimer Important notice and disclaimer This document is a presentation of general background information about the activities
1H18 Results Presentation Sid Takla Interim Chief Executive Officer Lyndal York Chief Financial Officer
 1H18 Results Presentation Sid Takla Interim Chief Executive Officer Lyndal York Chief Financial Officer 21 August 2018 Important Notice and Disclaimer This presentation has been prepared by Asaleo Care
Boom Logistics Limited Investor Meetings
 25/06/18 ASX code: BOL Boom Logistics Limited Investor Meetings Boom Logistics Limited (ASX:BOL) will meet with investors in Melbourne on 26 June 2018 and Sydney on 28, 29 June 2018. A copy of the meeting
HALF YEAR RESULTS PRESENTATION
 ASX Announcement 16 February 2016 HALF YEAR RESULTS PRESENTATION Attached is the presentation regarding the financial results of The Star Entertainment Group Limited (The Star Entertainment Group) for
For personal use only. FY2014 Half Year Results Presentation Period Ended 31 December 2013
 FY2014 Half Year Results Presentation Period Ended 31 December 2013 Company Overview Australia s largest automotive retailer by sales, profitability, market capitalisation and workforce 152 franchises
For personal use only
 18 OCTOBER 2016 3Q CASH FLOW FROM OPERATING ACTIVITIES UP 7.3% YOY TO $533M, AN EBITDA CONVERSION RATE OF 192% IN LAST 12 MONTHS (LTM), WHICH ADJUSTS FOR SEASONALITY, EBITDA CONVERSION RATE OF 107% 9M16
For personal use only. JB Hi-Fi Limited. HY17 Results Presentation
 JB Hi-Fi Limited HY7 Results Presentation 3 5 FEBRUARY AUGUST 06 07 PAGE Agenda. Group Performance Overview. JB HI-FI 3. The Good Guys 4. Stores 5. Group Balance Sheet and Cash Flow 6. Outlook Richard
Cameron Judson, CEO Glynn Wright, CFO. McGrath Limited (ASX: MEA) Results for the 6 months ended 31 December February 2018
 Results for the 6 months ended 31 December February 2018") Cameron Judson, CEO Glynn Wright, CFO McGrath Limited (ASX: MEA) Results for the 6 months ended 31 December 2017 15 February 2018 1H18 A SNAPSHOT REVENUE DOWN 23% TO $51.6M GOODWILL IMPAIRMENT ($21.8)
Cameron Judson, CEO Glynn Wright, CFO McGrath Limited (ASX: MEA) Results for the 6 months ended 31 December 2017 15 February 2018 1H18 A SNAPSHOT REVENUE DOWN 23% TO $51.6M GOODWILL IMPAIRMENT ($21.8)
FY18 1 ST HALF RESULTS
 26 FEBRUARY 2018 FY18 1 ST HALF RESULTS Chief Executive Officer : Chief Financial Officer : John Croll James Orlando isentia.com AGENDA Overview of H1 FY18 Results Strategic Focus H1 FY18 Financial Performance
Prime Financial Group Ltd (ASX: PFG) Half Year 2018 Results Presentation. 28 February 2018
 Half Year 2018 Results Presentation. 28 February 2018") Prime Financial Group Ltd (ASX: PFG) Half Year 2018 Results Presentation 28 February 2018 2 Overview H1 2018 Key Highlights 1. Strong revenue growth revenue increased 25% compared to H1 2017 driven by
Prime Financial Group Ltd (ASX: PFG) Half Year 2018 Results Presentation 28 February 2018 2 Overview H1 2018 Key Highlights 1. Strong revenue growth revenue increased 25% compared to H1 2017 driven by
Inghams Group Limited. FY2018 Results Presentation
 Inghams Group Limited FY2018 Results Presentation 22 AUGUST 2018 Important notice and disclaimer Disclaimer The material in this presentation is general background information about the activities of Inghams
FY17 Results Presentation. Chris Sutherland, Managing Director 24 May 2017
 FY17 Results Presentation Chris Sutherland, Managing Director 24 May 2017 Important notice and disclaimer The information contained in this presentation is for information purposes only and does not constitute
FY2015 Annual Results August Brett McKeon - CEO David Bailey - CFO
 FY2015 Annual Results August 27 2015 Brett McKeon - CEO David Bailey - CFO FY2015 Financial Results Highlights Delivery on FY15 Prospectus forecasts Pro forma NPAT $19.3 million up 8.4% against IPO forecast
Regional Express Holdings Ltd REX
 20 February 2006 REX $1.15 Analyst Ken Fleming (613) 6224 8511 ken.fleming@tricom.com.au Max Wheeler (613) 6224 9899 Fully diluted shares on issue 115.0M Market cap A$132.3M Performance & Valuation Last
PMP LIMITED INVESTOR PRESENTATION. Results for the 12 months ended 30 June August Peter George, CEO Geoff Stephenson, CFO
 PMP LIMITED ABN 39 050 148 644 Results for the 12 months ended 30 June 2017 28 August 2017 Peter George, CEO Geoff Stephenson, CFO INVESTOR PRESENTATION 2017 FULL YEAR RESULTS Contents Pages Delivering
For personal use only
 Financial Results Half year ended 31 December 2016 15 February 2017 Agenda Results Overview Galdino Claro, Group CEO Financial Results Fred Knechtel, Group CFO Strategic Progress & Outlook Galdino Claro,
For personal use only
 Appendix 4D Results for announcement to the market (ACN 104 113 760) This half-year report is provided to the Australian Securities Exchange (ASX) under ASX listing Rule 4.2A.3. Current reporting period:
Big River Industries Limited (ASX:BRI)
") Big River Industries Limited (ASX:BRI) FY2018 Half Year Results Briefing 27 February 2018 Optus Stadium - Perth H1 FY2018 - Contents 1. Highlights 2. Business Diversity Strengthening 3. Sales Highlights
Big River Industries Limited (ASX:BRI) FY2018 Half Year Results Briefing 27 February 2018 Optus Stadium - Perth H1 FY2018 - Contents 1. Highlights 2. Business Diversity Strengthening 3. Sales Highlights
17 April Genex Power s Kidston Solar Farm, Queensland, UGL. Refer to ASX/Media Release for further information
 ANALYST AND INVESTOR PRESENTATION 1Q RESULTS 2018 Marcelino Fernández Verdes, Executive Chairman Michael Wright, Chief Executive Officer Stefan Camphausen, Chief Financial Officer Genex Power s Kidston
30 June 2015 Full Year Results Presentation August 2015
 30 June 2015 Full Year Results Presentation August 2015 FY15 Results Significant restructuring and capital management to support profit recovery in FY16. Statutory EBIT loss of $33.2m Statutory NPAT loss
$128 Million Equity Raising. May 2007
 $128 Million Equity Raising May 2007 Disclaimer Any reproduction or distribution of this Presentation, in whole or in part, or any disclosure of its contents, or use of any information contained in this
2017 Half-Year Results
 2017 Half-Year Results Martin Earp, CEO Josée Lemoine, CFO 16 August 2017 Financials Pillars of Growth Summary of Performance H1 2017 Sales Revenue $218.2m 1.7% Demographics Deaths 1 2.8% Australia $44.1m
25 th Annual General Meeting
 25 th Annual General Meeting 27 th October 2017 Page 1 Managing Director s Address Page 2 Workplace Health and Safety Total Injury Frequency Rate (TIFR) Continued focus on providing safe workplace for
Annual General Meeting FY February 2019
 Annual General Meeting FY18 20 February 2019 Disclaimer This presentation includes both information that is historical in character and information that consists of forward looking statements. Forward
Q3 FY2010 Financial Highlights
 Disclaimer The information in this document has not been independently verified and no representation or warranty, express or implied, is made as to, and no reliance should be placed on, the fairness,
Macquarie Securities Western Australia Forum. 15 October 2014
 Macquarie Securities Western Australia Forum 15 October 2014 Disclaimer Summary information This presentation contains summary information of TOX Solutions Limited ( TOX ) and is dated 15 October 2014.
FY18 FULL YEAR RESULTS REVENUE UP 18%, NPAT UP 43%, FREE CASH FLOW UP 87% FINAL DIVIDEND UP 27%
 FY18 FULL YEAR RESULTS REVENUE UP 18%, NPAT UP 43%, FREE CASH FLOW UP 87% FINAL DIVIDEND UP 27% All operating divisions organically increased revenue and earnings Strong cash flow and cash conversion Acquisition
Work in hand 4 increased to $42.0 billion
 Highlights Underlying NPATA up 58.9% to $296.5m Up 6.7% on a pro forma basis 1 Guidance met for seventh consecutive year Revenue 2 up 61.5% to $12.6bn (up 16.7% on a pro forma basis) Final dividend increased
National Tyre & Wheel Limited Appendix 4D Half-year report for the period ended 31 December 2017
 National Tyre & Wheel Limited Appendix 4D Half-year report for the period ended 31 December 2017 1. Company details Name of entity: National Tyre & Wheel Limited and its controlled entities ABN: 97 095
For personal use only
 22 August 2018 Company Announcements Office Australian Securities Exchange Limited 20 Bridge Street SYDNEY NSW 2000 By electronic lodgment Total Pages: 6 (including covering letter) Dear Sir / Madam APPENDIX
Shine Corporate Ltd 2018 Full Year Results
 Shine Corporate Ltd 2018 Full Year Results Results Presentation August 2018 Simon Morrison MANAGING DIRECTOR Ravin Raj CHIEF FINANCIAL OFFICER Disclaimer This presentation contains certain forward-looking
For personal use only ACQUISITION OF BEST TRACTOR PARTS INVESTOR PRESENTATION
 ACQUISITION OF BEST TRACTOR PARTS INVESTOR PRESENTATION 27 August 2012 CLICK TO EDIT MASTER TITLE 2 2 2 IMPORTANT NOTICE AND DISCLAIMER This presentation and these materials (together the Presentation
Half Year Results Presentation March 2011 Tony Caruso CEO & Managing Director Chris Kneipp Financial Controller
 Mastermyne Group Limited FY2011 Half Year Results Presentation March 2011 Tony Caruso CEO & Managing Director Chris Kneipp Financial Controller Disclaimer The following disclaimer applies to this presentation
Appendix 4D. Half Year Report to the Australian Stock Exchange
 Appendix 4D to the Australian Stock Exchange Name of Entity Boom Logistics Limited ABN 28 095 466 961 Half Year Ended 31 December 2014 Previous Corresponding Reporting Period 31 December 2013 Results for
Appendix 4D. Half Year Report Half year ended 31 December (previous period) December December 2016
 December December 2016") Rubicor Group Limited Half Year Report Half Year Ended 31 December 2017 Appendix 4D Half Year Report Half year ended 31 December 2017 Name of entity Rubicor Group Limited ABN Half year ended (current period)
Rubicor Group Limited Half Year Report Half Year Ended 31 December 2017 Appendix 4D Half Year Report Half year ended 31 December 2017 Name of entity Rubicor Group Limited ABN Half year ended (current period)
Full Year Results Presentation 30 June 2007
 Full Year Results Presentation 30 June 2007 FY2007 Summary Performance Dividend Acquisitions Safety Revenue - $350.0m increase of 38% EBITDA - $ 96.2m increase of 26% NPAT - $ 36.6m increase of 11% NPAT
INVESTOR PRESENTATION SG FLEET GROUP LIMITED - FY2016 RESULTS
 INVESTOR PRESENTATION SG FLEET GROUP LIMITED - FY2016 RESULTS 16 August 2016 Important Notice and Disclaimer IMPORTANT INFORMATION The information in this presentation is general in nature and does not
Helping you move the Earth TM. 1H07 Results Presentation. 22 February 2007
 Helping you move the Earth TM 1H07 Results Presentation 22 February 2007 1H07 Results Analyst Presentation V2 05060D937-803573d1 Disclaimer and Important notice This presentation may contain forward looking
For personal use only. JB Hi-Fi Limited. HY18 Results Presentation
 JB Hi-Fi Limited HY8 Results Presentation 5 FEBRUARY AUGUST 06 08 PAGE Agenda. Group Performance Overview. JB HI-FI 3. The Good Guys 4. Group Balance Sheet and Cash Flow 5. Outlook Richard Murray Group
For personal use only. NRW HOLDINGS Macquarie Western Australia Forum 2018
 NRW HOLDINGS Macquarie Western Australia Forum 2018 1 RESULTS OVERVIEW Revenue: $754.3M (1) double the same period last year. EBITDA (2): $93.5M compared to $58.9M in the prior comparative period. Net
2014 Half Year Results. 18 February 2014 TOGETHER WE DELIVER.
 2014 Half Year Results 18 February 2014 TOGETHER WE DELIVER. Company Profile Monadelphous Group Limited (ASX:MND) is a S&P/ASX 100 company that provides construction, maintenance and industrial services
RESULTS PRESENTATION. Half year ended 30 September 2018
 RESULTS PRESENTATION Half year ended 30 September 2018 Agenda Details 1. Overview Rob Sindel, Managing Director, CSR Limited 2. Financial Results David Fallu, Chief Financial Officer, CSR Limited 3. Business
HALF YEAR RESULTS FEBRUARY 2018
 23 FEBRUARY 2018 HALF YEAR RESULTS FEBRUARY 2018 Macmahon Holdings Pty Ltd 1 OVERVIEW Positive 1H financial performance 1H17 revenue from operations of $270.0 million - up from $168.3 million in the pcp
It is pleasing that the performance of our dealerships in New Zealand and the eastern states of Australia was strong, he said.
 Automotive Holdings Group Limited 21 Old Aberdeen Place West Perth WA 6005 www.ahgir.com.au ABN 35 111 470 038 ASX / MEDIA STATEMENT 25 August 2017 AHG FULL YEAR RESULTS Record Group revenue of $6.08 billion
2017 Full Year Results Presentation
 2017 Full Year Results Presentation Australia's leading supplier of aluminium products and solutions 5 plants; 8 extrusion presses 18 distribution centres Australia-wide Annual extrusion capacity 70k tonnes
KAPLAN FUNDS MANAGEMENT PTY LIMITED (ABN )
") KAPLAN FUNDS MANAGEMENT PTY LIMITED (ABN 98 079 218 643) ASX and Media Announcement 14 April 2010 Update on Acquisition of Kaplan Equity Limited Kaplan Funds Management Pty Limited (KFM), manager of the
KAPLAN FUNDS MANAGEMENT PTY LIMITED (ABN 98 079 218 643) ASX and Media Announcement 14 April 2010 Update on Acquisition of Kaplan Equity Limited Kaplan Funds Management Pty Limited (KFM), manager of the
PMP LIMITED. For personal use only INVESTOR PRESENTATION. Results for the 6 months ended 31 December February 2016
 PMP LIMITED ABN 39 050 148 644 Results for the 6 months ended 31 December 2015 22 February 2016 Peter George, CEO Geoff Stephenson, CFO INVESTOR PRESENTATION 2016 HALF YEAR RESULTS Contents Pages H1 FY16
2018 FULL YEAR INVESTOR PRESENTATION SILVER CHEF LIMITED
 2018 FULL YEAR INVESTOR PRESENTATION SILVER CHEF LIMITED 1986 2005 2008 2011 2013 2018 Silver Chef established by Non-Executive Chairman Allan English Silver Chef listed on ASX Launched GoGetta in Australia
Austin Engineering Ltd. For personal use only. 1H17 Results Presentation. 24 February 2017
 Austin Engineering Ltd 1H17 Results Presentation 24 February 2017 Contents 1. Summary pg 3 2. 1H17 Results pg 6 3. Capital Management pg 10 4. Outlook pg 13 2 Summary Highlights 1. Austin generated Sales
For personal use only
 ASX ANNOUNCEMENT Wednesday 22 February 2012 The Manager Company Announcements Office Australian Securities Exchange Level 45, South Tower Rialto 525 Collins Street MELBOURNE VIC 3000 ELECTRONIC LODGEMENT
FY2015. For personal use only. Full Year Results
 2015 For personal use only Full Year Results Create Build Operate Global Minerals Message from the Board & Executive GROUP Group PERFORMANCE Performance Our NPAT for 2015 is a solid performance and testament