For personal use only
|
|
|
- Claud Banks
- 5 years ago
- Views:
Transcription


1 Mantra Group H1FY2015 Results Presentation 26 February 2015
2 Important notice and disclaimer Important notice and disclaimer This document is a presentation of general background information about the activities of Mantra Group Limited (Mantra Group) current at the date of the presentation, (26 February 2015). The information contained in this presentation is of general background and does not purport to be complete. It is not intended to be relied upon as advice to investors or potential investors and does not take into account the investment objectives, financial situation or needs of any particular investor. These should be considered, with or without professional advice, when deciding if an investment is appropriate. Mantra, its related bodies corporate and any of their respective officers, directors and employees (Mantra Parties), do not warrant the accuracy or reliability of this information, and disclaim any responsibility and liability flowing from the use of this information by any party. To the maximum extent permitted by law, the Mantra Parties do not accept any liability to any person, organisation or entity for any loss or damage suffered as a result of reliance on this document. Forward looking statements This document contains certain forward looking statements and comments about future events, including Mantra s expectations about the performance of its businesses. Forward looking statements can generally be identified by the use of forward looking words such as, expect, anticipate, likely, intend, should, could, may, predict, plan, propose, will, believe, forecast, estimate, target and other similar expressions within the meaning of securities laws of applicable jurisdictions. Indications of, and guidance on, future earnings or financial position or performance are also forward looking statements. Forward looking statements involve inherent risks and uncertainties, both general and specific, and there is a risk that such predictions, forecasts, projections and other forward looking statements will not be achieved. Forward looking statements are provided as a general guide only, and should not be relied on as an indication or guarantee of future performance. Forward looking statements involve known and unknown risks, uncertainty and other factors which can cause Mantra s actual results to differ materially from the plans, objectives, expectations, estimates and intentions expressed in such forward looking statements and many of these factors are outside the control of Mantra. As such, undue reliance should not be placed on any forward looking statement. Past performance is not necessarily a guide to future performance and no representation or warranty is made by any person as to the likelihood of achievement or reasonableness of any forward looking statements, forecast financial information or other forecast. Nothing contained in this presentation nor any information made available to you is, or shall be relied upon as, a promise, representation, warranty or guarantee as to the past, present or the future performance of Mantra. Pro forma financial information Mantra uses certain measures to manage and report on its business that are not recognised under Australian Accounting Standards. These measures are referred to as non-ifrs financial information. The non-ifrs information is predominately used in respect of the 2014 financial results. Mantra considers that this non-ifrs financial information is important to assist in evaluating Mantra s performance. The information is presented to assist in making appropriate comparisons with current periods and to assess the operating performance of the business. More detail on the reconciliation of prior year statutory results to proforma information is contained in Mantra s IPO Prospectus lodged with ASIC on 30 May All dollar values are in Australian dollars (A$) unless otherwise stated. 1


3 Contents 1 Highlights 3 2 Mantra Group s business 5 3 Financial performance 9 4 Growth and outlook 19 5 Appendix 26 2

4 Section 1 Highlights


5 Financial highlights H1FY2015 H1FY2015 results on track to meet 2015 full year Prospectus forecast Statutory total revenue of $252.7m, up 9.4% on H1FY2014. Statutory NPAT was $21.8m, up $23.4m on H1FY2014. This result benefitted from a saving in net finance costs of $26.2m following the renegotiation of financing facilities in June EBITDAI of $42.2m, up 17.5% on the same period last year. EBITDAI margin also up from 15.5% to 16.7% for H1FY2015. NPATA of $23.1m, up 19.1% on the proforma result for the same period last year. Seasonality means over 60% of FY15 EBITDAI and over 64% FY15 NPATA per prospectus earned in the H1FY2015 period, in line with historical trends. Basic statutory EPS of 8.7 cents per share, compared to basic statutory EPS of (9.1) cents per share for H1FY2014. Interim dividend of 5 cents per share fully franked to be paid on 31 March 2015 in line with prospectus. Record date is 6 March All Expected New Properties noted in Prospectus have come online plus additional 2 others. Reconfirm Prospectus FY2015 forecasts. 4


6 Section 2 Mantra Group s business
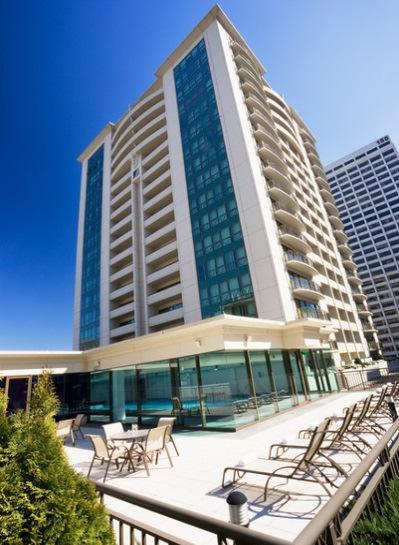
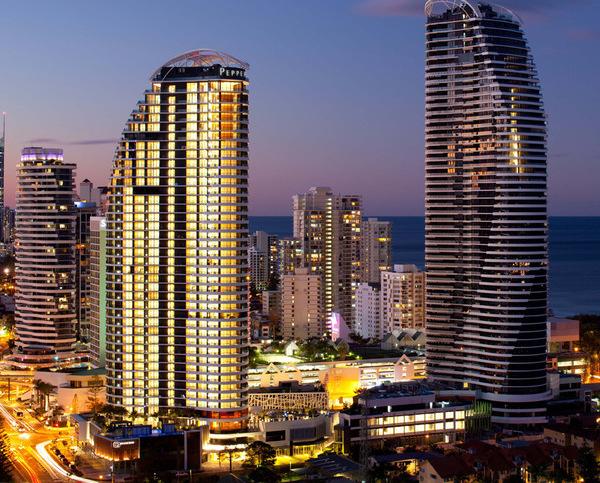
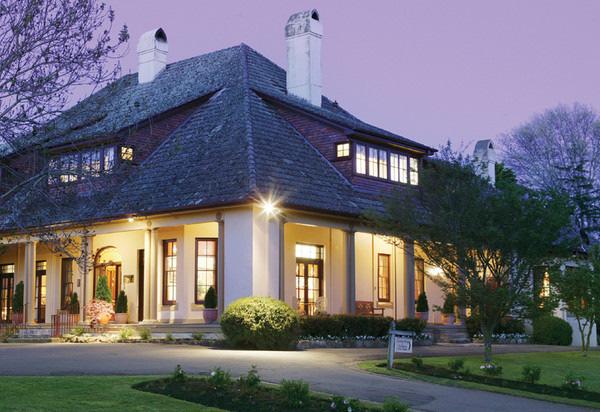
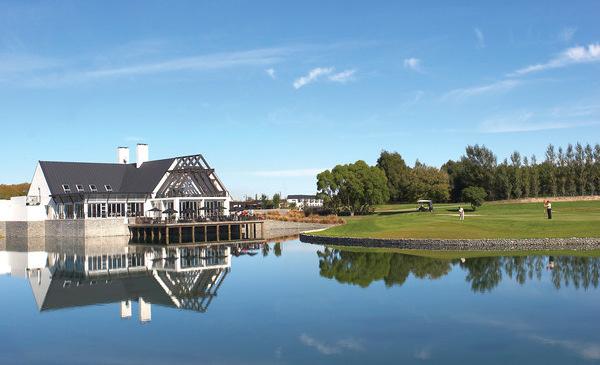
7 Overview Mantra Group is a leading accommodation operator in Australia, attracting approximately 2 million guests per annum Second largest accommodation operator in Australia. Capital light business model with a diversified exposure to both business and leisure markets. Establishments range from luxury retreats and coastal resorts to serviced apartments in CBD and key leisure destinations. Well established platform for future growth. Three complementary brands 29 properties / 2,245 rooms 60 properties / 7,704rooms 25 properties / 1,848 rooms Notes: 1. Properties and rooms data includes existing properties and rooms as at 31 December Total number of guests per annum is determined by multiplying the consolidated number of rooms sold by the total number of guests per room on an annual basis, divided by the average length of stay, which is a standard industry measure of total guests per annum 6

8 Mantra Group locations Mantra Group benefits from widespread geographic presence in the Australian accommodation market Notes: 1 Map is not to scale 7
9 Business segments Mantra Group generates revenues across three strategic business segments CBD Resorts Central Revenue and Distribution Segment description Operates accommodation properties in capital cities throughout Australia targeted towards corporate travellers Operates leisure retreats and resorts throughout Australia and New Zealand, predominantly in attractive Queensland and regional locations Focused on expanding further into key leisure markets Manages Mantra Group's inhouse customer management, online booking services and digital marketing platforms Includes Management Agreements and Marketing Service Agreements Also includes refurbishment revenue Key features Generally experiences relatively stable occupancy throughout economic cycles Benefits from cyclical upside in certain industry sectors Benefits from cyclical upside in the tourism sector as economic activity increases Highly stable Higher margin Operating structures Primarily leases Primarily Management Letting Rights Management Agreements and Marketing Services Agreements Segment H1FY2015 Statutory revenue 1 $136m 54% $95m 37% $20m 8% 1. Corporate segment revenue amounted to $1.1m of total revenue for the period 8


10 Section 3 Financial performance
11 Year-on on-year statutory results overview Statutory H1 FY2015 ($m) H1 FY2014 ($m) Change ($m) Change (%) Operating Revenue % Other income n/c Total operating expenses (210.5) (194.9) (15.6) (8.0%) EBITDAI % Depreciation (4.1) (4.3) 0.2 5% Amortisation (excluding amortisation of lease rights) (2.9) (2.7) (0.2) (7%) EBITA % Amortisation of lease rights (1.9) (1.9) 0 0% EBIT % Net finance costs (2.2) (28.4) % Profit before tax 31.1 (1.5) 32.6 n/c Tax (expense) / credit (9.3) (0.1) (9.4) n/c NPAT 21.8 (1.6) 23.4 n/c 1. EBITDAI Earnings Before Interest, Taxation, Depreciation, Amortisation and Impairment Comments Business has performed strongly in H1FY2015 Revenue, EBITDAI and NPAT all performing ahead of the same period last year Operating revenue increased by 9.4% to $252.5m in H1FY2015 from $230.8m in H1FY2014 EBITDAI increased by $6.3m or 17.5% in H1FY2015 from $35.9m in H1FY2014 EBITDAI margin increased from 15.5% to 16.7% for the six month period Strong revenue growth driven principally by revenue growth in CBD segment Five new properties added in the 6 months to December 2014 and three added late in FY2014 contributed $12.1m to revenue and $1.2m to EBITDAI New properties contribute lower margins initially as properties transition into the Mantra business 10
12 Proforma Results overview H1FY2015 Actual ($m) H1FY2014 Proforma 2 ($m) Total revenue Total operating expenses (210.5) (193.0) EBITDAI Depreciation (4.1) (4.3) Amortisation (excluding amortisation of lease rights) (2.9) (2.7) EBITA Amortisation of lease rights (1.9) (1.9) EBIT Net finance costs (2.2) (2.3) Profit before tax Tax expense (9.3) (7.7) NPAT NPATA EBITDAI Earnings Before Interest, Taxation, Depreciation, Amortisation and Impairment 2. H1FY2014 proforma numbers have been extracted from the Mantra Group Limited 2014 prospectus Comments Business has performed strongly in H1FY2015 Revenue, EBITDAI and NPAT all performing ahead of the same period last year Strong revenue growth driven principally by revenue growth in CBD segment Five new properties added in the 6 months to December 2014 (3 CBD and 2 CRD) and three added late in FY2014 contributed $12.1m to revenue and $1.2m to EBITDAI Seasonality means over 60% of FY15 EBITDAI and over 64% FY15 NPATA per prospectus earned in period, in line with historical trends 11
13 Revenue and EBITDAI by segment Total Revenue H1FY2015 Statutory ($m) H1FY2014 Pro forma ($m) Change ($m) Change (%) CBD % Resorts % Central Revenue and Distribution % Corporate (0.2) (15.4)% Total % EBITDAI 1. H1FY2015 Statutory ($m) H1FY2014 Pro forma ($m) Change ($m) Change (%) CBD % Resorts % Comments Strong CBD revenue growth of $16.2m or 13.5% to $136.4m compared to H1FY2014 proforma revenue. Like for like revenue growth of $4.1m (3.4%), with new properties contributing $12.1m to revenue in the period Solid Resorts revenue growth of 3.6% to $95.1m compared to H1FY2014 proforma revenue. Resorts EBITDAI of $15.0m is 4.9% or $0.7m ahead of H1FY2014 proforma EBITDAI. Central Revenue and Distribution segment results were driven by an increase in revenue from higher booking volumes through central channels and increased management fees from new properties under management. Good cost discipline in Corporate segment. Central Revenue and Distribution % Corporate (13.7) (14.0) % Total % 1. EBITDAI Earnings Before Interest, Taxation, Depreciation, Amortisation and Impairment 12

14 CBD segment highlights CBD revenue increased by $16.2m, from $120.2m proforma H1FY2014 to $136.4m, an increase of 13.5% Total rooms available increased by 11.4%. Increase predominately came from new properties. New properties include BreakFree Fortitude Valley, Mantra St Kilda Road and Mantra on Quay (all late FY14), Peppers Gallery Hotel Canberra and Mantra Midtown and Mantra on Edward in Brisbane. Occupancy increased by 0.6% as a result of strong conference and corporate demand in Melbourne, Adelaide and Darwin and the G20 conference in Brisbane. Average room rate increased 0.8% and 1.5% for comparable properties to last year. Constrained demand in Darwin and city wide conferences in Melbourne and Brisbane the key drivers. H1FY2015 Actual H1FY2014 Proforma Change Change (%) Total rooms available ( 000) % Paid rooms sold ( 000) % Occupancy (%) % Average room rate ($) % RevPAR ($) % 13

15 Resort segment highlights Resorts pro forma revenue increased by $3.3m, from $91.8m to $95.1m, an increase of 3.6% Occupancy increased by 5.4% from 68.2% to 71.9% as a result of leisure and group demand on the Gold Coast and Sunshine Coast. RevPAR was higher by 5.0% as a result of strong demand in key leisure destinations of the Gold Coast, Sunshine Coast and Tropical North Queensland despite slightly lower average room rates. H1FY2015 Actual H1FY2014 Pro forma Change Change (%) Total rooms available ( 000) (6) (0.6)% Paid rooms sold ( 000) % Occupancy (%) % Average room rate ($) (0.8) (0.5)% RevPAR ($) % 14

 and the continued consumer trend to book")
16 CRD segment highlights CRD pro forma revenue increased by $3.5m, from $16.6m to $20.1m, an increase of 21.1% CRD EBITDAI of $15.8m exceeded last year by $2.7m. Growth resulted from increased management fees from new properties under management (Soul Surfers Paradise and Peppers Seminyak Bali) and the continued consumer trend to book through centralised channels. 15


17 H1FY2015 new properties Five new properties added in H1FY2015 Contribution from these five and three late FY2014 acquisitions was $12.1m revenue and $1.2m EBITDAI Peppers Gallery Hotel, Canberra Mantra Terrace Hotel, Brisbane Mantra Midtown, Brisbane Breakfree on Clarence, Sydney Re-development potential Mantra on Edward, Brisbane 16
18 Proforma cash flow before financing and taxation H1FY2015 ($m) H1FY2014 ($m) Comments EBITDAI Non-cash EBITDAI adjustments Changes in working capital (11.8) 1.0 Maintenance capital expenditure New property growth expenditure Net cash flow before financing and taxation (5.5) (5.3) (16.1) (3.8) Net cash flow before financing and taxation has reduced by $19.6m as a result of a decrease in the movement in working capital ($11.8m) and an increase in new property growth expenditure ($16.1m) Working capital movement in the 6 months to December 2014 was impacted by the timing of IPO related and compensation payments ($8m) compared to the same period in the prior year. New property growth expenditure has resulted from the acquisition of five properties in H1FY2015 compared to three in H1FY2014. New property growth expenditure is higher than that included in the prospectus forecast of $8.0m for FY15 as a result of the excellent opportunities that were presented to the Group and concluded in the period. 17
19 Balance sheet and credit metrics 31 Dec-14 Actual ($m) Cash and cash equivalents 35.0 Other current assets 54.4 Current assets 89.4 PPE 96.4 Intangible assets Other non-current assets 1.5 Comments Very strong balance sheet and cash position Well within debt covenants under banking facilities Strong balance sheet leaves the Group in a good position to take advantage of growth opportunities Total non-current assets Total assets Trade and other payables 39.2 Other 41.5 Total current liabilities 80.7 Borrowings Other non-current liabilities 70.0 Credit metrics Borrowings ($m) Cash and cash equivalents ($m) 35.0 Net total indebtedness 80.3 Net debt /LTM EBITDA 1.2x LTM EBITDA/LTM Net finance cost 15.7x Total non-current liabilities Total liabilities Net assets


20 Section 4 Growth and outlook


21 FY2015 Outlook Mantra reaffirms its FY2015 Prospectus forecast: Revenue: $490.9m EBITDA: $69.5m EBIT: $51.0m NPAT: $32.6m NPATA: $35.3m Mantra South Bank, Brisbane Mantra Group has a strong pipeline supported by a very strong balance sheet Mantra Sierra Grand, Broadbeach 20


22 Properties scheduled to enter portfolio FY15 and beyond Property: Mantra Bell City Location: Melbourne, VIC Model: MA Rooms: 383 Opened: January, 2015 Property: Breakfree Bell City Location: Melbourne, VIC Model: MA Rooms: 461 Opened: January,
 Brand: Mantra Hotel Charles Location: Launceston, TAS Model:")

23 Properties scheduled to enter portfolio FY15 and beyond (cont.) Brand: Mantra Hotel Charles Location: Launceston, TAS Model: LEASE Rooms: 98 Opening: H2FY2015 Brand: Mantra Hotel Collins Location: Hobart, TAS Model: LEASE Rooms: 80 Opening: H2FY
 Brand: Breakfree on Cashel Location: Christchurch, NZ Model:")

24 Properties scheduled to enter portfolio FY15 and beyond (cont.) Brand: Breakfree on Cashel Location: Christchurch, NZ Model: HMR Rooms: 250 Opening: H2FY2015 Brand: Hotel Richmont by Mantra Location: Brisbane, QLD Model: HMR Rooms: 110 Opening: H1FY
 Brand: Mantra Hideaway Villas Location: Pecatu, Bali Model:")

25 Properties scheduled to enter portfolio FY15 and beyond (cont.) Brand: Mantra Hideaway Villas Location: Pecatu, Bali Model: HMR Rooms: 30 Opening: H1FY2016 Brand: Peppers Docklands Location: Melbourne, VIC Model: LEASE Rooms: 87 Opening: H2FY
 Brand: Peppers King Square Location: Perth, WA Model: HMR")

26 Properties scheduled to enter portfolio FY15 and beyond (cont.) Brand: Peppers King Square Location: Perth, WA Model: HMR Rooms: 120 Opening: H2FY2016 Brand: Mantra Townsville Location: Townsville, QLD Model: HMR Rooms: 181 Opening: H2FY


27 Appendix Additional information
28 Important notice Mantra s Financial Statements for the year ended 31 December 2014 are presented in accordance with Australian Accounting Standards. Mantra has also chosen to include certain non-ifrs financial information. This information has been included to allow investors to relate the performance of the business to the pro forma financial information outlined in the prospectus and these measures are used by management and the Board to assess performance and make decisions on the allocation of resources. Further information regarding the non-ifrs and pro forma financial measures and other key terms used in this presentation is included in the Glossary below. Non-IFRS and pro forma measures have not been subject to audit or review. Glossary Average room rate CAGR EBIT EBITA EBITDA EBITDAI FY HMR MLR MSA NPAT NPATA Occupancy Paid rooms sold Pro forma RevPAR Total rooms available ARR measures the total average room revenue received per occupied room per day throughout the period. It is used as a metric to compare relative profitability of the accommodation industry and is one of the inputs used to calculate RevPAR along with Occupancy Compound annual growth rate Earnings before interest and tax Earnings before interest, tax and amortisation Earnings before interest, tax, depreciation and amortisation Earnings before interest, taxation, depreciation, amortisation and impairment Year to 30 June Hotel Management Right Management Letting Rights Marketing Services Agreement Net profit after tax Net profit after tax adjusted to add back expense relating to amortisation of lease rights Measures the average number of rooms that have been utilised compared to the total average available rooms throughout the period. It is used as a metric to compare relative profitability of the accommodation industry and is one of the inputs used to calculate RevPAR along with Average Room Rate Number of rooms sold throughout the period Financial information adjusted to reflect certain events and assumptions that were in place following listing as if they had occurred or were in place as at 30 June 2014 Measures the total average room revenue received per room available throughout the period. It can also be calculated by taking the average occupied room rate and multiplying by the occupancy rate. It is used as a metric to compare relative profitability of the accommodation industry Number of rooms managed multiplied by the days in the period 27
29
For personal use only. Mantra Group. FY2015 Results Presentation 27 August 2015
 Mantra Group FY2015 Results Presentation 27 August 2015 IMPORTANT NOTICE AND DISCLAIMER Important notice and disclaimer This document is a presentation of general background information about the activities
For personal use only
 Mantra Group Limited (ASX Code: MTR) ABN 69 137 639 395 2014 Annual General Meeting 26 November 2014 Chairman s Address by Peter Bush Good Morning, I m Peter Bush, Chairman of the Mantra Group and I welcome
For personal use only
 Mantra St Kilda Road, Melbourne DOMESTIC TRAVEL BY AUSTRALIANS INTERNATIONAL VISITORS TO AUSTRALIA Source: Tourism Research Australia, NVS and IVS June 2016 Source: Tourism Research Australia, Tourism
For personal use only
 IMPORTANT NOTICE AND DISCLAIMER Important notice and disclaimer This document is a presentation of general background information about the activities of Mantra Group Limited (Mantra Group) current at
Mantra Group Limited (ASX Code: MTR) ABN Annual General Meeting 22 November 2017
 ABN Annual General Meeting 22 November 2017") Mantra Group Limited (ASX Code: MTR) ABN 69 137 639 395 2017 Annual General Meeting 22 November 2017 Chairman s Address Peter Bush Good Morning, and welcome to the 2017 Mantra Group Annual General Meeting.
Mantra Group Limited (ASX Code: MTR) ABN 69 137 639 395 2017 Annual General Meeting 22 November 2017 Chairman s Address Peter Bush Good Morning, and welcome to the 2017 Mantra Group Annual General Meeting.
For personal use only
 Mantra Group Limited and its controlled entities Appendix 4D Financial statements for the half year ended 31 December 2016 Company details Name of entity Mantra Group Limited ABN 69 137 639 395 Reporting
ABN Reporting period For the half year ended 31 December 2017 Comparative reporting period For the half year ended 31 December 2016
 Mantra Group Limited and its controlled entities Appendix 4D Financial statements for the half year ended 31 December 2017 Company details Name of entity Mantra Group Limited ABN 69 137 639 395 Reporting
Peppers Soul, Surfers Paradise. Mantra Group April 2017
 Peppers Soul, Surfers Paradise Mantra Group April 2017 IMPORTANT NOTICE AND DISCLAIMER Important notice and disclaimer This document is a presentation of general background information about the activities
Morgans Conference 13 October 2017
 Morgans Conference 13 October 2017 IMPORTANT NOTICE AND DISCLAIMER Important notice and disclaimer This document is a presentation of general background information about the activities of Mantra Group
The following information should be read in conjunction with the attached financial report for the year ended 30 June 2017.
 Mantra Group Limited and its controlled entities Appendix 4E for the year ended 30 June Preliminary final report The following information should be read in conjunction with the attached financial report
For personal use only
 MANTRA GROUP LIMITED ANNUAL REPORT YEAR ENDED 30 JUNE ABN: 69 137 639 395 ASX CODE: MTR PEPPERS DOCKLANDS, MELBOURNE Remember when Room for everyone Give me a break Annual report - 30 June MANTRA GROUP
FY17 RESULTS. Tuesday 20 February 2018
 FY17 RESULTS Tuesday 20 February 2018 Agenda 2017 Highlights Results 2018 Observations Out-of-Home industry APN Outdoor Contract renewals Focus and objectives Trading update 2 2017 Highlights 3 2017 highlights
CY2017 RESULTS PRESENTATION 19 FEBRUARY 2018
 CY2017 RESULTS PRESENTATION 19 FEBRUARY 2018 HIGHLIGHTS REVENUE GROWING FASTER THAN MARKET WITH MARGIN EXPANSION REVENUE UNDERLYING 1 NPATA 2 13.1% 13.1% 22.5% 22.5% Revenue $380.3m 13.1% NPAT 2 $33.1m
HALF YEAR RESULTS PRESENTATION
 ASX Announcement 16 February 2016 HALF YEAR RESULTS PRESENTATION Attached is the presentation regarding the financial results of The Star Entertainment Group Limited (The Star Entertainment Group) for
For personal use only
 FY16 RESULTS BRIEFING H U G H M A R K S C H I E F E X E C U T I V E O F F I C E R G R E G B A R N E S C H I E F F I N A N C I A L O F F I C E R M I C H A E L S T E P H E N S O N C H I E F S A L E S O F
For personal use only
 FY14 RESULTS John Croll Chief Executive Officer Nimesh Shah Chief Financial Officer AGENDA OVERVIEW OF FY14 RESULT FINANCIAL PERFORMANCE FY15 OUTLOOK GROWTH STRATEGY Q&A JOHN CROLL NIMESH SHAH JOHN CROLL
For personal use only
 NATIONAL STORAGE REIT JP MORGAN AUSTRALIAN REIT FORUM ASIA MARCH 2017 IMPORTANT NOTE & DISCLAIMER This presentation has been prepared by National Storage REIT ( NSR ) comprising National and may involve
FY2017 Result Presentation. 21 August 2017
 FY2017 Result Presentation 21 August 2017 The Hansen journey growing and diversifying by geography, industry, propriety products and customer Early 1990 s Today Revenue by geography Industry verticals
For personal use only
 Annual General Meeting Managing Director Presentation Jamie Pherous 31 October 2011 Disclaimer While every care has been taken in the preparation of this presentation, Corporate Travel Management (CTM)
For personal use only
 Click to edit Master text styles IDP Education FY16 Results Presentation Twelve months to 30 June 2016 11 February 2016 Important notice and disclaimer Click Disclaimer to edit Master text styles The material
Transpacific FY15 Half Year Results Presentation
 Transpacific FY15 Half Year Results Presentation Robert Boucher CEO Brendan Gill CFO 20 February 2015 - Disclaimer Forward looking statements - This presentation contains certain forward-looking statements,
MOTORCYCLE HOLDINGS LIMITED
 MOTORCYCLE HOLDINGS LIMITED FY2018 Full Year Results Disclaimer Disclaimer and Important Information This presentation may contain certain unaudited financial information in relation to Limited (MTO).
Full Year Results Briefing 27 August 2015
 Full Year Results Briefing 27 August 2015 David Gyngell CEO Simon Kelly COO/CFO Amanda Laing Commercial Director and Group General Counsel Alex Parsons MD, Nine Digital Peter Wiltshire Group Sales Director
For personal use only
 Affinity Education Group Full Year 2014 Results 27 February 2015 2014 Highlights FY 2014 Earnings Growth Underlying EBITDA of $17.9m (1) and underlying NPAT of $11.4m (1) Underlying EPS of 8.1 cents (1)
FY2015 Annual Results August Brett McKeon - CEO David Bailey - CFO
 FY2015 Annual Results August 27 2015 Brett McKeon - CEO David Bailey - CFO FY2015 Financial Results Highlights Delivery on FY15 Prospectus forecasts Pro forma NPAT $19.3 million up 8.4% against IPO forecast
Shine Corporate Ltd 2018 Full Year Results
 Shine Corporate Ltd 2018 Full Year Results Results Presentation August 2018 Simon Morrison MANAGING DIRECTOR Ravin Raj CHIEF FINANCIAL OFFICER Disclaimer This presentation contains certain forward-looking
FULL YEAR RESULTS PRESENTATION
 ASX Announcement 26 August 2016 FULL YEAR RESULTS PRESENTATION Attached is the presentation regarding the financial results of The Star Entertainment Group Limited (The Star Entertainment Group) for the
Shaver Shop Group Limited 1H FY18 RESULTS INVESTOR PRESENTATION. 23 February 2018
 Shaver Shop Group Limited 1H FY18 RESULTS INVESTOR PRESENTATION 23 February 2018 1 TABLE OF CONTENTS 01 Key business highlights 02 Financial results 03 Key growth drivers 04 Trading update& outlook 05
FIRST HALF FINANCIAL YEAR 2018 RESULTS PRESENTATION
 FIRST HALF FINANCIAL YEAR 2018 RESULTS PRESENTATION 15 February 2018 Steve Gostlow, Managing Director 2 Our corporate ideals are based on safety, reliability and sustainability. 1H18 - Highlights Safety
FY19 half year results
 FY19 half year results For the six months ended 31 December 2018 14 February 2019 Gordon Ballantyne Managing Director & Chief Executive Officer Michael Sammells Chief Financial Officer 1 1HFY19 returned
Prime Financial Group Ltd (ASX: PFG) Full Year 2018 Results Presentation
 Full Year 2018 Results Presentation") Prime Financial Group Ltd (ASX: PFG) Full Year 2018 Results Presentation 29 August 2018 Click here to access accompanying Full Year 2018 Results Presentation podcast Key Points 1. Exposure to favourable
Prime Financial Group Ltd (ASX: PFG) Full Year 2018 Results Presentation 29 August 2018 Click here to access accompanying Full Year 2018 Results Presentation podcast Key Points 1. Exposure to favourable
INVESTOR PRESENTATION SG FLEET GROUP LIMITED - FY2016 RESULTS
 INVESTOR PRESENTATION SG FLEET GROUP LIMITED - FY2016 RESULTS 16 August 2016 Important Notice and Disclaimer IMPORTANT INFORMATION The information in this presentation is general in nature and does not
For personal use only
 23 August 2013 Full Year Results June 2013 We attach an Investor Presentation for the FY13 Full Year Results. As previously announced, a results briefing for analysts will be held at 10:30am Sydney time
2013 Full Year Results
 2013 Full Year Results Rob Gurney CEO 1 2013 Full Year Review Profit before tax increased by 88% to $27.1 million Adjusted EBITDAI (1) up 8% to $54.6m Announced launch of new consumer brand, helloworld
For personal use only
 SUMMARY OF 1H19 GROUP OUTCOMES Strong first half performance UNDERLYING PROFIT BEFORE TAX (UPBT) 1H19 $112.3m up $30.4m on 1H18 Highest 1H underlying result in 11 years Delivered despite $88.2m fuel and
Cameron Judson, CEO Glynn Wright, CFO. McGrath Limited (ASX: MEA) Results for the 6 months ended 31 December February 2018
 Results for the 6 months ended 31 December February 2018") Cameron Judson, CEO Glynn Wright, CFO McGrath Limited (ASX: MEA) Results for the 6 months ended 31 December 2017 15 February 2018 1H18 A SNAPSHOT REVENUE DOWN 23% TO $51.6M GOODWILL IMPAIRMENT ($21.8)
Cameron Judson, CEO Glynn Wright, CFO McGrath Limited (ASX: MEA) Results for the 6 months ended 31 December 2017 15 February 2018 1H18 A SNAPSHOT REVENUE DOWN 23% TO $51.6M GOODWILL IMPAIRMENT ($21.8)
FY18 Results Presentation Bravura Solutions Limited. 28 August 2018
 FY18 Results Presentation Bravura Solutions Limited 28 August 2018 Important notice and disclaimer The information contained in this document (including this notice) and discussed at this presentation
Cover-More Group. UBS Australasia Conference. November 2015
 Cover-More Group UBS Australasia Conference November 2015 Executive summary: FY15 overview Cover-More delivered another year of double digit earnings growth, with offshore business growing substantially.
FY 10 Results presentation 17 th August Denis Mackenzie, Managing Director Kevin McLaine, CFO
 FY 10 Results presentation 17 th August 2010 Denis Mackenzie, Managing Director Kevin McLaine, CFO Agenda + FY10 Results + Industry trends + Business outlook 2 Executive Summary Revenue growth has been
For personal use only
 FINANCIAL PERFORMANCE HIGHLIGHTS DELIVERING ON FY2020 STRATEGY Estia Health (EHE) 7 December 2015 1 HIGHLIGHTS Acquisition of medium-sized group, Kennedy Health Care - 959 places 5,690 places by the end
Bell Potter Emerging Leaders Conference
 Bell Potter Emerging Leaders Conference Sydney, 24 October 2017 Leon Allen, Managing Director and CEO Disclaimer This presentation has been prepared by QANTM Intellectual Property Limited ACN 612 441 326
For personal use only
 Affinity Education Group (ASX:AFJ) Morgans Conference 10 October 2014 Disclaimer This presentation contains general information in summary form which is current as at 10 October 2014. It presents financial
Big River Industries Limited (ASX:BRI)
") Big River Industries Limited (ASX:BRI) FY2018 Half Year Results Briefing 27 February 2018 Optus Stadium - Perth H1 FY2018 - Contents 1. Highlights 2. Business Diversity Strengthening 3. Sales Highlights
Big River Industries Limited (ASX:BRI) FY2018 Half Year Results Briefing 27 February 2018 Optus Stadium - Perth H1 FY2018 - Contents 1. Highlights 2. Business Diversity Strengthening 3. Sales Highlights
MIRVAC GROUP 3 MAY Management Update INCLUDING 3Q16 HIGHLIGHTS
 MIRVAC GROUP 3 MAY 2016 Management Update INCLUDING 3Q16 HIGHLIGHTS URBAN FOCUS > We are an urban company, we create places for people to live, work and shop > We understand the fabric of cities and the
Terrorism Insurance Act 2003 Update
 Terrorism Insurance Act 2003 Update September October 2003 2003 W As you would be aware, following the events of September 11, most commercial insurers in Australia excluded terrorism-related claims, leaving
2017 half year results investor presentation
 2017 half year results investor presentation 27 February 2017 contents section presenting slide CEO presentation Julian Ogrin 3 broadband 10 CFO presentation Leanne Wolski 14 summary Julian Ogrin 21 appendix
Credit Suisse Annual Asian Investment Conference
 Adelaide Brighton Limited Credit Suisse Annual Asian Investment Conference Hong Kong, 27 30 March 2017 Martin Brydon Chief Executive Officer and Managing Director Adelaide Brighton Limited Overview of
 ASX ANNOUNCEMENT DATE: 22 February 2017 Attached is the Presentation regarding Pact s Half year Financial Results for the half year ended 31 December 2016. The Presentation will occur at 10am (Melbourne
Redcape Hotel Group. 1H19 Results Presentation 20 February 2019
 Redcape Hotel Group H9 Results Presentation 20 February 209 Agenda Overview of H9 Results 2 Financial Results 3 Portfolio Overview 4 Key Priorities and Outlook 5 Appendices 2 OVERVIEW OF H9 RESULTS 3 H9
AUB GROUP LTD FULL YEAR RESULTS
 AUB GROUP LTD FULL YEAR RESULTS FOR THE PERIOD ENDED 30 JUNE 207 (FY7) 28 TH AUGUST 207 Page - AUB Group Ltd FY7 Results NOTICE SUMMARY INFORMATION This document has been prepared by AUB Group Limited
Interim Results Presentation
 Interim Results Presentation Half Year 31 December 2015 Released 15 February 2016 Scott McMillan, Managing Director Lee Schofield, Chief Executive Officer Matt Dyer, Chief Financial Officer Key Messages
Capital raising. May Doug Rathbone Managing Director and Chief Executive Officer. Kevin Martin Chief Financial Officer
 May 15 2009 Capital raising Doug Rathbone Managing Director and Chief Executive Officer Kevin Martin Chief Financial Officer Robert Reis Group GM - Corporate Strategy & External Affairs Important information
Affinity Education Group. Half Year Results
 Affinity Education Group Half Year Results 29 August 2014 Disclaimer This presentation contains general information in summary form which is current as at 29 August 2014. It presents financial information
Annual General Meeting 2018 HT&E Limited ABN
 Annual General Meeting 2018 HT&E Limited ABN 95 008 637 643 1 Creating shareholder value ARN is performing well; growth in core business Adshel pioneering digital out-of-home; innovative opportunities
For personal use only
 Macquarie Conference Presentation 8 May 2015 Geoff Horth, CEO Presentation Content Organic Growth Driving Results Acquisition of Call Plus Group Outlook 2 Organic Growth! Driving Results! The Numbers Financial
Sigma Pharmaceuticals Limited
 Investor Relations Contact: Gary Woodford Corporate Affairs Manager Gary.Woodford@signet.com.au Phone: 03 9215 9632 Mobile: 0417 399 204 Mark Hooper CEO and Managing Director Gary Woodford Corporate Affairs
For personal use only 1H17 RESULTS PRESENTATION
 For personal use only 1H17 RESULTS PRESENTATION KEY PERFORMANCE METRICS FOR 1H17 OPERATIONAL FINANCIAL CAPITAL MANAGEMENT 1,408 settlements Up 10% $19.8m 1H17 operating profit after tax Up 7% 24.8% gearing
A S X A N N O U N C E M E N T
 A S X A N N O U N C E M E N T DATE: 24 February 2016 Attached is the Presentation regarding Pact s Half year Financial Results for the half year ended 31 December 2015. The Presentation will occur at 10am
2017 FULL YEAR RESULTS
 2017 FULL YEAR RESULTS ESTABLISHING LEADING POSITIONS IN NEW GROWTH SECTORS Malcolm Bundey Managing Director and CEO Richard Betts Chief Financial Officer 16 August 2017 Pact Group Holdings Ltd ABN: 55
For personal use only
 Growthpoint Properties Australia (ASX Code: GOZ) Growthpoint Properties Australia Trust ARSN 120 121 002 Growthpoint Properties Australia Limited ABN 33 124 093 901 AFSL 316409 For personal use only www.growthpoint.com.au
For personal use only
 Appendix 4D Half-year report 1. Company details Name of entity: ABN: 37 167 522 901 Reporting period: For the half-year ended Previous period: For the half-year December 2015 2. Results for announcement
AGM PRESENTATION ǀ NOVEMBER 2017 ǀ PAGE 1 ANNUAL GENERAL MEETING
 AGM PRESENTATION ǀ NOVEMBER 2017 ǀ PAGE 1 ANNUAL GENERAL MEETING NOVEMBER 2017 KEY PERFORMANCE METRICS FOR FY17 OPERATIONAL FINANCIAL CAPITAL MANAGEMENT STRATEGIC GROWTH 3,077 settlements Up 7% $44.8m
Investor Presentation Full Year CY 2017 Results
 Investor Presentation Full Year CY 2017 Results Deven Billimoria Managing Director and CEO Tim Looi Chief Financial Officer 22 February 2018 PAGE 0 Smartgroup has had another successful year... 1 2 3 4
For personal use only
 FY18 Half Year Results For the six months ended 31 December 2017 21 February 2018 Disclaimer Forward looking statements This presentation contains certain forward-looking statements, including with respect
Interim FY 2015 results 6 months ended 31 December February 2015
 Interim FY 2015 results 31 December 2014 18 February 2015 Highlights Solid trading result for 1H FY2015; change in accounting policy for acquisition of healthcare practices First half result highlights
Acquisition of European herbicide product portfolio from FMC
 Acquisition of European herbicide product portfolio from FMC 8 November 2017 Important notice and disclaimer This presentation has been prepared by Nufarm Limited ACN 091 2 12 ( Nufarm" or the "Company").
Mantra Group. Coasting through 1H15. Earnings and target price revision. Price catalyst. Catalyst: 1H15 result on 27 February.
 AUSTRALIA MTR AU Price (at 07:30, 12 Feb 2015 GMT) Outperform A$2.90 Valuation A$ 3.06 - DCF (WACC 8.7%, beta 1.3, ERP 5.0%, RFR 3.8%, TGR 3.0%) 12-month target A$ 3.26 12-month TSR % +16.3 Volatility
Appendix 4D PARAGON CARE LIMITED. Reporting Period: Financial Half Year ended 31 Dec 2014
 Appendix 4D Name of Entity: PARAGON CARE LIMITED Reporting Period: Financial Half Year ended 31 Dec 2014 Previous corresponding Period: Financial Half Year ended 31 Dec 2013 Results for Announcement to
Ingenia Communities Group
 INGENIA COMMUNITIES GROUP Morgan s Investor Queensland Conference Conference Ingenia Communities Group 23 October 2015 October 2015 Lakeside Lara, Lara, VIC OUR BUSINESS Ingenia is a leading owner, operator
COLLINS FOODS LIMITED. MORGANS ANNUAL QLD CONFERENCE 8 October 2014
 COLLINS FOODS LIMITED MORGANS ANNUAL QLD CONFERENCE 8 October 2014 Page 1 Chief Executive Officer Graham Maxwell Collins Foods Limited 170 KFC restaurants across Queensland, Western Australia and Northern
For personal use only
 Ardent Leisure Group 2013 Half Year Results Contents Ardent Leisure Group HY13 financial summary and commentary Health Clubs Main Event Entertainment Theme Parks Marinas Bowling Group financial results
16.1c c c
 1 2016 Interim Result Highlights Successful delivery, ahead of PDS 2 Exceeded revised earnings guidance Six months to 31 Dec 15 Solid capital management 7.97c 7.65c $2.15 28.3% Earnings per unit Distribution
Property Acquisitions
 Property Acquisitions 7 november 2013 Overview Property Acquisitions I 7 November 2013 I page 1 Strategic acquisitions of quality assets in core locations with value add potential Mirvac has entered into
Sales increased 8.1% to $128.0m (HY17: $118.4m)
") Nick Scali Limited NCK.ASX HY18 Results Presentation 7th February 2018 Key Highlights Sales increased 8.1% to $128.0m (HY17: $118.4m) Sales Like for like sales growth of +2.6% for Nick Scali Furniture
Nick Scali Limited NCK.ASX HY18 Results Presentation 7th February 2018 Key Highlights Sales increased 8.1% to $128.0m (HY17: $118.4m) Sales Like for like sales growth of +2.6% for Nick Scali Furniture
1H16 Results Presentation 29 February 2016 LEAVE YOUR WORLD BEHIND
 1H16 Results Presentation 29 February 2016 1 Bill to double check DISCLAIMER Important Notice and Disclaimer: This presentation has been prepared by Skydive the Beach Group Limited ACN 167 320 470 ("SKB
Helping you move the Earth TM. 1H07 Results Presentation. 22 February 2007
 Helping you move the Earth TM 1H07 Results Presentation 22 February 2007 1H07 Results Analyst Presentation V2 05060D937-803573d1 Disclaimer and Important notice This presentation may contain forward looking
Qube Holdings Limited Investor Presentation FY 16 Interim Results
 Qube Holdings Limited Investor Presentation FY 16 Interim Results 1 Disclaimer Important Notice ABN 141 497 230 53 The information contained in this Presentation or subsequently provided to the recipient
FY18 RESULTS PRESENTATION
 FY18 RESULTS PRESENTATION KEY PERFORMANCE METRICS FOR FY18 OPERATIONAL FINANCIAL CAPITAL MANAGEMENT STRATEGIC GROWTH 2,257 lots under contract with a value of $616m $49.1m FY18 operating profit after tax
EBOS Group Ltd. For personal use only. Results presentation Financial Year ended 30 June August 2016
 EBOS Group Ltd Results presentation Financial Year ended 30 June 2016 Patrick Davies John Cullity Chief Executive Officer Chief Financial Officer 25 August 2016 Disclaimer The information in this presentation
Kathmandu FY12 Results Presentation
 Kathmandu FY12 Results Presentation Contents Results Overview Key Line Items Country Results Cash Flow, Balance Sheet, Dividend Growth Strategy Update FY13 Outlook Questions 2 Results Overview Results
For personal use only
 DWS Limited 2018 Full Year Results Presentation Contents Introduction Danny Wallis (CEO) / Stuart Whipp (CFO) Results Highlights Full Year Results Capital Management Operations Update Summary and Outlook
Monash IVF Group. FY16 Results Presentation 26 August 2016
 Monash IVF Group FY16 Results Presentation 26 August 2016 Disclaimer The presentation has been prepared by Monash IVF Group Limited (ACN 169 302 309) ( MVF ) (including its subsidiaries, affiliates and
25 February The Manager Market Announcements Australian Securities Exchange Limited 20 Bridge Street SYDNEY NSW 2000.
 Level 1 157 Grenfell Street Adelaide SA 5000 GPO Box 2155 Adelaide SA 5001 Adelaide Brighton Ltd ACN 007 596 018 Telephone (08) 8223 8000 International +618 8223 8000 Facsimile (08) 8215 0030 www.adbri.com.au
For personal use only
 FY15 FULL YEAR RESULTS REVIEW Progressing to plan Agenda GROUP RESULTS OVERVIEW BUSINESS UNIT REVIEW OUTLOOK 150 Collins Street, Westpac Building. Mechanical work was completed by Allstaff Airconditioning
AUSTRALIAN PHARMACEUTICAL INDUSTRIES LIMITED HALF YEAR FY14 RESULTS PRESENTATION WEDNESDAY 30 APRIL 2014
 AUSTRALIAN PHARMACEUTICAL INDUSTRIES LIMITED HALF YEAR FY14 RESULTS PRESENTATION WEDNESDAY 30 APRIL 2014 Important Notice The material in this presentation is of general information about API s activities
For personal use only. 30 June 2016 Full Year Results Presentation
 30 June 2016 Full Year Results Presentation 30 August 2016 FY16 Financial Results Highlights Group Revenue A$143.4m Underlying 1 EBITDA A$87.6m Underlying 1 NPAT A$54.4m Operating Cashflow A$48.7m Maiden
FINANCIAL RESULTS PRESENTATION H1FY18
 Virtus Health (ASX:VRT) FINANCIAL RESULTS PRESENTATION H1FY18 Tuesday 20 th February, 2018 9.15am AEDT DISCLAIMER The material in this presentation has been prepared by Virtus Health Limited ABN 80 129
Cass O Connor, Chair Cameron Judson, CEO. McGrath Limited 2017 Annual General Meeting Wednesday 22 November New South Head Rd, Edgecliff NSW
 Cass O Connor, Chair Cameron Judson, CEO McGrath Limited 2017 Annual General Meeting Wednesday 22 November 2017 191 New South Head Rd, Edgecliff NSW FY17 A SNAPSHOT REVENUE UP 7% TO $129.4M NPAT DOWN 42%
ASX Media Release WORLEYPARSONS LIMITED (ASX: WOR) FULL YEAR 2017 RESULT
 FULL YEAR 2017 RESULT") 23 August 2017 ASX Media Release WORLEYPARSONS LIMITED (ASX: WOR) FULL YEAR 2017 RESULT Professional services company WorleyParsons Limited today announced a statutory net profit after tax (NPAT) of $33.5
23 August 2017 ASX Media Release WORLEYPARSONS LIMITED (ASX: WOR) FULL YEAR 2017 RESULT Professional services company WorleyParsons Limited today announced a statutory net profit after tax (NPAT) of $33.5
FY18 1 ST HALF RESULTS
 26 FEBRUARY 2018 FY18 1 ST HALF RESULTS Chief Executive Officer : Chief Financial Officer : John Croll James Orlando isentia.com AGENDA Overview of H1 FY18 Results Strategic Focus H1 FY18 Financial Performance
For personal use only. Beacon Lighting Group Limited RESULTS PRESENTATION F Y 20 14
 For personal use only Beacon Lighting Group Limited RESULTS PRESENTATION F Y 20 14 AGENDA 1. BACKGROUND 2. RESULTS OVERVIEW 3. TRADING PERFORMANCE 4. CASH FLOW, BALANCE SHEET, DIVIDEND 5. GROWTH STRATEGY
Prime Financial Group Ltd (ASX: PFG) Half Year 2018 Results Presentation. 28 February 2018
 Half Year 2018 Results Presentation. 28 February 2018") Prime Financial Group Ltd (ASX: PFG) Half Year 2018 Results Presentation 28 February 2018 2 Overview H1 2018 Key Highlights 1. Strong revenue growth revenue increased 25% compared to H1 2017 driven by
Prime Financial Group Ltd (ASX: PFG) Half Year 2018 Results Presentation 28 February 2018 2 Overview H1 2018 Key Highlights 1. Strong revenue growth revenue increased 25% compared to H1 2017 driven by
For personal use only
 ALE Property Group Annual General Meeting 25 October 2016 Crows Nest Hotel, Sydney, NSW 1 Contents Highlights ALE s 13 Years of Equity Performance FY16 Results Properties and Development Case Studies Capital
For personal use only
 Investor presentation Acquisition of Autopia Group 4 July 2016 PAGE 0 Acquisition of 100% of Autopia to grow Smartgroup s leasing portfolio and expand client base in corporate segment Autopia overview
JB Hi-Fi Limited. Half Year Results Presentation. 31 December 2003
 JB Hi-Fi Limited Half Year Results Presentation 31 December 2003 AGENDA Highlights 6 months 31 December 2003 2004 Focus Chief Executive Officer Richard Uechtritz Chief Financial Officer Richard Murray
Macquarie Australia Conference Presentation
 Macquarie Australia Conference Presentation CEO & Managing Director Julian Ogrin 4 May 2016 AGENDA 1 Company overview & strategy 2 Vaya update 3 Growth drivers & outlook An amaysim snapshot Australia s
Full Year Results Presentation For the year ended 30 June August 2017
 Full Year Results Presentation For the year ended 30 June 2017 18 August 2017 Important notice This presentation has been prepared by Link Administration Holdings Limited (Company) together with its related
Full Year 2017 Results Presentation Bravura Solutions Limited
 Full Year 2017 Results Presentation Bravura Solutions Limited 23 rd August 2017 Important notice and disclaimer The information contained in this document (including this notice) or discussed at this presentation
QANTM. Full Year Results Presentation. Leon Allen, Managing Director and CEO Martin Cleaver, Chief Financial Officer. 12 months to 30 June 2017
 Full Year Results Presentation 12 months to 30 June 2017 QANTM 30 AUGUST 2017 Leon Allen, Managing Director and CEO Martin Cleaver, Chief Financial Officer Disclaimer This presentation has been prepared
HY19 Interim Results For the six months to 31 December 2018
 HY19 Interim Results For the six months to 31 December 2018 HY19 KEY EVENTS $13.3m from sale of Cavalier s 27.5% in its wool scouring business (Cavalier Wool Holdings, CWH) and the associated property.