KAP INDUSTRIAL HOLDINGS LIMITED UNAUDITED RESULTS FOR THE SIX MONTHS ENDED 31 DECEMBER 2018
|
|
|
- Rachel Thomas
- 5 years ago
- Views:
Transcription

1 KAP INDUSTRIAL HOLDINGS LIMITED

2 INTEGRATED INTO EVERY DAY INTRODUCTION JAAP DU TOIT CHAIRMAN
3 AGENDA INTRODUCTION JAAP DU TOIT UNAUDITED INTERIM RESULTS FOR THE SIX STRATEGY MONTHS IMPLEMENTATION ENDED 31 DECEMBER 2016 GARY CHAPLIN DIVISIONAL HIGHLIGHTS GARY CHAPLIN FINANCIAL ANALYSIS OUTLOOK Q&A FRANS OLIVIER GARY CHAPLIN GARY CHAPLIN / FRANS OLIVIER 3

4 INTEGRATED INTO EVERY DAY STRATEGY IMPLEMENTATION GARY CHAPLIN CHIEF EXECUTIVE OFFICER
5 STRATEGY IMPLEMENTATION 5
6 STRATEGY IMPLEMENTATION FIVE-YEAR COMPOUND ANNUAL GROWTH AS A RESULT OF ORGANIC EXPANSION AND ACQUISITION OF COMPLEMENTARY BUSINESSES REVENUE (Rm) CAGR* 12% CORE OPERATING PROFIT (Rm) CAGR* 16% H14 1H15 1H16 1H17 1H18 1H19 0 1H14 1H15 1H16 1H17 1H18 1H19 HEPS (cents) CAGR* 13% OPERATING CASH FLOW # (Rm) CAGR* 19% H14 1H15 1H16 1H17 1H18 1H19 0 1H14 1H15 1H16 1H17 1H18 1H19 * Compound annual growth rate of continuing operations, excluding the non-recurring, non-cash impact of the Unitrans B-BBEE transaction. # Cash generated from operations 6

7 STRATEGY IMPLEMENTATION GROUP OPERATIONAL STRUCTURE DIVERSIFIED INDUSTRIAL DIVERSIFIED CHEMICAL DIVERSIFIED LOGISTICS INTEGRATED TIMBER Integrated forestry, timber and resin manufacturing operations with primary and upgrading processes AUTOMOTIVE COMPONENTS Manufacture of vehicle retail accessories and components used in new vehicle assembly INTEGRATED BEDDING Manufacture of foam, fabrics, springs, bases and branded mattresses POLYMERS Manufacture of polyethylene terephthalate (PET), high-density polyethylene (HDPE) and polypropylene (PP) CONTRACTUAL LOGISTICS SA Provision of specialised contractual supply chain and logistics services CONTRACTUAL LOGISTICS AFRICA Provision of specialised contractual supply chain and logistics services PASSENGER TRANSPORT Provision of personnel, commuter, intercity and tourism transport services 7
8 STRATEGY IMPLEMENTATION GROUP SEGMENTAL ANALYSIS REVENUE* OPERATING PROFIT* TOTAL ASSETS DIVERSIFIED INDUSTRIAL 30% DIVERSIFIED INDUSTRIAL 40% DIVERSIFIED INDUSTRIAL 36% DIVERSIFIED CHEMICAL 33% DIVERSIFIED CHEMICAL 32% DIVERSIFIED CHEMICAL 35% DIVERSIFIED LOGISTICS 37% DIVERSIFIED LOGISTICS 28% DIVERSIFIED LOGISTICS 29% * From continuing operations, excluding the non-recurring, non-cash impact of the Unitrans B-BBEE transaction. 8
 expansion Focus for F2019 Final implementation of various expansion projects Final")
9 STRATEGY IMPLEMENTATION F2019 FOCUS Multiple projects embarked on and acquisitions concluded in recent years R7.8 billion invested in 24 months to 30 June 2018 Good execution record, with the exception of Safripol (Durban) expansion Focus for F2019 Final implementation of various expansion projects Final integration of various acquisitions Extraction of value from capital invested Strong cash generation 9
10 STRATEGY IMPLEMENTATION REVENUE ANALYSIS (Rm) 10% Stable 79% 15% 28% 8% Industrial Chemical 28% 9% Logistics 12% 4% % 16% 13% H18 Integrated Timber Automotive Components Integrated Bedding Polymers Contractual Logistics SA Contractual Logistics Africa Passenger Transport 1H19 Comparative segmental information restated for the move of the group s resin business from chemical to industrial. 10
11 STRATEGY IMPLEMENTATION OPERATING PROFIT ANALYSIS 1% 53% 14% (Rm) Industrial Chemical Logistics H18 1% 3% Integrated Timber Automotive Components Integrated Bedding 53% Polymers (33%) Contractual Logistics SA 7% Contractual Logistics Africa (13%) Passenger Transport H19 From continuing operations, excluding the non-recurring, non-cash impact of the Unitrans B-BBEE transaction. Comparative segmental information restated for the move of the group s resin business from chemical to industrial. 11
12 Operating margin (%) STRATEGY IMPLEMENTATION MARGIN ANALYSIS KAP operating profit margin reduced 90 bps to 11.3% UNAUDITED INTERIM RESULTS FOR THE SIX MONTHS ENDED 31 DECEMBER 2016 Industrial Chemical Logistics Group 15.5% 16.8% 14.8% 10.4% 9.2% 11.0% 10.7% 10.9% 8.6% 12.3% 12.6% 12.2% 11.3% 1H17 1H18 1H19 1H17 1H18 1H19 1H17 1H18 1H19 1H17 1H18 1H19 From continuing operations, excluding the non-recurring, non-cash impact of the Unitrans B-BBEE transaction. Comparative segmental information restated for the move of the group s resin business from chemical to industrial. 12

13 INTEGRATED INTO EVERY DAY DIVISIONAL HIGHLIGHTS GARY CHAPLIN CHIEF EXECUTIVE OFFICER

14 INTEGRATED TIMBER Recent technology upgrades and expansions operating ahead of expectation Export sales volumes increased to 17% to support increased production Value-add ratio stable at 54%, thereby protecting R/m 3 profit Successful new product launches support value-add ratio Completion of recovery operations in relation to June 2017 plantation fires November 2018 fire damage to 845 ha Material operational impact of recent fires on plantation, sawmill and pole operations Pole operations further impacted by Western Cape drought Inclusion of resin and paper; management remains with Chemical division REVENUE 15% OPERATING PROFIT 1% 14

15 AUTOMOTIVE COMPONENTS Industry new vehicle assembly volumes increased by 10% VW Polo and BMW X3 model introductions running well Strong volume growth supported revenue growth Continuous improvement projects and new technology implementations delayed, impacting negatively on margins Maxe operations continued to exceed expectation Autovest challenged by subdued motor retail environment Sale of loss-making canopy operation effective 1 October 2018 REVENUE 16% OPERATING PROFIT FLAT 15

16 INTEGRATED BEDDING Continued furniture retail focus on bedding category supports volume growth Volume growth continues to drive integrated business model Intra-division sales of foam and textiles continue to grow Black Friday orders drove higher volumes of low-margin product beyond efficient manufacturing capacity, which impacted negatively on margin Significant and rapid raw material price increases impacted negatively on margin Continued growth in independent market through Support-a-Paedic (recent acquisition) Technology and machinery upgrades continued, targeting completion for next peak trading period REVENUE 13% OPERATING PROFIT 3% 16

17 CHEMICAL REVENUE PET 42% HDPE 33% VOLUMES PET 42% HDPE 33% PP 25% PP 25% UF RELATED 19% UF RELATED 19% 17

18 CHEMICAL Commercial drivers: Import parity price of PET, HDPE and PP (driven by global supply/demand) Indexed raw material prices: ethylene, propylene, PTA, MEG and PIA Rand/US dollar exchange REVENUE 28% Commodity and currency changes during procurement to sales cycle Domestic demand for the product remains strong, with PET customer base restored Plastic converters strike impacted December sales with a resultant increase in inventory Export demand remains strong OPERATING PROFIT 53% Operational performance significantly improved in Durban Review of anti-dumping duties and import duties in progress 18
 sales volumes down 6% PP production volumes down 5% PP US dollar margins up 4% Average rand/us dollar exchange of R14.18 (1H18: R13.")
19 CHEMICAL PET (polyethylene terephthalate) sales volumes up 60% PET production volumes up 344% PET US dollar margins up 16% HDPE (high-density polyethylene) sales volumes down 19% HDPE production volumes flat HDPE US dollar margins up 23% PP (polypropylene) sales volumes down 6% PP production volumes down 5% PP US dollar margins up 4% Average rand/us dollar exchange of R14.18 (1H18: R13.41) 19
20 CONTRACTUAL LOGISTICS SOUTH AFRICA DIVERSE REVENUE BASE FOOD 31% GENERAL FREIGHT 21% REVENUE PETROLEUM 16% MINING & CEMENT 15% SPECIALISED WAREHOUSING 9% CHEMICALS 8% 45% of division sold effective 3 September 2018 in B-BBEE transaction South African operations now independently managed New executive management structure implemented effective 1 December 2018 New operational and support structure targeted for March 2019 implementation 20

21 CONTRACTUAL LOGISTICS SOUTH AFRICA Trading environment stable during first quarter but extremely challenging during second quarter Revenue inflated by cost recoveries (mainly fuel) Volume and margin pressure in all areas, a reflection of subdued economic activity Food business materially down due to cost recovery difficulties on major contract General Freight business performed ahead of prior period Petroleum business down mainly due to lower non-contractual, ad-hoc volumes Mining & Cement, Specialised Warehousing and Chemicals businesses stable Annualised revenue of new contracts R151 million Annualised revenue of renewals R419 million Annualised revenue of contracts lost R66 million REVENUE 9% OPERATING PROFIT* 33% * Excluding B-BBEE cost 21
22 CONTRACTUAL LOGISTICS AFRICA DIVERSE REVENUE BASE BOTSWANA 32% MOZAMBIQUE 20% REVENUE BY COUNTRY SWAZILAND 13% MALAWI 12% TANZANIA 8% NAMIBIA 6% REVENUE BY SECTOR PETROLEUM 57% AGRICULTURE 39% MINING 4% LESOTHO 4% MADAGASCAR 3% ZAMBIA 2% Following South African Logistics B-BBEE transaction, African operations now independently managed New executive management structure implemented effective 1 December 2018 No change to in-country operational structure 22

23 CONTRACTUAL LOGISTICS AFRICA Core business currently Petroleum and Agriculture Volumes and margins stable No major seasonal impacts during the period Cost escalations successfully recovered Focus on expanding operations in existing territories REVENUE 12% OPERATING PROFIT 7% 23

24 PASSENGER TRANSPORT Commuter operations performed well operationally but were impacted by fuel capping formula Personnel operations impacted by lower client activity, which included industrial action Mozambique personnel and Gautrain operations continue to perform well Intercity operations remain under pressure in overtraded market Tourism operation impacted by lower tourist numbers Impact of fuel price increase on operating profit R30 million COMMUTER AND PERSONNEL 53% INTERCITY 26% GAUTRAIN 10% REVENUE 4% OPERATING PROFIT 13% TOURISM 6% AFRICA 5% 24

25 INTEGRATED INTO EVERY DAY FINANCIAL ANALYSIS FRANS OLIVIER CHIEF FINANCIAL OFFICER
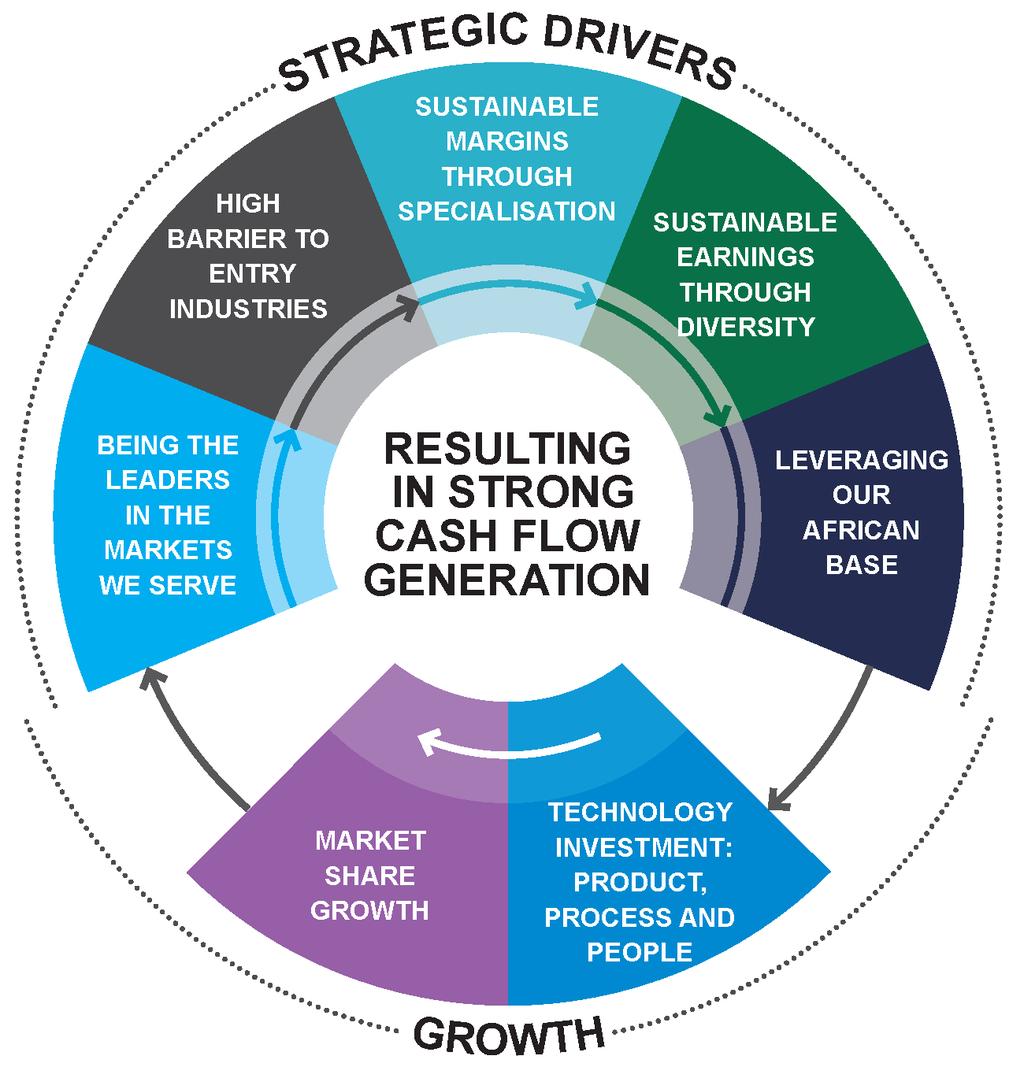
26 FINANCIAL HIGHLIGHTS STRATEGY IMPLEMENTATION RESULTED IN STRONG CASH GENERATION FROM OPERATIONS UNAUDITED INTERIM RESULTS FOR THE SIX MONTHS ENDED 31 DECEMBER 2016 Results from continuing operations 1H19 1H18 Variance Revenue (Rm) % EBITDA before B-BBEE cost (Rm) % Operating profit before B-BBEE cost and capital items (Rm) % Core headline earnings per share (cents)* % Cash generated from operations (Rm) % Net asset value per share (cents) % * Excluding the non-recurring, non-cash impact of the Unitrans B-BBEE transaction. 26
27 FINANCIAL ANALYSIS UNITRANS B-BBEE DEAL OBJECTIVES Achieve > 51% black and > 30% black women ownership in South African logistics business Minimise dilution to shareholders Equity interest sold at market value, taking into account peer multiples Funding provided at market rates Ensure compliance with B-BBEE Commission requirements Ensure a sustainable scheme to create value for B-BBEE shareholders Ensure sustainable growth of South African logistics business 27
28 FINANCIAL ANALYSIS USCS TRANSACTION STRUCTURE UNAUDITED KAP Industrial INTERIM RESULTS FOR THE Holdings Ltd SIX MONTHS ENDED 31 DECEMBER 2016 Loan advancement R1 211m Shareholder loan repayment R1 211m Preference share subscription R1 211m Unitrans Holdings (Pty) Ltd FWG Pieters Trust Sakhumzi Foundation Empowerment Trust KAP Corporate Services (Pty) Ltd 55% 23% 22% Shareholder loan repayment R1 200m R620m Ordinary share subscription Unitrans Supply Chain Solutions (Pty) Ltd (USCS) R591m 28
29 FINANCIAL ANALYSIS INCOME STATEMENT UNAUDITED INTERIM RESULTS FOR THE SIX Continuing MONTHS operations ENDED 31 DECEMBER H19 Rm 1H18 Rm Variance Revenue % EBITDA before B-BBEE cost % Depreciation and amortisation (587) (501) Operating profit before B-BBEE cost and capital items % B-BBEE cost (194) Capital items 5 (26) Operating profit (4%) Net finance costs (366) (328) 12% Associate companies and joint ventures Taxation (322) (297) Non-controlling interest (32) (32) Profit attributable to owners of the parent (16%) 29
30 FINANCIAL ANALYSIS INCOME STATEMENT CONTINUED UNAUDITED INTERIM RESULTS FOR THE SIX Continuing MONTHS operations ENDED 31 DECEMBER H19 Rm 1H18 Rm Variance Profit attributable to owners of the parent (16%) Add back capital items net of taxation (2) 21 Headline earnings (19%) Add back B-BBEE cost 194 Core headline earnings % Weighted average number of ordinary shares (m) % Headline earnings per share (cents) (19%) Core headline earnings per share (cents) % 30
31 FINANCIAL ANALYSIS GEOGRAPHIC MARKETS REVENUE AND OPERATING PROFIT ANALYSIS Revenue* Operating profit* SOUTH AFRICA 91% REST OF AFRICA 9% SOUTH AFRICA 84% REST OF AFRICA 16% Provides diversity in markets and broader growth opportunities Provides improved margins to compensate for sovereign risk and withholding taxes where relevant * From continuing operations, excluding the non-recurring, non-cash impact of the Unitrans B-BBEE transaction. 31
32 FINANCIAL ANALYSIS CURRENCY DRIVERS OF REVENUE AND OPERATING PROFIT Revenue* Operating profit* RAND-driven activities 63% US DOLLAR-driven activities 37% RAND-driven activities 60% US DOLLAR-driven activities 40% Dollar-driven activities impact revenue and raw material prices, therefore representing dollar margin business Provides currency diversity without the complexity of doing business in foreign jurisdictions * From continuing operations, excluding the non-recurring, non-cash impact of the Unitrans B-BBEE transaction. 32
33 FINANCIAL ANALYSIS BALANCE SHEET Balance sheet remains stable with quality assets 1H19 Rm 1H18 Rm Property, plant, equipment and investment property Intangible assets Goodwill Biological assets Net working capital Other assets Assets Total equity Net interest-bearing liabilities Other liabilities Equity and liabilities Net asset value per share (cents)
34 FINANCIAL ANALYSIS CONTINUED INVESTMENTS RESULT IN STRONG ASSET BASE OF NEW TECHNOLOGY ASSETS Capex and acquisition investments (Rm) Asset base at 31 December PLANT & MACHINERY 28% VEHICLES & BUSES 24% INTANGIBLE ASSETS 21% 0 FY15 FY16 FY17 FY18 1H19 LAND & BUILDINGS 11% BIOLOGICAL ASSETS 10% GOODWILL 6% 34
35 FINANCIAL ANALYSIS PLANTATION REVALUATION (Rm) Normal operations 131 (93) (30) Fire-related impact (7) (15) Jun 18 Increase due to growth Decrease due to normal harvesting Decrease due to inflation differential Total prior to effect of fire Excess harvesting resulting in inventory Recovery estimate Dec 18 Harvesting completed for 2017 fire Fire damages 845 ha in November
36 FINANCIAL ANALYSIS WORKING CAPITAL BREAKDOWN (Rm) (466) Dec-17 Inventory Receivables Payables Dec-18 Inventory inflated by lower December 2018 sales in Polymers due to plastic converters strike 36
37 FINANCIAL ANALYSIS CASH FLOW 1H19 Rm EBITDA before B-BBEE cost Net revaluation of biological assets Discontinued operations 1H18 Rm (4) (17) Other non-cash adjustments Cash generated before working capital changes Working capital changes (1 263) (1 495) Inventory Receivables Payables (739) (363) (116) (296) (408) (836) Cash generated from operations Net finance charges Taxation Net dividends (369) (384) (135) (165) (647) (576) Cash flow from operating activities (274) (646) Cash conversion ratio 58% 34% 37
38 FINANCIAL ANALYSIS CASH FLOW CONTINUED 1H19 Rm 1H18 Rm Cash flow from operating activities (274) (646) Investing activities Expansion capex Replacement capex (606) (1 144) (240) (483) (462) (486) Disposal/acquisition of investments 101 (121) Other investing activities (5) (54) Cash flow after investing activities (880) (1 790) Financing activities Non-controlling interest (82) 51 Loans and borrowings Bank overdraft and short-term facilities 1 (72) Movement in cash and cash equivalents (843) (1 354) 38
39 DEBT STRUCTURE AND CAPACITY RATIOS DEBT SERVICEABILITY RATIOS REFLECTIVE OF STRONG CASH GENERATION 31 Dec Dec 17 Net interest-bearing debt (Rm) Equity excluding non-controlling interest (Rm) Gearing: net debt:equity 54% 66% Net debt to EBITDA (times) < EBITDA interest cover (times) > FUNDING STRUCTURE 11% 23% 11% 55% Banks and financial institutions Listed notes Unlisted notes Unutilised facility FIXED VS FLOATING INTEREST RATE FUNDING 34% Floating interest rate funding Fixed interest rate funding 66% 39
40 TREASURY ACTIVITY NET INTEREST-BEARING DEBT MATURITY AS AT 31 DECEMBER 2018 Rm AVAILABLE FACILITIES CASH AND CASH EQUIVALENTS, NET OF OVERDRAFT DEBT REPAYMENTS Dec 2018 Jun 2019 Jun 2020 Jun 2021 Jun 2022 Jun 2023 and thereafter 40

41 INTEGRATED INTO EVERY DAY OUTLOOK GARY CHAPLIN CHIEF EXECUTIVE OFFICER

42 DIVERSIFIED INDUSTRIAL Integrated Timber PG Bison well positioned in terms of product mix, market position and manufacturing capacity/efficiency Approximately R200 million expansion projects approved for F2020 implementation Automotive Components Improved performance expected through implementation of continuous improvement projects and technology investments Approval of replacement APDP programme to create stability and support medium-term growth Integrated Bedding Volume demand remains buoyant into January/February, however on low-margin products Strategy of market share growth and continued integration to be continued Increased raw material cost recovery initiatives to be pursued 42

43 DIVERSIFIED CHEMICAL Polymer and raw material prices and rand/us dollar exchange remain volatile Global polymer demand remains buoyant IHS short-term forecasts appear inconsistent Focus areas for management: Selling full production volume to best advantage Shortening the procurement to sales cycle and minimising inventory in the supply chain Single polymers product offering and logistics solution Moving product mix toward higher value products Consumer sentiment towards single-use plastics to be addressed through coordinated industry initiatives 43

44 DIVERSIFIED LOGISTICS Contractual Logistics South Africa Environment expected to remain challenging through election period Food and Petroleum businesses: new management and structures for increased focus Management focus on improved assets utilisation, operational execution and cost reduction Contractual Logistics Africa Good operational execution expected to continue Focus on growth opportunities Passenger Transport Continued focus on operational improvements and mitigation of fuel variances Strategic review of Intercity operations 44

45 INTEGRATED INTO EVERY DAY Q&A GARY CHAPLIN / FRANS OLIVIER CHIEF EXECUTIVE OFFICER / CHIEF FINANCIAL OFFICER

46 THANK YOU INTEGRATED INTO EVERY DAY
KAP INDUSTRIAL HOLDINGS LIMITED (KAP) UNAUDITED INTERIM RESULTS FOR THE SIX MONTHS ENDED 31 DECEMBER 2017
 UNAUDITED INTERIM RESULTS FOR THE SIX MONTHS ENDED 31 DECEMBER 2017") KAP INDUSTRIAL HOLDINGS LIMITED (KAP) UNAUDITED INTERIM RESULTS FOR THE SIX MONTHS ENDED 31 DECEMBER 2017 WELCOME JAAP DU TOIT CHAIRMAN AGENDA WELCOME UNAUDITED INTERIM RESULTS FOR THE SIX STRATEGY MONTHS
KAP INDUSTRIAL HOLDINGS LIMITED (KAP) UNAUDITED INTERIM RESULTS FOR THE SIX MONTHS ENDED 31 DECEMBER 2017 WELCOME JAAP DU TOIT CHAIRMAN AGENDA WELCOME UNAUDITED INTERIM RESULTS FOR THE SIX STRATEGY MONTHS
Integrated into every day
 Integrated into every day Integrated Report 2016 Group overview 2 Reports to stakeholders 8 Chairman s report 10 Chief executive officer s report 12 Chief financial officer s report 16 Operational review
KAP INDUSTRIAL HOLDINGS LIMITED (KAP)
") KAP INDUSTRIAL HOLDINGS LIMITED (KAP) INVESTEC CEO CONFERENCE NOVEMBER 2016 UNAUDITED LONDON INTERIM RESULTS FOR THE SIX MONTHS ENDED 31 DECEMBER 2016 AGENDA KAP OVERVIEW SAFRIPOL OVERVIEW SAFRIPOL ACQUISITION
KAP INDUSTRIAL HOLDINGS LIMITED (KAP) INVESTEC CEO CONFERENCE NOVEMBER 2016 UNAUDITED LONDON INTERIM RESULTS FOR THE SIX MONTHS ENDED 31 DECEMBER 2016 AGENDA KAP OVERVIEW SAFRIPOL OVERVIEW SAFRIPOL ACQUISITION
Period overview Operational Overview Financial Results Conclusion
 Interim Results Six months ended 31 ust 2015 Bridging y expectations Agenda Period overview Operational Overview Financial Results Conclusion Bridging y expectations 2 1 Six month overview Satisfactory
TRELLIDOR HOLDINGS LIMITED UNAUDITED INTERIM RESULTS FOR THE SIX MONTHS ENDED 31 DECEMBER 2017
 TRELLIDOR HOLDINGS LIMITED UNAUDITED INTERIM RESULTS FOR THE SIX MONTHS ENDED 31 DECEMBER 2017 GROUP HIGHLIGHTS 5% Revenue 5% PAT 5% HEPS 35.2c 5% Interim dividend declared 11.0 cents per share Slide 2
Interim Results. Six months ended 31 August 2016
 Interim Results Six months ended 31 August 2016 Stefanutti Stocks City A multi-disciplinary construction group (Vision) (Mission) 2 www.stefanuttistocks.com y 2 Agenda Six month overview Operational Overview
12 month overview. Operational Overview. Financial Results. Conclusion
 Annual Results 12 months ended 29 ruary 2016 Agenda 12 month overview Operational Overview Financial Results Conclusion 2 1 12 month overview Reasonable financial performance in current market All Business
analyst book for the six months ended 31 December 2012 better together... we deliver
 analyst book for the six months ended 31 December 2012 better together... we deliver SASOL LIMITED GROUP ANALYST BOOK Key highlights for the half-year ended 31 December 2012 Sasol is pleased to provide
ANALYST PRESENTATION FOR THE YEAR ENDED 31 MARCH 2012
 ANALYST PRESENTATION FOR THE YEAR ENDED 31 MARCH 2012 1 TFG ANALYST PRESENTATION MARCH 2012 AGENDA Overview of the economy and retail environment Review of the year Financial review Divisional review Financial
Sasol Limited Analyst book for the half-year ended 31 December 2011
 Sasol Limited Analyst book for the half-year ended 31 December 2011 SASOL LIMITED GROUP ANALYST BOOK Key highlights for the half-year ended 31 December 2011 Sasol is pleased to provide this Analyst Book
SABMiller plc. Full year results Twelve months ended 31 March Jamie Wilson, Chief Financial Officer Gary Leibowitz, SVP, Investor Relations
 SABMiller plc Full year results Twelve months ended 31 March 2012 Jamie Wilson, Chief Financial Officer Gary Leibowitz, SVP, Investor Relations 24 May 2012 Forward looking statements This presentation
TRELLIDOR HOLDINGS LIMITED AUDITED RESULTS FOR THE YEAR ENDED 30 JUNE 2016
 TRELLIDOR HOLDINGS LIMITED AUDITED RESULTS FOR THE YEAR ENDED 30 JUNE 2016 OVERVIEW Trellidor is the market leading manufacturer of custom made barrier security products Distribution through dedicated
SABMiller plc. Full year results Twelve months ended 31 March Graham Mackay, Chief Executive Jamie Wilson, Chief Financial Officer.
 SABMiller plc Full year results Twelve months ended 31 March 2012 Graham Mackay, Chief Executive Jamie Wilson, Chief Financial Officer 24 May 2012 Forward looking statements This presentation includes
Unaudited Consolidated Condensed Interim Results For The Six Months Ended 31 December 2013 And Changes To The Board
 Rolfes Holdings Limited - Unaudited Consolidated Condensed Interim Results For The Six Months Ended 31 December 2013 And Changes To The Board - released 25 February 2014 Unaudited Consolidated Condensed
enx Group Limited results presentation
 enx Group Limited results presentation for the year ended 31 August 2018 Disclaimer Certain statements in this presentation regarding enx s business operations may constitute forward looking statements.
Integrated report 2014
 Integrated report 2014 Contents Group at a glance and highlights IFC/1 About this report 2 Strategic intent 6 Corporate governance and remuneration 12 Decentralised management structure 14 Board of directors
BELL EQUIPMENT LTD RESULTS FOR THE 12 MONTHS ENDED 31 DECEMBER 2017 AND BUSINESS REVIEW
 BELL EQUIPMENT LTD RESULTS FOR THE 12 MONTHS ENDED 31 DECEMBER 2017 AND BUSINESS REVIEW Financial Highlights for 2017 Revenue up 13% to R6,8 billion NPAT up from R39 million to R272 million HEPS per share
ANALYST PRESENTATION FOR THE HALF-YEAR ENDED 30 SEPTEMBER 2010
 ANALYST PRESENTATION FOR THE HALF-YEAR ENDED 30 SEPTEMBER 2010 1 Agenda The economy and retail environment Review of the period Financial review Divisional review Financial services Outlook Questions Doug
Analyst book. for the six months ended 31 December better together... we deliver
 Analyst book for the six months ended 31 December 2013 better together... we deliver SASOL LIMITED GROUP ANALYST BOOK Key highlights for the half-year ended 31 December 2013 Sasol is pleased to provide
Second Quarter Unaudited Financial Statements for the Period Ended 30 June 2018 `
 (Company Registration No : 195800035D) Second Quarter Unaudited Financial Statements for the Period Ended 30 June 2018 ` 1(a) (i) The following statements in the form presented in the group s most recently
INTERIM RESULTS ANNOUNCEMENT MONDAY, 26 FEBRUARY 2018 AT 10H00 JOHANNESBURG MEDIA PRESENTATION SPEAKER NOTES SASOL CFO PAUL VICTOR
 INTERIM RESULTS ANNOUNCEMENT MONDAY, 26 FEBRUARY 2018 AT 10H00 JOHANNESBURG MEDIA PRESENTATION SPEAKER NOTES SASOL CFO PAUL VICTOR 1 SLIDE 11: TITLE SLIDE Thank you Steve and Bongani, and good morning
UNAUDITED CONDENSED CONSOLIDATED INTERIM RESULTS FOR THE PERIOD ENDED 31 december 2018
 ROLFES HOLDINGS LIMITED (Registration number 2000/002715/06) Incorporated in South Africa Share code: RLF ISIN: ZAE000159836 ("Rolfes" or "the group") UNAUDITED CONDENSED CONSOLIDATED INTERIM RESULTS FOR
analyst book sasol limited forward-looking statements for the year ended 30 June 2011
 sasol limited forward-looking statements analyst book Sasol may, in this document, make certain statements that are not historical facts and relate to analyses and other information which are based on
Nampak 2012 Annual Results
 Nampak 2012 Annual Results November 2012 1 Highlights cents 250 Headline Earnings per Share continuing operations 200 150 142.3 172.4 200.8 100 73.9 50 0 2009 2010 2011 2012 2 Highlights Rm 1,800 1,600
PRESENTATION TO INVESTORS FOR THE YEAR ENDED 30 SEPTEMBER 2015
 PRESENTATION TO INVESTORS FOR THE YEAR ENDED 30 SEPTEMBER 2015 AGENDA GROUP OVERVIEW Alan Dickson, CEO FINANCIAL OVERVIEW Nick Thomson, CFO SEGMENTAL DISCUSSIONS ICT Mark Taylor Applied electronics Peter
Barloworld Limited. Reviewed interim results to 31 March May 15, 2006
 Barloworld Limited Reviewed interim results to 31 March 2006 May 15, 2006 BARLOWORLD IS A DIVERSIFIED INDUSTRIAL COMPANY Over 26 000 people in 31 countries Barloworld s way of doing business - market-leading
METAIR INVESTMENTS LIMITED
 METAIR INVESTMENTS LIMITED Year-end results for the 12-months ended 31 December 2008 COVER IMAGE: A 3-D rendering of a prototype vehicle serves two purposes for this report. Firstly, our stakeholders get
Strategic intent 3. Reports to stakeholders 17. Business reviews 31. Audited consolidated financial statements 95
 Integrated report 2015 Table of contents About this report Inside front cover Group at a glance and highlights Opening spread Strategic intent 3 Corporate governance and remuneration 10 Decentralised management
+13% Nampak enriches peoples lives every day through the provision of. HEPS from continuing operations. EPS from continuing operations +17%
 Interim report and dividend declaration for the six months ended 31 March 2012 Nampak enriches peoples lives every day through the provision of wine bottles flavoured alcoholic beverages tissue products
Annual Results. 12 months ended 28 February Agenda
 Annual Results 28 ruary 2015 Bridging y expectations Agenda 2015 2014 2 1 12 month overview Phase 1 of turnaround strategy successfully implemented Closed-out problem contracts Closed non-performing Power
Bank of America Global Agriculture and Chemicals Conference
 Bank of America Global Agriculture and Chemicals Conference Sergey Vasnetsov SVP, Strategic Planning & Transactions March 2, 2016 Cautionary Statement The statements in this presentation relating to matters
Investors Presentation 10 & 11 May 2005 FOR THE SIX MONTHS ENDED 31 MARCH 2005
 Investors Presentation 10 & 11 May 2005 FOR THE SIX MONTHS ENDED 31 MARCH 2005 FACT SHEET FOR SIX MONTH PERIOD Current market capitalisation R6,9 billion Revenue R3,3 billion EBITDA R460 million EBITDA
Barloworld Limited. Audited results for the year ended 30 September 2003
 Barloworld Limited Audited results for the year ended 30 September 2003 Barloworld is an international industrial brand management company 23 000 people... in 32 countries providing business solutions
STRENGTH BEYOND THE BAG
 STRENGTH BEYOND THE BAG 30 PPC Ltd Consolidated statement of financial position as at 30 September ASSETS Non-current assets 6 411 4 998 Property, plant and equipment 1 5 522 4 483 Goodwill 2 101 6 Other
Mpact Limited Annual Results. 31 December 2013
 Mpact Limited Annual Results 31 December 2013 2013 in context and financial highlights Operating review Financial review Strategy and outlook Appendices 2 2013 in context Muted GDP and consumer spending
analyst book sasol limited forward-looking statements for the year ended 30 June 2010
 sasol limited forward-looking statements analyst book In this document we make certain statements that are not historical facts and relate to analyses and other information which are based on forecasts
THIS CIRCULAR IS IMPORTANT AND REQUIRES YOUR IMMEDIATE ATTENTION
 THIS CIRCULAR IS IMPORTANT AND REQUIRES YOUR IMMEDIATE ATTENTION The definitions and interpretations commencing on page 5 of this Circular apply mutatis mutandis throughout this Circular including this
Third Quarter Unaudited Financial Statements for the Period Ended 30 September 2018 `
 (Company Registration No : 195800035D) Third Quarter Unaudited Financial Statements for the Period Ended 30 September 2018 ` 1(a) (i) The following statements in the form presented in the group s most
analyst book sasol limited forward-looking statements for the half-year ended 31 December 2010
 sasol limited forward-looking statements analyst book Sasol may, in this document, make certain statements that are not historical facts and relate to analyses and other information which are based on
Unaudited results. for the six months ended 30 November ISIN: ZAE Share code: ARH. ARB Holdings Limited
 www.arbhold.co.za ARB Holdings Limited Registration number: 1986/002975/06 Share code: ARH ISIN: ZAE000109435 ( ARB or the Company or the Group ) for the six months ended 30 November 2016 Unaudited results
INTERIM RESULTS FOR THE SIX MONTHS ENDED 30 SEPTEMBER October 2014 Presented by Mr Brian Molefe, Group Chief Executive Investor and Media
 INTERIM RESULTS FOR THE SIX MONTHS ENDED 30 SEPTEMBER 29 October Presented by Mr Brian Molefe, Group Chief Executive Investor and Media 1 Agenda Macro economic context Executive summary Actual performance
UNAUDITED INTERIM RESULTS FOR THE SIX MONTHS ENDED 30 JUNE 2015
 Profitability. Empowerment. Positive Social Impact. ISIN Number: ZAE000015277 Share Code: BRT ISIN Number: ZAE000015285 Share Code: BRN Company Registration Number: 1995/010442/06 (Incorporated in the
PEGAS NONWOVENS SA. First quarter 2009 unaudited consolidated financial results
 PEGAS NONWOVENS SA First quarter 2009 unaudited consolidated financial results 28 th May 2009 PEGAS NONWOVENS SA announces its unaudited consolidated financial st results for the first quarter of 2009
INTERIM REPORT We are mens-mense, we CARE
 INTERIM REPORT 2018 We are mens-mense, we CARE Salient features Value of transactions () Recurring headline earnings per share (cents) 4 451 839 +4,5%* 223,12 +7,2% Revenue () Interim dividend per share
FIRST RESOURCES LIMITED
 FIRST RESOURCES LIMITED Unaudited Financial Statements for the Fourth Quarter ( 4Q ) and Full Year Ended 31 December 2018 PART I - INFORMATION REQUIRED FOR ANNOUNCEMENTS OF QUARTERLY (Q1, Q2 & Q3), HALF-YEAR
INSIMBI REFRACTORY AND ALLOY SUPPLIES LIMITED
 INSIMBI REFRACTORY AND ALLOY SUPPLIES LIMITED (Incorporated in the Republic of South Africa) (Registration No: 2002/029821/06) (Income tax reference no: 9078/488/15/3) Share code: ISB ISIN code: ZAE000116828
INTERIM RESULTS AND DISTRIBUTION ANNOUNCEMENT GRINDROD
 2007 INTERIM RESULTS AND DISTRIBUTION ANNOUNCEMENT 23% 22% 21% INCREASE IN PROFIT ATTRIBUTABLE TO ORDINARY SHAREHOLDERS INCREASE IN HEADLINE EARNINGS PER SHARE INCREASE IN DISTRIBUTION TO ORDINARY SHAREHOLDERS
Provisional audited financial results for the year ended 31 March 2016
 Sephaku Holdings Limited (Incorporated in the epublic of South Africa) (egistration number: 2005/003306/06) Share code: SEP ISIN: ZAE000138459 Provisional financial results for the year ended 2016 Aganang
MR PRICE GROUP LIMITED
 MR PRICE GROUP LIMITED OPERATING REPORT 26 WEEKS ENDED 28 SEPTEMBER 2013 1 Registration number 1933/004418/06 Incorporated in the Republic of South Africa ISIN: ZAE 000026951 JSE share code: MPC ( Mr Price
THIRD QUARTER FINANCIAL STATEMENTS ANNOUNCEMENT
 THIRD QUARTER FINANCIAL STATEMENTS ANNOUNCEMENT 1(a) STATEMENT OF PROFIT AND LOSS FOR THE THIRD QUARTER AND NINE MONTHS ENDED 30 SEPTEMBER 2008 Note 3 months ended 30 Sep 9 months ended 30 Sep 2008 2007
FINANCIAL RESULTS PRESENTATION
 FINANCIAL RESULTS PRESENTATION FOR THE YEAR ENDED 31 DECEMBER 2017 27 AND 28 FEBRUARY 2018 01 02 03 04 05 06 PERFORMANCE SUMMARY BUSINESS ENVIRONMENT RESULTS ANALYSED SEGMENTAL PERFORMANCE ACQUISITIONS
working together to achieve great results
 19% Increase in headline earnings per share 18% Increase in dividend/distribution to ordinary shareholders Strong balance sheet and cash flows GRINDROD LIMITED results and final dividend announcement for
Nampak 2013 Interim Results
 Nampak 2013 Interim Results May 2013 1 Agenda Salient features Group results Operational review Strategic update Outlook 2 Salient Features Revenue up 7%, Africa up 19% Trading profit up 6% Profits from
A S X A N N O U N C E M E N T
 A S X A N N O U N C E M E N T DATE: 24 February 2016 Attached is the Presentation regarding Pact s Half year Financial Results for the half year ended 31 December 2015. The Presentation will occur at 10am
Profit and dividend announcement for the six months ended 31 December 2005
 Profit and dividend announcement for the six months ended 31 December 2005 Highlights Revenue +17% EBITDA +23% Adjusted HEPS +34% Dividends per share +50% Registration no 1967/007528/06, Share code: SUI,
WILMAR INTERNATIONAL LIMITED 4Q2016 Results Briefing. Feb 20, 2017
 WILMAR INTERNATIONAL LIMITED 4Q2016 Results Briefing Feb 20, 2017 IMPORTANT NOTICE Information in this presentation may contain projections and forward looking statements that reflect the Company s current
YEAR-END RESULTS for the 12 months ended 30 September 2018
 YEAR-END RESULTS 2018 for the 12 months ended 30 September 2018 HIGHLIGHTS AND GROUP STRATEGY DOMINIC SEWELA Group chief executive GROUP HIGHLIGHTS - 2018 HEPS growth % Total dividend per share (cents)
Income Statement. for the financial year ended 31 March 2011
 Income Statement for the financial year ended 31 March Continuing operations Revenue 5 1,220,183 1,141,964 Other income 6 3,776 2,350 Share of net loss of associate accounted for using the equity method
KAP INDUSTRIAL HOLDINGS LIMITED
 THIS DOCUMENT IS IMPORTANT AND REQUIRES YOUR IMMEDIATE ATTENTION The definitions commencing on page 6 of this Circular apply mutatis mutandis to this front cover and all sections of this Circular. ACTION
PEGAS NONWOVENS SA. First nine months of 2010 unaudited consolidated financial results
 PEGAS NONWOVENS SA First nine months of 2010 unaudited consolidated financial results November 25, 2010 PEGAS NONWOVENS SA announces its unaudited consolidated financial results for the first nine months
04 COMPANY FINANCIAL STATEMENTS
 04 COMPANY FINANCIAL STATEMENTS Statement of financial position at 28 February 2015 R 000 Notes 2015 2014 ASSETS Non-current assets 84 024 83 761 Investments and loans 2 84 024 83 761 Total assets 84
SAFCOL s Annual Financial Statements and Report For the year ended 31 March 2011
 SAFCOL s Annual Financial Statements and Report For the year ended 31 March 2011 Presented by Maureen Manyama-Matome Acting Chief Executive Officer 1 November 2011 Presentation GROWTH to the Portfolio
2011 Annual Results. November 2011
 2011 Annual Results November 2011 1 Agenda Highlights Group results Operational review Strategic review 2 Highlights HEPS from continuing operations up 21% Dividend increased by 30% to 108 cents per share
LyondellBasell Reports Second Quarter 2017 Earnings
 NEWS RELEASE FOR IMMEDIATE RELEASE HOUSTON and LONDON, July 28, 2017 LyondellBasell Reports Second Quarter 2017 Earnings Second Quarter 2017 Highlights Income from continuing operations: $1.1 billion EBITDA:
Interim results FY2018 GROUP HIGHLIGHTS
 01 Interim results FY2018 GROUP HIGHLIGHTS Trading environment overview Sept 17 headline CPI 5.1% (avg March Sept 5.1%) Interest rates between 10.25% & 10.50% since Jan 16 Labour force up 696k (employed
UNAUDITED CONDENSED CONSOLIDATED RESULTS FOR THE SIX MONTHS ENDED 30 SEPTEMBER
 UNAUDITED CONDENSED CONSOLIDATED RESULTS FOR THE SIX MONTHS ENDED 30 SEPTEMBER 2017 FINANCIAL HIGHLIGHTS REVENUE 2.7% TO R4.86 BILLION PROFIT FROM CONTINUING OPERATIONS 6.4% TO R314 MILLION PROFIT BEFORE
Aegis Group plc Half Year Results. 27 August 2010
 Aegis Group plc 2010 Half Year Results 27 August 2010 Agenda Introduction John Napier, Chairman Aegis Group overview Jerry Buhlmann, CEO Divisional review Aegis Media - Jerry Buhlmann, CEO Synovate Robert
INTERIM REPORT (UNAUDITED)
") INTERIM REPORT (UNAUDITED) FOR THE SIX MONTHS ENDED 31 DECEMBER INTERIM REPORT (UNAUDITED) FOR THE SIX MONTHS ENDED 31 DECEMBER ABAGOLD LIMITED DIRECTORATE Non-executive HR van der Merwe (Chairman of the
INTERIM REPORT (UNAUDITED) FOR THE SIX MONTHS ENDED 31 DECEMBER INTERIM REPORT (UNAUDITED) FOR THE SIX MONTHS ENDED 31 DECEMBER ABAGOLD LIMITED DIRECTORATE Non-executive HR van der Merwe (Chairman of the
Summary of Consolidated Financial Results for FY2017
 Summary of Consolidated Financial Results for FY2017 May 15, 2018 Mitsui Chemicals, Inc. 1. Summary of Income Statement (Unit : Billions of Yen) Net sales Operating income Ordinary income Profit attributable
UNAUDITED CONDENSED CONSOLIDATED INTERIM RESULTS
 UNAUDITED CONDENSED CONSOLIDATED INTERIM RESULTS FOR THE SIX MONTHS ENDED 31 DECEMBER 2014 RESULTS HIGHLIGHTS REVENUE 257% to R562.4m EBITDA 276% to R87.2m HEPS 118% to 14.4 cents DPS 3.5 cents 01 UNAUDITED
SIX MONTHS ENDED 30 SEPTEMBER 2018
 PRESENTATION TUESDAY, 20 NOVEMBER 2018 SIX MONTHS ENDED 30 SEPTEMBER 2018 CONTENTS PRESENTED BY Neil Birch Chief Executive Officer Harry Todd Chief Financial Officer 2 EXECUTIVE OVERVIEW 3 RESULTS SUMMARY
Section Content Page. Page 1
 Dynamic Colours Limited Incorporated in the Republic of Singapore (Company registration no. 199304233Z) Half Year 2017 Financial Statement and Dividend Announcement For the year ended 30 June 2017 Section
Interim Results 6 months ended 30 September 2008
 Interim Results 6 months ended 30 September 2008 2008 highlights Revenue + 15.9% Operating profit - 44.6% 3326,7 2871,4 315,7 2177,8 256,9 1915,2 214,2 174,8 2005 2006 2007 2008 2005 2006 2007 2008 Headline
Agenda. The Year in Review Group Financial Highlights Financial Review Divisional Review Order Book Acquisitions Major Projects Progress Conclusion
 Agenda The Year in Review Group Financial Highlights Financial Review Divisional Review Order Book Acquisitions Major Projects Progress Conclusion The Year in Review Satisfactory performance given market
HomeChoice International PLC summarised group financial statements for the year ended 31 December 2016 and cash dividend declaration
 HomeChoice International PLC summarised group financial statements for the year ended 31 December and cash dividend declaration HomeChoice International PLC 1 Commentary Group highlights sales up 25.1
Interim Financial Results
 SASOL LIMITED Additional Analyst yst Information for the six months ended 31 December 2018 Interim Financial Results for the six months ended 31 December 2018 Sasol is a global integrated chemicals and
TONGAAT HULETT AUDITED RESULTS FOR THE YEAR ENDED 31 MARCH 2011
 1 TONGAAT HULETT AUDITED RESULTS FOR THE YEAR ENDED 31 MARCH 2011 Revenue of R9,681 billion (2010: R8,789 billion) Profit from operations of R1,338 billion (2010: R1,500 billion) Headline earnings of R806
Notes to the consolidated financial statements
 Notes to the consolidated financial statements for the year ended 31 March 1. Accounting policies (the Company ) is a company domiciled in South Africa. The consolidated financial statements of the company
NORTHGATE PLC INTERIM RESULTS FOR THE SIX MONTHS ENDED 31 OCTOBER 2008
 9 December 2008 NORTHGATE PLC INTERIM RESULTS FOR THE SIX MONTHS ENDED 31 OCTOBER 2008 Northgate plc ( Northgate, the Company or the Group ), the UK and Spain s leading specialist in light commercial vehicle
Summary of Consolidated Financial Results for First Quarter of FY2018
 Summary of Consolidated Financial Results for First Quarter of Aug 2, 2018 Mitsui Chemicals, Inc. 1. Summary of Income Statement Net sales Operating income Ordinary income Profit attributable to owners
Bateleur Flexible Prescient Fund third quarter report back
 Bateleur Flexible Prescient Fund 2016 third quarter report back 01 Bateleur Flexible Prescient Fund ( the fund ) - 2016 third quarter report back The fund s unit price appreciated 2.1% in the third quarter
analyst book sasol limited forward-looking statements for the year ended 30 June 2008
 sasol limited forward-looking statements We may in this document make statements that are not historical facts and relate to analyses and other information based on forecasts of future results and estimates
REVIEWED CONDENSED GROUP INTERIM FINANCIAL STATEMENTS AND UNREVIEWED PRODUCTION AND SALES VOLUMES INFORMATION
 REVIEWED CONDENSED GROUP INTERIM FINANCIAL STATEMENTS AND UNREVIEWED PRODUCTION AND SALES VOLUMES INFORMATION for the six-month period ended 30 June 2017 REVIEWED CONDENSED GROUP ANNUAL FINANCIAL STATEMENTS
statements annual financial statements 70 Group salient features 71 Five-year summary of results Annexure a: interest-bearing borrowings
 annual financial statements Annual financial statements 70 Group salient features 71 Five-year summary of results 72 Summary of statistics 73 Definitions 74 Ordinary share ownership 75 Financial review
Total assets Total equity Total liabilities
 Group balance sheet as at 31 December Notes R 000 R 000 ASSETS Non-current assets Property, plant and equipment 3 3 263 500 3 166 800 Intangible assets 4 69 086 66 917 Retirement benefit asset 26 117 397
RESULTS PRESENTATION FOR THE 52 WEEKS ENDED 25 FEBRUARY 2018
 RESULTS PRESENTATION FOR THE 52 WEEKS ENDED 25 FEBRUARY 2018 1 Chairman s introduction Gareth Ackerman Chairman 2 3 Results overview Bakar Jakoet Chief Finance Officer Progress on our plan Richard Brasher
Jamaica Producers Group Limited UNAUDITED GROUP RESULTS 26 WEEKS ENDED JUNE 30, 2012
 For the 26-week period ended June 30, 2012 ( First Half ), net profit attributable to JP shareholders was $112 million (compared with $1,119 million for the 2011 First Half). Income during the 2011 First
Group UNAUDITED GROUP RESULTS FOR THE PERIOD ENDED 31 MARCH 2018,
 UNAUDITED GROUP RESULTS FOR THE PERIOD ENDED 31 MARCH 2018, SCRIP DISTRIBUTION WITH CASH DIVIDEND ALTERNATIVE, FURTHER CAUTIONARY AND TRADING STATEMENT Group LIFE HEALTHCARE UNAUDITED GROUP RESULTS 2018
JAYA TIASA HOLDINGS BHD (3751-V)
") JAYA TIASA HOLDINGS BHD (3751-V) - unaudited CONDENSED STATEMENTS OF PROFIT OR LOSS AND OTHER COMPREHENSIVE INCOME INDIVIDUAL QUARTER CUMULATIVE QUARTER 3 months ended 3 months ended 30/09/2017 30/09/2016
JAYA TIASA HOLDINGS BHD (3751-V) - unaudited CONDENSED STATEMENTS OF PROFIT OR LOSS AND OTHER COMPREHENSIVE INCOME INDIVIDUAL QUARTER CUMULATIVE QUARTER 3 months ended 3 months ended 30/09/2017 30/09/2016
INTERIM RESULTS ANNOUNCEMENT MONDAY, 25 FEBRUARY 2019 AT 10H00 JOHANNESBURG MEDIA PRESENTATION SPEAKER NOTES SASOL CFO PAUL VICTOR
 INTERIM RESULTS ANNOUNCEMENT MONDAY, 25 FEBRUARY 2019 AT 10H00 JOHANNESBURG MEDIA PRESENTATION SPEAKER NOTES SASOL CFO PAUL VICTOR SLIDE 12: TITLE SLIDE Thank you Steve and Bongani, and good morning ladies
INTERIM REPORT and. cash DISTRIBUTION
 INTERIM REPORT and cash DISTRIBUTION FOR THE SIX MONTHS ENDED 31 MARCH 2008 nampak limited (Registration number 1968/008070/06) (Incorporated in the Republic of South Africa) Share code: NPK ISIN: ZAE
Financial results for the year ended December 2013
 Financial results for the year ended December 2013 Agenda OVERVIEW Results overview and recent developments Results analysis Steel market overview Operating results Finance Other key issues and outlook
2005 INTERIM REPORT AND DIVIDEND ANNOUNCEMENT
 2005 INTERIM REPORT AND DIVIDEND ANNOUNCEMENT 80% increase in profit attributable to ordinary shareholders 73% increase in headline earnings per share 100% increase in interim dividend GRINDROD LIMITED
UNITED STATES SECURITIES AND EXCHANGE COMMISSION. Washington, D.C For the Quarterly Period Ended January 31, 2016 OR
 UNITED STATES SECURITIES AND EXCHANGE COMMISSION Washington, D.C. 20549 FORM 10-Q È QUARTERLY REPORT PURSUANT TO SECTION 13 OR 15(d) OF THE SECURITIES EXCHANGE ACT OF 1934 For the Quarterly Period Ended
Interim Results March Paul Stuiver - CEO
 Interim Results March 2012 Paul Stuiver - CEO 1 Agenda Context Financial Overview Divisional Overview Outlook Questions 2 Context For the six months from October 2011 to March 2012 The positive trend in
LyondellBasell Acquisition of A. Schulman
 LyondellBasell Acquisition of A. Schulman Creating an Advanced Polymer Solutions Leader February 15, 2018 1 Cautionary Note Regarding Forward-looking Statements The statements in this communication relating
Investor Presentation November 2011
 Investor Presentation November 2011 For further information contact: aston.swift@intertek.com +44 (0)20 7396 3400 1 Cautionary statement regarding forward-looking statements This presentation contains
AAFRICAN AFRICAN OXYGEN LIMITED Results 40. th annual results since listing
 AAFRICAN AFRICAN OXYGEN LIMITED 2004 Results 40 th annual results since listing 1 AAFROX Presenters Rick Hogben Cor van Zyl CE African Oxygen Limited Financial Director, African Oxygen Limited Panel Mike
Total assets
 GROUP BALANCE SHEET AS AT 31 DECEMBER Notes R 000 R 000 ASSETS Non-current assets Property, plant and equipment 3 3 166 800 2 697 148 Intangible assets 4 66 917 59 777 Retirement benefit asset 27 142 292
Audited results. for the year ended 29 February 2016
 results for the year ended 29 February 2016 Raubex Group Limited (Incorporated in the Republic of South Africa) Registration number 2006/023666/06 Share Code: RBX ISIN Code: ZAE000093183 ( Raubex or the