Annual Results Presentation. for the year ended 30 September 2014
|
|
|
- Bonnie Hicks
- 6 years ago
- Views:
Transcription

1 Annual Results Presentation for the year ended 30 September 2014
2 AGENDA Business Overview Poultry Industry Trends Financial Overview Industry Matters Prospects Q & A 2 2

3 BUSINESS OVERVIEW 3


4 THE PERIOD IN PERSPECTIVE The period under review reflects an improved performance compared to one of the worst trading periods during the past decade experienced by the poultry industry Revenue 13% Financial Indicators Operating profit Earnings per share 88% 62% Headline earnings per share 99% 4 4
5 THE PERIOD IN PERSPECTIVE Continued high total poultry imports, increasingly from Europe (June million bpw with local production at 19 million bpw refer slides 30 and 31) Record high local maize prices in February, March and April 2014 not in line with CBOT corn prices (refer slide 53) High soya bean prices for the same period exacerbating the impact of high maize costs on feed prices (refer slide 26) The Rand remained weak against the US Dollar negating most of the benefits of lower CBOT corn prices during F
6 THE PERIOD IN PERSPECTIVE A solid performance from the Feed division and an improved performance from the Poultry division have contributed positively to the Group s earnings The Group s integrated best cost business model proved its value with the business remaining more profitable versus an industry that has struggled over the same period Acquisition of selected assets on liquidation sales of various small-sized poultry producers A positive movement in net cash flow reduced the net debt to equity ratio to 8.9% (30 September 2013: 15.5%) 6 6

7 POULTRY DIVISION 7
 2 000 1 000 - F2013 F2014")

8 POULTRY DIVISION - OVERVIEW Revenue - R million Operating profit - R million (20) F2013 F2014 (70) (120) (112) F2013 F2014 Revenue up 16% Broiler volumes up 7% Broiler selling prices up 8% Operating profit up 193% Net margin 1.5% F2013: (1.9%) Feed costs up 2% 8 8
9 POULTRY DIVISION - OVERVIEW Average broiler feed prices increased year-on-year by 2.3% Broiler selling prices increased year-on-year by 7.9% Product mix improvement with IQF reducing by 1% and fresh and value added increasing by 1% and 2% respectively Broiler sales volumes increased year-on-year by 7.4% - higher placements Improved broiler production efficiencies - reduced mortality & improved FCR Continued high level of poultry imports June 7 million bpw and September 6,6 million bpw 9 9


10 POULTRY DIVISION SALES Product Mix F2013 F % 22% 4% 7% Tons 56% 3% 9% Tons 55% 9% 3% 10% 3% 10 10
11 BROILER PRODUCTION PERFORMANCES 120% 115% 110% 105% 100% 95% 90% 85% 80% 75% 70% Key indicators base-lined to 100% in 2009 F2009 F2010 F2011 F2012 F2013 F2014 Mortality Feed conversion (FCR) Efficiency factor (PEF) 11 11
12 BROILER PRODUCTION PERFORMANCES 106% 105% 104% (37.0 days) 103% 102% 101% 100% 99% 98% (34.3 days) 97% 96% 95% Key indicators base-lined to 100% in 2008 Key indicators base-lined to 100% in 2009 F2009 F2010 F2011 F2012 F2013 F2014 Slaughter age Live weight Processing yield 12 12
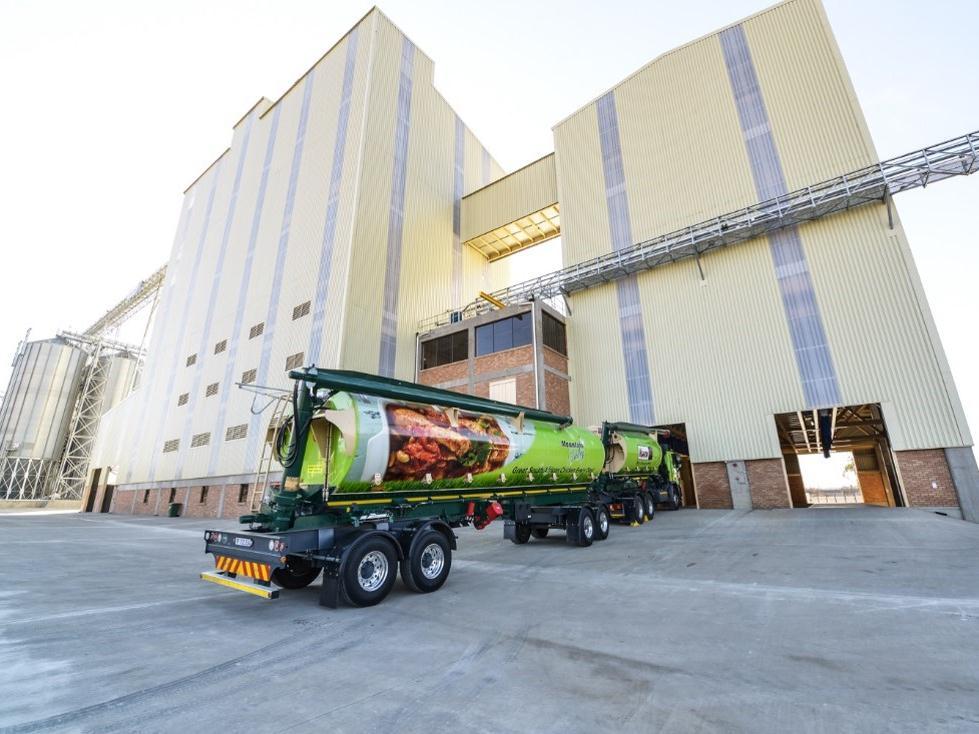
13 POULTRY DIVISION - PROSPECTS Projected lower feed costs in at least the first half of the new reporting period Broiler production efficiency improvement expected to continue Volume growth to approximately 5 million birds per week from October 2014 Improved product mix from the Tydstroom volumes in County Fair and the Mountain Valley expansion Provisional EU anti-dumping duties, permanent sanction required - Minister: DTI 13 13

14 FEED DIVISION 14
15 FEED DIVISION - OVERVIEW Revenue - R million Operating profit - R million F2013 F F2013 F2014 Revenue up 12% Sales volumes up 5% Avg. realisations up 7% Operating profit up 7% Net margin 6.4% F2013: 6.7% Rand per ton margin up 3% 15 15
16 FEED DIVISION - OVERVIEW Feed volumes increased by 4.5% due to higher inter-group volumes (up 12.9%) Rand per ton margin increased on prior year despite a competitive landscape Inflationary costs were successfully recovered from the market On-going management of credit risk Commissioning of the new Standerton feed mill in Q4 of F


17 FEED DIVISION SALES Meadow Feeds - Sales Mix F2013 F % 16% 22% Tons 49% 22% Tons 53% 11% 9% 17 17
18 FEED DIVISION - PROSPECTS Recently harvested maize crop of 14,3 million tons highest on record Softening of grain prices will benefit feed prices and livestock production costs External feed sales drive with due regard to credit risks Continued focus to invest in new cost saving technologies Focus on Rand per ton margins to continue New Standerton feed mill full year profit contribution in F

19 OTHER AFRICA DIVISION 19
20 OTHER AFRICA DIVISION - OVERVIEW Revenue - R million Operating profit - R million F F F F2014 Revenue up 13% Volumes up 4% Avg. realisations up 8% Operating profit down 23% Net margin 7% F2013: 10.2% Tiger Animal Feeds impact 20 20
21 OTHER AFRICA DIVISION - OVERVIEW Zambia Profitability at Tiger Animal Feeds impacted negatively by unfavourable raw material positions and the management thereof in 1H2014 Recovery in earnings in 2H2014 at Tiger Animal Feeds in line with expectations Tiger Chicks sales volumes increased by 79% following completion of expansion project Mozambique & Swaziland Good performance from Mozpintos following expansion of capacity and increase in own managed feed and day old chick outlets Good performance from National Chicks Swaziland with stringent cost control and improved sales through the own managed depot network 21 21


22 OTHER AFRICA DIVISION PROFIT SEGMENTATION F2013 Country PBIT Contribution F2014 Country PBIT Contribution 14% 23% 22% R45 million R35 million 47% 64% 30% 22 22
23 OTHER AFRICA DIVISION - PROSPECTS Zambia Maize and soya prices are at lower levels with Tiger Animal Feeds well positioned to take advantage of these The continued expansion of feed and day old chick outlets will improve product availability and competitive feed prices direct to farm Mozambique & Swaziland The production of hatching eggs in Mozambique at a lower cost than imported hatching eggs will contribute positively Expanding into further feed and day old chick outlets in Mozambique will further improve market penetration and sales of both DOC and feed Expansion of broiler breeder capacity at National Chicks Swaziland will increase the production of hatching eggs at a lower cost than imported hatching eggs 23 23

24 INDUSTRY TRENDS 24
25 SAFEX YELLOW MAIZE PRICE F2010 F2011 F2012 F2013 F2014 Source: CJA Strategic Risk Brokers 25 25
26 SAFEX SOYA BEANS PRICE F2010 F2011 F2012 F2013 F2014 Source: CJA Strategic Risk Brokers 26 26
27 27 INDUSTRY BROILER SELLING PRICES Oct-09 Dec-09 Feb-10 Apr-10 Jun-10 Aug-10 Oct-10 Dec-10 Feb-11 Apr-11 Jun-11 Aug-11 Oct-11 Dec-11 Feb-12 Apr-12 Jun-12 Aug-12 Oct-12 Dec-12 Feb-13 Apr-13 Jun-13 Aug-13 Oct-13 Dec-13 Feb-14 Apr-14 Jun-14 Aug-14 Broiler selling price Six month average Rand per kilogram Source: SAPA 27
28 Oct-09 Dec-09 Feb-10 Apr-10 Jun-10 Aug-10 Oct-10 Dec-10 Feb-11 Apr-11 Jun-11 Aug-11 Oct-11 Dec-11 Feb-12 Apr-12 Jun-12 Aug-12 Oct-12 Dec-12 Feb-13 Apr-13 Jun-13 Aug-13 Oct-13 Dec-13 Feb-14 Apr-14 Jun-14 Aug-14 Index (Oct 2009 = 100) BROILER PRICE VS FOOD PRICE INFLATION Poultry selling price index SA food price index Source: SAPA & CJA Strategic Risk Brokers 28 28
29 Oct-09 Dec-09 Feb-10 Apr-10 Jun-10 Aug-10 Oct-10 Dec-10 Feb-11 Apr-11 Jun-11 Aug-11 Oct-11 Dec-11 Feb-12 Apr-12 Jun-12 Aug-12 Oct-12 Dec-12 Feb-13 Apr-13 Jun-13 Aug-13 Oct-13 Dec-13 Feb-14 Apr-14 Jun-14 Aug-14 CHANGE IN BROILER SELLING PRICE VS FEED PRICE 40% 30% 20% 10% 0% -10% -20% -30% % Change in feed price % Change in broiler selling price Source: SAPA & Own Data 29 29


30 Oct-09 Dec-09 Feb-10 Apr-10 Jun-10 Aug-10 Oct-10 Dec-10 Feb-11 Apr-11 Jun-11 Aug-11 Oct-11 Dec-11 Feb-12 Apr-12 Jun-12 Aug-12 Oct-12 Dec-12 Feb-13 Apr-13 Jun-13 Aug-13 Oct-13 Dec-13 Feb-14 Apr-14 Jun-14 Aug-14 POULTRY IMPORTS PER MONTH Tons Total poultry imports 6 per. Mov. Avg. (Total poultry imports) Source: SAPA 30 30
31 TOTAL POULTRY IMPORTS (CHICKEN, TURKEY, MDM) Tons Oct Nov Dec Jan Feb Mar Apr May Jun Jul Aug Sep F F F F F F % Var bpw* 5,0 6,8 5,8 4,5 4,2 5,6 6,6 6,5 7,2 4,7 4,6 6,6 *bpw million birds per week F2011 F2012 F2013 F Source: SAPA

32 FINANCIAL OVERVIEW 32
33 ABRIDGED STATEMENT OF COMPREHENSIVE INCOME Year ended 30 September 2014 R million 2013 R million Revenue Operating profit Operating profit margin 5.1% 3.1% Profit on sale of business unit - 46 Profit before interest and tax Net finance costs (25) (27) Share of profit in associates 2 6 Profit before tax Tax (129) (77) Profit for the period Earnings % change 13% 88% 60% 63% 62% 63% Headline Earnings EPS Cents HEPS Cents % 62% 99% 33 33


34 GROUP ANNUAL REVENUE (R billion) Poultry Feed Other Africa Services & Ventures External revenue 34 34
35 POULTRY ANNUAL REVENUE (R million) H10 2H10 1H11 2H11 1H12 2H12 1H13 2H13 1H14 2H14 Revenue Change in realisations (SAPA) Change in volumes

36 FEED ANNUAL REVENUE (R million) H10 2H10 1H11 2H11 1H12 2H12 1H13 2H13 1H14 2H14 Revenue Change in volumes Change in feed price


37 GROUP ANNUAL OPERATING PROFIT 880 (R million) 14.8% % 14.0% % % % % % % % % % % % % % % % 8.0% 6.0% 4.0% % F2001 F2002 F2003 F2004 F2005 F2006 F2007 F2008 F2009 F2010 F2011 F2012 F2013 F2014 Poultry Feed Other Africa Services & Ventures 0.0% 37 37


 1H10 2H10 1H11 2H11 1H12")

38 GROUP ANNUAL OPERATING PROFIT (R million) 1H10 2H10 1H11 2H11 1H12 2H12 1H13 2H13 1H14 2H14 Poultry Feed Services & Ventures Other Africa Change in feed price Change in realisations (SAPA)
39 ABRIDGED STATEMENT OF FINANCIAL POSITION At 30 September 2014 R million 2013 R million % change Non-current assets Net working capital Current assets (excl. cash) Current liabilities (excl. borrowings) (1 551) (1 322) Non-current liabilities (excl. borrowings) (575) (548) Net assets % 13% 9% 17% 5% 8% Net debt % Loans Cash and cash equivalents (32) 78 Equity Total % 8% 39 39
40 ABRIDGED STATEMENT OF CASH FLOW For the year ended 30 September 2014 R million 2013 R million Cash operating profit Working capital movement 33 (151) Tax paid (100) (67) Net interest paid (37) (34) Capital expenditure (395) (235) 172 (99) Dividends paid (163) (129) Net increase in loans Other cash flow items Shares issued 65 - Movement in cash equivalents 110 (1) Opening balance (78) (77) Closing balance 32 (78) 40 40
41 CAPITAL EXPENDITURE Year ended 30 September 2014 R million 2013 R million Depreciation Replacement capex Expansion capex Total capex Commitments 56 Total spent and committed
42 KEY FINANCIAL RATIOS Sep-01 Sep-02 Sep-03 Sep-04 Sep-05 Sep-06 Sep-07 Sep-08 Sep-09 Sep-10 Sep-11 Sep-12 Sep-13 Sep-14 RONA ROE EBITDA margin PBIT margin Asset turn
43 KEY FINANCIAL INDICATORS Sep-01 Sep-02 Sep-03 Sep-04 Sep-05 Sep-06 Sep-07 Sep-08 Sep-09 Sep-10 Sep-11 Sep-12 Sep-13 Sep-14 NAV share Working capital days Net Debt / Equity 43 43

44 HEADLINE EARNINGS PER SHARE & DIVIDEND PER SHARE (Cents per share) F2001 F2002 F2003 F2004 F2005 F2006 F2007 F2008 F2009 F2010 F2011 F2012 F2013 F2014 Headline earnings per share Dividend per share 44 44

45 INDUSTRY MATTERS 45
46 INDUSTRY MATTERS ITAC accepted an application from SAPA for alleged dumping of poultry products from the EU after the industry showed evidence of financial harm Provisional anti-dumping duties were implemented against Germany, Netherlands and the United Kingdom on 4 July 2014, but expire on 2 January 2015 These duties will go some way in correcting the uneven playing field that has existed for some time and severely damaged the local industry Proposed brining levels of 8% by DAFF unresolved and SAPA has been notified of a roundtable discussion to take place with DAFF Astral supports the requirement for regulatory control around brining, however reducing the level to 8% will lead to excessive poultry price increases 46 46
47 PROSPECTS
48 PROSPECTS The slowing level of growth in the economy and higher unemployment levels will continue to depress consumer spending. It is of paramount importance that the EU anti-dumping measures are sanctioned on a more permanent basis by the Minister of Trade and Industry in order to stem the tide of dumped poultry products into South Africa. The recent South African harvest produced a record maize crop, and together with healthy global maize and soya crops the softening of grain prices will at least benefit feed prices and livestock production costs in the first half of the new reporting period

49 49

50 ADDITIONAL INFORMATION 50 50
51 SOUTH AFRICA - TOTAL MAIZE SUPPLY & DEMAND Marketing year (May to April) '000 tons 2009/ / / / / /15E 2015/16F Actual Actual Actual Actual Actual Estimate Forecast Carry In (1 May) Crop Estimate Sagis Delivery Minus early deliveries Imports Total Supply Domestic Usage Food Domestic Usage Feed Gristing, withdrawn & released Total Domestic Usage Exports & Sundries Plus early deliveries Carry Out (30 Apr) No of days usage STU 22.85% 24.20% 10.38% 14.81% 6.82% 18.13% 18.62% Source: CJA Strategic Risk Brokers 51 51

52 RSA MAIZE CARRY OUT AND STOCK TO USE RATIO 000 tons % 24.20% 25% % 18.62% 20% % 15% 10.38% % 10% 500 5% / / / / / /15E 2015/16F 0% Carry out Maize stock to use ratio Source: CJA Strategic Risk Brokers 52 52
53 SAFEX YELLOW MAIZE VS CBOT CORN IN RAND TERMS F2010 F2011 F2012 F2013 F2014 Source: CJA Strategic Risk Brokers 53 53
54 Oct-09 Dec-09 Feb-10 Apr-10 Jun-10 Aug-10 Oct-10 Dec-10 Feb-11 Apr-11 Jun-11 Aug-11 Oct-11 Dec-11 Feb-12 Apr-12 Jun-12 Aug-12 Oct-12 Dec-12 Feb-13 Apr-13 Jun-13 Aug-13 Oct-13 Dec-13 Feb-14 Apr-14 Jun-14 Aug-14 LOCAL BROILER PRODUCTION, IMPORTS & PER CAPITA CONSUMPTION Million birds per week / Rand per kg kg RSA broilers (slaughtered / week) Broiler selling price (Rand / kg) Poultry imports (birds / week) Per capita consumption (kg) Source: SAPA 54 54
55 BRAZIL & EUROPE PRODUCT COST BENCHMARK Ex BRAZIL - November 2014 FROZEN LEG QUARTERS BULK PACKED CIF DBN US$ per ton TON SA COST R/$ exchange rate R$ Rand per ton TON Rand per kg KG Duty per kg KG 37% 37% 37% - Clearance costs KG COST INTO STORAGE KG Storage KG Distribution KG Marketing, Administration, Finance KG TOTAL COST KG Ex UNITED KINGDOM - November 2014 FROZEN LEG QUARTERS BULK PACKED CIF DBN US$ per ton TON SA COST R/$ exchange rate R$ Rand per ton TON Rand per kg KG Duty per kg KG 22.03% 22.03% 22.03% - Clearance costs KG COST INTO STORAGE KG Storage KG Distribution KG Marketing, Administration, Finance KG TOTAL COST KG *United Kingdom & Netherlands import duty very similar at 22.03% and 22.81% respectively Export poultry selling prices between EU countries on par with one another 55 55
56 PRODUCER PRICE COMPARISON SA PROTEIN Cents per kg Sheep Beef Pork Chicken Chicken Pork Beef Sheep Feed Conversion Rate Per Capita Consumption 36.4 kg 4.6kg 17.2kg 3.2kg Source: SAPA & FNB 56 56

 12")
57 CONTACTS Chris Schutte Chief Executive Officer Tel : +27 (0) Fax : +27 (0) ces@astralfoods.com Tel: +27 (0) Fax: +27 (0) Astral Foods Corporate Office 92 Koranna Avenue, Doringkloof, Centurion, 0157, Gauteng, South Africa Daan Ferreira Group Financial Director Tel : +27 (0) Fax : +27 (0) daan.ferreira@astralfoods.com Website:
ANNUAL RESULTS PRESENTATION FOR THE 12 MONTHS ENDED 30 SEPTEMBER 2017
 ANNUAL RESULTS PRESENTATION FOR THE 12 MONTHS ENDED 30 SEPTEMBER 2017 AGENDA Business Overview Page 3 Industry Trends Page 20 The Period in Perspective Page 28 Financial Overview Page 30 Industry Matters
Annual Results Presentation for the 12 months ended 30 September 2018
 Annual Results Presentation for the 12 months ended 30 September 2018 AGENDA Business Page 3 / Slide 3 Operational Page 5 / Slide 8 Industry Trends Page 12 / Slide 21 Financial Page 16 / Slide 29 Outlook
Astral Foods Limited Incorporated in the Republic of South Africa Registration number 1978/003194/06 Share code: ARL ISIN: ZAE
 Astral Foods Limited Incorporated in the Republic of South Africa Registration number 1978/003194/06 Share code: ARL ISIN: ZAE000029757 AUDITED SUMMARY CONSOLIDATED RESULTS AND DIVIDEND DECLARATION FOR
Interim Results 6 months ended 30 September 2008
 Interim Results 6 months ended 30 September 2008 2008 highlights Revenue + 15.9% Operating profit - 44.6% 3326,7 2871,4 315,7 2177,8 256,9 1915,2 214,2 174,8 2005 2006 2007 2008 2005 2006 2007 2008 Headline
Rainbow Chicken Limited (RCL) Group audited results for the year ended 30 June 2012
 Group audited results for the year ended 30 June 2012") Rainbow Chicken Limited () Group audited results for the year ended 30 June 2012 29 August 2012 Introduction During the prior year changed its financial year-end from 31 March to 30 June to align with
Rainbow Chicken Limited () Group audited results for the year ended 30 June 2012 29 August 2012 Introduction During the prior year changed its financial year-end from 31 March to 30 June to align with
ASTRAL. Integrated Annual Report 2011 for the year ended 30 September. A leading Southern African integrated poultry producer
 Integrated Annual Report 2011 for the year ended 30 September ASTRAL A leading Southern African integrated poultry producer Astral Integrated Annual Report 2011 C Table of contents Profi le 1 Strategic
Financial Results for Third Quarter Ended Sep 30, Pilgrim s Pride Corporation (NASDAQ: PPC)
") Financial Results for Third Quarter Ended Sep 30, 2018 Pilgrim s Pride Corporation (NASDAQ: PPC) Cautionary Notes and Forward-Looking Statements Statements contained in this presentation that share our
Financial Results for Third Quarter Ended Sep 30, 2018 Pilgrim s Pride Corporation (NASDAQ: PPC) Cautionary Notes and Forward-Looking Statements Statements contained in this presentation that share our
Financial Results for Fourth Quarter and Year Ended December 30, Pilgrim s Pride Corporation (NASDAQ: PPC)
") Financial Results for Fourth Quarter and Year December 30, 2018 Pilgrim s Pride Corporation (NASDAQ: PPC) Cautionary Notes and Forward-Looking Statements Statements contained in this presentation that
Financial Results for Fourth Quarter and Year December 30, 2018 Pilgrim s Pride Corporation (NASDAQ: PPC) Cautionary Notes and Forward-Looking Statements Statements contained in this presentation that
Egg Entrepreneurship Records
 Egg Entrepreneurship Records Name 4-H Program Year PROJECT GOAL Setting goals and then checking progress on the attainment of those goals is an important part of 4-H. Complete the boxes 1-3 at the beginning
EU Market Situation for Poultry. Committee for the Common Organisation of the Agricultural Markets 22 March 2018
 EU Market Situation for Poultry Committee for the Common Organisation of the Agricultural Markets 22 March 218 -.2% -.8% -1.1% -2.4% -2.9% -3.3% -4.2% -4.5% 5.1% 4.6% 4.5% 3.8% 3.3% 2.7% 2.4% 1.5% 1.1%
Rainbow Chicken Limited (RCL) Interim results 6 month period ended 31 December 2012
 Interim results 6 month period ended 31 December 2012") Rainbow Chicken Limited () Interim results 6 month period ended 31 December 2012 20 February 2013 Introduction This presentation covers the results for the 6 month period to December 2012 Historic comparatives
Rainbow Chicken Limited () Interim results 6 month period ended 31 December 2012 20 February 2013 Introduction This presentation covers the results for the 6 month period to December 2012 Historic comparatives
EU Market Situation for Eggs. Committee for the Common Organisation of the Agricultural Markets 30 August 2018
 EU Market Situation for Eggs Committee for the Common Organisation of the Agricultural Markets 30 August 2018 F O R E C A S T EU production of eggs for consumption (expert forecast May 2018) Source : Experts
Group Results Presentation for the six months ended 31 March 2016
 Group Results Presentation for the six months ended 31 March 2016 Index Overview Financial performance Operational performance Outlook 2 Overview Noel Doyle Chief Operating Officer Disclaimer Forward-looking
last YEAR. 190 / 100 kg % Placings Broiler. Jul. Jul. Jan. Jan. Oct. Oct. Oct. Apr. Apr 125%
 POULTRY MEAT Last update: EVOLUTION 185.18 last YEAR 19 / 1 kg 18 + 1.9% -.1% 175 /1 kg carcase weight 17 4. 1.1 3. 6 3 2 4 1 2 Main Producers Poultry meat production ( 1 Tonnes product weight) ( Forecasts
EU Market Situation for Poultry. Committee for the Common Organisation of the Agricultural Markets 24 August 2017
 EU Market Situation for Poultry Committee for the Common Organisation of the Agricultural Markets 24 August 217 -7.2% -7.7% -1.6% -1.7% -1.7% -2.1% -2.5% 4.1% 3.6% 3.5% 2.8% 1.9% 1.2%.8%.8%.6%.4%.2%.%.%.%.%
Athens Greece May Months 2009 Results Presentation
 Athens Greece May 2009 3 Months 2009 Results Presentation NIREUS AQUACULTURE S.A. Nireus at a glance The leader in seabass and seabream fish farming - A fully integrated producer - Production facilities
International Trade and Investment
 Click to edit Master title style International Trade and Investment Agbiz Media Day 25 November 2016 11/25/2016 1 Outline Click to edit Master title style Half year 2016 Agricultural Export Performance
NIREUS AQUACULTURE S.A.
 Athens Greece 29 March 2013 12 Months 2012 Results Presentation NIREUS AQUACULTURE S.A. Main events 12M 2012 Total sales up +2.7% to 202.2 mi. Fish sales value up +5.5% to 163 mi., volume up +8.3% to 31.6
AUDITED RESULTS FOR THE YEAR ENDED 31 DECEMBER 2015
 AUDITED RESULTS FOR THE YEAR ENDED 31 DECEMBER 2015 AGENDA 2 1 Opening remarks / market update Richard 2 Financial results David 3 Operational review Richard 4 Strategy update Richard 5 Outlook Richard
Fall 2017 Crop Outlook Webinar
 Fall 2017 Crop Outlook Webinar Chris Hurt, Professor & Extension Ag. Economist James Mintert, Professor & Director, Center for Commercial Agriculture Fall 2017 Crop Outlook Webinar October 13, 2017 50%
ADMINISTERED PRICES AND AGRICULTURE. Christo Joubert CEO Forum 09 May
 ADMINISTERED PRICES AND AGRICULTURE Christo Joubert CEO Forum 09 May 2011 1 ON THE MENU Putting thing in context Administered and regulated prices: Some general trends Administered and regulated prices:
Spheria Australian Smaller Companies Fund
 29-Jun-18 $ 2.7686 $ 2.7603 $ 2.7520 28-Jun-18 $ 2.7764 $ 2.7681 $ 2.7598 27-Jun-18 $ 2.7804 $ 2.7721 $ 2.7638 26-Jun-18 $ 2.7857 $ 2.7774 $ 2.7690 25-Jun-18 $ 2.7931 $ 2.7848 $ 2.7764 22-Jun-18 $ 2.7771
NIREUS AQUACULTURE S.A.
 Athens Greece 30 May 2013 3 Months 2013 Results Presentation NIREUS AQUACULTURE S.A. Main events 3M 2013 Total Group sales up +1% to 44.6 mi. Exports up +2% to 35.7 mi - 80% of total sales. Cash generation
Text. improvement in earnings. Textdemand drove continued
 Good Textdemand drove continued improvement in earnings Text Presentation of the Q2/2018 results Martin Lindqvist, President & CEO Håkan Folin, CFO July 20, 2018 Agenda Market and demand trends Performance
2015 ANNUAL RESULTS PRESENTATION
 2015 ANNUAL RESULTS PRESENTATION Francois Kuttel & Imraan Soomra AGENDA Group Overview Financial Review Operational Review & Outlook Guidance GROUP OVERVIEW South Africa s most empowered listed company
CONTENTS. Investment case 2. Summary consolidated financial statements 55. Directors responsibility 55. About this report 4
 Integrated report 2016 OUR BRANDS CONTENTS Investment case 2 About this report 4 Quantum Foods at a glance 11 Value chain and business model 13 Financial and non-financial highlights 16 Business overview
Summary consolidated financial statements
 Incorporated in the Republic of South Africa Registration number: 2013/208598/06 Tax registration number 9095455193 Share code: QFH (ISIN code: ZAE000193686) ( Quantum Foods or the Group or the Company
Positive trend in earnings and strong cash flow
 Positive trend in earnings and strong cash flow Presentation of the Q3/2017 result Martin Lindqvist, President & CEO Håkan Folin, CFO October 25, 2017 Agenda Q3/2017 and performance by division Financials
SA Food Inflation Why all the fuss?
 SA Food Inflation Why all the fuss? Gina Schoeman Lead SA Economist February/March 211 The Food Map SA CPI Global EM SA CPI Food The Food Story SA SA Retail SA Manu SA Agri 2 Global food inflation Global
Jamaica Broilers Group Ltd. Commentary on un-audited 3rd quarter results
 1 Jamaica Broilers Group Ltd Commentary on un-audited 3rd quarter results The Directors of Jamaica Broilers Group Ltd are pleased to release the un-audited financial results for the quarter ended January
Focused on Profitable, Consistent Growth
 Focused on Profitable, Consistent Growth Investor Presentation May 2014 FORWARD-LOOKING STATEMENTS Certain information contained in this presentation may constitute forward-looking statements, such as
For personal use only
 Tegel Group Holdings Limited FY18 Interim Results Presentation 6 December 2017 1 TEGEL GROUP HOLDINGS FY18 INTERIM RESULTS PRESENTATION Disclaimer This presentation contains summary information about Tegel
2010 Annual Results. November 2010
 2010 Annual Results November 2010 1 Agenda Highlights Group results Operational review Strategic Update 2 Highlights Operating profit up 126% Trading margin improved from 5.8% to 8.3% Sale/closure of under-performers
DAILY MARKET REPORT 19 NOVEMBER 2018
 DAILY MARKET REPORT 19 NOVEMBER 2018 Unigrain (Pty) Ltd Tel. No. : +27 11 692 4400 Fax. No. : +27 11 412 1183 Economic Indicators Quote at 12h00 previous day Current quote Change % Change Rand/Dollar 14.20
ACE 427 Spring Lecture 6. by Professor Scott H. Irwin
 ACE 427 Spring 2013 Lecture 6 Forecasting Crop Prices with Futures Prices by Professor Scott H. Irwin Required Reading: Schwager, J.D. Ch. 2: For Beginners Only. Schwager on Futures: Fundamental Analysis,
Cattle Market And Controversy
 Cattle Market And Controversy Tri County Beef Cattle Merkting 2016 Jasper, TX April 21, 2016 David P. Anderson Professor and Extension Economist Overview Price Correction Increasing Beef Supply Price Relationships
Fourth Quarter 2014 Earnings Conference Call. 26 November 2014
 Fourth Quarter 2014 Earnings Conference Call 26 November 2014 Safe Harbor Statement & Disclosures The earnings call and accompanying material include forward-looking comments and information concerning
FEDERAL RESERVE BANK OF MINNEAPOLIS BANKING AND POLICY STUDIES
 FEDERAL RESERVE BANK OF MINNEAPOLIS BANKING AND POLICY STUDIES Minneapolis Options Report December 13 th Commodity Markets Option trading rose relative to two weeks ago to a more average level last week
SUMMARY AUDITED CONSOLIDATED FINANCIAL STATEMENTS
 Quantum Foods Holdings Ltd Incorporated in the Republic of South Africa Registration number: 2013/208598/06 Tax registration number: 9095455193 Share code: QFH (ISIN code: ZAE000193686) ( Quantum Foods
GRAIN HEDGE POSITION REPORT
 GRAIN HEDGE POSITION REPORT CROP: Corn DATE: April 16, 2006 LONG POSITION SHORT POSITION Total Grain on Hand 753896 Grain in Transit Total Offsite Grain Total Stocks 753896 Unpriced Grain Storage 106375
MARKET ANALYSIS REPORT NO 1 OF 2015: ONION
 MARKET ANALYSIS REPORT NO 1 OF 215: ONION 1. INTRODUCTION The purpose of this text is to analyze the onion marketing environment. This analysis will be updated on a quarterly basis. The interval covered
Yara International ASA Third Quarter results 2013
 Yara International ASA Third Quarter results 213 18 October 213 IR-Date: 213-1-18 1 Summary third quarter Strong results despite weaker commodity fertilizer markets 17% increase in deliveries including
AUDITED RESULTS FOR THE YEAR ENDED 31 DECEMBER 2016
 AUDITED RESULTS FOR THE YEAR ENDED 31 DECEMBER 2016 AGENDA 2 1 Opening remarks / market update 2 Financial results 3 Operational review 4 Strategy update 5 Outlook 1 2 3 4 5 OPENING REMARKS / MARKET UPDATE
CAL-MAINE FOODS, INC. May 2017
 CAL-MAINE FOODS, INC. May 2017 1 FORWARD-LOOKING STATEMENTS This presentation includes forward-looking statements, which are all statements other than historical facts, can be identified by use of words
UNAUDITED CONDENSED CONSOLIDATED INTERIM FINANCIAL STATEMENTS FOR THE SIX MONTHS ENDED 31 MARCH 2015
 UNAUDITED CONDENSED CONSOLIDATED INTERIM FINANCIAL STATEMENTS FOR THE SIX MONTHS ENDED 31 MARCH SALIENT FEATURES % Change Revenue R1 675 million R1 739 million (3.7%) Operating profit/(loss) R82 million
Urea makes new push higher Supply problems crop up just as demand for fertilizer rises By Bryce Knorr, grain market analyst
 Urea makes new push higher Supply problems crop up just as demand for fertilizer rises By Bryce Knorr, grain market analyst What passes for calm in the fertilizer market never seems to last long. Just
Interim Results. Six months ended 31 August 2016
 Interim Results Six months ended 31 August 2016 Stefanutti Stocks City A multi-disciplinary construction group (Vision) (Mission) 2 www.stefanuttistocks.com y 2 Agenda Six month overview Operational Overview
Notes: 1. Prior corresponding period (pcp) 12 months to 31 March Statutory EBITDA represents Net Profit After Tax (NPAT) + tax expense +
 12 months to 31 March Statutory EBITDA represents Net Profit After Tax (NPAT) + tax expense +") Notes: 1. Prior corresponding period (pcp) 12 months to 31 March 2013 2. Statutory EBITDA represents Net Profit After Tax (NPAT) + tax expense + finance costs + depreciation, amortisation and impairment
Notes: 1. Prior corresponding period (pcp) 12 months to 31 March 2013 2. Statutory EBITDA represents Net Profit After Tax (NPAT) + tax expense + finance costs + depreciation, amortisation and impairment
Indicators of the Kansas Economy
 Governor s Council of Economic Advisors Indicators of the Kansas Economy A Review of Economic Trends and the Kansas Economy 1000 S.W. Jackson St. Suite 100 Topeka, KS 66612-1354 Phone: (785) 296-0967 Fax:
Interim Results FOR THE SIX MONTHS ENDED 30 SEPTEMBER 2016
 Interim Results FOR THE SIX MONTHS ENDED 30 SEPTEMBER 2016 1 AGENDA INTRODUCTION Martin Davey, Chairman HIGHLIGHTS Adam Couch, CEO FINANCIAL REVIEW Mark Bottomley, Finance Director COMMERCIAL REVIEW Jim
TONGAAT HULETT AUDITED RESULTS FOR THE YEAR ENDED 31 MARCH 2011
 1 TONGAAT HULETT AUDITED RESULTS FOR THE YEAR ENDED 31 MARCH 2011 Revenue of R9,681 billion (2010: R8,789 billion) Profit from operations of R1,338 billion (2010: R1,500 billion) Headline earnings of R806
HUD NSP-1 Reporting Apr 2010 Grantee Report - New Mexico State Program
 HUD NSP-1 Reporting Apr 2010 Grantee Report - State Program State Program NSP-1 Grant Amount is $19,600,000 $9,355,381 (47.7%) has been committed $4,010,874 (20.5%) has been expended Grant Number HUD Region
Global Economic Prospects and the Developing Countries William Shaw December 1999
 Global Economic Prospects and the Developing Countries 2000 William Shaw December 1999 Prospects for Growth and Poverty Reduction in Developing Countries Recovery from financial crisis uneven International
March, 2010 JBS S.A. In God We Trust, Nature We Respect
 March, 2010 JBS S.A. 0 In God We Trust, Nature We Respect Our Values Excellence Planning Determination Discipline Availability Openness Simplicity 1 Agenda Company Overview Market Overview 4Q09 Highlights
Macroeconomic Outlook: Implications for Agriculture. It has been 26 years since we have experienced a significant recession
 Macroeconomic Outlook: Implications for Agriculture John B. Penson, Jr. Regents Professor and Stiles Professor of Agriculture Texas A&M University Our Recession History September 1902 August1904 23 May
Monthly US Lamb Market Update
 January 2018 Monthly US Lamb Market Update January 2018 Issue Prepared Exclusively for Meat & Livestock Australia - Sydney January 13, 2018 USA Domes c Lamb Market - Supply/Demand Situa on USDA will issue
Financial & Business Highlights For the Year Ended June 30, 2017
 Financial & Business Highlights For the Year Ended June, 17 17 16 15 14 13 12 Profit and Loss Account Operating Revenue 858 590 648 415 172 174 Investment gains net 5 162 909 825 322 516 Other 262 146
LOAN MARKET DATA AND ANALYTICS BY THOMSON REUTERS LPC
 LOAN MARKET DATA AND ANALYTICS BY THOMSON REUTERS LPC GLOBAL LOAN MARKET DATA AND ANALYTICS BY THOMSON REUTERS LPC Secondary Market Bid Levels: Europe Slide 2 European CLO New Issue Volume Monthly Slide
Soybeans face make or break moment Futures need a two-fer to avoid losses By Bryce Knorr, senior grain market analyst
 Soybeans face make or break moment Futures need a two-fer to avoid losses By Bryce Knorr, senior grain market analyst A year ago USDA shocked the market by cutting its forecast of soybean production, helping
Santiago, May 11 th, Results Presentation 1Q18
 Santiago, May 11 th, 2018 Results Presentation 1Q18 Agenda I. Highlights II. III. Financial Statements Supply, Demand and Prices IV. Farming Operation V. Prospects 2 Highlights EBIT 1Q18 USD 18.8 million
SHEEP & GOAT - MARKET SITUATION - DASHBOARD Last update: 25/04/2018
 75 57 25 29 EU Trade 1 611 1 813 1 886 1 765 1 438 1 21 212 213 EU India (up to Jan) United States China + H. Kong EU India (up to Jan) United States China + H. Kong Iran Japan Iran Japan World Trade New
Yara International ASA. 21 October 2011
 Yara International ASA Third quarter results 211 21 October 211 1 Summary third quarter Strong results driven by improved margins Strong demand outside Europe, satisfactory sales in Europe Sluiskil urea
Jakarta, April 5 th, Unofficial Translation
 Jakarta, April 5 th, 2017 Unofficial Translation Content Company Overview Operational Performance Financial Highlights Challenges & Strategies Appendix 2 An Introduction To Japfa Tbk Vertically integrated
Conference Call Second Quarter 2013 Financial Results. Presentation3
 Conference Call Second Quarter 2013 Financial Results Presentation3 August 2, 2013 Agenda 1 Agenda 1 2 Opening Remarks 2Q13 Highlights 3 Operating and Financial Review 4 Closing Remarks 5 Q&A 2 1 Alicorp
Nampak 2013 Interim Results
 Nampak 2013 Interim Results May 2013 1 Agenda Salient features Group results Operational review Strategic update Outlook 2 Salient Features Revenue up 7%, Africa up 19% Trading profit up 6% Profits from
XML Publisher Balance Sheet Vision Operations (USA) Feb-02
 Feb-02") Page:1 Apr-01 May-01 Jun-01 Jul-01 ASSETS Current Assets Cash and Short Term Investments 15,862,304 51,998,607 9,198,226 Accounts Receivable - Net of Allowance 2,560,786
Page:1 Apr-01 May-01 Jun-01 Jul-01 ASSETS Current Assets Cash and Short Term Investments 15,862,304 51,998,607 9,198,226 Accounts Receivable - Net of Allowance 2,560,786
Perdigão S.A. Investor Relations Av.Escola Politécnica São Paulo SP Phone: Fax
 Dear Shareholders, PERDIGÃO COMPANIES MANAGEMENT REPORT FIRST QUARTER 2005 Perdigão S.A. Stock Exchange Ticker Symbols: BOVESPA: PRGA4 Preferred PRGA3 - Commom Level I Corporate Governance NYSE: PDA ADR
Futures and Options Live Cattle Feeder Cattle. Tim Petry Livestock Marketing Economist NDSU Extension
 Futures and Options Live Cattle Feeder Cattle Tim Petry Livestock Marketing Economist NDSU Extension www.ndsu.edu/livestockeconomcs FutOpt-Jan2019 Price Risk Management Tools Cash forward contract Video
BEEF & VEAL MARKET SITUATION. "Single CMO" Management Committee 18 September 2014
 BEEF & VEAL MARKET SITUATION "Single CMO" Management Committee L I V E S T O C K JUNE SURVEY E.U. E V O L U T I O N T O T A L B O V I N E May/Jun %Var %Var %Var %Var TOT LIVESTOCK BOVINE < 1 Year BOVINE
Russia: Macro Outlook for 2019
 October 2018 Russia: Macro Outlook for 2019 Natalia Orlova Head of Alfa Bank Macro Insights +7 495 795 36 77 norlova@alfabank.ru Egypt Saudi Arabia Brazil S. Africa UAE Iraq China Japan US Mexico UK Russia
EU Market Situation for Eggs. Committee for the Common Organisation of the Agricultural Markets 22 March 2018
 EU Market Situation for Eggs Committee for the Common Organisation of the Agricultural Markets 22 March 218 F O R E C A S T EU production of eggs for consumption (expert forecast November 217) Source :
Is it time for a boneless beef trimmings derivative contract? David Farley 1 st March 2012
 Is it time for a boneless beef trimmings derivative contract? David Farley 1 st March 2012 Why does AAco care? 680,000 head of cattle Substantial price risk over which AAco has limited ability to take
Dairy Outlook. July By Jim Dunn Professor of Agricultural Economics, Penn State University. Market Psychology
 Dairy Outlook July 2013 By Jim Dunn Professor of Agricultural Economics, Penn State University Market Psychology The CME block price fell by 5% in the last month, ending 8.75 /lb. lower at $1.665/lb. Most
PRESENTATION Q Oslo, 19 February 2013 John Binde, CEO Ola Loe, CFO
 PRESENTATION Q4 2012 Oslo, 19 February 2013 John Binde, CEO Ola Loe, CFO AGENDA: Highlights for the period Segment information Group financials Outlook 2 Highlights in Q4 2012: Significant improvement
Emerging Trends in the Regional Economy
 Emerging Trends in the Regional Economy Alison Felix Economist & Branch Executive Federal Reserve Bank of Kansas City Denver Branch The views expressed are those of the presenter and do not necessarily
Charoen Pokphand Foods Plc.
 Charoen Pokphand Foods Plc. Content Quick Facts 9M13 Results September 30, 2013 Financial Status Appendix A: Product Sample & Retail Outlet Format B: Highlights: Q213 Results C: 3Yr Historical Results
April Domestic Exports Imports. Volume Tonnes SW. MAT Apr-16 4, ,332 33, , % Change 2.8% 4.3% 12.6% 5.9% 2.9% 4.
 April 2017 Overview Table 1.1 Overview trends for Domestic, Export and Import trade Domestic Exports Imports Month Slaughter Pigmeat (Tonnes) Volume Tonnes SW Value $AUD (Million) Volume Tonnes SW Value
Charoen Pokphand Foods Plc.
 Charoen Pokphand Foods Plc. DR Kurobuta Premium Pork W RLD 9M12: Results Briefing November 13, 2012 Content CPF in Brief 9M12 Results September 30, 2012 Financial Status Appendix A: Highlights: Q312 Results
Yara International ASA 2017 fourth quarter results. 8 February 2018
 Yara International ASA 217 fourth quarter results 8 February 218 Safe operations is our first priority 4.5 4. TRI (Total recordable injuries 12-month rolling) 1 3.5 3. 2.5 2. 1.5 Jan Feb Mar Apr May Jun
INVESTOR PRESENTATION JUNE 2018
 INVESTOR PRESENTATION JUNE 2018 0 FORWARD-LOOKING STATEMENTS Forward-Looking Statements This presentation contains forward-looking statements that are subject to risks and uncertainties. All statements
and sale of day-old broilers and hatching eggs.
 2 0 0 5 a n n u a l r e p o r t Profile Astral Foods is a leading South African food group with key activities in animal feed, animal feed pre-mix, broiler genetics, broiler operations and the production
RESULTS PRESENTATION FOR THE SIX MONTHS ENDED 30 JUNE 2018 PRESENTED BY ZANELE MATLALA (CEO) AND KAJAL BISSESSOR (FD)
 AND KAJAL BISSESSOR (FD)") RESULTS PRESENTATION FOR THE SIX MONTHS ENDED 30 JUNE 2018 i PRESENTED BY ZANELE MATLALA (CEO) AND KAJAL BISSESSOR (FD) Merafe Resources Ltd Results presentation for the year ended 31 December 2017 LEGAL
RESULTS PRESENTATION FOR THE SIX MONTHS ENDED 30 JUNE 2018 i PRESENTED BY ZANELE MATLALA (CEO) AND KAJAL BISSESSOR (FD) Merafe Resources Ltd Results presentation for the year ended 31 December 2017 LEGAL
It s time to book 2018 fertilizer Focus on nitrogen first, using right tool for each market By Bryce Knorr, grain market analyst
 It s time to book 2018 fertilizer Focus on nitrogen first, using right tool for each market By Bryce Knorr, grain market analyst A slump in nitrogen costs this summer gives growers a chance to lock in
Sri Trang Agro-Industry Public Company Limited
 Sri Trang Agro-Industry Public Company Limited Management Discussion and Analysis, Q3 2013 14 th November 2013 STA : A World Leading Natural Rubber Player Financial result overview Our strategic plan to
In this week s issue:
 5 th December, 2016 Vol.3. No.49 WARMA Gives Farmers up to 31 st December 2016 to Register All Water Facilities WARMA Management is urging all farmers with unregistered water facilities on farms to register
MARKET BRIEF: RAISINS
 Statistics & Marketing Information Dept. MARKET BRIEF: RAISINS An Overview of Export Growth MARKET BRIEF Raisins This publication was prepared by USAID s Agricultural Credit Enhancement Program in collaboration
Informed Storage: Understanding the Risks and Opportunities
 Art Informed Storage: Understanding the Risks and Opportunities Randy Fortenbery School of Economic Sciences College of Agricultural, Human, and Natural Resource Sciences Washington State University The
Nampak 2013 Annual Results
 Nampak 2013 Annual Results November 2013 Summary of Results HEPS up 8% EPS up 13% Operating profit up 8% Africa trading profit up 60% Improvement in working capital management ROE 22% Dividend up 8% to
2018 Half Year Results
 A GLOBAL LEADER IN METAL FLOW ENGINEERING 2018 Half Year Results 26 July 2018 Patrick André Chief Executive 1 Disclaimer This presentation, which has been prepared by Vesuvius plc (the Company ), includes
INVESTOR PRESENTATION JANUARY 2018
 INVESTOR PRESENTATION JANUARY 2018 0 FORWARD-LOOKING STATEMENTS Forward-Looking Statements This presentation contains forward-looking statements that are subject to risks and uncertainties. All statements
TONGAAT HULETT INTERIM RESULTS FOR THE HALF-YEAR ENDED 30 SEPTEMBER 2011
 1 TONGAAT HULETT INTERIM RESULTS FOR THE HALF-YEAR ENDED 30 SEPTEMBER 2011 Revenue of R6,027 billion (2010: R4,724 billion) +27,6% Profit from operations of R1,047 billion (2010: R963 million) +8,7% Total
Executive Summary. July 17, 2015
 Executive Summary July 17, 2015 The Revenue Estimating Conference adopted interest rates for use in the state budgeting process. The adopted interest rates take into consideration current benchmark rates
Commodity Risk Through the Eyes of an Ag Lender
 Commodity Risk Through the Eyes of an Ag Lender Wisconsin Banker s Association April 5 th, 2017 Michael Irgang, Executive Vice President 1 Michael Irgang: Bio Michael Irgang is currently Executive Vice
BELL EQUIPMENT LTD Final Results Announcement & Business Review. March Prepared for the Challenging Year ahead.
 BELL EQUIPMENT LTD 2008 Final Results Announcement & Business Review March 2009 Agenda Synopsis 2008 Financial Results 2008 Understanding BELL EQUIPMENT Market View 2009-2010 Strategy Cash Flow Initiatives
Development of Economy and Financial Markets of Kazakhstan
 Development of Economy and Financial Markets of Kazakhstan National Bank of Kazakhstan Macroeconomic development GDP, real growth, % 116 112 18 14 1 113,5 11,7 216,7223,8226,5 19,8 19,8 19,3 19,619,7 199,
PERSONAL TAX INFORMATION WORKSHEET
 PERSONAL TAX INFORMATION WORKSHEET Please check the appropriate box: Date Received: I need my taxes done early for my child s financial aid. Most of the information needed to complete this form can be
BANK of ZAMBIA MONETARY POLICY STATEMENT
 BANK of ZAMBIA MONETARY POLICY STATEMENT JULY DECEMBER 2012 Bank of Zambia Mission Statement The principal purpose of the Bank of Zambia is to formulate and implement monetary and supervisory policies
4Q16 and 2016 Results
 JBS S.A. (BVM&FBOVESPA: JBSS3; OTCQX: JBSAY) São Paulo, March 13 th, 2017 and 2016 Results JBS Ended With Net Income of R$693.9 million and a free cash generation of R$2.9 billion JBS ended with net revenues
Summit Strategies Group 8182 Maryland Avenue, 6th Floor St. Louis, Missouri
 Summit Strategies Group 8182 Maryland Avenue, 6th Floor St. Louis, Missouri 63105 314.727.7211 Quarterly Review Global Equity Market Update GLOBAL EQUITY MARKETS CALENDAR YEAR RETURNS 2002 2003 2004 2005
EU Pigmeat Market Situation. Meat Market Observatory Economic Board meeting 02 October 2018
 EU Pigmeat Market Situation Meat Market Observatory Economic Board meeting 2 October 218 EXCHANGE RATE INDEX/EURO 14 Index of daily exchange rates of the main trading partners compared to the Euro 13 12