Agenda. Salient features. Group financial results. Operational review. The way forward
|
|
|
- Hilary Garey Knight
- 6 years ago
- Views:
Transcription

1 2009 Group Results
2 Agenda Salient features Group financial results Operational review The way forward 2
3 Salient Features Turnover up 6% Volumes down 6% Trading income down 27% Cash from operations R2.2bn HEPS down 53% Dividend reduced to 42 cents 3
4 GROUP FINANCIAL RESULTS 4
5 Group Income Statement Rm % Revenue Trading income before abnormal items Abnormal items Profit from operations Net finance costs Income from investments 6 5 Share of profit from associates 1 9 Profit before tax Income tax Profit for the year HEPS 83.8c 177.3c 53 5
6 Abnormal Items Rm Impairment of goodwill, plant, property & investments Retrenchment and restructuring Fair value of financial instruments Impairment of loans to minority shareholders 37 - Share based payment expense Net profit on disposal of property and business Thorpe fire loss - 51 Onerous lease provision reversed/raised Thorpe fire insurance proceeds
7 Tax Rate Rm 2009 Profit before tax 272 Tax 70 Effective tax rate 25.8% Government incentives 11.4% Deferred tax assets 10.4% Prior year adjustments 7.3% Disallowable expenses 16.1% Disallowed impairments 5.4% Other 5.4% Standard tax rate 28.0% 7

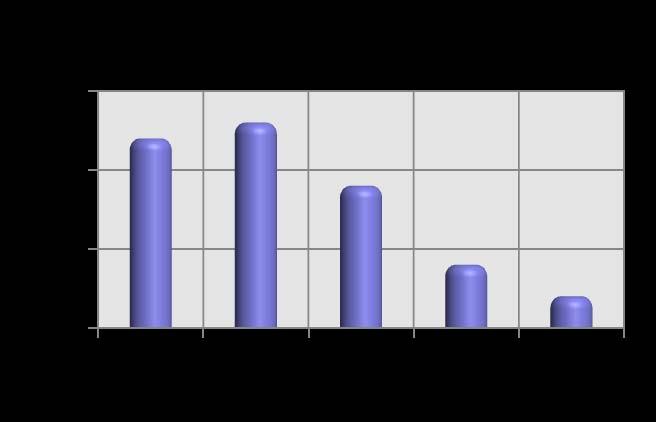
8 HEPS/Dividends per Share cents 8
9 Abridged Balance Sheet Rm Non-current assets Current assets Assets held for sale TOTAL ASSETS Total equity Non-current liabilities Current liabilities Liabilities associated with assets held for sale 80 - TOTAL EQUITY AND LIABILITIES
10 Cash Generated from Operations Rm 10
11 Major Capex Projects Division Project Rm Angola Beverage can factory 370 Corrugated Paper mill 118 Glass Cullet plant 48 Liquid New milk bottle 26 Cartons & Labels Size 3 press 24 Tissue 10 s packaging 20 TOTAL
12 Working Capital Rm Net Working Capital September Translation diffs and other non-cash movements -345 Fair value of financial instruments -36 Inventory 173 Receivables -204 Payables September
13 Group Condensed Cash Flow Rm Operating profit before working capital changes Working capital changes 198 Cash generated from operations Net interest paid 364 Tax paid 416 Dividends/cash distribution paid 529 Capex Net borrowings repaid 473 Other 76 Net cash outflow


14 Net Debt Rm 52% 43% 14


15 Key Ratios 15
16 OPERATIONAL REVIEW 16
17 Geographical Segmentation Rm Revenue Trading income Margin % South Africa Rest of Africa Europe Eliminations
18 Metals & Glass Rm Revenue Trading income Margin % Africa Tinplate price increase recovered Beverage can volumes down 4% in SA Food can volumes up 5% Diversified cans down 11% generally higher margin Glass plant at full capacity improved manufacturing efficiencies Nigeria profitable Angolan project approval still awaited 18
19 Paper Revenue Trading income Margin % Africa Rm Europe m Substantial loss in Corrugated 19


20 Corrugated Trading loss R250m Mill capex R504m final cost R798m Commissioned 6 months late Volumes down 10% plus margin pressure R274m impairment Overdue debtors reduced from R135m in 2008 to R50m in Sep 2009 Tons per hour 20
21 Paper Revenue Trading income Margin % Africa Rm Europe m Substantial loss in Corrugated Weak demand for cartons & labels except fast-foods Tissue had a good year Good performance from Sacks Nigeria performed well but affected by devaluation of Naira Big loss in Leeds Losses in smaller businesses R29m 21
22 Plastics Revenue Trading income Margin % Africa Rm Europe m Lower polymer prices helped margin stability Good demand for milk, juice and CSD bottles in South Africa Crates, drums, tubes & tubs down Strong demand for wine closures Zambia had an excellent year Europe affected by liquidation of major customer 22
23 THE WAY FORWARD 23
24 The Way Forward 10 years of underperformance Strategic review March 2009 Strategic Plan Conclusion 24
25 NAMPAK A 10 YEAR UNDERPERFORMER 25
26 Nampak Market Cap Ranking Ranking R9.4bn 30 R31.5bn R10.0bn R11.3bn 26


27 Nampak vs Alsi index ALSI Nampak 27


28 Nampak vs INDI 25 index INDI 25 Nampak 28
29 Media Perception Nampak never fails to disappoint, it always disappoints, Moneyweb Oct 09 If there was a prize for disappointing, Nampak would be right up there, Moneyweb Oct 09 The perpetually underperforming packaging company, Nampak, Sunday Times, Nov 09 29
30 STRATEGIC REVIEW MARCH
31 Strategic Review 80% of Nampak operations are profitable and have sustainable competitive advantages in markets in which they operate 31


32 Bevcan Sole supplier of beverage cans in South Africa High barriers to entry National geographic spread of plants 32


33 DivFood 85% market share of food cans Sole supplier of aluminium aerosol cans in South Africa Leading supplier of other metal cans 33

34 Glass Only two players Nampak 20%, Consol 80% High barriers to entry 34


35 Liquid/Petpak >50% market share of milk bottle market In-plant technology Systems approach Geographical footprint 35


36 Nampak Plastics Europe >60% market share Low cost model In-plants and geographical footprint Long-term contracts 36


37 Closures Sole supplier of twist-off closures Only 2 suppliers of ROPP closures Manufacturing licences 37
38 Tissue Established and trusted brands o Largest single-ply tissue brand o 2 nd largest 2-ply brand o Cuddlers 3 rd largest diaper brand o Lifestyle 2 nd largest fempro brand National footprint Control of recycled raw material 38
39 Nigeria Only manufacturer of cigarette packaging BAT long-term contract Other folding carton business Superior equipment Growing consumer market Opportunities to expand metal packaging 39
40 Zambia Mini Nampak o Crowns o Steel drums o Plastic crates o Folding cartons o Corrugated o Liquid cartons o Plastic bottles 40
41 Strategic Review 80% of Nampak operations are profitable and have sustainable competitive advantages in markets in which they operate 20% of Nampak operations are loss-making or earning returns less than hurdle rates and have been in this position for a number of years and have no sustainable competitive advantages 41


42 Corrugated Limited pricing power Low barriers to entry in converting Not cost-competitive Overcapacity 42
43 Other Underperformers Flexpak - sold Foam - closed Others in progress No Further Capex 43
44 Strategic Review 80% of Nampak operations are profitable and have sustainable competitive advantages in markets in which they operate 20% of Nampak operations are loss-making or earning returns less than hurdle rates and have been in this position for a number of years and have no sustainable competitive advantages Very high capex 44

45 Total Group Capex Rm Total R5.6bn 45

46 Capex on Underperformers Rm Total R1.4bn 46
47 Strategic Review 80% of Nampak operations are profitable and have sustainable competitive advantages in markets in which they operate 20% of Nampak operations are loss-making or earning returns less than hurdle rates and have been in this position for a number of years and have no sustainable competitive advantages Very high capex High debt levels 47


48 Net Debt Rm 0.3X 0.7X 0.8X 1.3X 1.4X 48
49 Strategic Review 80% of Nampak operations are profitable and have sustainable competitive advantages in markets in which they operate 20% of Nampak operations are loss-making or earning returns less than hurdle rates and have been in this position for a number of years and have no sustainable competitive advantages Very high capex High debt levels Lack of operational focus 49
50 Strategic Review 80% of Nampak operations are profitable and have sustainable competitive advantages in markets in which they operate 20% of Nampak operations are loss-making or earning returns less than hurdle rates and have been in this position for a number of years and have no sustainable competitive advantages Very high capex High debt levels Lack of operational focus High group and head office costs 50
51 STRATEGIC PLAN 51
52 Strategic Plan Grow our core profitable operations 52


53 Angola

54 2-Piece Food Can Production 54

55 New Business in Nigeria 55

56 2-ply Tissue Growth tons 56


57 Other Growth Products 57
58 Strategic Plan Grow our core profitable operations (80%) Non-performing operations being fixed/sold/closed (20%) o Industry solutions/rationalisation being pursued where appropriate o No further capex on non-performers Corrugated improvement Leeds break-even Flexpak sold Foam closed Others 58
59 Strategic Plan Grow our core profitable operations (80%) Non-performing operations being fixed/sold/closed (20%) o Industry solutions/rationalisation being pursued where appropriate o No further capex on non-performers Corrugated improvement Leeds break-even Flexpak sold Foam closed Others Capex< depreciation for next 2/3 years 59
60 Strategic Plan Grow our core profitable operations (80%) Non-performing operations being fixed/sold/closed (20%) o Industry solutions/rationalisation being pursued where appropriate o No further capex on non-performers Corrugated improvement Leeds break-even Flexpak sold Foam closed Others Capex< depreciation for next 2/3 years New management structure and decentraliased/operational focus 60

61 Executive Management Structure AB Marshall Chief Executive Officer* G Griffiths Chief Financial Officer* CH Bromley Metals & Glass Bevcan DivFood Glass Research & Development HMT Reid Europe Cartons Healthcare Plastics FV Tshiqi Group HR Transformation* RG Morris Paper & Flexibles Cartons & Labels Corrugated Flexibles L &CP Sacks Interpak Books Disaki Cores & Tubes Redibox PA de Weerdt Rigid Plastics Closures Liquid Megapak Petpak Tubes & Tubs SE Msane DivFood NP O Brien Group Legal Insurance Secretarial K Nzimande Tissue * Executive Directors Mar Sep more operationally focused 61


62 Board Changes Current Members Non-executive Retired/resigned Executive 62
63 Strategic Plan Grow our core profitable operations (80%) Non-performing operations being fixed/sold/closed (20%) o Industry solutions/rationalisation being pursued where appropriate o No further capex on non-performers Industry solutions Capex < depreciation for next 2/3 years New management structure and decentralised/operational focus R35m reduction in head office costs 63
64 Strategic Plan Grow our core profitable operations (80%) Non-performing operations being fixed/sold/closed (20%) o Industry solutions/rationalisation being pursued where appropriate o No further capex on non-performers Industry solutions Capex < depreciation for next 2/3 years New management structure and decentralised/operational focus R35m reduction in head office costs Reduced debt and interest charges 64
65 Conclusion 80% of Nampak is profitable with strong market positions GROW 20% is loss-making and needs to be fixed/sold/closed Capex restricted Further cost reductions Operational, hand-on management ACTION and IMPLEMENTATION 65
66 THANK YOU 66
2010 Annual Results. November 2010
 2010 Annual Results November 2010 1 Agenda Highlights Group results Operational review Strategic Update 2 Highlights Operating profit up 126% Trading margin improved from 5.8% to 8.3% Sale/closure of under-performers
2011 Annual Results. November 2011
 2011 Annual Results November 2011 1 Agenda Highlights Group results Operational review Strategic review 2 Highlights HEPS from continuing operations up 21% Dividend increased by 30% to 108 cents per share
Interim Results May 2006
 Interim Results May 2006 Agenda Group results Segmental performance Growth prospects Income Statement Rm 2006 2005 % Comments Revenue 7 845 7 910-1 + 4% ex Peters Papers Profit before abnormal items 798
Nampak 2012 Annual Results
 Nampak 2012 Annual Results November 2012 1 Highlights cents 250 Headline Earnings per Share continuing operations 200 150 142.3 172.4 200.8 100 73.9 50 0 2009 2010 2011 2012 2 Highlights Rm 1,800 1,600
Nampak 2013 Annual Results
 Nampak 2013 Annual Results November 2013 Summary of Results HEPS up 8% EPS up 13% Operating profit up 8% Africa trading profit up 60% Improvement in working capital management ROE 22% Dividend up 8% to
Nampak 2013 Interim Results
 Nampak 2013 Interim Results May 2013 1 Agenda Salient features Group results Operational review Strategic update Outlook 2 Salient Features Revenue up 7%, Africa up 19% Trading profit up 6% Profits from
Interim Results May 2007
 Interim Results May 2007 Salient Features Volume growth in South Africa up 4% Revenue up 11% Costs well-controlled Trading income up 15% HEPS before fair value adjustment up 17% Income Statement Rm 2007
Annual Results November 2015
 Annual Results 2015 November 2015 Forward looking statements We may make statements that are not historical facts and relate to analyses and other information based on forecasts of future results and estimates
+13% Nampak enriches peoples lives every day through the provision of. HEPS from continuing operations. EPS from continuing operations +17%
 Interim report and dividend declaration for the six months ended 31 March 2012 Nampak enriches peoples lives every day through the provision of wine bottles flavoured alcoholic beverages tissue products
Nampak Limited Audited Group results and dividend declaration for the year ended 30 September 2013
 AUDITED GROUP RESULTS AND DIVIDEND DECLARATION FOR THE YEAR ENDED 30 SEPTEMBER 2013 Nampak Limited Audited Group results and dividend declaration for the year ended 30 September 2013 1 Highlights Trading
Annual Results November 2016
 Annual Results 2016 November 2016 Forward looking statements We may make statements that are not historical facts and relate to analyses and other information based on forecasts of future results and estimates
INTERIM REPORT and. cash DISTRIBUTION
 INTERIM REPORT and cash DISTRIBUTION FOR THE SIX MONTHS ENDED 31 MARCH 2008 nampak limited (Registration number 1968/008070/06) (Incorporated in the Republic of South Africa) Share code: NPK ISIN: ZAE
AUDITED GROUP RESULTS FOR THE YEAR ENDED 30 SEPTEMBER 2007
 AUDITED GROUP RESULTS FOR THE YEAR ENDED 30 SEPTEMBER 2007 Revenue up 12% Trading income up 18% Headline earnings per share up 22% Cash distribution up 20% CONDENSED GROUP INCOME STATEMENT 2007 2006 Change
UNAUDITED GROUP RESULTS AND DIVIDEND DECLARATION
 UNAUDITED GROUP RESULTS AND DIVIDEND DECLARATION For the half year ended 31 March 2015 GROUP REVENUE FROM CONTINUING OPERATIONS UP 16% GROUP OPERATING PROFIT FROM CONTINUING OPERATIONS DOWN 9%, FOLLOWING
AUDITED GROUP RESULTS AND DIVIDEND DECLARATION. For the year ended 30 September 2015
 AUDITED GROUP RESULTS AND DIVIDEND DECLARATION For the year ended 30 September 2015 GROUP REVENUE FROM CONTINUING OPERATIONS UP 13% GROUP TRADING PROFIT FROM CONTINUING OPERATIONS UP 10%, IN SPITE OF A
Nampak Overview March 2016
 Nampak Overview March 2016 Forward looking statements We may make statements that are not historical facts and relate to analyses and other information based on forecasts of future results and estimates
Interim Results 2018
 Interim Results 2018 Forward looking statements We may make statements that are not historical facts and relate to analyses and other information based on forecasts of future results and estimates of amounts
nampak limited annual report 2010
 nampak limited annual report 2010 , 1 Financial highlights 2 Segments at a glance 4 Directorate 6 Group executive committee 10 Chairman s review 12 Chief executive s report 18 Operational review 26 Chief
Nampak Limited profile. Contents
 Annual Report 2009 Nampak Limited profile Contents ifc corporate profi le 1 key features of the year 2 group at a glance 4 directorate 6 group executive committee 8 chairman s review 12 chief executive
First-half Results June 2016
 First-half Results 2016 June 2016 Forward looking statements We may make statements that are not historical facts and relate to analyses and other information based on forecasts of future results and estimates
Summarised consolidated financial results
 Summarised consolidated financial results For the six months ended 31 March 2018 Revenue increased to Trading profit increased to HEPS increased by R8.8 bn R1.2 bn 10% up by 2 % up by 7% to 132.0 cents
About this report. Scope and boundary of the report. Nampak s management structure. Nampak s reporting approach
 Integrated Annual Report 2011 About this report Nampak s management structure The Nampak group is managed according to raw material and product type in South Africa and according to geography in the rest
Welcome to Nampak s Investor Day
 Welcome to Nampak s Investor Day Durban: 11 September 2013 1 Programme for the Day Beverage Cans and Glass - Charles Bromley Africa growth Rob Morris Nampak Flexible Clinton Farndell Aerosol investment
31/05/2017 SENS Article
 NAMPAK LIMITED Unaudited group results and ordin 30 May 2017 Close NPK 201705300042A Unaudited group results and ordinary dividend announcement for the half year ended 31 March 2017 Nampak Limited (Registration
VOLUNTARY TRADING UPDATE FOR THE FIVE MONTHS TO 28 FEBRUARY 2018
 SENS ANNOUNCEMENT - Nampak Limited (Incorporated in the Republic of South Africa) Registration Number: 1968/008070/06 Share Code: NPK ISIN: ZAE 000071676 ( Nampak or the "Group") VOLUNTARY TRADING UPDATE
Nampak Annual Report 2003
 Nampak Annual Report 2003 Nampak Limited, PO Box 784324 Sandton 2146, South Africa Nampak Annual Report 2003 It s all part of the package! Nampak contents Packaging solutions 2 Global growth 4 Income statements
Mpact Limited Annual Results. 31 December 2013
 Mpact Limited Annual Results 31 December 2013 2013 in context and financial highlights Operating review Financial review Strategy and outlook Appendices 2 2013 in context Muted GDP and consumer spending
Nampak (NPKJ.J) Share fully priced with growth dependent on Africa CREDIT SUISSE SECURITIES RESEARCH & ANALYTICS
 Share fully priced with growth dependent on Africa CREDIT SUISSE SECURITIES RESEARCH & ANALYTICS") EEMEA/South Africa Equity Research Containers & Packaging Rating UNDERPERFORM* Price (27 Jun 12, R) 25.50 Target price (R) 23.00¹ Market cap. (R m) 15,070.55 Enterprise value (R m) 16,798.2 *Stock ratings
EEMEA/South Africa Equity Research Containers & Packaging Rating UNDERPERFORM* Price (27 Jun 12, R) 25.50 Target price (R) 23.00¹ Market cap. (R m) 15,070.55 Enterprise value (R m) 16,798.2 *Stock ratings
Unaudited results for the 6 months ended 30 September H Investor Booklet November 2016
 H1 2017 Investor Booklet November 2016 Agenda Overview of Results Financial Review Outlook 2 Overview In the F2016 results presentation (14 July 2016) we said: Dawn board had approved a plan to stop losses
qualities INNOVATIVE DIVERSE RESPONSIVE FLEXIBLE PROACTIVE
 qualities INNOVATIVE DIVERSE RESPONSIVE FLEXIBLE PROACTIVE 1 Nampak Limited Profile 2 Goals 2 Values 3 Financial Summary 5 The Group at a Glance 8Group Structure 9 Chairman s Statement 16 Group Managing
Summarised consolidated financial results
 Summarised consolidated financial results For the year ended 30 September 2017 Group revenue of Trading profit increased to R18.8 bn R2.0 bn HEPS increased by 15% to 123.8 cents per share down by 2 % up
Nampak Limited (Registration number 1968/008070/06) (Incorporated in the Republic of South Africa) Share code: NPK SIN: ZAE
 (Incorporated in the Republic of South Africa) Share code: NPK SIN: ZAE") Nampak Limited (Registration number 1968/008070/06) (Incorporated in the Republic of South Africa) Share code: NPK SIN: ZAE 000071676 Summarised consolidated financial results for the year ended 30 September
Nampak Limited (Registration number 1968/008070/06) (Incorporated in the Republic of South Africa) Share code: NPK SIN: ZAE 000071676 Summarised consolidated financial results for the year ended 30 September
Main heading continued
 2 Main heading continued INTEGRATED ANNUAL REPORT 2012 Nampak s sustainability is highly dependent on its ability to produce packaging that benefits all its stakeholders. As Africa s largest packaging
SIX MONTHS ENDED 30 SEPTEMBER 2018
 PRESENTATION TUESDAY, 20 NOVEMBER 2018 SIX MONTHS ENDED 30 SEPTEMBER 2018 CONTENTS PRESENTED BY Neil Birch Chief Executive Officer Harry Todd Chief Financial Officer 2 EXECUTIVE OVERVIEW 3 RESULTS SUMMARY
AUDITED RESULTS FOR THE YEAR ENDED 31 DECEMBER 2015
 AUDITED RESULTS FOR THE YEAR ENDED 31 DECEMBER 2015 AGENDA 2 1 Opening remarks / market update Richard 2 Financial results David 3 Operational review Richard 4 Strategy update Richard 5 Outlook Richard
ADVANCED MANUFACTURING
 INTEGRATED REPORT 2017 ADVANCED MANUFACTURING Contents 1 About our report WHO WE ARE 2 This is Nampak 4 How we define value and the stakeholders who help us create it 5 Our operating context 6 How we performed
AUDITED RESULTS FOR THE YEAR ENDED 31 DECEMBER 2016
 AUDITED RESULTS FOR THE YEAR ENDED 31 DECEMBER 2016 AGENDA 2 1 Opening remarks / market update 2 Financial results 3 Operational review 4 Strategy update 5 Outlook 1 2 3 4 5 OPENING REMARKS / MARKET UPDATE
Annual Financial Results for the financial year ended 31 March 2018
 PRESENTATION JUNE 2018 Annual Financial Results for the financial year ended 31 March 2018 Contents EXECUTIVE OVERVIEW FINANCIAL REVIEW OPERATING REVIEW OUTLOOK PRESENTED BY: Neil Birch Chief Executive
INTERIM FINANCIAL RESULTS
 Presentation Tuesday, 14 November 2017 INTERIM FINANCIAL RESULTS For the six months ended 30 September 2017 Contents EXECUTIVE OVERVIEW FINANCIAL REVIEW OPERATIONAL REVIEW OUTLOOK & STRATEGY Presented
Nampak Annual Report annual report 2004
 Nampak Annual Report 2004 annual report 2004 IFC NAMPAK LIMITED ANNUAL REPORT CONTENTS 1 Nampak profile 2 Chairman s review 8 Group directorate 10 Chief executive s report 30 Chief financial officer s
annual report 2007 nampak annual report 2007
 annual report 2007 nampak annual report 2007 www.nampak.com corporate information COMPANY SECRETARY SHARE REGISTRAR NP O Brien BProc Computershare Investor Services 2004 (Pty) Limited AUDITORS 70 Marshall
Contents. for the year ended 30 September Financial statements Nampak Limited financial statements 2013
 FINANCIAL STATEMENTS BP Nampak Limited financial statements Contents Financial statements 1 112 Certificate by company secretary 1 Directors responsibility for annual financial statements Preparer of financial
Results for the Fourth Quarter ended 31 December 2017
 Results for the Fourth Quarter ended 31 December 2017 Athens, Greece, 25 April 2018 Frigoglass SAIC ( Frigoglass or we or the Group ) announces results for the quarter and full year ended 31 December 2017
TRELLIDOR HOLDINGS LIMITED AUDITED RESULTS FOR THE YEAR ENDED 30 JUNE 2016
 TRELLIDOR HOLDINGS LIMITED AUDITED RESULTS FOR THE YEAR ENDED 30 JUNE 2016 OVERVIEW Trellidor is the market leading manufacturer of custom made barrier security products Distribution through dedicated
Orora Investor Briefing. November 2013
 Orora Investor Briefing November 2013 Contents The demerger of Orora Limited About Orora Limited Strategic Direction of Orora Orora Leadership Board & Management Teams Summary Orora Ltd 2 The demerger
ACQUISITION OF CARAUSTAR INDUSTRIES Significantly Enhances Margins and Free Cash Flow Strengthening its Leadership in Industrial Packaging
 ACQUISITION OF CARAUSTAR INDUSTRIES Significantly Enhances Margins and Free Cash Flow Strengthening its Leadership in Industrial Packaging Safe harbor FORWARD-LOOKING STATEMENTS This presentation contains
Barloworld Limited. Reviewed interim results to 31 March May 15, 2006
 Barloworld Limited Reviewed interim results to 31 March 2006 May 15, 2006 BARLOWORLD IS A DIVERSIFIED INDUSTRIAL COMPANY Over 26 000 people in 31 countries Barloworld s way of doing business - market-leading
TRELLIDOR HOLDINGS LIMITED UNAUDITED INTERIM RESULTS FOR THE SIX MONTHS ENDED 31 DECEMBER 2017
 TRELLIDOR HOLDINGS LIMITED UNAUDITED INTERIM RESULTS FOR THE SIX MONTHS ENDED 31 DECEMBER 2017 GROUP HIGHLIGHTS 5% Revenue 5% PAT 5% HEPS 35.2c 5% Interim dividend declared 11.0 cents per share Slide 2
Contents
 FINANCIAL STATEMENTS 2012 www.nampak.com Contents 1 Certificate by company secretary 1 Directors responsibility for annual financial statements 1 Preparer of financial statements 2 Report of the independent
Results for the First Quarter ended 31 March 2018
 Results for the First Quarter ended 31 March 2018 Athens, Greece, 11 June 2018 Frigoglass SAIC ( Frigoglass or we or the Group ) announces unaudited results for the quarter ended 31 March 2018 First Quarter
Ardagh Group S.A. Citi 2017 Basic Materials Conference. November 29, 2017
 Ardagh Group S.A. Citi 2017 Basic Materials Conference November 29, 2017 1 Disclaimer Forward-Looking Statements This presentation may contain "forward-looking" statements within the meaning of Section
Results for the Third Quarter ended 30 September 2017
 Results for the Third Quarter ended 30 September 2017 Athens, Greece, 24 November 2017 Frigoglass SAIC ( Frigoglass or we or the Group ) announces results for the quarter and nine months ended 30 September
Group Results Presentation for the six months ended 31 March 2016
 Group Results Presentation for the six months ended 31 March 2016 Index Overview Financial performance Operational performance Outlook 2 Overview Noel Doyle Chief Operating Officer Disclaimer Forward-looking
Investor Presentation First Half 2011 Financial Results 6 th Annual Greek Roadshow September 8&9, London
 www.frigoglass.com Investor Presentation First Half 2011 Financial Results 6 th Annual Greek Roadshow September 8&9, London www.frigoglass.com 2 What we do Ice-Cold Merchandisers First Half 2011: Sales
Investor Roadshow Presentation 2016 Financial Results
 By considering it all, PSG sees the bigger picture, which gives you the advantage Investor Roadshow Presentation 2016 Financial Results For the year ended 29 February 2016 14 April 2016 Contents 1. Group
AMCOR LIMITED, ANNUAL GENERAL MEETING THURSDAY, OCTOBER 11, Thank you Mr Chairman and good morning Ladies and Gentlemen.
 News Release 11 October 2018 AMCOR LIMITED, ANNUAL GENERAL MEETING THURSDAY, OCTOBER 11, 2018 MANAGING DIRECTOR S ADDRESS Slide 15 MD and CEO title slide Thank you Mr Chairman and good morning Ladies and
HUHTAMÄKI OYJ INTERIM REPORT. January 1 March 31, 2012
 HUHTAMÄKI OYJ INTERIM REPORT January 1 March 31, 2012 Huhtamäki Oyj, Interim Report January 1 March 31, 2012 Good start to the year Net sales growth in all segments Improved profitability Strong performance
Annual Results. 12 months ended 28 February Agenda
 Annual Results 28 ruary 2015 Bridging y expectations Agenda 2015 2014 2 1 12 month overview Phase 1 of turnaround strategy successfully implemented Closed-out problem contracts Closed non-performing Power
Huhtamaki Strong positions i for profitable growth. CEO Jukka Moisio Pohjola One-on-one Day March 9, 2011
 Huhtamaki Strong positions i for profitable growth CEO Jukka Moisio Pohjola One-on-one Day March 9, 2011 Huhtamaki in 2011 Key Fig gures 201 0 EUR 2.0 Billion in net sales 12,000 People employed Globally
For personal use only
 Orora Pro Forma Full Year Results Year Ended 30 June 2014 Nigel Garrard Managing Director and CEO Stuart Hutton Chief Financial Officer 25 August 2014 IMPORTANT PLEASE READ Effective 17 December 2013,
Hulamin Limited Interim Results Presentation
 Hulamin Limited Interim Results Presentation For the half-year ended 30 June 2009 Abnormal Market Conditions Sharpest fall in global consumption of aluminium since 1975 oil shock Rolled products and extrusions
Results for the Third Quarter ended 30 September 2018
 Results for the Third Quarter ended 30 September 2018 Athens, Greece, 16 November 2018 Frigoglass SAIC ( Frigoglass or we or the Group ) announces results for the quarter and nine months ended 30 September
Tiger Brands Limited. Group Results Presentation. for the year ended 30 September 2015
 Tiger Brands Limited Group Results Presentation for the year ended 30 September 2015 2 Index Strategic review 3 Strategic review Peter Matlare Chief Executive Officer 4 Key strategic deliverables 1 Improve
OVERVIEW Group highlights. The Maslow Hotel
 OVERVIEW Group highlights The Maslow Hotel 2 Key indicators R5 407m R1 489m 334 cps 90 cps GROUP REVENUE GROUP EBITDA ADJ DILUTED HEPS DPS +4% (5%) (18%) (18%) 3 Kalahari Sands Operating environment Pressure
Nestlé s long-term value creation model
 Nestlé s long-term value creation model François-Xavier Roger EVP, Chief Financial Officer Nestlé, S.A. Bernstein Conference London, September 2018 September 27, 2018 Bernstein Conference 1 Disclaimer
RPC GROUP PLC CAPITAL MARKETS DAY 2017
 RPC THE ESSENTIAL INGREDIENT RPC GROUP PLC CAPITAL MARKETS DAY 2017 13 November 2017 2017 RPC Group Plc. All Rights Reserved. Agenda Setting the scene Vision 2020 strategy: Opportunities going forward
Unaudited results. for the six months ended 30 November ISIN: ZAE Share code: ARH. ARB Holdings Limited
 www.arbhold.co.za ARB Holdings Limited Registration number: 1986/002975/06 Share code: ARH ISIN: ZAE000109435 ( ARB or the Company or the Group ) for the six months ended 30 November 2016 Unaudited results
Strong positions for profitable growth
 Investor Relations January 9, 2013 Strong positions for profitable growth SEB Enskilda Nordic Seminar Copenhagen 2013 CEO Jukka Moisio Huhtamaki 2012 2 EUR 2.0 14,000 billion in net people manufacturing
Koenig & Bauer AG at 15 th German Corporate Conference 2016 January 19, 2016, Frankfurt
 People & Print Koenig & Bauer AG at 15 th German Corporate Conference 2016 January 19, 2016, Frankfurt Mathias Dähn, CFO Agenda Company overview Strategy & growth drivers Q3 2015 & outlook KBA Koenig &
Refresco Gerber reports continued positive trend in results
 Press Release May 22, 2014 Refresco Gerber reports continued positive trend in results First quarter highlights We recorded a revenue of 459.0 million and volume of 1,352.8 million litres, an increase
PRESENTATION TO INVESTORS FOR THE YEAR ENDED 30 SEPTEMBER 2015
 PRESENTATION TO INVESTORS FOR THE YEAR ENDED 30 SEPTEMBER 2015 AGENDA GROUP OVERVIEW Alan Dickson, CEO FINANCIAL OVERVIEW Nick Thomson, CFO SEGMENTAL DISCUSSIONS ICT Mark Taylor Applied electronics Peter
1ST HALF FY2019/3 FINANCIAL REVIEW. November 7,2018
 1ST HALF FY2019/3 FINANCIAL REVIEW November 7,2018 1 st Half FY2019/3 Financial Results Consolidated Statement ( billion) FY2018/3 Results 1 st Half FY2019/3 Results Variance Amount % Net Sales 513.9 525.5
NOVELIS Q4 & FY FISCAL 2018 EARNINGS CONFERENCE CALL
 NOVELIS Q4 & FY FISCAL 2018 EARNINGS CONFERENCE CALL May 8, 2018 Steve Fisher President and Chief Executive Officer Devinder Ahuja Senior Vice President and Chief Financial Officer SAFE HARBOR STATEMENT
Sonoco Reports Fourth Quarter and Full-Year 2017 Results
 Sonoco Reports Fourth Quarter and Full-Year 2017 Results February 15, 2018 HARTSVILLE, S.C., Feb. 15, 2018 (GLOBE NEWSWIRE) -- Sonoco (NYSE:SON), one of the largest diversified global packaging companies,
Mr Price Group Limited Interim Results September 2009
 Interim Results September 2009 Total consumer spending contracted sharply Decline in retail sales in real terms for seven consecutive months Household debt to disposable income at historically high levels
WestRock KeyBanc's Basic Materials and Packaging Conference. September 14, 2016
 WestRock KeyBanc's Basic Materials and Packaging Conference September 14, 2016 Forward-looking Statements This presentation contains forward-looking statements within the meaning of the Private Securities
Presentation of consolidated results. For the 52 weeks ended 30 March 2013
 Presentation of consolidated results For the 52 weeks ended 30 March 2013 1 Agenda Strategic and operational update Financial review Looking forward Jürgen Schreiber CEO Mark Bower Deputy CEO & CFO Jürgen
Barloworld Limited. Audited results for the year ended 30 September 2003
 Barloworld Limited Audited results for the year ended 30 September 2003 Barloworld is an international industrial brand management company 23 000 people... in 32 countries providing business solutions
Research. ART Argent Industrial Limited Full Year Results and Initiation Report. Valuation: Undervalued
 Aug-11 Nov-11 Feb-12 May-12 Aug-12 Nov-12 Feb-13 May-13 Aug-13 Nov-13 Feb-14 May-14 Aug-14 Nov-14 Feb-15 May-15 Aug-15 Nov-15 Feb-16 May-16 Research RESULTS COMMENTARY Argent released a respectable set
Greif Reports Second Quarter 2017 Results
 Greif Reports Second Quarter 2017 Results 6/7/2017 DELAWARE, Ohio--(BUSINESS WIRE)-- Greif, Inc. (NYSE: GEF, GEF.B), a world leader in industrial packaging products and services, announced second quarter
UNAUDITED INTERIM RESULTS. for the six months ended 30 September 2016
 UNAUDITED INTERIM RESULTS for the six months (Incorporated in the Republic of South Africa) (Registration number 1984/008265/06) ( DAWN or the group or the company ) Alpha code: DAW ISIN: ZAE000018834
Sonoco Reports Third Quarter 2016 Results. October 20, :45 AM ET
 Sonoco Reports Third Quarter 2016 Results October 20, 2016 6:45 AM ET HARTSVILLE, S.C., Oct. 20, 2016 (GLOBE NEWSWIRE) -- Sonoco (NYSE:SON), one of the largest diversified global packaging companies, today
Quarter. Fourth. Avery delivers. Free cash flow 20% return on. Sales. to $557.7 million. currency was $85.0
 News Releasee For Immediate Release, Thursday, February 26,, 2015 Stock Symbol: TSX CCL.A and CCL.B CCL Industriess Reports Record Fourth Quarter and 2014 Results Fourth-Quarter Highlights Adjusted basic
NOVELIS Q3 FISCAL 2019 EARNINGS CONFERENCE CALL
 NOVELIS Q3 FISCAL 2019 EARNINGS CONFERENCE CALL February 5, 2019 Steve Fisher President and Chief Executive Officer Dev Ahuja Senior Vice President and Chief Financial Officer SAFE HARBOR STATEMENT Forward-looking
Final results presentation for the year ended 29 February Johannesburg 19 May 2016 Cape Town 23 May 2016
 Final results presentation for the year ended 29 February 2016 Johannesburg 19 May 2016 Cape Town 23 May 2016 Presentation coverage 1 2 3 4 5 6 Group overview Financial performance Operating review What
For personal use only
 Appendix 4D Rule 4.2A.3 Half year report AMCOR LIMITED ABN 62 000 017 372 1. Details of the reporting period and the previous corresponding period Reporting Period: Half-Year Ended 31 December 2014 Previous
2011 FINAL RESULTS PRESENTATION
 2011 FINAL RESULTS PRESENTATION FEBRUARY 2012 1 Agenda 1 Market Conditions 2011 2 Financial Review 3 Operational Review 4 Key Strategic Priorities 5 Outlook for 2012 and Beyond 2 MARKET CONDITIONS 2011
Overview. KAP International Holdings Ltd December 2006 Results Presentation Increase RM RM %
 Overview 2006 2005 Increase RM RM % Revenue 3,418 2,975 14.9% EBITDA 300 270 11.1% Operating profit 256 228 12.3% Net profit before tax 230 249 - excluding pension fund surplus 230 199 15.6% Headline earnings
Group results and dividend declaration for the six months ended 31 March 2011
 Tiger Brands Limited Registration number 1944/017881/06 (Incorporated in the Republic of South Africa) Share code: TBS ISIN: ZAE000071080 Group results and dividend declaration for the six months ended
Thai Plaspac Public Company Limited 3Q 2017 Investor Presentation
 Thai Plaspac Public Company Limited 3Q 2017 Investor Presentation November 15, 2017 Disclaimer This presentation contains forward-looking statements of Thai Plaspac Public Company Limited (the Company
For personal use only
 A S X A N N O U N C E M E N T DATE: 24 August 2016 FY2016 RESULTS PRESENTATION Attached is the Presentation regarding Pact s Financial Results for the year ended 30 June 2016. The Presentation will occur
MONDI GROUP RESULTS FOR THE YEAR ENDED 31 DECEMBER February 2011
 MONDI GROUP RESULTS FOR THE YEAR ENDED 31 DECEMBER 21 February 2011 Agenda Highlights Financial overview Operational review Summary Appendices Page 2 Key financial highlights Earnings significantly up
HALF-YEAR REPORT Bobst Group SA
 HALF-YEAR REPORT 2017 Bobst Group SA Bobst Group SA Half-year report 2017 KEY FIGURES In million CHF June 2017 June 2016 June 2015 Sales 643.2 600.4 524.7 Operating result (EBIT) 39.8 18.0 14.7 In % of
ANNUAL RESULTS FOR THE YEAR ENDED 31 AUGUST 2017
 ANNUAL RESULTS FOR THE YEAR ENDED 31 AUGUST 2017 PRESENTATION OUTLINE Review of the year Financial results Trading performance Outlook Questions 2 REVIEW OF THE YEAR DAVID KNEALE REVIEW OF THE YEAR Strong
CCL Industries Announces Second Quarter Results
 News Release For Immediate Release, Thursday, August 9, 2018 Stock Symbol: TSX CCL.A and CCL.B CCL Industries Announces Second Quarter Results Second Quarter Highlights Adjusted basic earnings per Class
2002 Interim Results. 10 September 2002
 2002 Interim Results 10 September 2002 Introduction Interim results summary First Half 2002 2001 Turnover + m 449.5 520.7 Operating profit + * m 16.0 45.4 Net finance charge m (6.6) (9.9) Profit before
investment case sustainable value creation Insurance Financial Planning Retirement Investments Wealth
 investment case sustainable value creation Insurance Financial Planning Retirement Investments Wealth agenda Overview Strategic positioning Strategic delivery Financial performance 2014 interim results
RPC Group Plc 2015/16 Interim Results
 RPC THE ESSENTIAL INGREDIENT RPC Group Plc 101 25 November 2015 Agenda Business Review Promens Update Financial Review Outlook PV FD SK PV 102 FOCUSED GROWTH *Proforma Group at constant exchange rates
Ardagh Group S.A. Third Quarter 2018 Results
 Ardagh Group S.A. Third Quarter 2018 Results Ardagh Group S.A. (NYSE: ARD) today announced its financial results for the third quarter ended September 30, 2018. Three months ended September 30, Change
ACCOUNTING: PAPER II INFORMATION BOOKLET. Gross Profit 100 Cost of sales 1. Sales 1. Average creditors 365 or 12 Credit purchases 1
 NATIONAL SENIOR CERTIFICATE EXAMINATION NOVEMBER 2014 ACCOUNTING: PAPER II Time: 2 hours 100 marks INFORMATION BOOKLET Gross Profit 100 Operating expenses 100 Gross Profit 100 Operating profit 100 Net