AVI Limited presentation to shareholders & analysts for the six months ended 31 December 2017
|
|
|
- Rafe Fletcher
- 5 years ago
- Views:
Transcription


1 AVI Limited presentation to shareholders & analysts for the six months ended 31 December 2017


2 AGENDA Key features and results history Group financial results Performance and prospects Questions and answers


3 KEY FEATURES Sound profit growth in a challenging demand environment; Well managed balance of value versus volume across key categories; Revenue up 2,3% to R7,30 billion; Gross profit margin recovery in line with easing of Rand driven cost pressures; Operating profit up 8,7% to R1,53 billion; Cash from operations up 12,1% to R1,87 billion; Capital expenditure of R193,2 million to grow and sustain our businesses; Return on capital employed of 28,5 %; Headline earnings per share up 7,5% to 325,6 cents; Interim dividend up 8,0% to 175 cents per share.
4 R million RESULTS HISTORY Operating profit history H1 F05 H1 F06 H1 F07 H1 F08 H1 F09 H1 F10 H1 F11 H1 F12 H1 F13 H1 F14 H1 F15 H1 F16 H1F17 H1F18 Entyce Snackworks I&J Personal Care Footwear and Apparel Compound annual growth rate from H1 F05 to H1 F18 of 15,3% Operating profit margin increased from 10,0% in H1 F05 to 21,0% in H1 F18
5 RESULTS HISTORY Return on capital employed % % % R million % 15% % % 0 F10 F11 F12 F13 F14 F15 F16 F17 F18* Net operating profit after tax Average capital employed ROCE (%) * F18 represents a rolling 12 month period to 31 December % Sustained returns including increased capital expenditure to support long term growth and efficiency

6 RESULTS HISTORY Historical cash conversion % % % R million % % % 0 F10 F11 F12 F13 F14 F15 F16 F17 F18* EBITDA Cash generated by operations after working capital changes Cash to EBITDA * F18 represents 12 months to 31 December % Sustained strong conversion of earnings into cash

7 RESULTS HISTORY Dividend yield (Year end) 14% 12% 12.0% 10% 8% 6% 4% 7.7% 2.8% 3.8% 3.7% 6.2% 5.2% 4.5% 6.4% 4.0% 7.4% 4.1% 4.4% 4.9% 6.5% 4.1% 4.5% 4.3% 2% 0% F05 F06 F07 F08 F09 F10 F11 F12 F13 F14 F15 F16 F17* Normal dividend yield Total dividend yield *Based on share price of R95,00 at 30 June 2017 Based on share price at end of each year Total dividend yield includes payments out of share premium and special dividends Excludes share buy-backs


8 RESULTS HISTORY Returns to shareholders R million F05 F06 F07 F08 F09 F10 F11 F12 F13 F14 F15 F16 F17 F18 Normal dividend paid Interim dividend declared Special dividend paid Share Buyback Effective payout ratio from F05 = 85,9% of headline earnings
9 Group Financial Results
10 GROUP FINANCIAL RESULTS Income statement H1 F18 H1 F17 Rm Rm % Revenue 7 300, ,6 2,3 Cost of sales (4 018,4) (4 011,0) 0,2 Gross profit 3 282, ,6 5,1 Gross profit margin % 45,0 43,8 2,7 Selling and administrative expenses (1 751,8) (1 715,9) 2,1 Operating profit 1 530, ,7 8,7 Operating profit margin % 21,0 19,7 6,6 Net financing cost (71,9) (79,9) (10,0) Share of Joint Ventures 25,4 42,2 (39,8) Capital items 3,4 11,9 Effective tax rate % 28,5 28,5 Headline earnings 1 061,4 979,8 8,3 HEPS (cps) 325,6 302,9 7,5


11 8 000 GROUP FINANCIAL RESULTS Movement in group revenue R million H1 H1 H1 FY17 Price Volume H1 FY18 F17 F18 Higher selling prices mainly reflect the benefit of price increases taken in F17 Volume pressure in Biscuits, Tea and Coffee in constrained and competitive environment Spitz footwear volumes benefitted from stable selling prices and stock investment

12 GROUP FINANCIAL RESULTS Gross profit margin history 50% 45.9% 44.3% 44.5% 45.3% 43.8% 45.0% 40% 30% 20% H1 F13 H1 F14 H1 F15 H1 F16 H1 F17 H1 F18 Stronger Rand and lower commodity prices provided relief from accumulated cost pressure Few price increases in F18 Ongoing focus on cost and efficiencies to protect gross profit margin Increased flexibility to respond to constrained environment

13 GROUP FINANCIAL RESULTS Marketing expenditure 18% 16% 14% 15.5% 14.4% 12% 10% 8% 6% 4% 7.3% 7.3% 6.7% 7.8% 4.9% 6.2% 7.1% 7.4% 7.8% 8.2% 4.7% 4.1% 2% 1.7% 1.4% 0% Tea Coffee Creamer Biscuits Snacks I&J retail Personal Care * Footwear * Excludes Coty H1 F17 H1 F18 Includes advertising and promotions, co-operative expenditure with customers and marketing department costs Total expenditure for H1 F18 of R415,0m compared to R388,1m in H1 F17


14 GROUP FINANCIAL RESULTS Operating profit 8,7% up R million H1 F17 Entyce Snackworks I&J Personal Care Spitz Green Cross Other H1 F18 Entyce: Margin recovery and cost savings offset by tea and coffee volume decline Snackworks: Margin recovery and cost savings offset by biscuit volume decline I&J: Export price increases and non-repeat of unprotected strike in August 2016, offset by stronger Rand on exports Personal Care: Market share gains by owned brands and lower input costs from the stronger Rand offset by lower export volumes Spitz: Higher sales volumes, margin recovery from the stronger Rand and savings from restructuring Green Cross: Poor performance of summer 2017 range in highly competitive mid-priced footwear market
15 GROUP FINANCIAL RESULTS Cash generation and utilisation H1 F18 H1 F17 Rm Rm % Cash generated by operations 1 870, ,3 12,1 Working capital to revenue % 24,6 21,8 12,8 Capital expenditure 193,2 284,0 (32,0) Depreciation and amortisation 207,5 195,7 6,0 Net debt 1 208, ,2 Net debt / capital employed % 19,1 23,7 Interim dividend cps ,0 Strong conversion of earnings to cash Working capital increase due to R230 million increase in debtors payments on first business day in January


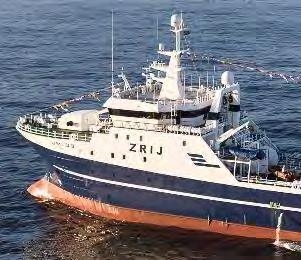
16 GROUP FINANCIAL RESULTS Capital expenditure and depreciation F12 F13 F14 F15 F16 F17 F R million F12 F13 F14 F15 F16 F17 F18 Capital expenditure H1 Capital expenditure H2 Depreciation charge H1 Depreciation charge H2 Forecast capital expenditure H2 Forecast depreciation charge H2 Continued investment in manufacturing capacity, efficiency and retail stores Expenditure in respect of new I&J vessels included in F14, F15 and F16
17 GROUP FINANCIAL RESULTS Key capital projects spend summary H1 F18 H2 F18 F18 Total Actual Planned Planned Rm Rm Rm Biscuit line capacity and process improvements I&J vessel dry-docks and upgrades I&J processing plant replacements and upgrades Abalone farm expansion and upgrades Indigo distribution centre upgrade Logistics vehicle fleet replacement Retail store additions and refurbishments Alternative water supply Total capital expenditure
18 GROUP FINANCIAL RESULTS Foreign exchange hedges March 2018 to June 2018 July 2018 to December 2018 January 2019 to June 2019 % Cover % Cover % Cover USD imports 95% 67% 3% EUR imports 100% 66% 3% EUR exports 76% 62% 9% Consistent hedging philosophy provides stability to manage gross margins Benefit to I&J s export earnings diminishing in line with Rand strengthening Recent Rand strength will provide further relief on import costs into F19


19 Performance and Prospects


20 Income statement H1 18 Rm H1 17 Rm Revenue 2 039, ,8 2,6 Operating profit 424,3 389,0 9,1 Operating profit margin % 20,8 19,6 6,1 Good growth in tea operating profit despite lower volumes Price inflation from increases implemented in F17 in response to accumulated cost pressure Raw material cost pressure ameliorated by stronger Rand Volumes under pressure Higher price points Competitor discounting Premium Five Roses and Freshpak brands performed well Savings from restructuring completed in F17 %

 Lower recovery of")

21 Income statement H1 18 Rm Coffee profit decrease due to pressure on mixed instant volumes Overall decrease in sales volumes Aggressive competitor discounting on mixed instant coffee Partly offset by continued growth of Hug In A Mug speciality range Price inflation from increases implemented in F17 Raw material cost pressure ameliorated by stronger Rand (benefit of lower Robusta bean prices deferred due to consistent hedging approach) Lower recovery of factory fixed costs at lower production volumes Savings from restructuring completed in F17 Overall profitability remains healthy H1 17 Rm Revenue 2 039, ,8 2,6 Operating profit 424,3 389,0 9,1 Operating profit margin % 20,8 19,6 6,1 %


22 Income statement H1 18 Rm H1 17 Rm Revenue 2 039, ,8 2,6 Operating profit 424,3 389,0 9,1 Operating profit margin % 20,8 19,6 6,1 Solid creamer performance Slight increase in sales volumes despite aggressive competition New pack size fully implemented Effective promotional activity Selling prices constrained Higher discounting than last year Offset by price inflation from increases implemented in F17 Lower raw material costs, including stronger Rand Savings from restructuring completed in F17 Operating profit in line with H1 F17 %
23 Sales volume and selling prices % Δ H1 F18 vs H1 F17 Comments Tea revenue growth 8,3 Sales volume (4,1) Category decline at higher price points; competitor discounting Ave. selling price 12,9 Price increases in F17 in response to Coffee revenue growth (2,9) accumulated cost pressure Sales volume (8,9) Decrease in mixed instant volumes partly offset by growth in speciality coffee range (Hug In A Mug) Ave. selling price 6,6 Price increases in F17 in response to Creamer revenue growth (1,2) accumulated cost pressure Sales volume 0,1 New pack size and effective promotion offset by aggressive competition Ave. selling price (1,4) Higher levels of discounting, mostly offset by price increases in F17


24 Market shares value 70% 60% 60.1% 58.0% 50% 40% 30% 20% 33.1% 31.1% 25.6% 22.1% 45.5% 41.9% 10% 10.9% 10.5% 0% Five Roses Freshpak Frisco Ellis Brown Trinco H1 F17 H1 F18 Market share declines due to competitor discounting and constrained environment

25 Raw material costs Cost impact of raw materials and commodities consumed in the period (H1 F18 vs H1 F17): R million Glucose Arabica Palm oil Casein Robusta / chicory Black tea Rooibos Rooibos cost increase due to constrained supply and export pricing opportunity Black tea cost increase due to higher underlying commodity prices offset by stronger Rand Benefit of lower Robusta bean prices deferred due to consistent hedging approach


26 Prospects for H2 Low selling price inflation supported by abating cost pressures Careful price / volume management in market expected to remain constrained and very competitive Potential for continued aggressive discounting by competitors Rooibos input costs and selling prices remain at record levels Reduced price to support mixed instant coffee volume Protect long term gross profit margins Easing of margin pressure with stronger Rand exchange rates secured Continued realisation of restructuring benefits Steady building of branded positions in export markets Investment in rooibos capability to sustain market leadership


27 Performance and Prospects
 Operating profit 452,0")


28 Income statement H1 F18 Rm H1 F17 Rm Revenue 2 176, ,1 (0,8) Operating profit 452,0 412,4 9,6 Operating profit margin % 20,8 18,8 10,6 % Solid biscuit profit growth despite lower volumes Volume decline for the semester Category under pressure at higher price points Consumer shift to lower priced product Price inflation from increases implemented in F17 Cost pressures abated due to stronger Rand and lower raw materials Savings from restructuring completed in F17
 Operating profit 452,0 412,4")


29 Income statement H1 F18 Rm H1 F17 Rm Revenue 2 176, ,1 (0,8) Operating profit 452,0 412,4 9,6 Operating profit margin % 20,8 18,8 10,6 % Strong snacks performance Slight increase in sales volume due to improved potato supply Selling price inflation from increases implemented in F17 Cost pressure abated due to stronger Rand and lower raw materials Savings from restructuring completed in F17
30 Sales volume and selling prices % Δ H1 F18 vs H1 F17 Comments Biscuits revenue growth (3,1) Sales volume (8,4) Volume decline due to category pressure at higher price points and consumer shift to lower priced product Ave. selling prices 5,8 Price increases in F17 in response to accumulated cost pressure Snacks revenue growth 7,1 Sales volume 0,3 Higher potato chip volume supported by improved potato supply, partly offset by decrease in corn snacks due to competitor discounting Ave. selling prices 6,8 Price increases in F17 in response to accumulated cost pressure


 Willards")

31 Market shares value 50% 45% 40% 35% 30% 25% 44.8% 41.8% 20% 15% 15.6% 14.6% 18.6% 18.3% 10% 5% 0% Bakers (Sweet) Bakers (Savoury) Willards H1 F17 H1 F18 Biscuit consumer shift to lower priced products

: 30")

32 Raw material costs Cost impact of raw materials and commodities consumed in the period (H1 F18 vs H1 F17): R million Flour Palm oil Maize Sugar Butter


33 Prospects for H2 Low selling price inflation supported by abating cost pressures Careful price / volume management in constrained market Increased import competition due to stronger Rand Protect biscuit volumes and market share Stronger Rand exchange rates secured give more flexibility to manage demand Innovation Continuing program of product extensions to support volumes New product launch in H2 Continued realisation of restructuring benefits Steady building of branded positions in export markets Capital projects major upgrade of chocolate lines at Westmead


34 Performance and Prospects
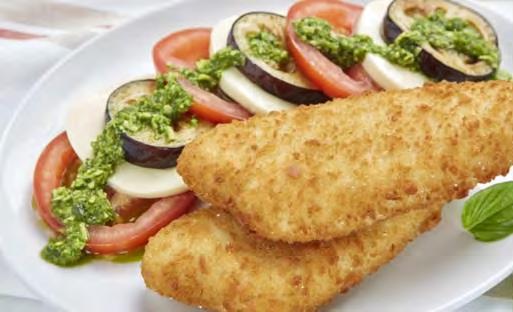
35 Income statement Income statement H1 F18 Rm H1 F17 Rm Revenue 1 198, ,3 4,8 Operating profit 178,6 167,4 6,7 Operating profit margin % 14,9 14,6 2,1 % Revenue growth from higher selling prices and sales volumes, partly offset by lower Rand exchange rates achieved on export sales Sales volumes and cost recovery benefitted from non-repeat of unprotected strike in August 2016 (R25 million profit impact) Good demand and prices for Cape Hake in export markets Sub-optimal sales mix freezer vessel sea days impacted by unplanned outage Sound fishing and processing performance overall catch rates slightly better than last year Costs tightly managed


36 Operating profit R million H1 F17 Exchange rates Unprotected strike Selling prices* H1 F18 * Net of cost increases


37 Profit history 250 R million F14 H1 F15 H1 F16 H1 F17 H1 F18 H1 Fishing Abalone Simplot Simplot profit negatively impacted by lower retail volumes and lower seafood trading profits Abalone decrease in H1 F18 due to stronger Rand, impacting revenue and stock fair value adjustment

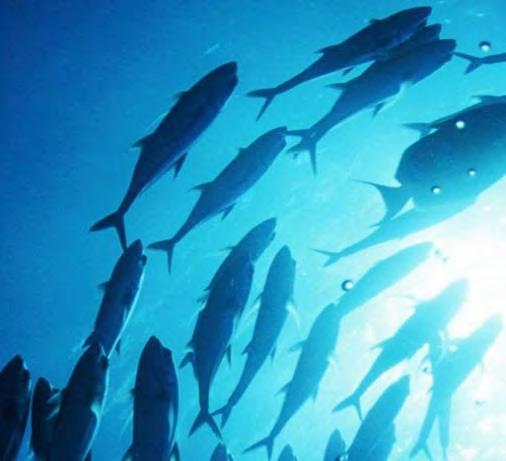
38 14 Fishing performance Hake tons per sea day H1 F08 H1 F09 H1 F10 H1 F11 H1 F12 H1 F13 H1 F14 H1 F15 H1 F16 H1 F17 H1 F18 I&J catch rate High proportion of small fish, indicating good recruitment into the resource
39 Sales volume and selling prices (hake) % Δ H1 F18 vs H1 F17 Comments I&J Domestic revenue growth 19,7 Sales volume 16,3 Increased domestic allocation in line with small sizes and lower freezer vessel tons caught Ave. selling prices 2,8 Price increases offset by changes in sales mix I&J Export revenue growth (14,8) Sales volume (12,5) Increased domestic allocation in line with small sizes and lower freezer vessel tons caught Ave. selling prices (2,5) Lower Rand exchange rates achieved, partly offset by good export market demand and prices Local retail market share increased to 52,7% from 47,7% in H1 F17

40 Prospects for H2 Exchange rates lower than last year Still at levels that support sound export profit margins Depend materially on catch rate and size mix Extended period of small fish may continue Opportunity to improve sales mix freezer vs wet vessels Continued strong export demand for Cape Hake brand Fuel costs effectively hedged Quota for CY18 down 5% to tons Ongoing focus on cost reduction Alternative water supply plans on track Abalone aquaculture expansion to 600 tons proceeding well Environmental impact assessment in progress for additional 500 ton expansion


41 Performance and Prospects


42 Income Statement Income Statement H1 F18 Rm H1 F17 Rm Revenue 631,4 620,9 1,7 Operating profit 140,3 140,1 0,1 Operating profit margin % 22,2 22,6 (1,8) % Revenue from owned brands grew by 4,7% Volume growth from core ranges and innovation Price inflation from increases implemented in F17 Export profit decline Less launch activity Currency crisis in Zimbabwe Higher price points in some markets due to stronger Rand
43 Sales volume and selling prices Sale volume and selling prices % Δ H1 F18 vs H1 F17 Comments Personal Care revenue growth* 4,7 Sales volume 2,9 Volume growth from market share gains in key categories Ave. selling price 1,7 Price increases in F17 to recover accumulated cost pressure * Like-for-like comparison excluding Coty Body spray market share improved slightly from 31,1% to 32,7% in H1 F18


44 Prospects for H2 Low selling price inflation supported by stronger Rand Careful price / volume management in constrained market Potential for continued aggressive discounting by competitors Stronger Rand exchange rates secured give flexibility to manage demand Product ranges positioned to benefit from constrained environment New product launches to benefit local and export demand New focused Indigo regional growth structure in place to further exploit regional potential Alternative water supply plans on track

45 Performance and Prospects


46 Income statement H1 F18 Rm H1 F17 Rm Revenue 1 035,8 969,7 6,8 Operating profit 334,6 290,4 15,2 Operating profit margin % 32,3 30,0 7,7 Footwear volume growth No price increases on core ranges in F18 Stock investment to support top selling styles Increasing utilisation of lay bye mechanism Record December performance Gross profit margin benefitted from stronger Rand Limited growth in trading space - trading density improved in Spitz and Kurt Geiger stores Savings from restructuring initiatives implemented in F17 Strong operating profit growth and margin improvement %
47 Sales volume and selling prices % Δ H1 F18 vs H1 F17 Comments Spitz & KG Footwear revenue 7,5 growth Sales volume Total 2,8 Improved demand from stable price points, supported by investment in core lines Ave. selling price 4,7 Inflation in non core lines and lower July KG Clothing revenue growth 3,3 sales volumes

48 Spitz and Kurt Geiger R million Operating profit (Rm) H1 F09 H1 F10 H1 F11 H1 F12 H1 F13 H1 F14 H1 F15 H1 F16 H1 F17 H1 F18 Margin % 80% 70% 60% 50% 40% 30% 20% 10% 0% Gross profit and operating profit margins H1 F09 H1 F10 H1 F11 H1 F12 H1 F13 H1 F14 H1 F15 H1 F16 H1 F17 H1 F18 Operating profit % Gross profit %


49 Trading density Spitz stores R/m m H1 F13 H1 F14 H1 F15 H1 F16 H1 F17 H1 F18 0 Trading density (R/m2) Average trading space (m2) Opened 1 new Spitz store Closed 1 Spitz store in sub-optimal location Refurbished 4 Spitz stores

 Average trading space (m2) No store")
50 Trading density - Kurt Geiger stores R/m m H1 F13 H1 F14 H1 F15 H1 F16 H1 F17 H1 F Trading density (R/m2) Average trading space (m2) No store changes in H1


51 Prospects for H2 Low selling price inflation supported by stronger Rand Constrained spending environment expected to persist Ongoing focus on product planning and store-tiering to underpin volume growth Sustained improvement in brand and design via Italian office Development and rollout of new store designs/concepts Continued realisation of restructuring benefits Retail space 2 store closures planned 6 refurbishments


52 Performance and Prospects

 Operating profit 4,4 18,7 (76,5) Operating profit margin % 2,3 9,7")
53 Income Statement Retail revenue growth of 1,9% from new stores Like-for-like trading density decreased Poor performance of Summer 2017 range Increase levels of discounting to move stock Wholesale revenue decline of 5,4% with continued channel shift to retail Profitability impacted by discounting Costs tightly managed, savings compared to F17 Trading space 3 new stores in H1 F18 H1 F18 Rm H1 F17 Rm Revenue 193,3 193,8 (0,3) Operating profit 4,4 18,7 (76,5) Operating profit margin % 2,3 9,7 (76,3) %


 may also be below budget Focus")

54 Prospects for H2 Oversight of key activities by Spitz management team Improved planning, merchandising, retail operations Summer 18 buy already reviewed to address H1 F18 problems Review product range, store designs and marketing activity Profitability of Winter range (H2 F18) may also be below budget Focus on factory throughput and costs to improve fixed cost recovery Ongoing focus on cost savings Cash flow will remain positive


55 INTERNATIONAL Performance and Prospects

56 AVI INTERNATIONAL Operating profit history R million H1 F08 H1 F09 H1 F10 H1 F11 H1 F12 H1 F13 H1 F14 H1 F15 H1 F16 H1 F17 H1 F18 Revenue growth in most markets, notably Botswana and Mozambique Demand weakness in Zimbabwe and Zambia Price inflation from increases implemented in F17 in response to accumulated cost pressure Profitability improved with improved price management and less cost pressure Profit decline in Personal Care due to aggressive competitor pricing and less launch activity Continued focus on building long-term brand positions
57 AVI INTERNATIONAL Entyce, Snackworks and Indigo Non RSA sales H1 F18 H1 F17 % Rm Rm International Revenue 525,2 520,9 0,8 % of Grocery and Personal Care brands 10,8 10,8 - International Operating Profit 93,4 94,3 (1,0) % of Grocery and Personal Care brands 9,2 10,0 (8,0) International Operating Margin 17,8 18,1 (1,7) Grocery and Personal Care brands Operating Margin 20,9 19,6 6,6
58 AVI GROUP Prospects for H2 Sustain Entyce, Snackworks and Indigo profit growth in a tough environment Essential we sustain medium term approach through a tough demand cycle Low selling price inflation supported by abating cost pressures Constrained consumer spending expected to persist, and demand may be weaker than anticpated Tactile price / volume management essential Potential to improve margins if demand is reasonable Continued realisation of F17 restructuring benefits Innovation to gain market share Continued project activity to improve efficiency and capacity Steady building of branded positions in export markets


59 AVI GROUP Prospects for H2 continued I&J performance dependent on catch rates Exchange rates hedged at levels that support good profit margins Good demand and prices in export markets Potential to improve sales mix export vs local Fuel well hedged Improving abalone size mix to support revenue growth Further cost savings Alternative water supply plans on track Preparation for hake long term rights renewal


60 AVI GROUP Prospects for H2 continued Spitz Low selling price inflation supported by stronger Rand Less price pressure for consumers Maintain gross profit margin Constrained spending environment expected to persist Continued realisation of F17 restructuring benefits Focus on retail execution Evolution of store designs Incremental space growth and in-cycle refurbishments Kurt Geiger clothing


61 AVI GROUP Prospects for H2 continued Green Cross Oversight of key activities by Spitz management team planning, merchandising, retail operations Review factory throughput and costs Do the best job possible with Winter range Ongoing focus on cost savings Cash flow will remain positive


62 AVI GROUP Investor proposition Group initiatives Ongoing focus on business unit margin management Ongoing focus on procurement, cost savings and efficiency Remain alert to I&J value realisation opportunities Manage our unique brand portfolio to its long term potential Organic earnings growth; target >10% HEPS growth p.a. High dividend yield maintain normal dividend payout ratio of 80% Sustain high return on capital employed Effective capital projects Leverage domestic manufacturing capability to grow export markets Return excess cash to shareholders efficiently Replicate our category market leadership in selected regional markets Acquisition of high quality brand opportunities if available
63 Questions
64 Information slides
65 INFORMATION SLIDE Business unit financial results Segmental Revenue Segmental Operating Profit Operating Margin H1 F18 Rm H1 F17 Rm Δ % H1 F18 Rm H1 F17 Rm Δ % H1 F18 Rm H1 F17 Rm Food & Beverage Brands 5 413, ,2 1, ,9 968,8 8,9 19,5 18,2 Entyce Beverages 2 039, ,8 2,6 424,3 389,0 9,1 20,8 19,6 Snackworks 2 176, ,1 (0,8) 452,0 412,4 9,6 20,8 18,8 I&J 1 198, ,3 4,8 178,6 167,4 6,7 14,9 14,6 Fashion Brands 1 886, ,4 4,3 482,7 449,7 7,3 25,6 24,9 Personal Care 631,4 620,9 1,7 140,3 140,1 0,1 22,2 22,6 Footwear & Apparel 1 255, ,5 5,7 342,4 309,6 10,6 27,3 26,1 Corporate - - (7,4) (10,8) 31,5 Group 7 300, ,6 2, , ,7 8,7 21,0 19,7
66 INFORMATION SLIDE Footwear & apparel financial results Segmental Revenue Segmental Operating Profit Operating Margin H1 F18 Rm H1 F17 Rm Δ % H1 F18 Rm H1 F17 Rm Δ % H1 F18 Rm H1 F17 Rm Footwear & Apparel 1 225, ,5 5,7 342,4 309,6 10,6 27,3 26,1 Spitz 1 035,8 969,7 6,8 334,6 290,4 15,2 32,3 30,0 Green Cross 193,3 193,8 (0,3) 4,4 18,7 (76,5) 2,3 9,7 Gant 26,3 24,0 9,6 3,4 0,5 580,0 12,9 2,1


67 INFORMATION SLIDE Revenue 2,3% up R million H1 F17 Entyce Snackworks I&J Personal Care Spitz Green Cross H1 F18 Entyce: Price increases in F17 offset by tea and mixed instant coffee volume decline Snackworks: Volume decline in biscuits offset by price increases in F17 I&J: Price increases in domestic and export markets and non-repeat of unprotected strike in F17, offset by lower Rand exchange rates achieved on exports Personal Care: Good growth in owned brands offset by decline in Coty revenue Spitz: Footwear volume growth and higher average selling prices on non-core ranges Green Cross: Price increases offset by lower volumes


68 INFORMATION SLIDE Gross profit 5,1% up R million H1 F17 Entyce Snackworks I&J Personal Care Spitz Green Cross H1 F18 Entyce: Revenue growth and benefit of stronger Rand on imports Snackworks: Benefit of stronger Rand on imports and lower raw material costs, offset by lower biscuit volumes I&J: Improved export prices and non-recurrence of strike, offset by stronger Rand on exports Personal Care: Revenue growth and benefit of stronger Rand on imports Spitz: Revenue growth and benefit of stronger Rand on imports Green Cross: Lower sales volumes and higher discounting

69 INFORMATION SLIDE Cash flows R million Cash from operations Working capital and other Taxation Capital expenditure Decrease in net debt Net interest paid Dividends paid
70 INFORMATION SLIDE I&J fishing quota Quota (tons) CY12 CY13 CY14 CY15 CY16 CY17 CY18 South African Total Allowable Catch (TAC) % change in TAC 9,8 7,8 (0,5) (5,0) - (5,0) (5,0) I&J % 28,0 28,0 28,0 27,9 28,0 27,1 27,1 CY17 reduction attributable to lower TAC (2 000 tons) and lower allocation of inshore rights (1 344 tons)
71 INFORMATION SLIDE Trading space and trading density Spitz H1 F18 H1 F17 Number of stores Turnover (Rm) 909,9 851,1 Average m Trading Density (R /m 2 ) Closing m Like-for-like metrics* H1 F18 H1 F17 Number of stores Turnover (Rm) 885,9 846,6 Average & closing m Trading Density (R/m 2 ) * Based on stores trading for the entire current and prior periods.
72 INFORMATION SLIDE Trading space and trading density Kurt Geiger H1 F18 H1 F17 Number of stores Turnover (Rm) 125,8 118,5 Average m Trading Density (R /m 2 ) Closing m Like-for-like metrics* H1 F18 H1 F17 Number of stores Turnover (Rm) 122,2 112,5 Average & closing m Trading Density (R/m 2 ) * Based on stores trading for the entire current and prior periods.
73 INFORMATION SLIDE Trading space and trading density Green Cross H1 F18 H1 F17 Number of stores # Turnover (Rm) 141,2 138,6 Average m Trading Density (R /m 2 ) Closing m Like-for-like metrics* H1 F18 H1 F17 Number of stores # Turnover (Rm) 129,9 137,0 Average & closing m Trading Density (R/m 2 ) # including value stores * Based on stores trading for the entire current and prior periods
74 INFORMATION SLIDE Closing number of stores and trading space at the end of each period Period End Spitz Kurt Geiger Green Cross # of stores Closing m² # of stores Closing m² # of stores Closing m² June , December , June , December , June , December , ,047 June , ,910 December , , ,304 June , , ,382 December , , ,382 June , , ,382 December , , ,382 June , , ,517 December , , ,423 June , , ,529 December , , ,097 June , , ,697 December , , ,896 June , , ,218 December , , ,536
75
AVI Limited presentation to shareholders & analysts for the year ended June 2018
 AVI Limited presentation to shareholders & analysts for the year ended June 2018 AGENDA Key features and results history Group financial results Business unit performance Prospects Questions and answers
AVI Limited presentation to shareholders & analysts for the year ended 30 June 2014
 AVI Limited presentation to shareholders & analysts for the year ended 30 June 2014 AGENDA Key features and results history Group financial results Performance and prospects Questions and answers KEY FEATURES
AVI LIMITED presentation to analysts. for the YEAR ENDED 30 June 2008 AGENDA. Key features. Group financial results. Operating environment.
 AVI LIMITED presentation to analysts for the YEAR ENDED 30 June 2008 AGENDA Key features Group financial results Operating environment Prospects Q&A KEY FEATURES Revenue from continuing operations up 14%
CONTENTS ABOUT THIS REPORT BOARD RESPONSIBILITY
 CONTENTS 1 OVERVIEW 1 Our business 1 Operating structure 2 Our business highlights 4 AVI objectives and strategies 6 BUSINESS REVIEW 6 Chairman and CEO s review 10 Operational reviews 10 ENTYCE BEVERAGES
GROWING GREAT BRANDS SENS DOCUMENT UNAUDITED INTERIM RESULTS FOR THE SIX MONTHS ENDED 31 DECEMBER 2017
 GROWING GREAT BRANDS SENS DOCUMENT UNAUDITED INTERIM RESULTS FOR THE SIX MONTHS ENDED 31 DECEMBER AVI LIMITED ISIN: ZAE000049433 Share code: AVI Registration number: 1944/017201/06 ( AVI or the Group or
AVI Limited ISIN: ZAE Share code: AVI Registration number: 1944/017201/06 ( AVI or the Group or the Company )
") AVI Limited ISIN: ZAE000049433 Share code: AVI Registration number: 1944/017201/06 ( AVI or the Group or the Company ) For more information, please visit our website: www.avi.co.za/investor/results and
AVI Limited ISIN: ZAE000049433 Share code: AVI Registration number: 1944/017201/06 ( AVI or the Group or the Company ) For more information, please visit our website: www.avi.co.za/investor/results and
GROWING GREAT BRANDS SENS DOCUMENT FOR THE YEAR ENDED 30 JUNE 2017
 GROWING GREAT BRANDS SENS DOCUMENT FOR THE YEAR ENDED 30 JUNE 2017 AVI LIMITED ISIN: ZAE000049433 Share code: AVI Registration number: 1944/017201/06 ( AVI or the Group or the Company ) For more information,
AVI LIMITED. ISIN: ZAE Share code: AVI Registration number: 1944/017201/06 ( AVI or the Group or the Company )
") SENS DOCUMENT FOR THE YEAR ENDED 30 JUNE 2014 AVI LIMITED ISIN: ZAE000049433 Share code: AVI Registration number: 1944/017201/06 ( AVI or the Group or the Company ) For more information, please visit our
SENS DOCUMENT FOR THE YEAR ENDED 30 JUNE 2014 AVI LIMITED ISIN: ZAE000049433 Share code: AVI Registration number: 1944/017201/06 ( AVI or the Group or the Company ) For more information, please visit our
INTERIM RESULTS for the six months ended 31 December 2009
 INTERIM RESULTS for the six months ended 31 December AVI Limited: ISIN: ZAE000049433 Share code: AVI Registration number: 1944/017201/06 ( AVI or the Group or the Company ) For more information, please
GROWING GREAT BRANDS
 RESULTS FOR THE SIX MONTHS ENDED 31 DECEMBER GROWING GREAT BRANDS AVI LIMITED ISIN: ZAE000049433 JSE and A2X share code: AVI Registration number: 1944/017201/06 ( AVI or the Group or the Company ) For
sens document for the year ended 30 June 2011
 sens document for the 2011 AVI Limited ISIN: ZAE000049433 Share code: AVI Registration number: 1944/017201/06 ( AVI or the Group or the Company ) For more information, please visit our website: www.avi.co.za
SENS DOCUMENT. for the year ended 30 June 2013
 SENS DOCUMENT for the year ended AVI LIMITED ISIN: ZAE000049433 Share code: AVI Registration number: 1944/017201/06 ( AVI or the Group or the Company ) For more information, please visit our website: www.avi.co.za
Edgars 3.3% CNA 9.9% Discount Division 11.8%
 Results for the year ended dd 28 March 2009 Q4 FY 2009 Excluding consolidation of OtC 2 Highlights for 4 th Quarter FY 2009 Retail sales up 7.3% to R4.6bn Divisional retail sales growth: Total Edgars 3.3%
2015 ANNUAL RESULTS PRESENTATION
 2015 ANNUAL RESULTS PRESENTATION Francois Kuttel & Imraan Soomra AGENDA Group Overview Financial Review Operational Review & Outlook Guidance GROUP OVERVIEW South Africa s most empowered listed company
Vitasoy Announces 15% Growth in Net Sales Revenue to HK$2,783 million for FY2008/09
 For Immediate Release Vitasoy Announces 15% Growth in Net Sales Revenue to HK$2,783 million for FY2008/09 Positive Sales Growth Recorded in All Major Markets Financial Highlights For the year ended 31st
ANALYST PRESENTATION FOR THE HALF-YEAR ENDED 30 SEPTEMBER 2010
 ANALYST PRESENTATION FOR THE HALF-YEAR ENDED 30 SEPTEMBER 2010 1 Agenda The economy and retail environment Review of the period Financial review Divisional review Financial services Outlook Questions Doug
INTERIM RESULTS PRESENTATION
 INTERIM RESULTS PRESENTATION for the six months ended 31 March 2016 Agenda Strategic Update Financial Performance Divisional Performance Outlook and Imperatives 1 Strategic Update Phil Roux CEO 2 Environmental
ANALYST PRESENTATION FOR THE YEAR ENDED 31 MARCH 2012
 ANALYST PRESENTATION FOR THE YEAR ENDED 31 MARCH 2012 1 TFG ANALYST PRESENTATION MARCH 2012 AGENDA Overview of the economy and retail environment Review of the year Financial review Divisional review Financial
Interim Results 6 months ended 30 September 2008
 Interim Results 6 months ended 30 September 2008 2008 highlights Revenue + 15.9% Operating profit - 44.6% 3326,7 2871,4 315,7 2177,8 256,9 1915,2 214,2 174,8 2005 2006 2007 2008 2005 2006 2007 2008 Headline
Full-year CY2017 Earnings Call
 Full-year CY2017 Earnings Call Lance Y. Gokongwei President and CEO Michael P. Liwanag Vice President AGENDA Full Year CY2017 Financial Performance and Business Updates Plans and Expectations for 2018
Group Results Presentation for the six months ended 31 March 2016
 Group Results Presentation for the six months ended 31 March 2016 Index Overview Financial performance Operational performance Outlook 2 Overview Noel Doyle Chief Operating Officer Disclaimer Forward-looking
Unaudited Interim results FOR THE SIX MONTHS ENDED 30 JUNE 2018
 Unaudited Interim results FOR THE SIX MONTHS ENDED 30 JUNE 2018 CORPORATE INFORMATION Sea Harvest Group Limited (Incorporated in the Republic of South Africa) Registration number: 2008/001066/06 JSE Code:
Half year result. 26 August 2016
 2016 Half year result 26 August 2016 Alison Watkins Group Managing Director Martyn Roberts Group Chief Financial Officer Barry O Connell MD Australian Beverages Agenda Group Result Summary Shareholder
GRUMA REPORTS SECOND QUARTER 2018 RESULTS
 Investor Relations ir@gruma.com Tel: 52 (81) 8399-3349 www.gruma.com San Pedro Garza García, N.L., Mexico; July 25, 2018 GRUMA REPORTS SECOND QUARTER 2018 RESULTS HIGHLIGHTS GRUMA s performance in the
Mr Price Group Limited Interim Results September 2009
 Interim Results September 2009 Total consumer spending contracted sharply Decline in retail sales in real terms for seven consecutive months Household debt to disposable income at historically high levels
Nestlé India Limited. 22nd Financial Analysts Meet. Gurgaon 30 th July 2013
 Nestlé India Limited 22nd Financial Analysts Meet Gurgaon 30 th July 2013 Disclaimer This presentation may contain statements which reflect Management s current views and estimates and could be construed
Directors Report to Shareholders For the 28 Weeks ended 14 September 2015 (1H 2016)
") Directors Report to Shareholders For the 28 Weeks ended 14 September 2015 (1H 2016) Key Points Total Group Sales ($m) 210.0 185.7 +24.3 +13.1 Group Net Profit after Tax ($m) 13.4 11.5 +1.9 +16.7 Dividend
Directors Report to Shareholders For the 28 Weeks ended 14 September 2015 (1H 2016) Key Points Total Group Sales ($m) 210.0 185.7 +24.3 +13.1 Group Net Profit after Tax ($m) 13.4 11.5 +1.9 +16.7 Dividend
TRELLIDOR HOLDINGS LIMITED AUDITED RESULTS FOR THE YEAR ENDED 30 JUNE 2016
 TRELLIDOR HOLDINGS LIMITED AUDITED RESULTS FOR THE YEAR ENDED 30 JUNE 2016 OVERVIEW Trellidor is the market leading manufacturer of custom made barrier security products Distribution through dedicated
Fiona is happy to do this slide
 Fiona is happy to do this slide DISCLAIMER This presentation contains not only a review of operations, but also some forward looking statements about Sanford Limited and the environment in which the company
TRELLIDOR HOLDINGS LIMITED UNAUDITED INTERIM RESULTS FOR THE SIX MONTHS ENDED 31 DECEMBER 2017
 TRELLIDOR HOLDINGS LIMITED UNAUDITED INTERIM RESULTS FOR THE SIX MONTHS ENDED 31 DECEMBER 2017 GROUP HIGHLIGHTS 5% Revenue 5% PAT 5% HEPS 35.2c 5% Interim dividend declared 11.0 cents per share Slide 2
Results Presentation. for 26 weeks ended 28 June 2015
 Results Presentation for 26 weeks ended 28 June 2015 The Environment It s tough out there! South Africa: Consumer confidence at 14-year low CPI range-bound but Food inflation soon to increase Manufacturing
1H FY19 RESULTS PRESENTATION 25 February 2019
 RELIANCE WORLDWIDE CORPORATION LIMITED ACN 610855877 1H FY19 RESULTS PRESENTATION 25 February 2019 INVESTOR PRESENTATION 1H FY19 RESULTS PAGE 0 Important Notice This presentation contains general information
Period overview Operational Overview Financial Results Conclusion
 Interim Results Six months ended 31 ust 2015 Bridging y expectations Agenda Period overview Operational Overview Financial Results Conclusion Bridging y expectations 2 1 Six month overview Satisfactory
Interim Results Presentation For six months to June Saving our customers money so they can live better
 Interim Results Presentation For six months to June 2017 Saving our customers money so they can live better Agenda 1 Financial review 2 Operational review 3 Strategy & prospects Financial Review Hans van
GROUP RESULTS PRESENTATION For the year ended 30 September 2017
 GROUP RESULTS PRESENTATION For the year ended 30 September 2017 Index Overview Financial & operational performance Strategy update 2 Disclaimer Forward-looking statement This document contains forward
Interim results FY2018 GROUP HIGHLIGHTS
 01 Interim results FY2018 GROUP HIGHLIGHTS Trading environment overview Sept 17 headline CPI 5.1% (avg March Sept 5.1%) Interest rates between 10.25% & 10.50% since Jan 16 Labour force up 696k (employed
Mr Price Group Limited Interim Results September 2012
 Mr Price Group Limited Interim Results September 2012 Group Highlights RETAIL SALES AND OTHER INCOME R6.2bn 14.5% OPERATING PROFIT R825m 21.2% OPERATING MARGIN 13.7% 0.8% HEADLINE EARNINGS PER SHARE 253.2c
MR PRICE GROUP LIMITED
 MR PRICE GROUP LIMITED OPERATING REPORT 26 WEEKS ENDED 28 SEPTEMBER 2013 1 Registration number 1933/004418/06 Incorporated in the Republic of South Africa ISIN: ZAE 000026951 JSE share code: MPC ( Mr Price
9M CY2018 Unaudited Results Investor Briefing October 25, 2018
 9M CY2018 Unaudited Results Investor Briefing October 25, 2018 Irwin C. Lee President and CEO Mike P. Liwanag Senior Vice President AGENDA 1 9M CY2018 Unaudited Financial Results 2 Expectations & Updates
Unaudited Interim results
 Unaudited Interim results for the six months ended 30 June 2017 CORPORATE INFORMATION Sea Harvest Group Limited (Formerly Sea Harvest Holdings Proprietary Limited) (Incorporated in the Republic of South
Monthly Report PERFORMANCE OF THE ECONOMY. May 2017 MACROECONOMIC POLICY DEPARTMENT MINISTRY OF FINANCE, PLANNING AND ECONOMIC DEVELOPMENT
 Monthly Report PERFORMANCE OF THE ECONOMY May 2017 MACROECONOMIC POLICY DEPARTMENT MINISTRY OF FINANCE, PLANNING AND ECONOMIC DEVELOPMENT www.finance.go.ug Table of Contents SUMMARY:... 1 REAL SECTOR DEVELOPMENTS:...
Analyst Presentation for the half-year ended 31 August 2012
 Analyst Presentation for the half-year ended 31 August 2012 Agenda 1. General commentary on the period Kevin Hodgson 2. Financial review Cobus Loubser 3. Questions Page 2 General Commentary Page 3 Review
Results presentation. for the 26 weeks ended 26 August 2018
 Results presentation for the 26 weeks ended 26 August 2018 Agenda Chairman s introduction Gareth Ackerman Chairman Results overview Bakar Jakoet Chief Finance Officer Progress on our plan Richard Brasher
FY2012 First Quarter Results February 15, 2012
 FY2012 First Quarter Results February 15, 2012 AGENDA FY12 Q1 Financial Performance Plans and Expectations Total URC: Margin recovery has started Php Billions First Quarter 2012 (Year on year % change)
ANNUAL RESULTS PRESENTATION
 ANNUAL RESULTS PRESENTATION FOR THE YEAR ENDED 30 SEPTEMBER 2016 CONTENTS 2 Annual Results Presentation 8 Financial Performance 19 Divisional Performance 19 Essential Foods 26 Groceries 35 International
FINANCIAL HIGHLIGHTS. 22%TO 31.1 cents. improved 10% TO. R573 million. 20%TO R177 million. improved 67% TO. 10 cents PER SHARE. 15% TO R7 056 million
 HIGHLIGHTS FINANCIAL HIGHLIGHTS CONTINUING HEADLINE EARNINGS PER SHARE 22%TO 31.1 cents CONTINUING HEADLINE EARNINGS 20%TO R177 million CONTINUING GROSS LOANS & ADVANCES 15% TO R7 056 million NON-PERFORMING
BELL EQUIPMENT LTD RESULTS FOR THE 12 MONTHS ENDED 31 DECEMBER 2017 AND BUSINESS REVIEW
 BELL EQUIPMENT LTD RESULTS FOR THE 12 MONTHS ENDED 31 DECEMBER 2017 AND BUSINESS REVIEW Financial Highlights for 2017 Revenue up 13% to R6,8 billion NPAT up from R39 million to R272 million HEPS per share
UNAUDITED INTERIM RESULTS FOR THE SIX MONTHS ENDED 30 JUNE 2015
 Profitability. Empowerment. Positive Social Impact. ISIN Number: ZAE000015277 Share Code: BRT ISIN Number: ZAE000015285 Share Code: BRN Company Registration Number: 1995/010442/06 (Incorporated in the
AUDITED RESULTS FOR THE YEAR ENDED 31 DECEMBER 2016
 AUDITED RESULTS FOR THE YEAR ENDED 31 DECEMBER 2016 AGENDA 2 1 Opening remarks / market update 2 Financial results 3 Operational review 4 Strategy update 5 Outlook 1 2 3 4 5 OPENING REMARKS / MARKET UPDATE
Group results and dividend declaration for the six months ended 31 March 2011
 Tiger Brands Limited Registration number 1944/017881/06 (Incorporated in the Republic of South Africa) Share code: TBS ISIN: ZAE000071080 Group results and dividend declaration for the six months ended
RESULTS PRESENTATION FOR THE 52 WEEKS ENDED 25 FEBRUARY 2018
 RESULTS PRESENTATION FOR THE 52 WEEKS ENDED 25 FEBRUARY 2018 1 Chairman s introduction Gareth Ackerman Chairman 2 3 Results overview Bakar Jakoet Chief Finance Officer Progress on our plan Richard Brasher
Nampak 2013 Interim Results
 Nampak 2013 Interim Results May 2013 1 Agenda Salient features Group results Operational review Strategic update Outlook 2 Salient Features Revenue up 7%, Africa up 19% Trading profit up 6% Profits from
SUMMARY GROUP RESULTS AND FINAL CASH DIVIDEND DECLARATION FOR THE 52 WEEKS ENDED 31 MARCH 2018
 MR PRICE GROUP LIMITED Registration number 1933/004418/06 Incorporated in the Republic of South Africa ISIN: ZAE 000200457 JSE share code: MRP ( Mr Price or the Company or the Group ) MR PRICE GROUP LIMITED
AUDITED summarised CONSOLIDATED annual FINANCIAL RESULTS
 AUDITED summarised CONSOLIDATED annual FINANCIAL RESULTS FOR THE YEAR ENDED 31 DECEMBER 2017 CORPORATE INFORMATION Sea Harvest Group Limited (Formerly Sea Harvest Holdings Proprietary Limited) (Incorporated
GRUMA REPORTS SECOND QUARTER 2013 RESULTS
 IR Contact Information: ir@gruma.com (52) 81 8399-3311 and 24 Monterrey, N.L. Mexico; July 24, 2013 www.gruma.com GRUMA REPORTS SECOND QUARTER 2013 RESULTS HIGHLIGHTS The positive performance of GRUMA
Barloworld Limited. Reviewed interim results to 31 March May 15, 2006
 Barloworld Limited Reviewed interim results to 31 March 2006 May 15, 2006 BARLOWORLD IS A DIVERSIFIED INDUSTRIAL COMPANY Over 26 000 people in 31 countries Barloworld s way of doing business - market-leading
MR PRICE GROUP LTD Sector: Consumer Discretionary Max Sector Weight: 32%
 Company Results Analysis 24 November 2017 Recommendation: Underweight JSE Capped SWIX weighting: 0.80% Recommended Exposure: 0% JSE Code: MRP Current Share Price: ZAR 20700c MR PRICE GROUP LTD Sector:
INTERIM RESULTS ANNOUNCEMENT MONDAY, 26 FEBRUARY 2018 AT 10H00 JOHANNESBURG MEDIA PRESENTATION SPEAKER NOTES SASOL CFO PAUL VICTOR
 INTERIM RESULTS ANNOUNCEMENT MONDAY, 26 FEBRUARY 2018 AT 10H00 JOHANNESBURG MEDIA PRESENTATION SPEAKER NOTES SASOL CFO PAUL VICTOR 1 SLIDE 11: TITLE SLIDE Thank you Steve and Bongani, and good morning
Financial results presentation For the period ended 30 June External structural and cyclical impacts on results
 212 Financial results presentation For the period ended 3 June 212 External structural and cyclical impacts on results Macro factor Developing versus developed world Consequence SA and Africa relatively
RESULTS PRESENTATION
 THE FOSCHINI GROUP LIMITED RESULTS PRESENTATION FOR THE 6 MONTHS ENDED 30 SEPTEMBER RESULTS PRESENTATION FOR THE HALFYEAR ENDED 30 SEPTEMBER AGENDA Economy and retail environment Doug Murray Business
ANNUAL RESULTS PRESENTATION. for the year ended 30 September 2016
 ANNUAL RESULTS PRESENTATION for the year ended 30 September 2016 What a year!! Salient Features: Massive discontinuities Drought Rand volatility Wheat duty So Portfolio and brand strength matters (size
EC ONO MI C BU LLE TIN
 BANK OF TANZANIA EC ONO MI C BU LLE TIN FOR THE QUARTER ENDING ECONOMIC JUNE 2018 BULLETIN VOL. L NO. 2 FOR THE QUARTER ENDING JUNE 2018 VOL. L NO. 2 For any inquiry please contact: Director of Economic
1H CY2018 Unaudited Results Investor Briefing July 30, 2018
 1H CY2018 Unaudited Results Investor Briefing July 30, 2018 Irwin C. Lee President and CEO Mike P. Liwanag Vice President AGENDA 1H CY2018 Unaudited Financial Results Our Plans, Expectations and Guidance
A N N U A L S H A R E H O L D E R S M E E T I N G N O V E M B E R
 A N N U A L S H A R E H O L D E R S M E E T I N G N O V E M B E R 2 0 1 7 AGENDA Welcome Chairman s review Managing Director s review Ordinary business and resolutions 2 CHAIRMAN S REVIEW Successful IPO
March 2017 PROSPERITY IN THIS CLIENT NEWSLETTER. Economic and market outlook Local and global equities
 March 2017 PROSPERITY IN THIS CLIENT NEWSLETTER Economic and market outlook Local and global equities The unfortunate local events leading to the replacement of both the finance and deputy-finance minister
TONGAAT HULETT AUDITED RESULTS FOR THE YEAR ENDED 31 MARCH 2013
 1 TONGAAT HULETT AUDITED RESULTS FOR THE YEAR ENDED 31 MARCH 2013 Revenue of R14,373 billion (2012: R12,081 billion) +19,0% Profit from operations of R2,145 billion (2012: R1,921 billion) +11,7% Cash flow
Nestlé India Limited 20th Financial Analysts Meet - Gurgaon 30th November 2011
 Nestlé India Limited 20 th Financial Analysts Meet - Gurgaon 30 th November 2011 Disclaimer This presentation may contain statements which reflect Management s current views and estimates and could be
Tiger Brands Limited. Group Results Presentation. for the year ended 30 September 2015
 Tiger Brands Limited Group Results Presentation for the year ended 30 September 2015 2 Index Strategic review 3 Strategic review Peter Matlare Chief Executive Officer 4 Key strategic deliverables 1 Improve
For personal use only
 31 July 2015 The Manager Listings ASX Market Announcements Australian Securities Exchange Level 4 Exchange Centre 20 Bridge Street Sydney NSW 2000 Via e-lodgement Tassal completes De Costi Seafoods Acquisition
Paul Maguire Philip Bennett Paul Witheridge Managing Director Chief Financial Officer Chief Financial Officer
 McPherson s Limited Results for the year to 30 June 2011 Paul Maguire Philip Bennett Paul Witheridge Managing Director Chief Financial Officer Chief Financial Officer McPherson s Limited McPherson s Limited
KAP INDUSTRIAL HOLDINGS LIMITED UNAUDITED RESULTS FOR THE SIX MONTHS ENDED 31 DECEMBER 2018
 KAP INDUSTRIAL HOLDINGS LIMITED INTEGRATED INTO EVERY DAY INTRODUCTION JAAP DU TOIT CHAIRMAN AGENDA INTRODUCTION JAAP DU TOIT UNAUDITED INTERIM RESULTS FOR THE SIX STRATEGY MONTHS IMPLEMENTATION ENDED
Logista Q Results. July 26, 2018
 Logista Q3 2018 Results July 26, 2018 Logista reports Q3 2018 Results Logista announces today its Q3 Results for 2018. Main highlights: Economic Sales 1 increase by 7,8% improving the 1.3% drop in Revenues
Thai Union Group Public Company Limited
 2Q17: Strict cost control aided operation Revenue 2Q17 sales grew by 1.2 YoY to THB 34,818mn. Soft sales growth was driven by weak market demand amid product repricing and the European currency depreciation.
HUON AQUACULTURE GROUP LIMITED
 HUON AQUACULTURE GROUP LIMITED RESULTS PRESENTATION FOR FIRST HALF FY2017 IMPORTANT NOTICE This presentation is provided by Huon Aquaculture Group Limited (ACN 114 456 781) to provide summary information
LANXESS AG Executing on Strategy and Operations
 LANXESS AG Executing on Strategy and Operations 17 th Annual Citigroup Chemicals Conference New York, December 5 th 6 th, 2006 Matthias Zachert, CFO Conference 2006 Chart-No. 1 Safe harbour statement This
GRUMA REPORTS FIRST QUARTER 2018 RESULTS
 Investor Relations ir@gruma.com Tel: 52 (81) 8399-3349 www.gruma.com San Pedro Garza García, N.L., Mexico; April 25, 2018 HIGHLIGHTS GRUMA REPORTS FIRST QUARTER 2018 RESULTS GRUMA s performance showed
Group turnover* R15,9 billion 9% Group operating income* R2,1 billion 7% cents 7% HEPS* unchanged at. 978 cents. Interim dividend per share
 group results and dividend declaration for the 2016 Highlights Continuing operations deliver a solid underlying performance * From continuing operations. Group turnover* R15,9 billion 9% Group operating
McCormick & Company, Inc.
 McCormick & Company, Inc. Fourth Quarter 2008 Financial Results and Business Outlook The following slides accompany a January 28, 2009 presentation to investment analysts 1 Forward-looking information
FY17 Results. 25 September 2017
 FY17 Results 25 September 2017 Forward Looking Statement This document contains forward looking statements, which reflect management s current views and estimates. The forward looking statements involve
ARYZTA AG. H1 Results, FY March 2017
 ARYZTA AG H1 Results, FY 2017 13 March 2017 Forward Looking Statement This document contains forward looking statements which reflect the Board of Directors' current views and estimates. The forward looking
Third Quarter 2018 Earnings Conference Call
 Third Quarter 2018 Earnings Conference Call November 5, 2018 1 Third Quarter 2018 Earnings Conference Call Forward-Looking Statements Statements made during this call and presentation that set forth expectations,
PRESENTATION OF FINANCIAL RESULTS
 PRESENTATION OF FINANCIAL RESULTS LINDA MASTERSON GROUP MANAGING DIRECTOR 28 March 2018 0 EDGARS 1 EXECUTIVE SUMMARY Sales growth: Edgars 16.5%, Jet 35.8%. Significant improvement in quality of debtors
Interim Results. Six months ended 31 August 2016
 Interim Results Six months ended 31 August 2016 Stefanutti Stocks City A multi-disciplinary construction group (Vision) (Mission) 2 www.stefanuttistocks.com y 2 Agenda Six month overview Operational Overview
FISCAL YEAR 2017 INTERIM RESULTS FOR 12 WEEKS ENDED 17 JUNE JULY 2016
 FISCAL YEAR 2017 INTERIM RESULTS FOR 12 WEEKS ENDED 17 JUNE 16 27 JULY 2016 Agenda Key Highlights Financial Review Outlook Q&A Presenter: Tarsem Dhaliwal (CFO) First quarter:12 weeks ending 17 June 2016
H1 16 interim results. 22 September 2015
 H1 16 interim results 22 September 2015 Important notice 2 This presentation may include certain forward-looking statements, beliefs or opinions, including statements with respect to the Company s business,
Ontex Q3 2018: Further progress in challenging environment
 Ontex Q3 2018: Further progress in challenging environment Q3 LFL revenue ex Brazil +3%, outperforming flat hygiene markets Continuous focus on value: price/mix +2.9% Important milestones achieved in Brazil
ANNUAL RESULTS PRESENTATION. for the year-ended 30 September 2015
 ANNUAL RESULTS PRESENTATION for the year-ended 30 September 2015 Agenda Pioneer Foods Introduction Phil Roux Financial review Cindy Hess Divisional reviews o Essential Foods Carstens o Groceries Lombard
Interim Results for the 26 weeks ended 29 June 2014
 Interim Results for the 26 weeks ended 29 June 2014 1 The Team David Wild Chief Executive Officer Sean Wilkins Chief Financial Officer 2 Highlights of H1 2014 11.3% UK LFL UK on-line accounting for 69.7%
For personal use only Y E A R R E S U L T S FY17
 H A L F Y E A R R E S U L T S FY17 I M P O R T A N T N O T I C E & D I S C L A I M E R This presentation has been prepared by Specialty Fashion Group Limited (the Company ). It contains general background
Brunswick Earnings Conference Call Q3, 2018
 Brunswick Earnings Conference Call Q3, 2018 Forward-Looking Statements Certain statements in this presentation are forward-looking as defined in the Private Securities Litigation Reform Act of 1995. Forward-looking
ANNUAL RESULTS FOR THE YEAR ENDED 31 AUGUST 2017
 ANNUAL RESULTS FOR THE YEAR ENDED 31 AUGUST 2017 PRESENTATION OUTLINE Review of the year Financial results Trading performance Outlook Questions 2 REVIEW OF THE YEAR DAVID KNEALE REVIEW OF THE YEAR Strong
THE J. M. SMUCKER COMPANY
 Richard Smucker Chief Executive Officer THE J. M. SMUCKER TEAM RICHARD SMUCKER Chief Executive Officer MARK SMUCKER President, U.S. Retail Coffee PAUL SMUCKER WAGSTAFF President, U.S. Retail Consumer Foods
We prioritize sustainable, profitable growth
 We prioritize sustainable, profitable growth Updated growth target reflects prioritization of profitability over overly expensive growth Previous financial targets for 2020 Updated targets Net sales At
ANNUAL SHAREHOLDERS MEETING May 12, 2014
 ANNUAL SHAREHOLDERS MEETING May 12, 2014 AGENDA PERFORMANCE FY14 FIRST HALF RESULTS PLANS AND GUIDANCE Strong track record of growth and increasing shareholder value over the last ten years Managed to
INTERIM RESULTS ANNOUNCEMENT MONDAY, 25 FEBRUARY 2019 AT 10H00 JOHANNESBURG MEDIA PRESENTATION SPEAKER NOTES SASOL CFO PAUL VICTOR
 INTERIM RESULTS ANNOUNCEMENT MONDAY, 25 FEBRUARY 2019 AT 10H00 JOHANNESBURG MEDIA PRESENTATION SPEAKER NOTES SASOL CFO PAUL VICTOR SLIDE 12: TITLE SLIDE Thank you Steve and Bongani, and good morning ladies
FY2014 Nine Months Results
 FY2014 Nine Months Results August 13, 2014 Lance Y. Gokongwei President & CEO Michael P. Liwanag Vice President Disclaimer This presentation contains certain forward looking statements with respect to
Index. BUSINESS UNITS RESULTS 1H Rice 1.2 Pasta EBRO FOODS GROUP CONSOLIDATED RESULTS 1H Income Statement 2.2 Debt Evolution CONCLUSION
 RESULTS 1H16 1 Index BUSINESS UNITS RESULTS 1H16 1.1 Rice 1.2 Pasta EBRO FOODS GROUP CONSOLIDATED RESULTS 1H16 2.1 Income Statement 2.2 Debt Evolution CONCLUSION CORPORTE CALENDAR 2016 DISCLAIMER 2 1.BUSINESS
THE FOSCHINI GROUP LIMITED RESULTS PRESENTATION
 THE FOSCHINI GROUP LIMITED RESULTS PRESENTATION RESULTS PRESENTATION AGENDA Economy and retail environment Doug Murray Business overview Doug Murray Review of the year Doug Murray Financial review Anthony
Acquisition of Crown Flour Mills Limited 12 January 2010 Singapore
 Acquisition of Crown Flour Mills Limited 12 January 2010 Singapore 1 1 Cautionary note on forward-looking statements This presentation may contain statements regarding the business of Olam International
4 th Quarter 2015 Financial Results
 4 th Quarter 2015 Financial Results 23 rd February 2016 Disclaimer The presentation is prepared by Super Group Ltd ( Super or the Group ) and is solely for the purpose of corporate communication and general