AVI Limited presentation to shareholders & analysts for the year ended 30 June 2014
|
|
|
- Laura Ford
- 5 years ago
- Views:
Transcription

1 AVI Limited presentation to shareholders & analysts for the year ended 30 June 2014

2 AGENDA Key features and results history Group financial results Performance and prospects Questions and answers

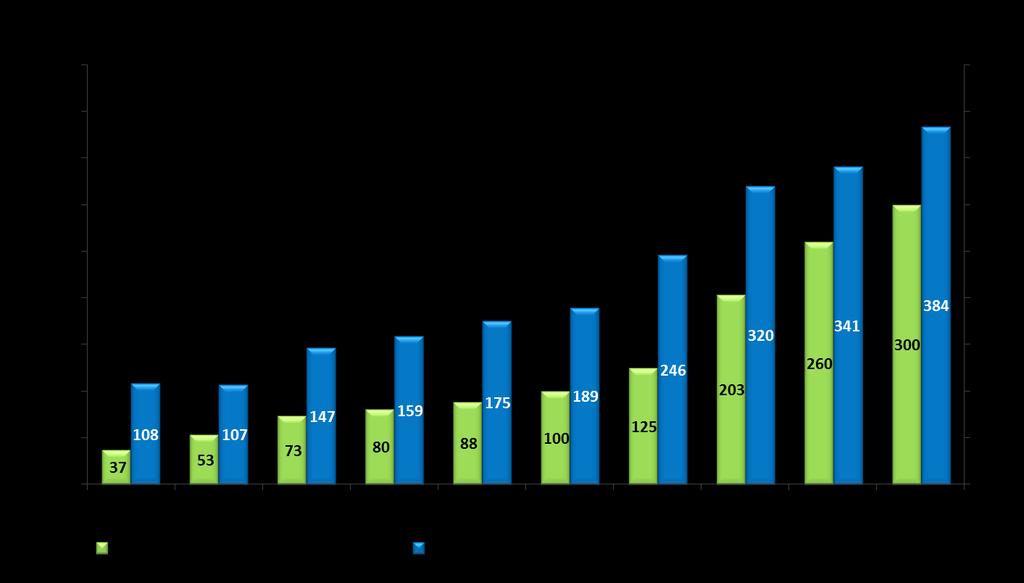
3 KEY FEATURES Revenue from continuing operations up 11% to R10,27 billion; Operating profit from continuing operations up 12% to R1,71 billion; Headline earnings per share from continuing operations up 12% to 384 cents; Sound group performance notwithstanding pressure on consumers and rising input costs; R532 million investment in capacity and efficiency Capital profit of R150 million following revision of Coty license agreement; Total dividend up 15% to 300 cents per share Final dividend of 180 cents per share

4 RESULTS HISTORY Operating profit history - continuing operations Compound annual growth rate from F05 to F14 of 16,4% Operating profit margin increased from 9,9% in F05 to 16,7% in F14

5 RESULTS HISTORY Historical cash generation - continuing operations Good conversion of operating profit growth to cash Continued investment in replacement, capacity and efficiency

6 RESULTS HISTORY Dividend yield (based on closing share price) Total dividend yield includes payments out of share premium and special dividends F14 dividend yield based on closing share price of R61,25 Excludes share buy-backs


7 RESULTS HISTORY Return on capital employed Continued high returns with capital expenditure supporting growth and efficiency
8 Group Financial Results
9 GROUP FINANCIAL RESULTS Income statement - continuing operations F14 F13 Rm Rm % Revenue , ,3 11,4 Gross profit 4 427, ,8 7,8 Gross profit margin % 43,1 44,6 (3,4) Operating profit 1 712, ,2 12,2 Operating profit margin % 16,7 16,6 0,6 Net financing cost (48,4) (52,7) (8,2) Share of Joint Venture 28,5 23,9 19,2 Capital items 138,0 (4,6) Effective tax rate % 28,1 30,1 Headline earnings 1 203, ,5 14,9 HEPS (cps) 383,6 341,2 12,4

10 GROUP FINANCIAL RESULTS Movement in gross profit margin continuing operations Fashion brands impacted by weaker Rand and constrained consumer environment Grocery business benefitted from better I&J margin Coty restructuring positive at operating profit level
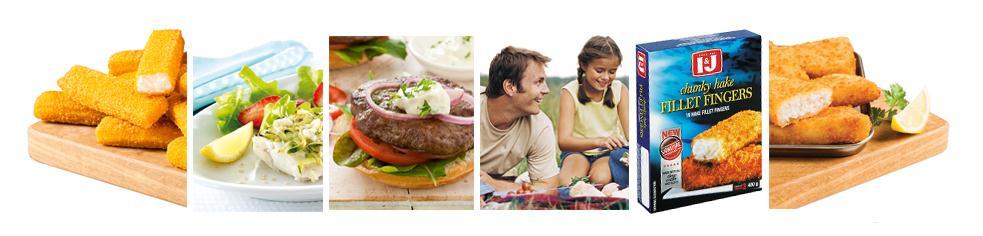
11 GROUP FINANCIAL RESULTS Operating profit 12,2% up continuing operations Entyce: Volume growth in tea, coffee and creamer Snackworks: Higher volumes, especially biscuits, and improved snacks price levels I&J: weaker Rand, improved fishing and processing Personal Care: body spray volume growth and fixed cost management Spitz: Margin pressure from weaker Rand and lower footwear volumes Green Cross: lower wholesale and tender volumes and investment for growth
12 GROUP FINANCIAL RESULTS Continuing operations F14 F13 Rm Rm % Cash generated by operations 2 001, ,5 28,6 Working capital to revenue % 18,5 19,1 (3,4) Capital expenditure 531,9 566,9 (6,2) Depreciation and amortisation 286,1 259,0 10,5 Net debt 349,0 681,1 Net debt / capital employed % 7,6 15,6 Strong operating result and improved working capital position Working capital benefit of R50 million from change in Coty terms Strong cash generation driving lower net debt position
13 GROUP FINANCIAL RESULTS Cash flows continuing operations

14 GROUP FINANCIAL RESULTS Capital expenditure & depreciation continuing operations
15 GROUP FINANCIAL RESULTS Capital projects spend summary F14 Rm Coffee process improvement 20 Coffee packaging line upgrades 23 Tea packaging line replacement and upgrade 12 Tea property purchase 11 Biscuit process improvement 22 Redhill distribution centre expansion 19 I&J vessel dry-docks and upgrade 47 I&J vessel replacement initial payments 108* Spitz store additions and refurbishments 17 Kurt Geiger store additions and refurbishments 7 Green Cross Epping upgrade * Detailed schedule in I&J review
16 GROUP FINANCIAL RESULTS Dividends F14 F13 % Interim dividend - cps ,3 Final dividend - cps ,9 Normal dividend - cps ,4 Normal dividend yield - %* 4,9 4,4 Special dividend cps 180 Total dividend cps Total dividend yield - %* 4,9 7,4 Cover ratio normal dividend 1,25 1,25 including special dividend 1,25 0,70 * Calculated using the closing share price at the end of each financial year

17 Performance and prospects
18 Income statement - continuing operations Continued strong performance from tea Leading market position and strong margins maintained Good rooibos category and market share growth Margin pressure from high rooibos prices and the weaker Rand Coffee performance constrained by category pressure and competition Healthy profit margins maintained Margin pressure from weaker Rand New pack formats to improve affordability Continued investment in manufacturing capability

19 Income statement - continuing operations Creamer performance constrained by competitor pressure Good volume growth, particularly in H2, supported by increased capacity Growth in selling prices and profit margins constrained by competitor activity Unpredictable glucose supply risk to service levels
20 Sales volume and selling prices % Δ F14 vs F13 Comments Tea revenue growth 15,8 Volume 6,7 Strong rooibos growth with muted growth in black tea from lower demand Ave. selling price 8,5 Increases in response to raw material Coffee revenue growth 6,8 increases and weaker Rand Volume 4,9 Pressure on affordable SKU s with rising price points. Ave. selling price 1,8 Price increases limited by constrained Creamer revenue growth 18,6 environment and competitor activity Volume 20,0 Category growth and increase in market share Ave. selling price (1,2) Tactical discounting supported by benign raw material cost increases

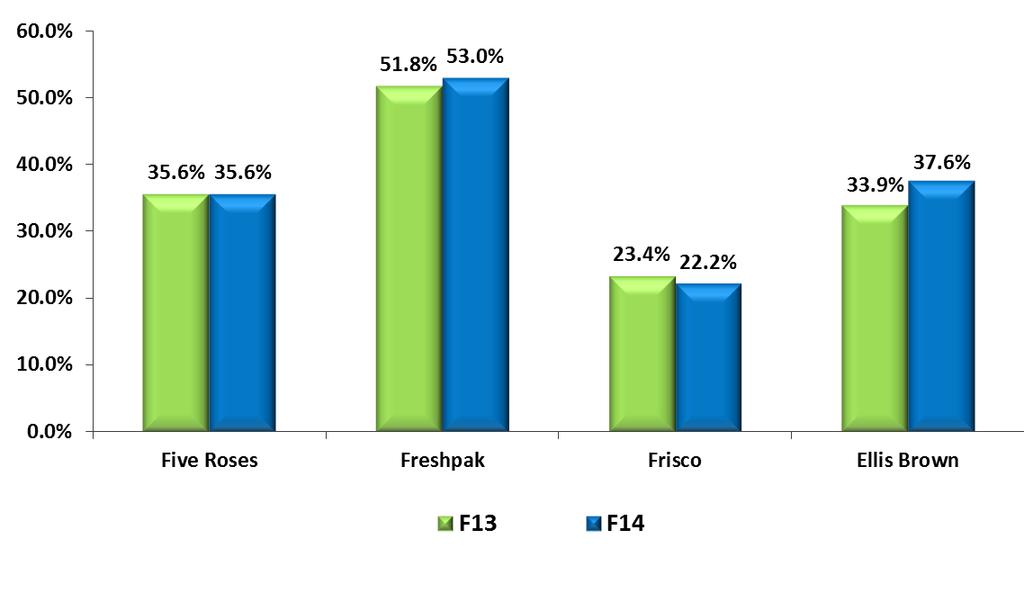
21 Market shares

22 Costs Cost impact of raw materials and commodities consumed in the period (F14 vs F13): Weaker Rand impacted on all imported / parity priced inputs Improvements in black tea, coffee and palm oil USD prices Double digit rooibos tea cost increases

23 Prospects for F15 Constrained consumer spending Selling price increases in Qtr 4 F14 to ameliorate raw material cost pressure from weaker Rand Maintain strong Tea position Five Roses and Freshpak Focus on mixed instant coffee market share Frisco granules and affordable refill format Continued improvement of coffee factory performance Creamer focus on pricing and margin improvement Tea factory site upgrade review Higher export growth Further selling price increases in F15 if Rand weakens more


24 Performance and prospects


25 Income statement Sustained strong Biscuits performance Effective pricing / promotion to drive volumes Mix change in favour of affordable products Factory performance capacity, quality, efficiency New flavour variants and pack formats Progress on savoury portfolio Improving Snacks margin Better average prices Improved factory focus Service levels in H1 impacted by potato supply issues
26 Sales volume and selling prices % Δ F14 vs F13 Comments Biscuits revenue growth 15,0 Volume growth 9,4 Effective pricing / promotional activity and category growth Ave. selling prices 5,2 Impact of increases diluted by change in sales mix Snacks revenue growth 11,0 Volume growth 3,7 Category growth; good corn product performance Ave. selling prices 7,0 Improved category pricing

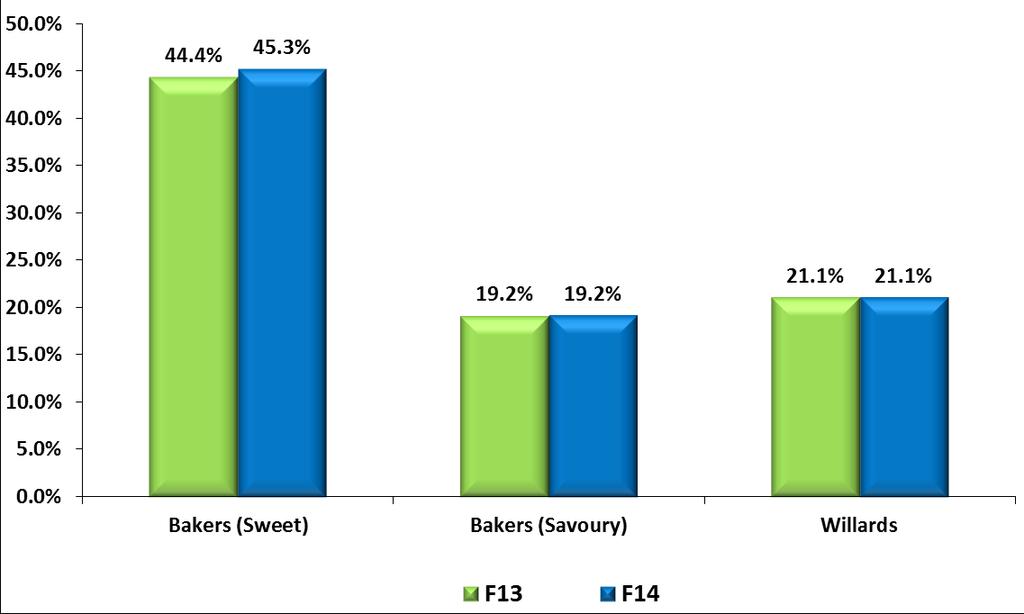
27 Market shares
: Weaker Rand impacted on all imported / parity priced inputs")
28 Costs Cost impact of raw materials and commodities consumed in the period (F14 vs F13): Weaker Rand impacted on all imported / parity priced inputs

29 Prospects for F15 Constrained consumer spending Selling price increases in Qtr 4 F14 to ameliorate raw material cost pressure from weaker Rand Sustain biscuit volume momentum Increased NPD and associated marketing Ongoing focus on factory performance, yields and efficiency Snacks factory focus and investment Continued export growth Further selling price increases in F15 if Rand weakens more
30 Performance and prospects
31 Income statement Material benefit from weaker Rand Higher catch and sales volumes due to: Improved wet fleet availability Higher freezer vessel catch rates Improved fishing and processing performance Operating costs impacted by higher fuel prices and general cost pressure Limited increases in export market selling prices Once-off pension fund surplus of R24 million in F13
32 Income statement Fishing benefitted from the better H2 performance Processing cost impact includes Marel benefit at Woodstock wet fish processing facility
33 Sales volume and selling prices % Δ F14 vs F13 Comments I&J Domestic revenue growth 8,3 Volume 1,4 Increased retail volumes Ave. selling prices 6,8 Increases taken and favourable product mix I&J Export revenue growth 21,6 changes Volume 1,8 Increased catch volumes from better freezer vessel catch rates Ave. selling prices 19,4 Mostly attributable to exchange rate; increases achieved in foreign prices for most products

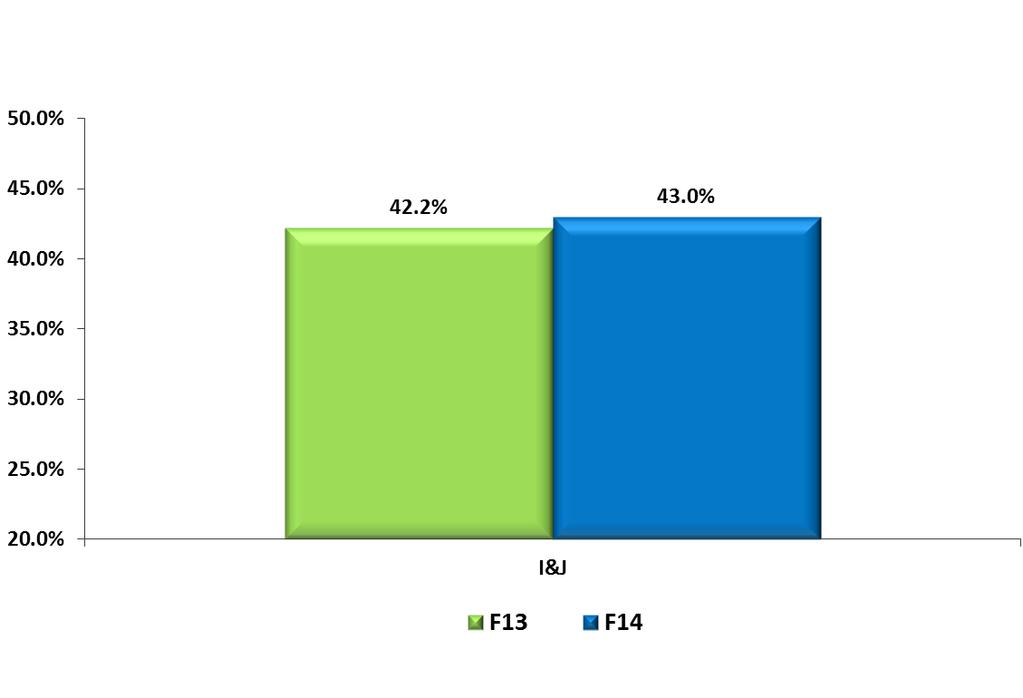
34 Local market share


35 Fishing performance Increase in overall tons caught from improved availability Catch rates still healthy but lower than last few years Freezer fleet higher than last year Wet fleet impacted by weather conditions in H1 Continued improvement through use of technology and capacity investment


36 Vessel replacement cash flow summary Increased catching capacity of quota tons from F16 Improved catching efficiency and lower maintenance costs

37 Prospects for F15 Higher exchange rates secured for 65% of export revenue Increased catch volume with additional wet vessel (purchase and sale back) Export markets: Improving species recognition for Cape Hake Achieving regular selling price increases Domestic market focus on profitability vs market share Continued improvement in operations performance fishing, processing, overheads Major projects - new wet and freezer vessel for delivery H1 F16 MSC re-certification for the next 5 years initial indications positive Simplot JV operating model review


38 Performance and prospects

39 Income statement Category constrained and competitive Gross margin pressure from weaker Rand Good Yardley performance led by body sprays and colour cosmetics Growth in body spray volumes notwithstanding increased competition New trading terms with Coty from 1 November 2013 operating profit preserved Improved overhead cost management

40 Sales volume and selling prices % Δ F14 vs F13 Comments Personal Care revenue 7,7 growth* Volume growth 4,5 Increase in body sprays Ave. selling price 3,1 Price increases and lower levels of discounting, reduced by change in product mix * Like-for-like comparison excluding Coty

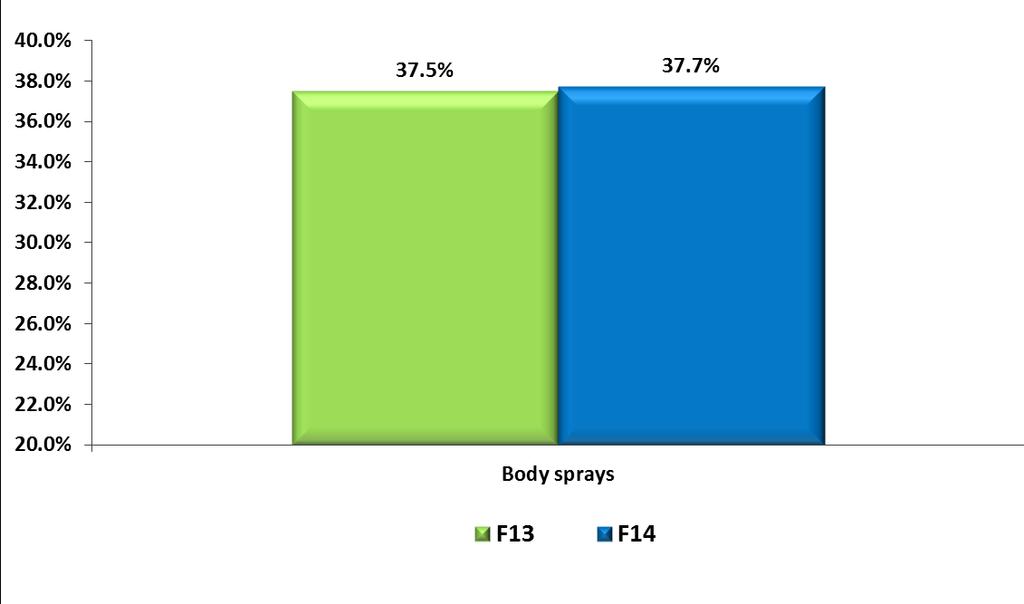
41 Market share

42 Prospects for F15 Constrained consumer spending Selling price increases in Qtr 4 F14 to ameliorate raw material cost pressure from weaker Rand Target body spray growth utilising spare capacity Increased NPD / product launch activity Improved wholesale channel presence Export growth Ongoing site development warehouse and distribution capacity


43 Performance and prospects

44 Income statement Revenue growth impacted by: Higher selling prices Kurt Geiger clothing revenue up 21% Footwear volumes 5,8% lower Gross profit margin decrease from 62,0% to 59,1% Exchange rate pressure absorbed on core ranges Increased stock provisioning in line with lower volumes Trading space increased: 6 new Spitz stores and 3 new Kurt Geiger stores Improved Kurt Geiger trading densities
45 Sales volume and selling prices % Δ F14 vs F13 Comments Spitz & KG Footwear 4,4 revenue growth Volume growth (5,8) Lower demand in constrained consumer environment Ave. selling price 10,8 Price increases, including core Carvela range increase in March 2014 KG Clothing revenue growth 21,1 New stores and improved trading density


46 Margin % R million Spitz and Kurt Geiger Operating profit F06 F07 F08 F09 F10 F11 F12 F13 F % 80.0% 70.0% 60.0% 50.0% 40.0% 30.0% 20.0% 10.0% 0.0% Gross profit and operating profit margins F06 F07 F08 F09 F10 F11 F12 F13 F14 Operating profit % Gross profit %

 20,000 15,000 10,000 5,000 0 50,000 40,000 Trading")
 Average")
47 R/m2 m2 R/m2 m2 Spitz and Kurt Geiger 70,000 Spitz and Kurt Geiger 60,000 Trading density - Spitz stores 50,000 40,000 30,000 20,000 10,000 0 F06 F07 F08 F09 F10 F11 F12 F13 F14 Trading density (R/m2) Average trading space (m2) 20,000 15,000 10,000 5, ,000 40,000 Trading density - Kurt Geiger stores 5,000 4,000 30,000 3,000 20,000 10,000 0 F09 F10 F11 F12 F13 F14 2,000 1,000 0 Trading density (R/m2) Average trading space (m2)

48 Prospects for F15 Constrained consumer spending and increased competition Focus on core brand ranging Carvela, Kurt Geiger and Lacoste Rejuvenate supporting premium footwear brands Retail execution Review store tiering and ranging New Spitz store designs Stabilise gross profit margin Continued space growth if right locations are available


49 Performance and prospects

50 Income statement Retail revenue growth with higher prices and volume growth Wholesale performance impacted by lower demand and nonrecurring tender business improvement in H2 First new design store opened in June 2014 Gross profit margin decrease from 51,9% to 49,2% Exchange rate pressure partly absorbed Investment in manufacturing and overheads to support long term growth ambitions

51 Prospects for F15 Traction with brand growth opportunities Revised product selection and ranging New retail store design roll-out Open 5 new stores Refurbish 10 stores Wholesale focus footprint, service levels Supply chain focus procurement, manufacturing, distribution

52 AVI INTERNATIONAL


53 AVI INTERNATIONAL Operating profit history Healthy volume growth offset by brand building investment in new markets Strong performance from biscuits Changed Mozambique agent from February 2014 Higher cost of business in Namibia model under review Leverage RSA manufacturing base
 Grocery and Personal Care brands Operating Margin 16,0 15,7")
54 AVI INTERNATIONAL Entyce, Snackworks and Indigo Sales outside of RSA F14 Rm F13 Rm % International Revenue 769,0 639,4 20,3 % of Grocery and Personal Care brands 11,3 10,5 International Operating Profit 131,9 128,9 2,3 % of Grocery and Personal Care brands 12,1 13,5 International Operating Margin 17,2 20,2 (14,9) Grocery and Personal Care brands Operating Margin 16,0 15,7 1,9


55 AVI GROUP Prospects for F15 Improved I&J performance Higher exchange rates secured for 65% of exposure Additional wet vessel till end May 2015 Better catch rates if sustained from H2 F14 Ongoing gains in fishing and processing efficiency Sustain Entyce, Snackworks and Indigo growth in challenging environment Selling price increases Qtr 4 F14 to manage margin pressures Constrained consumer demand to persist Brand development activity Continue to leverage factory investments Procurement savings in F15


56 AVI GROUP Prospects for F15 continued Footwear & apparel Retail execution Green Cross re-design and ranging Spitz store re-design, tiering and ranging Kurt Geiger trading density progess Optimise price vs volume in constrained environment Green Cross wholesale business re-launch Net trading space growth Spitz 3 doors Kurt Geiger 3 doors Green Cross 5 doors

57 AVI GROUP Objectives Manage our unique brand portfolio to its long term potential Organic earnings growth; target >10% HEPS growth p.a. High dividend yield maintain normal dividend payout ratio of 80% Sustain high return on capital employed Effective capital projects Return excess cash to shareholders efficiently Replicate our category market leadership in selected regional markets Acquisition of high quality brand opportunities if available
58 Questions
59 Information slides
60 INFORMATION SLIDE Business unit financial results continuing operations Segmental Revenue Segmental Operating Profit Operating Margin F14 Rm F13 Rm Δ % F14 Rm F13 Rm Δ % F14 % F13 % Food & Beverage Brands 7 598, ,4 13, ,5 951,5 22,1 15,3 14,2 Entyce 2 717, ,9 12,5 442,4 397,8 11,2 16,3 16,5 Snackworks 3 057, ,6 14,0 474,5 387,9 22,3 15,5 14,5 I&J 1 823, ,9 14,5 244,6 165,8 47,5 13,4 10,4 Fashion Brands 2 659, ,2 5,6 560,1 576,9 (2,9) 21,1 22,9 Personal Care 1 043,8 982,1 6,3 172,0 167,1 2,9 16,5 17,0 Footwear & Apparel 1 615, ,1 5,2 388,1 409,8 (5,3) 24,0 26,7 Corporate 9,7 11,7 (9,1) (2,2) Group , ,3 11, , ,2 12,2 16,7 16,6
61 INFORMATION SLIDE Footwear & apparel financial results continuing operations Segmental Revenue Segmental Operating Profit Operating Margin F14 Rm F13 Rm Δ % F14 Rm F13 Rm Δ % F14 % F13 % Footwear & Apparel 1 615, ,1 5,2 388,1 409,8 (5,3) 24,0 26,7 Spitz 1 246, ,4 6,5 322,6 326,4 (1,2) 25,9 27,9 Green Cross 326,5 327,5 (0,3) 58,8 80,0 (26,5) 18,0 24,4 Other 42,6 38,2 11,5 6,7 3,4 97,1 15,7 8,9
62 INFORMATION SLIDE Revenue 11,4% up continuing operations Entyce: price increases in tea and coffee, volume growth in tea, coffee and creamer Snackworks: higher volumes and selling prices I&J: weaker Rand, higher prices as well as increased export and domestic volumes Personal Care: aerosol volume growth, price increases offset by impact of Coty revision Spitz: higher selling prices and clothing volume growth offset by lower footwear volumes Green Cross: lower wholesale and tender volumes offset by retail growth
63 INFORMATION SLIDE Gross profit 7,8% up continuing operations Entyce: revenue growth offset by higher raw material costs, mostly weaker Rand Snackworks: higher revenue offset by higher raw material costs and change in sales mix I&J: weaker Rand and higher volumes offset by increased operating costs Personal Care: gross margin impacted by revision to Coty arrangement (+R14m on comparable basis) Spitz: price increases offset by weaker Rand and lower footwear volumes Green Cross: lower wholesale and tender volumes as well as weaker Rand

64 INFORMATION SLIDE Gross profit margin history continuing operations Gross profit margin in grocery brands remains healthy Input cost pressure from weaker Rand, partly offset by I&J benefit Change in Coty relationship negatively impacted Group s profit margin by 0,5% but positive at operating profit level Spitz footwear impacted by weaker Rand with increased costs absorbed to support volume
65 INFORMATION SLIDE Impact of revision to Coty license agreement F14 Rm Revenue as reported ,4 Less: Sale of opening stock on hand to Coty (36,1) Revenue restated to exclude once-off transaction ,3 Add: Sales for November June now on agency basis 214,8 Less: Commission, service fees and product sales to Coty included in revenue (137,2) Revenue on old basis 16, ,9 Operating profit as reported 1 712,5 Less: Profit on sale of opening stock on hand to Coty (1,6) Operating profit on old basis 1 710,9

66 INFORMATION SLIDE Marketing expenditure *Excludes Coty Includes advertising and promotions, co-operative expenditure with customers and marketing department costs Total expenditure for F14 was R579m compared to R559m in F13

67 INFORMATION SLIDE Returns to shareholders Annual dividend cover ratio of 1,25
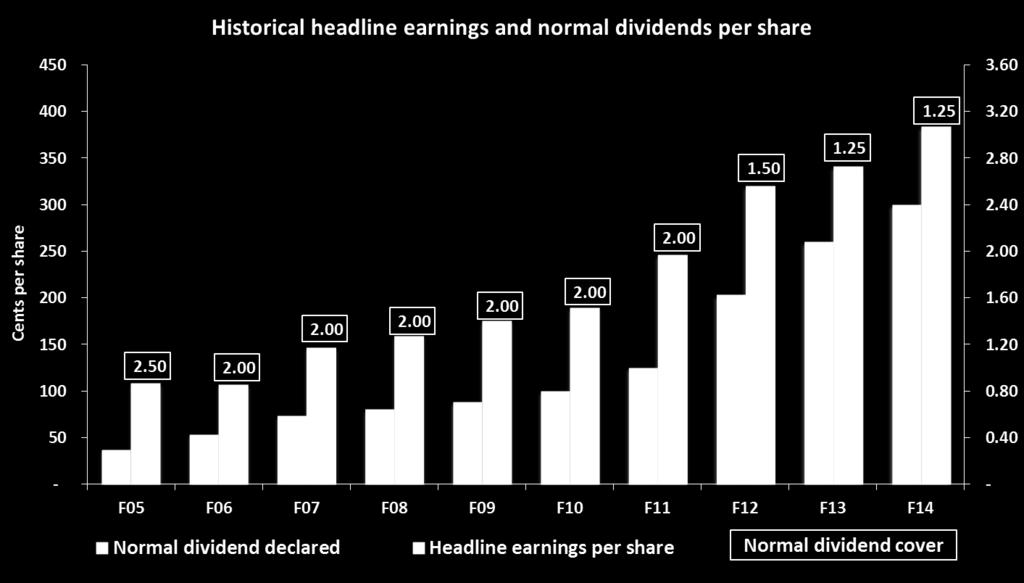
68 INFORMATION SLIDE Normal dividend history
69 INFORMATION SLIDE I&J Quota seafood products Hake Quota (tons) CY09 CY10 CY11 CY12 CY13 CY14 South African Total Allowable Catch (TAC) % change in TAC (9,1) 1,1 10,0 9,8 7,8 (0,5) I&J % 28,0 28,0 28,0 28,0 28,0 28,0
70 INFORMATION SLIDE Trading space and trading density Spitz F14 F13 Number of stores Turnover (Rm) Average m 2 17,264 16,357 Trading Density (R /m 2 ) 63,300 63,820 Closing m 2 17,813 16,586 Like-for-like metrics* F14 F13 Number of stores Turnover (Rm) 1,001 1,001 Average & closing m 2 15,554 15,554 Trading Density (R/m 2 ) 64,380 64,378 * Based on stores trading for the entire current and prior periods.
71 INFORMATION SLIDE Trading space and trading density Kurt Geiger F14 F13 Number of stores Turnover (Rm) Average m 2 3,825 3,845 Trading Density (R /m 2 ) 40,175 32,897 Closing m 2 3,880 3,751 Like-for-like metrics* F14 F13 Number of stores Turnover (Rm) Average & closing m 2 2,947 3,027 Trading Density (R/m 2 ) 43,391 36,902 * Based on stores trading for the entire current and prior periods.
72 INFORMATION SLIDE Trading space and trading density Green Cross F14 F13 Number of stores Turnover (Rm) Average m 2 3,237 3,225 Trading Density (R /m 2 ) 58,273 55,795 Closing m 2 3,360 3,225 Like-for-like metrics* F14 F13 Number of stores Turnover (Rm) Average & closing m 2 3,225 3,225 Trading Density (R/m 2 ) 58,343 55,795 * Based on stores trading for the entire current and prior periods.
73 INFORMATION SLIDE Closing number of stores and trading space at the end of each period Period End Spitz Kurt Geiger Green Cross # of stores Closing m² # of stores Closing m² # of stores Closing m² December , June , December , June , December , June , December , June , December , June , December , ,047 June , ,910 December , , ,304 June , , ,382 December , , ,382 June , , ,382 December , , ,382 June , , ,517
74
AVI Limited presentation to shareholders & analysts for the six months ended 31 December 2017
 AVI Limited presentation to shareholders & analysts for the six months ended 31 December 2017 AGENDA Key features and results history Group financial results Performance and prospects Questions and answers
AVI Limited presentation to shareholders & analysts for the year ended June 2018
 AVI Limited presentation to shareholders & analysts for the year ended June 2018 AGENDA Key features and results history Group financial results Business unit performance Prospects Questions and answers
AVI LIMITED presentation to analysts. for the YEAR ENDED 30 June 2008 AGENDA. Key features. Group financial results. Operating environment.
 AVI LIMITED presentation to analysts for the YEAR ENDED 30 June 2008 AGENDA Key features Group financial results Operating environment Prospects Q&A KEY FEATURES Revenue from continuing operations up 14%
CONTENTS ABOUT THIS REPORT BOARD RESPONSIBILITY
 CONTENTS 1 OVERVIEW 1 Our business 1 Operating structure 2 Our business highlights 4 AVI objectives and strategies 6 BUSINESS REVIEW 6 Chairman and CEO s review 10 Operational reviews 10 ENTYCE BEVERAGES
AVI LIMITED. ISIN: ZAE Share code: AVI Registration number: 1944/017201/06 ( AVI or the Group or the Company )
") SENS DOCUMENT FOR THE YEAR ENDED 30 JUNE 2014 AVI LIMITED ISIN: ZAE000049433 Share code: AVI Registration number: 1944/017201/06 ( AVI or the Group or the Company ) For more information, please visit our
SENS DOCUMENT FOR THE YEAR ENDED 30 JUNE 2014 AVI LIMITED ISIN: ZAE000049433 Share code: AVI Registration number: 1944/017201/06 ( AVI or the Group or the Company ) For more information, please visit our
SENS DOCUMENT. for the year ended 30 June 2013
 SENS DOCUMENT for the year ended AVI LIMITED ISIN: ZAE000049433 Share code: AVI Registration number: 1944/017201/06 ( AVI or the Group or the Company ) For more information, please visit our website: www.avi.co.za
sens document for the year ended 30 June 2011
 sens document for the 2011 AVI Limited ISIN: ZAE000049433 Share code: AVI Registration number: 1944/017201/06 ( AVI or the Group or the Company ) For more information, please visit our website: www.avi.co.za
INTERIM RESULTS for the six months ended 31 December 2009
 INTERIM RESULTS for the six months ended 31 December AVI Limited: ISIN: ZAE000049433 Share code: AVI Registration number: 1944/017201/06 ( AVI or the Group or the Company ) For more information, please
GROWING GREAT BRANDS SENS DOCUMENT FOR THE YEAR ENDED 30 JUNE 2017
 GROWING GREAT BRANDS SENS DOCUMENT FOR THE YEAR ENDED 30 JUNE 2017 AVI LIMITED ISIN: ZAE000049433 Share code: AVI Registration number: 1944/017201/06 ( AVI or the Group or the Company ) For more information,
GROWING GREAT BRANDS SENS DOCUMENT UNAUDITED INTERIM RESULTS FOR THE SIX MONTHS ENDED 31 DECEMBER 2017
 GROWING GREAT BRANDS SENS DOCUMENT UNAUDITED INTERIM RESULTS FOR THE SIX MONTHS ENDED 31 DECEMBER AVI LIMITED ISIN: ZAE000049433 Share code: AVI Registration number: 1944/017201/06 ( AVI or the Group or
AVI Limited ISIN: ZAE Share code: AVI Registration number: 1944/017201/06 ( AVI or the Group or the Company )
") AVI Limited ISIN: ZAE000049433 Share code: AVI Registration number: 1944/017201/06 ( AVI or the Group or the Company ) For more information, please visit our website: www.avi.co.za/investor/results and
AVI Limited ISIN: ZAE000049433 Share code: AVI Registration number: 1944/017201/06 ( AVI or the Group or the Company ) For more information, please visit our website: www.avi.co.za/investor/results and
GROWING GREAT BRANDS
 RESULTS FOR THE SIX MONTHS ENDED 31 DECEMBER GROWING GREAT BRANDS AVI LIMITED ISIN: ZAE000049433 JSE and A2X share code: AVI Registration number: 1944/017201/06 ( AVI or the Group or the Company ) For
Unaudited Interim results FOR THE SIX MONTHS ENDED 30 JUNE 2018
 Unaudited Interim results FOR THE SIX MONTHS ENDED 30 JUNE 2018 CORPORATE INFORMATION Sea Harvest Group Limited (Incorporated in the Republic of South Africa) Registration number: 2008/001066/06 JSE Code:
Half year result. 26 August 2016
 2016 Half year result 26 August 2016 Alison Watkins Group Managing Director Martyn Roberts Group Chief Financial Officer Barry O Connell MD Australian Beverages Agenda Group Result Summary Shareholder
2015 ANNUAL RESULTS PRESENTATION
 2015 ANNUAL RESULTS PRESENTATION Francois Kuttel & Imraan Soomra AGENDA Group Overview Financial Review Operational Review & Outlook Guidance GROUP OVERVIEW South Africa s most empowered listed company
TRELLIDOR HOLDINGS LIMITED AUDITED RESULTS FOR THE YEAR ENDED 30 JUNE 2016
 TRELLIDOR HOLDINGS LIMITED AUDITED RESULTS FOR THE YEAR ENDED 30 JUNE 2016 OVERVIEW Trellidor is the market leading manufacturer of custom made barrier security products Distribution through dedicated
ANALYST PRESENTATION FOR THE YEAR ENDED 31 MARCH 2012
 ANALYST PRESENTATION FOR THE YEAR ENDED 31 MARCH 2012 1 TFG ANALYST PRESENTATION MARCH 2012 AGENDA Overview of the economy and retail environment Review of the year Financial review Divisional review Financial
ANALYST PRESENTATION FOR THE HALF-YEAR ENDED 30 SEPTEMBER 2010
 ANALYST PRESENTATION FOR THE HALF-YEAR ENDED 30 SEPTEMBER 2010 1 Agenda The economy and retail environment Review of the period Financial review Divisional review Financial services Outlook Questions Doug
INTERIM RESULTS PRESENTATION
 INTERIM RESULTS PRESENTATION for the six months ended 31 March 2016 Agenda Strategic Update Financial Performance Divisional Performance Outlook and Imperatives 1 Strategic Update Phil Roux CEO 2 Environmental
ANNUAL RESULTS PRESENTATION
 ANNUAL RESULTS PRESENTATION FOR THE YEAR ENDED 30 SEPTEMBER 2016 CONTENTS 2 Annual Results Presentation 8 Financial Performance 19 Divisional Performance 19 Essential Foods 26 Groceries 35 International
Unaudited Interim results
 Unaudited Interim results for the six months ended 30 June 2017 CORPORATE INFORMATION Sea Harvest Group Limited (Formerly Sea Harvest Holdings Proprietary Limited) (Incorporated in the Republic of South
Fraser & Neave Holdings Bhd. Analysts Briefing 9 Nov 2012
 Fraser & Neave Holdings Bhd Analysts Briefing 9 Nov 212 Financial highlights Group revenue & PBIT down 17% & % respectively due to : Coca-Cola business cessation Thai floods Timing of property launch Higher
ANNUAL RESULTS PRESENTATION. for the year ended 30 September 2016
 ANNUAL RESULTS PRESENTATION for the year ended 30 September 2016 What a year!! Salient Features: Massive discontinuities Drought Rand volatility Wheat duty So Portfolio and brand strength matters (size
Financial results presentation For the period ended 30 June External structural and cyclical impacts on results
 212 Financial results presentation For the period ended 3 June 212 External structural and cyclical impacts on results Macro factor Developing versus developed world Consequence SA and Africa relatively
Sasol Limited financial results for the six months ended 31 December 2014 JSE: SOL NYSE: SSL
 Sasol Limited financial results for the six months ended 31 December 2014 JSE: SOL NYSE: SSL Forward-looking statements Forward-looking statements: Sasol may, in this document, make certain statements
Period overview Operational Overview Financial Results Conclusion
 Interim Results Six months ended 31 ust 2015 Bridging y expectations Agenda Period overview Operational Overview Financial Results Conclusion Bridging y expectations 2 1 Six month overview Satisfactory
Group finance director s report
 Group finance director s report Revenue increased by 9,2% on subscriber growth of 28% to 116 million users... Had there been no change in currency rates during the year, revenue growth would have been
Group Results Presentation for the six months ended 31 March 2016
 Group Results Presentation for the six months ended 31 March 2016 Index Overview Financial performance Operational performance Outlook 2 Overview Noel Doyle Chief Operating Officer Disclaimer Forward-looking
RESULTS PRESENTATION
 THE FOSCHINI GROUP LIMITED RESULTS PRESENTATION FOR THE 6 MONTHS ENDED 30 SEPTEMBER RESULTS PRESENTATION FOR THE HALFYEAR ENDED 30 SEPTEMBER AGENDA Economy and retail environment Doug Murray Business
ANNUAL RESULTS PRESENTATION. for the year-ended 30 September 2015
 ANNUAL RESULTS PRESENTATION for the year-ended 30 September 2015 Agenda Pioneer Foods Introduction Phil Roux Financial review Cindy Hess Divisional reviews o Essential Foods Carstens o Groceries Lombard
For personal use only Y E A R R E S U L T S FY17
 H A L F Y E A R R E S U L T S FY17 I M P O R T A N T N O T I C E & D I S C L A I M E R This presentation has been prepared by Specialty Fashion Group Limited (the Company ). It contains general background
12 month overview. Operational Overview. Financial Results. Conclusion
 Annual Results 12 months ended 29 ruary 2016 Agenda 12 month overview Operational Overview Financial Results Conclusion 2 1 12 month overview Reasonable financial performance in current market All Business
AUDITED summarised CONSOLIDATED annual FINANCIAL RESULTS
 AUDITED summarised CONSOLIDATED annual FINANCIAL RESULTS FOR THE YEAR ENDED 31 DECEMBER 2017 CORPORATE INFORMATION Sea Harvest Group Limited (Formerly Sea Harvest Holdings Proprietary Limited) (Incorporated
Interim Results 6 months ended 30 September 2008
 Interim Results 6 months ended 30 September 2008 2008 highlights Revenue + 15.9% Operating profit - 44.6% 3326,7 2871,4 315,7 2177,8 256,9 1915,2 214,2 174,8 2005 2006 2007 2008 2005 2006 2007 2008 Headline
TRELLIDOR HOLDINGS LIMITED UNAUDITED INTERIM RESULTS FOR THE SIX MONTHS ENDED 31 DECEMBER 2017
 TRELLIDOR HOLDINGS LIMITED UNAUDITED INTERIM RESULTS FOR THE SIX MONTHS ENDED 31 DECEMBER 2017 GROUP HIGHLIGHTS 5% Revenue 5% PAT 5% HEPS 35.2c 5% Interim dividend declared 11.0 cents per share Slide 2
1H FY19 RESULTS PRESENTATION 25 February 2019
 RELIANCE WORLDWIDE CORPORATION LIMITED ACN 610855877 1H FY19 RESULTS PRESENTATION 25 February 2019 INVESTOR PRESENTATION 1H FY19 RESULTS PAGE 0 Important Notice This presentation contains general information
September Quarter 2015 Results Presentation October 14, 2015
 September Quarter 2015 Results Presentation October 14, 2015 1 Safe Harbor Statement This Release / Communication, except for the historical information, may contain statements, including the words or
Analyst Presentation for the half-year ended 31 August 2012
 Analyst Presentation for the half-year ended 31 August 2012 Agenda 1. General commentary on the period Kevin Hodgson 2. Financial review Cobus Loubser 3. Questions Page 2 General Commentary Page 3 Review
Edgars 3.3% CNA 9.9% Discount Division 11.8%
 Results for the year ended dd 28 March 2009 Q4 FY 2009 Excluding consolidation of OtC 2 Highlights for 4 th Quarter FY 2009 Retail sales up 7.3% to R4.6bn Divisional retail sales growth: Total Edgars 3.3%
SABMiller plc. F 12 first half results US call Six months ended September 30, November 17, 2011
 SABMiller plc F 12 first half results US call Six months ended September 30, 2011 November 17, 2011 Jamie Wilson, Chief Financial Officer Gary Leibowitz, Senior Vice President, IR Forward looking statements
McBride plc Interim Results Presentation: 22 February 2018
 Success in securing significant business wins validates our strategic direction Agenda 1. Headlines 2. Commercial update 3. Financial results 4. Strategy actions 5. Outlook 1 Headlines Revenues 2.2% higher
INTERIM RESULTS FOR THE SIX MONTHS ENDED 28 FEBRUARY 2015
 INTERIM RESULTS FOR THE SIX MONTHS ENDED 28 FEBRUARY 2015 PRESENTATION OUTLINE Review of the period Financial results Trading performance Outlook Questions CLICKS GROUP INTERIM RESULTS 2015 2 REVIEW OF
Fiona is happy to do this slide
 Fiona is happy to do this slide DISCLAIMER This presentation contains not only a review of operations, but also some forward looking statements about Sanford Limited and the environment in which the company
For personal use only
 ASX Announcement Freedom Foods Group Limited (ASX: FNP) FY 2013 Financial Results Freedom Foods Group Limited (FNP) today released the Company s preliminary final results for the full year ended 30 th
ARYZTA AG. FY 2016 Results. 26 September 2016
 ARYZTA AG FY 2016 Results 26 September 2016 Forward Looking Statement This document contains forward looking statements which reflect management s current views and estimates. The forward looking statements
FY17 Results. 25 September 2017
 FY17 Results 25 September 2017 Forward Looking Statement This document contains forward looking statements, which reflect management s current views and estimates. The forward looking statements involve
Interim Results. Six months ended 31 August 2016
 Interim Results Six months ended 31 August 2016 Stefanutti Stocks City A multi-disciplinary construction group (Vision) (Mission) 2 www.stefanuttistocks.com y 2 Agenda Six month overview Operational Overview
2280 North Greenville Avenue, Richardson, TX 75082
 2280 North Greenville Avenue, Richardson, TX 75082 Contact: Investor Relations: Mike Kovar Chief Financial Officer Fossil, Inc. (972) 699-6811 Allison Malkin Integrated Corporate Relations (203) 682-8200
Full-year CY2017 Earnings Call
 Full-year CY2017 Earnings Call Lance Y. Gokongwei President and CEO Michael P. Liwanag Vice President AGENDA Full Year CY2017 Financial Performance and Business Updates Plans and Expectations for 2018
GROUP RESULTS PRESENTATION For the year ended 30 September 2017
 GROUP RESULTS PRESENTATION For the year ended 30 September 2017 Index Overview Financial & operational performance Strategy update 2 Disclaimer Forward-looking statement This document contains forward
MAINTAINING MOMENTUM SASOL LIMITED FINANCIAL RESULTS. for the six months ended 31 December 2015 JSE: SOL NYSE: SSL
 MAINTAINING MOMENTUM SASOL LIMITED FINANCIAL RESULTS for the six months ended 31 December 2015 JSE: SOL NYSE: SSL Forward-looking statements Forward-looking statements: Sasol may, in this document, make
SQ 14 Results Presentation October 27, 2014
 SQ 14 Results Presentation October 27, 2014 1 Safe Harbor Statement This Release / Communication, except for the historical information, may contain statements, including the words or phrases such as expects,
RESULTS For the year ended 30 September 2011
 RESULTS For the year ended 30 September 2011 AGENDA Highlights Patrick Coveney, CEO Financial Review Alan Williams, CFO Operating Review & Strategy Patrick Coveney, CEO Outlook Patrick Coveney, CEO Q &
ANNUAL RESULTS FOR THE YEAR ENDED 31 AUGUST 2017
 ANNUAL RESULTS FOR THE YEAR ENDED 31 AUGUST 2017 PRESENTATION OUTLINE Review of the year Financial results Trading performance Outlook Questions 2 REVIEW OF THE YEAR DAVID KNEALE REVIEW OF THE YEAR Strong
PRESENTATION OUTLINE. Review of the period Financial results Trading performance Outlook Questions
 PRESENTATION OUTLINE Review of the period Financial results Trading performance Outlook Questions 2 REVIEW OF THE PERIOD DAVID KNEALE REVIEW OF THE PERIOD Strong health & beauty sales performance Increased
Interim results FY2018 GROUP HIGHLIGHTS
 01 Interim results FY2018 GROUP HIGHLIGHTS Trading environment overview Sept 17 headline CPI 5.1% (avg March Sept 5.1%) Interest rates between 10.25% & 10.50% since Jan 16 Labour force up 696k (employed
KAP INDUSTRIAL HOLDINGS LIMITED UNAUDITED RESULTS FOR THE SIX MONTHS ENDED 31 DECEMBER 2018
 KAP INDUSTRIAL HOLDINGS LIMITED INTEGRATED INTO EVERY DAY INTRODUCTION JAAP DU TOIT CHAIRMAN AGENDA INTRODUCTION JAAP DU TOIT UNAUDITED INTERIM RESULTS FOR THE SIX STRATEGY MONTHS IMPLEMENTATION ENDED
March 2017 PROSPERITY IN THIS CLIENT NEWSLETTER. Economic and market outlook Local and global equities
 March 2017 PROSPERITY IN THIS CLIENT NEWSLETTER Economic and market outlook Local and global equities The unfortunate local events leading to the replacement of both the finance and deputy-finance minister
Unilever at Deutsche Bank Conference Paul Polman CEO Paris, June 11 th 2015
 Unilever at Deutsche Bank Conference Paul Polman CEO Paris, June 11 th 2015 SAFE HARBOUR STATEMENT This presentation may contain forward-looking statements, including forward-looking statements within
Nampak 2013 Interim Results
 Nampak 2013 Interim Results May 2013 1 Agenda Salient features Group results Operational review Strategic update Outlook 2 Salient Features Revenue up 7%, Africa up 19% Trading profit up 6% Profits from
Presentation to the Investment Analysts Society 4th & 5th March 2014
 Presentation to the Investment Analysts Society 4th & 5th March 2014 1 Presentation overview Overview and Highlights Financial Results Fred Robertson Lawrie Brozin Underlying Investment Performance Mustaq
McCormick & Company, Inc. Fourth quarter 2010 financial results and business outlook January 26, 2011
 McCormick & Company, Inc. Fourth quarter 2010 financial results and business outlook January 26, 2011 The following slides accompany a January 26, 2011 presentation to investment analysts. This information
SABMiller plc. Full year results Twelve months ended 31 March Graham Mackay, Chief Executive Jamie Wilson, Chief Financial Officer.
 SABMiller plc Full year results Twelve months ended 31 March 2012 Graham Mackay, Chief Executive Jamie Wilson, Chief Financial Officer 24 May 2012 Forward looking statements This presentation includes
THE FOSCHINI GROUP LIMITED RESULTS PRESENTATION
 THE FOSCHINI LIMITED RESULTS PRESENTATION FOR THE HALF-YEAR ENDED 30 SEPTEMBER 2017 RESULTS PRESENTATION FOR THE HALF-YEAR ENDED 30 SEPTEMBER 2017 AGENDA Doug Murray Chief Executive Officer Anthony Thunstrӧm
UNAUDITED INTERIM RESULTS FOR THE SIX MONTHS ENDED 30 JUNE 2015
 Profitability. Empowerment. Positive Social Impact. ISIN Number: ZAE000015277 Share Code: BRT ISIN Number: ZAE000015285 Share Code: BRN Company Registration Number: 1995/010442/06 (Incorporated in the
Mr Price Group Limited Interim Results September 2012
 Mr Price Group Limited Interim Results September 2012 Group Highlights RETAIL SALES AND OTHER INCOME R6.2bn 14.5% OPERATING PROFIT R825m 21.2% OPERATING MARGIN 13.7% 0.8% HEADLINE EARNINGS PER SHARE 253.2c
IAG announces FY18 results 15 August 2018
 Financial indicators FY17 FY18 Change GWP ($m) 11,439 11,647 1.8% Insurance profit ($m) 1,270 1,407 10.8% Underlying margin (%) 12.4 14.1 170bps Reported margin (%) 15.5 18.3 280bps Shareholders funds
Results presentation. for the 26 weeks ended 26 August 2018
 Results presentation for the 26 weeks ended 26 August 2018 Agenda Chairman s introduction Gareth Ackerman Chairman Results overview Bakar Jakoet Chief Finance Officer Progress on our plan Richard Brasher
UNAUDITED INTERIM GROUP RESULTS FOR THE 26 WEEKS ENDED 29 SEPTEMBER 2018, CASH DIVIDEND DECLARATION
 MR PRICE GROUP LIMITED Registration number 1933/004418/06 Incorporated in the Republic of South Africa ISIN: ZAE 000200457 JSE share code: MRP ( Mr Price or the Company or the Group ) UNAUDITED INTERIM
MQ 2015 & FY Results Presentation May 8, 2015
 MQ 2015 & FY 2014-15 Results Presentation May 8, 2015 1 Safe Harbor Statement This Release / Communication, except for the historical information, may contain statements, including the words or phrases
Financial results & business update. Quarter and year ended 31 December February 2016
 Financial results & business update Quarter and year ended 31 December 2015 11 February 2016 Disclaimer 3 Any remarks that we may make about future expectations, plans and prospects for the company constitute
26 November Company Announcements Office Australian Securities Exchange Limited Exchange Centre 20 Bridge Street Sydney NSW 2000
 26 November 2013 Company Announcements Office Australian Securities Exchange Limited Exchange Centre 20 Bridge Street Sydney NSW 2000 Aristocrat Leisure Limited 2013 Aristocrat Leisure Limited will make
INTERIM REPORT. NESTLÉ (MALAYSIA) BERHAD ( W) (Incorporated in Malaysia)
 BERHAD ( W) (Incorporated in Malaysia)") INTERIM REPORT NESTLÉ (MALAYSIA) BERHAD (110925-W) (Incorporated in Malaysia) The Directors are pleased to present the Interim Report for the period ended 30 June 2018 as follows: CONDENSED CONSOLIDATED
INTERIM REPORT NESTLÉ (MALAYSIA) BERHAD (110925-W) (Incorporated in Malaysia) The Directors are pleased to present the Interim Report for the period ended 30 June 2018 as follows: CONDENSED CONSOLIDATED
The Second Cup Ltd. Management s Discussion and Analysis
 The following ( MD&A ) has been prepared as of October 31, and is intended to assist in understanding the financial performance and financial condition of The Second Cup Ltd. ( Second Cup or the Company
PRESENTATION TO INVESTORS FOR THE YEAR ENDED 30 SEPTEMBER 2015
 PRESENTATION TO INVESTORS FOR THE YEAR ENDED 30 SEPTEMBER 2015 AGENDA GROUP OVERVIEW Alan Dickson, CEO FINANCIAL OVERVIEW Nick Thomson, CFO SEGMENTAL DISCUSSIONS ICT Mark Taylor Applied electronics Peter
DQ 14 Results Presentation January 19, 2015
 DQ 14 Results Presentation January 19, 2015 1 Safe Harbor Statement This Release / Communication, except for the historical information, may contain statements, including the words or phrases such as expects,
SABMiller plc. Interim results Half year ended 30 September November 2005 also available on website
 SABMiller plc Interim results Half year ended 30 September 2005 10 November 2005 also available on website www.sabmiller.com Forward-looking statements This presentation includes forward-looking statements.
Britvic plc. Preliminary Results 2011
 Britvic plc Preliminary Results 2011 Gerald Corbett Chairman John Gibney Group Finance Director Agenda Financial performance John Gibney Britvic and the market review Paul Moody Group performance +14.6%
SABMiller plc. Full year results Twelve months ended 31 March Jamie Wilson, Chief Financial Officer Gary Leibowitz, SVP, Investor Relations
 SABMiller plc Full year results Twelve months ended 31 March 2012 Jamie Wilson, Chief Financial Officer Gary Leibowitz, SVP, Investor Relations 24 May 2012 Forward looking statements This presentation
ANNUAL RESULTS PRESENTATION FOR THE YEAR ENDED 30 SEPTEMBER 2018
 ANNUAL RESULTS PRESENTATION FOR THE YEAR ENDED 30 SEPTEMBER 2018 AGENDA Year under review Financial performance Group performance Divisional performance Essential Foods Groceries International Sustainability
2017 Interim Results Presentation
 2017 Interim Results Presentation 28 th July 2017 www.morganadvancedmaterials.com Agenda Introduction and key highlights Pete Raby 2017 interim results Peter Turner Operational and strategic update Pete
Tiger Brands Limited. Group Results Presentation. for the year ended 30 September 2015
 Tiger Brands Limited Group Results Presentation for the year ended 30 September 2015 2 Index Strategic review 3 Strategic review Peter Matlare Chief Executive Officer 4 Key strategic deliverables 1 Improve
UNAUDITED INTERIM RESULTS FOR THE SIX MONTHS ENDED 31 DECEMBER 2013
 UNAUDITED INTERIM RESULTS FOR THE SIX MONTHS ENDED 31 DECEMBER 2013 AGENDA AGENDA GROUP OVERVIEW FINANCIAL REVIEW DIVISIONAL REVIEW OUTLOOK QUESTIONS 2 3 GROUP OVERVIEW GROUP STRUCTURE INDUSTRIAL EQUIPMENT
9M CY2018 Unaudited Results Investor Briefing October 25, 2018
 9M CY2018 Unaudited Results Investor Briefing October 25, 2018 Irwin C. Lee President and CEO Mike P. Liwanag Senior Vice President AGENDA 1 9M CY2018 Unaudited Financial Results 2 Expectations & Updates
2018 First Quarter Report
 2018 First Quarter Report Table of Contents Page # Letter to shareholders 2 Management discussion and analysis Non-IFRS Measures 5 Clearwater overview 7 Explanation of annualized financial results 10 Explanation
INTERIM RESULTS FOR THE SIX MONTH PERIOD ENDED 31 DECEMBER DECEMBER 2018
 INTERIM RESULTS RESULTS INTERIM FOR THE RESULTS YEAR ENDED FOR THE 30 PERIOD JUN 2017 ENDED FOR THE SIX MONTH PERIOD ENDED 31 DECEMBER 2017 31 DECEMBER 2018 GOVERNANCE UPDATE GOVERNANCE UPDATE Executive
Investor Roadshow Presentation 2016 Financial Results
 By considering it all, PSG sees the bigger picture, which gives you the advantage Investor Roadshow Presentation 2016 Financial Results For the year ended 29 February 2016 14 April 2016 Contents 1. Group
MR PRICE GROUP LTD Sector: Consumer Discretionary Max Sector Weight: 32%
 Company Results Analysis 24 November 2017 Recommendation: Underweight JSE Capped SWIX weighting: 0.80% Recommended Exposure: 0% JSE Code: MRP Current Share Price: ZAR 20700c MR PRICE GROUP LTD Sector:
Interim results 6 months ended 31 July September 2018
 Interim results 6 months ended 31 July 2018 25 September 2018 1 Forward-looking statements This presentation contains certain forward-looking statements with respect to the financial condition, results
THE FOSCHINI GROUP LIMITED RESULTS PRESENTATION
 THE FOSCHINI GROUP LIMITED RESULTS PRESENTATION RESULTS PRESENTATION AGENDA Economy and retail environment Doug Murray Business overview Doug Murray Review of the year Doug Murray Financial review Anthony
Overview. KAP International Holdings Ltd December 2006 Results Presentation Increase RM RM %
 Overview 2006 2005 Increase RM RM % Revenue 3,418 2,975 14.9% EBITDA 300 270 11.1% Operating profit 256 228 12.3% Net profit before tax 230 249 - excluding pension fund surplus 230 199 15.6% Headline earnings
Vitasoy International Holdings Limited
 FY 2011/2012 Interim Results Announcement 23 November, 2011 Disclaimer In addition to historical information, this presentation contains forward-looking statements with respect to the results of the operations
THE J. M. SMUCKER COMPANY
 Richard Smucker Chief Executive Officer THE J. M. SMUCKER TEAM RICHARD SMUCKER Chief Executive Officer MARK SMUCKER President, U.S. Retail Coffee PAUL SMUCKER WAGSTAFF President, U.S. Retail Consumer Foods
Group results and dividend declaration for the six months ended 31 March 2011
 Tiger Brands Limited Registration number 1944/017881/06 (Incorporated in the Republic of South Africa) Share code: TBS ISIN: ZAE000071080 Group results and dividend declaration for the six months ended
Fourth Quarter Earnings Conference Call. February 2, 2016
 Fourth Quarter 2015 Earnings Conference Call February 2, 2016 Safe Harbor Statement 2 Some of our comments constitute forward-looking statements that reflect management s current views and estimates of
Interim Results Presentation For six months to June Saving our customers money so they can live better
 Interim Results Presentation For six months to June 2017 Saving our customers money so they can live better Agenda 1 Financial review 2 Operational review 3 Strategy & prospects Financial Review Hans van
Kraft Foods. Deutsche Bank Global Consumer Conference. June 19, 2012
 Kraft Foods Deutsche Bank Global Consumer Conference June 19, 2012 Forward-looking statements This presentation contains a number of forward-looking statements. The words drive, build, focus, manage, aim,
Unilever. Q2 and First Half 2007 Results. Agenda business performance. Accelerating change. Patrick Cescau Group Chief Executive
 Unilever Q2 and First Half 2007 Results Patrick Cescau Group Chief Executive John Rothenberg SVP Investor Relations 2 nd August 2007 Agenda 2007 business performance First half and second quarter results
Unaudited group results for the six months ended 31 March 2018
 Unaudited group results for the six months ended 31 March 2018 Index Listeria update Results overview Financial & operational performance Outlook & conclusion 2 Disclaimer Forward-looking statement This
APPENDICES NOTICE OF ANNUAL GENERAL MEETING SUMMARY CONSOLIDATED FINANCIAL STATEMENTS OUR GOVERNANCE PROFILE PERFORMANCE REVIEW APPENDICES
 153 INVESTMENT CASE ABOUT THIS REPORT OUR OUR OPERATING ENVIRONMENT OUR STRATEGY AND PERFORMANCE APPENDIX 1: DEFINITIONS Concession arrangement COSO Current ratio Debt to equity ratio Dividend cover Doubtful