Fiona is happy to do this slide
|
|
|
- Jane Reed
- 5 years ago
- Views:
Transcription


1 Fiona is happy to do this slide
2 DISCLAIMER This presentation contains not only a review of operations, but also some forward looking statements about Sanford Limited and the environment in which the company operates. Because these statements are forward looking, Sanford Limited s actual results could differ materially. Media releases, management commentary and analysts presentations, including those relating to the previous results announcement, are all available on the company s website and contain additional information about matters which could cause Sanford Limited s performance to differ from any forward looking statements in this presentation. Please read this presentation in the wider context of material previously published by Sanford Limited. 2

3 2018 integrated report available at The report outlines Sanford's business excellence framework this enables each part of the business to map out their role in helping to deliver on our goals We strive to inform in a transparent and open approach and welcome feedback from our stakeholders throughout the year 3
4 SOLID BUSINESS PERFORMANCE DESPITE ADVERSE CLIMATIC CONDITIONS CATCH/HARVEST VOLUME 118k GWT REVENUE $515M ADJUSTED EBIT $64.7M EBIT GWT kg 54c* 5.6% 7.7% 1.5% +$0.02/kg RETURN ON AVERAGE TOTAL EQUITY 7.3 % Up from 6.6% NPAT $42.3M** 12.9% EPS 45c +5c ANNUAL DIVIDEND 23CPS Stable Wild Catch GWT 2% Aquaculture GWT 14% Revenue per PW kg 8% Deepwater Inshore Fishing partners 2% 9% 5% Salmon Mussels 4% 15% 9.2% fresh sales (from 8.3%) Hoki product cascade Salmon price achievement Ling swim bladders * Excluding third party partner catches, EBIT is $0.57/kg to $0.63/kg up 6 cents ** Including Havelock insurance settlement of $6.8m net of repair cost 4
5 NZD $ 000 STRONG CASH FLOW AND BALANCE SHEET GEARING 26.6% down from 32.3% NET DEBT $152.4M 16% TOTAL EQUITY $582M 1% EBITDA* $84.4M 2% DEBT / EBITDA 1.81x FY x Operating Cash Flow $72.6m $80,000 $60,000 $40,000 OPERATING CASH FLOW 44% $20,000 $- FY16 FY17 FY18 *EBITDA: Earnings before interest, taxation, non trading currency exchange gain/(loss), depreciation, amortisation, restructuring, adjusting items, impairment and gain (loss) on sale of investments, intangible and long term assets 5

6 FY18 HEADWINDS Marine heatwave impacted salmon growth and mortality rates- led to suspended sales for 10 weeks Algal bloom impacted mussels growth and yields in Marlborough Extended shut down of Havelock plant for earthquake repairs Lower Hoki catch volumes leading to voluntary Hoki shelving of West Coast ACE in 2018/19 season In shore fleet impacted by poor weather conditions and reduced fleet size, mitigated by engaging private fishing partners 6
 and cosmeceuticals")


7 CLIMATE CHANGE: MITIGATING THE RISK Mussels Sanford s no. 1 species Spat NZ Geographically diverse Development of nutraceuticals (powder & oil) and cosmeceuticals Salmon Creating value with the fish we have Branding Oxygenation systems Net cleaning tech. Antibiotics-free Stewart Is. location Fallowing plan, cage configuration and lower stock density Wild Catch Diversity of species Volume independent Hoki product cascade Consumer proximity Consumer education Product innovation (hoki skin collagen) Sanford Black for premium species (asset rejuvenation) Precision seafood harvesting Whole fish utilisation NZ s large EEZ 7


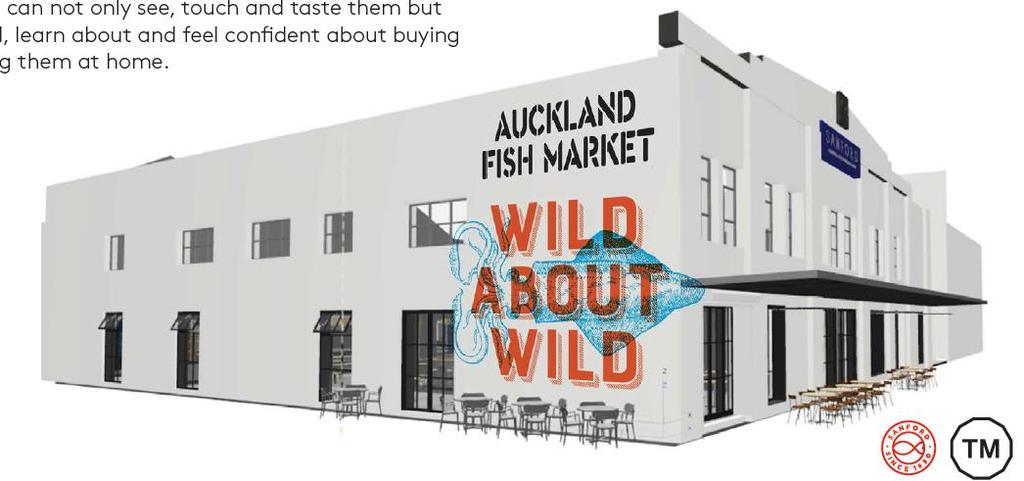
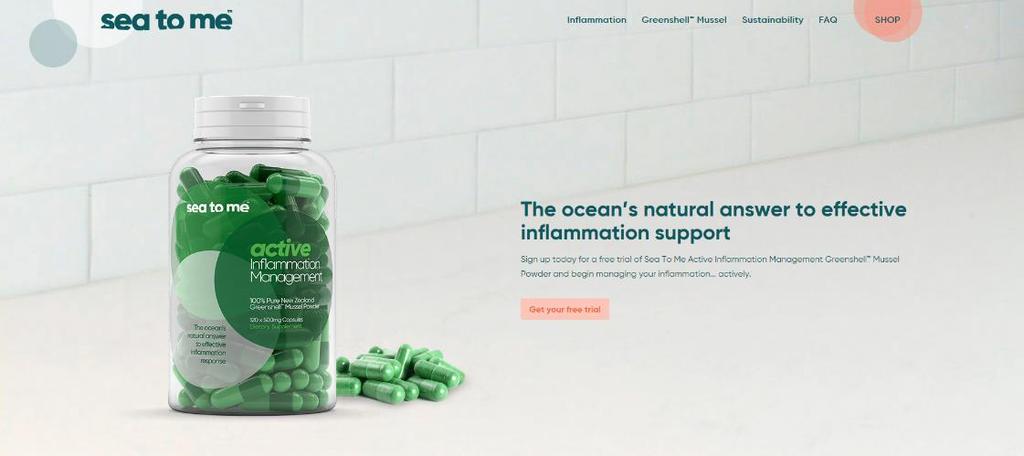
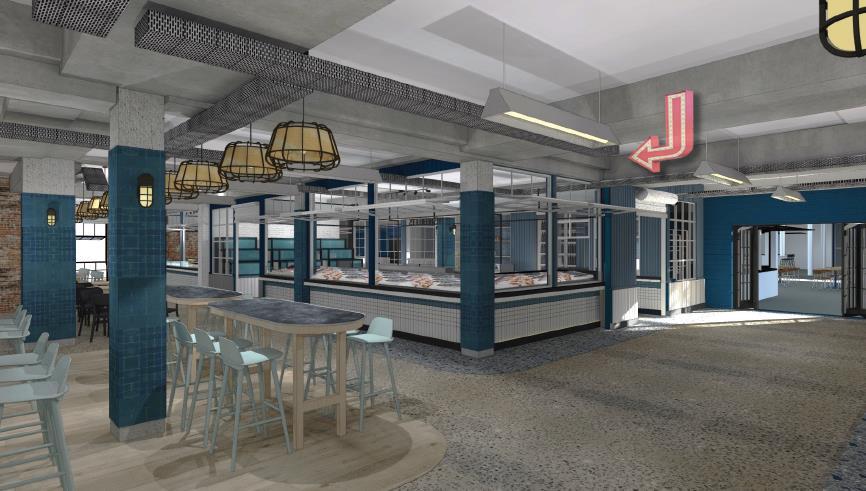
8 2018 STRATEGY IN ACTION PROGRESS AND DELIVERY ON KEY FOCUS AREAS INNOVATION Developed Sea to Me nutraceuticals range Marine collagen nano-fibre for skin care products Selective spat breeding at SPAT NZ Further rollout of PSH across our deep water fleet Created awareness on plastics pollution BRANDING Investment in brand development - Big Glory Bay, Sanford Blue and Sanford Black Auckland Fish Market Development in Wynyard Quarter Acquired Auckland based home-delivery E-platform Fresh Catch Focus on end customer, replacing third party distributors Focus on Fresh - 9.2% of Sales are now fresh, up from 8.3% 8


9 2018 STRATEGY IN ACTION PROGRESS AND DELIVERY ON KEY FOCUS AREAS OPERATIONAL EXCELLENCE Salmon - Infrastructure investment, volume growth Havelock facility upgraded for earthquake strengthening Hoki product cascade improvements moving from fillet block to individual fillet San Granit reaching expected levels of operational capability Vessel improvement programme underway ORGANISATIONAL CAPABIILTY Huge success with Keeping it Fresh, San Ignite, and San Activate development programmes. Highly commended Employer by Tertiary Education Commission Skills Highway for our Keeping it Fresh programme Structure supporting strategy -Cross functional teams to drive strategy execution Engagement score static 9
10 VALUE STRATEGY DRIVING ADJUSTED EBIT IMPROVEMENT Key Drivers of YOY ADJUSTED EBIT change $ m Climate -11m Value +6m Strategy in Action +6m 10
11 PORTFOLIO DIVERSITY IS BOTH OUR COMPETITIVE ADVANTAGE AND OUR CHALLENGE Sanford 54c / kg Aquaculture Wildcatch Inshore Offshore Salmon Nutraceuticals & Other marine extracts Pelagics Fresh Frozen at Sea Vessels Longline Scampi Commodity volume Mussels High Value volume Revenue Size of bubbles indicates relative size 11 FAS Fillet Vessels FAS Charter Vessels FAS H&G Vessel
12 VOLUME VS. VALUE: OPERATIONAL EFFICIENCY VS. INNOVATION & BRANDING Sanford 54c / kg STRATEGIC INTENT Aquaculture Wildcatch Branding BGB Volume Growth Growth through diversification Inshore Offshore Salmon Commodity volume High Value volume Revenue Nutraceuticals & Other marine extracts Mussels Size of bubbles indicates relative size Operational efficiency Pelagics Fresh Inshore landing 12 FAS Fillet Vessels Product cascade Frozen at Sea Vessels FAS Charter Vessels Operational efficiency FAS H&G Vessel Longline Branding Sanford Black Scampi


13 WE REFRESHED OUR STRATEGY VISON To be the Best Seafood Company in the world PURPOSE We share the natural goodness of our oceans with uncompromising care AMBITION $1 EBIT/KG 2023 Business Excellence Framework Strategic Thrusts FY19 Key Activities Execution Channel Development Brand Development Consumer Proximity - Auckland Fish Market, Fresh Catch Big Glory Bay roll-out, Sanford Black Cross Functional Business Teams Product & Technology Innovation Operational Excellence Organisational Capability Beyond Food - Nutraceuticals, Cosmeceuticals, Oils - Product cascade improvement Processing Plant Rejuvenation Scampi vessel replacement Mid-life rebuilds for several vessels Inshore Fleet Replacement Leadership training SALMON FRESH MUSSELS SanCore Social License Development Investment Plan Core System Replacement Business Intelligence Upgrade Community Investment Communication $100m investment over two years FROZEN INNOVATION 13


14
15 APPENDICES
16 GAAP TO NON-GAAP RECONCILIATION ($m) ($m) Reported net profit for the period (GAAP) Add back: Income tax expense Net interest Non-trading currency exchange losses Net (gain) loss on sale of investments,property,plant & equipment (0.5) 0.5 Reported EBIT Adjustments: Havelock earthquake insurance settlement (6.8) - Impairment of assets Provision for one off vessel disposal costs Restructuring costs Total one off items (2.9) 3.0 Adjusted EBIT D&A EBITDA Non-GAAP Profit measures Sanford's standard profit measure prepared under New Zealand GAAP is net profit. Sanford have used non-gaap measures when discussing financial performance in this document. The Directors and management believe that these measures provide useful information as they are used internally to evaluate divisional and total Group performance and to establish operating and capital budgets. Non-GAAP profit measures are not prepared in accordance with NZ IFRS (New Zealand International Reporting Standards) and are not uniformly defined, therefore the non- GAAP profit measures included in this report are not comparable with those used by other companies. They should not be viewed in isolation or as a substitute for GAAP profit measures as reported by Sanford in accordance with NZ IFRS. Definitions Reported EBIT: Earnings before interest, taxation, non trading currency exchange gain/(loss) and gain (loss) on sales of investments, intangible and long term assets Adjusted EBIT: Reported EBIT adjusted for impairments, restructuring and other one off items EBITDA: Earnings before interest, taxation, non trading currency exchange gain/(loss), depreciation, amortisation, restructuring, adjusting items, impairment and gain (loss) on sale of investments, intangible and long term assets


17 USD FX HEDGING PATTERN FOR YEAR 17
ANALYST RESULT BRIEFING FINANCIAL PERIOD 6 MONTHS ENDING 31 MARCH MAY 2018
 ANALYST RESULT BRIEFING FINANCIAL PERIOD 6 MONTHS ENDING 31 MARCH 2018 23 MAY 2018 DISCLAIMER This presentation contains not only a review of operations, but also some forward looking statements about
Eric Barratt Managing Director
 Eric Barratt Managing Director This presentation contains not only a review of operations, but also some forward looking statements about Sanford Limited and the environment in which the company operates.
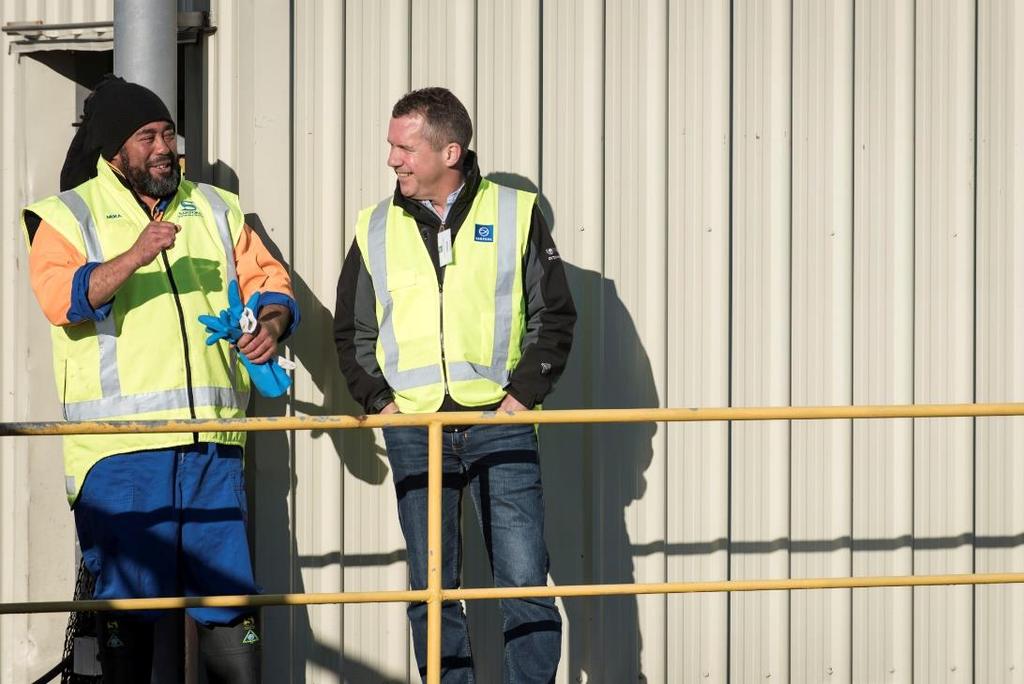
PEOPLE WITH PASSION SANFORD INTERIM REPORT 2015
 PEOPLE WITH PASSION SANFORD INTERIM REPORT 2015 1 1433 PEOPLE FROM AUCKLAND COROMANDEL TAURANGA NELSON HAVELOCK TIMARU WAITAKI KAITANGATA BLUFF STEWART ISLAND & MELBOURNE WITH PASSION FOR THE SEA. 2 Sanford
Interim Report 2012/2013. From sea to food over 100 years of sustained growth
 Interim Report 2012/2013 From sea to food over 100 years of sustained growth Interim Report to Shareholders For the six months ended 31 March 2013 The Directors are pleased to present the Interim Report
INTERIM REPORT 2017 MAKING WAVES
 INTERIM REPORT 2017 MAKING WAVES NOV 16 SAN GRANIT Sails into Timaru after 45 days sailing from Norway, now operational read more inside. BUILDING MOMENTUM Sanford is New Zealand s biggest fishing quota
Interim Report 2011/2012. From sea to food over 100 years of sustained growth
 Interim Report 2011/2012 From sea to food over 100 years of sustained growth Interim Report to Shareholders For the six months ended 31 March 2012 The Directors are pleased to present the Interim Report
INTERIM RE PORT 2018
 INTERIM REPORT 2018 ABOVE: Children perfecting their creations at the Auckland Seafood School BELOW: Paulie Hooton, Sanford s Head Chef and Mike Thomson, Sales Director at the Auckland Fish Market. PURPOSE
FINANCIAL & OPERATIONAL RESULTS
 FINANCIAL & OPERATIONAL RESULTS HALF YEAR ENDED 31 DECEMBER 2018 26 February 2019 DISCLAIMER This presentation contains forward-looking statements. Forward-looking statements often include words such as
INTERIM REPORT 2016 THINKING FRESH
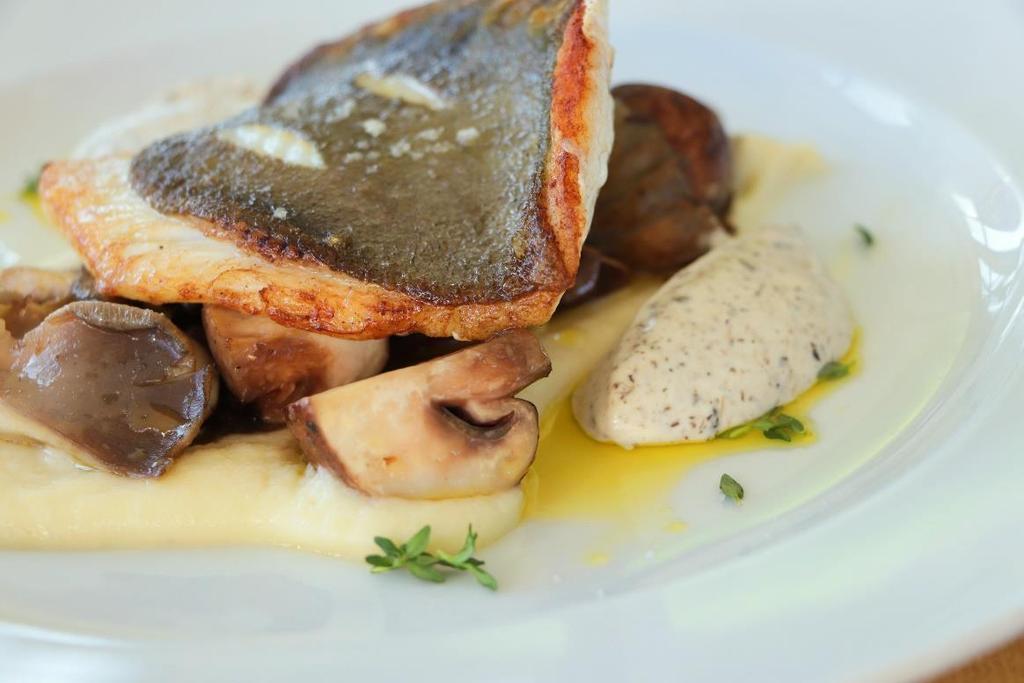
 INTERIM REPORT 2016 THINKING FRESH R Maple and ginger scented smoked snapper with prosciutto wrapped mussels and field mushrooms RECIPE: BACK COVER Food photography by Sean Shadbolt. FRESH THINKING As
RESTAURANT BRANDS DELIVERS RECORD PROFIT
 RESTAURANT BRANDS NEW ZEALAND LIMITED 17 April 2018 NZX/ASX RESTAURANT BRANDS DELIVERS RECORD PROFIT $NZm 2018 2017 Change ($) Change (%) Total Group Sales 740.8 497.2 +243.6 +49.0 Group NPAT (reported)
For personal use only. FY2017 H1 Results February 2017
 For personal use only FY2017 H1 Results February 2017 The half year in review Broader automotive market supported by record new vehicle sales in Australia and New Zealand Strong Automotive earnings growth
INTERIM PRESENTATION Second quarter, 2006
 INTERIM PRESENTATION Second quarter, 6 CEO Yngve Myhre CFO Bent M. Skisaker Agenda Operational Update Group Harvesting Processing Norway and Denmark Strategic considerations and Outlook Financials Income
Paul Maguire Philip Bennett Paul Witheridge Managing Director Chief Financial Officer Chief Financial Officer
 McPherson s Limited Results for the year to 30 June 2011 Paul Maguire Philip Bennett Paul Witheridge Managing Director Chief Financial Officer Chief Financial Officer McPherson s Limited McPherson s Limited
All figures in NOK 1,000 Q3 11 Q3 10 Sept. 30, 2011 Sept. 30,
 Austevoll Seafood ASA 0 INTERIM REPORT Q3 2011 Significant reduction in interest-bearing liabilities in the quarter Third quarter is low season for production of pelagic fish in Europe and South America
BRISCOE GROUP LIMITED. Results for announcement to the market
 Results for announcement to the market Reporting Period Half-Year 29 January 2018 to 29 July 2018 Previous Reporting Period Half-Year 30 January 2017 to 30 July 2017 Amount (000s) Percentage change Sales
SEALORD GROUP LIMITED. Submission in relation to. Ministerial Inquiry into Foreign Charter Vessels
 SEALORD GROUP LIMITED Submission in relation to Ministerial Inquiry into Foreign Charter Vessels 7 October 2011 2 1. INTRODUCTION 1.1 Sealord Group Limited ("Sealord") welcomes the opportunity to provide
New Zealand King Salmon s Prospective Financial Information, a reconciliation of non-gaap to GAAP information and supplementary financial information
 New Zealand King Salmon s Prospective Financial Information, a reconciliation of non-gaap to GAAP information and supplementary financial information 100203342/4966012.19 A. ABOUT THIS DOCUMENT The information
For personal use only
 A S X A N N O U N C E M E N T DATE: 24 August 2016 FY2016 RESULTS PRESENTATION Attached is the Presentation regarding Pact s Financial Results for the year ended 30 June 2016. The Presentation will occur
FINANCIAL & OPERATIONAL RESULTS
 FINANCIAL & OPERATIONAL RESULTS HALF YEAR ENDED 31 DECEMBER 2017 Insert new artwork 28 February 2018 DISCLAIMER This presentation contains forward-looking statements. Forward-looking statements often include
AUDITED summarised CONSOLIDATED annual FINANCIAL RESULTS
 AUDITED summarised CONSOLIDATED annual FINANCIAL RESULTS FOR THE YEAR ENDED 31 DECEMBER 2017 CORPORATE INFORMATION Sea Harvest Group Limited (Formerly Sea Harvest Holdings Proprietary Limited) (Incorporated
Full Year results and outlook
 PRESENTATION TO INVESTORS & ANALYSTS Full Year results and outlook David Banfield, Group CEO 29 August 2018 for 12 months 1 July 2017 30 June 2018 Strong international performance drives double digit earnings
A N N U A L S H A R E H O L D E R S M E E T I N G N O V E M B E R
 A N N U A L S H A R E H O L D E R S M E E T I N G N O V E M B E R 2 0 1 7 AGENDA Welcome Chairman s review Managing Director s review Ordinary business and resolutions 2 CHAIRMAN S REVIEW Successful IPO
FY17 RESULTS. Tuesday 20 February 2018
 FY17 RESULTS Tuesday 20 February 2018 Agenda 2017 Highlights Results 2018 Observations Out-of-Home industry APN Outdoor Contract renewals Focus and objectives Trading update 2 2017 Highlights 3 2017 highlights
Assessment Schedule 2016 Scholarship Accounting (93203)
") Assessment Schedule 2016 Scholarship Accounting (93203) Evidence Scholarship Accounting (93203) 2016 page 1 of 8 Question One Suggested solution What was the initial transaction when the invoice was created?
Assessment Schedule 2016 Scholarship Accounting (93203) Evidence Scholarship Accounting (93203) 2016 page 1 of 8 Question One Suggested solution What was the initial transaction when the invoice was created?
For personal use only
 Tegel Group Holdings Limited FY18 Interim Results Presentation 6 December 2017 1 TEGEL GROUP HOLDINGS FY18 INTERIM RESULTS PRESENTATION Disclaimer This presentation contains summary information about Tegel
Directors Report to Shareholders For the 28 Weeks ended 14 September 2015 (1H 2016)
") Directors Report to Shareholders For the 28 Weeks ended 14 September 2015 (1H 2016) Key Points Total Group Sales ($m) 210.0 185.7 +24.3 +13.1 Group Net Profit after Tax ($m) 13.4 11.5 +1.9 +16.7 Dividend
Directors Report to Shareholders For the 28 Weeks ended 14 September 2015 (1H 2016) Key Points Total Group Sales ($m) 210.0 185.7 +24.3 +13.1 Group Net Profit after Tax ($m) 13.4 11.5 +1.9 +16.7 Dividend
For personal use only
 11 May 2017 The Manager Company Announcements Office ASX Limited 20 Bridge Street SYDNEY NSW 2000 GRAINCORP LIMITED: GNC INVESTOR PRESENTATION FINANCIAL HALF YEAR ENDED 31 MARCH 2017 Please find attached
RESTAURANT BRANDS 2016 ANNUAL RESULT (52 weeks) $m
 $m") 14 April NZX RESTAURANT BRANDS ANNUAL RESULT (52 weeks) (53 weeks) Total Group Store Sales 387.6 359.5 +7.8 Group Net Profit after Tax 24.1 23.8 +1.0 Dividend (cps) 21.0 19.0 +10.5 Key points Group Net
14 April NZX RESTAURANT BRANDS ANNUAL RESULT (52 weeks) (53 weeks) Total Group Store Sales 387.6 359.5 +7.8 Group Net Profit after Tax 24.1 23.8 +1.0 Dividend (cps) 21.0 19.0 +10.5 Key points Group Net
AVI Limited presentation to shareholders & analysts for the six months ended 31 December 2017
 AVI Limited presentation to shareholders & analysts for the six months ended 31 December 2017 AGENDA Key features and results history Group financial results Performance and prospects Questions and answers
Financial report Q3 2014
 Financial report Q3 2014 Austevoll Seafood ASA Financial report Q3 2014 Index Key figures for the Group... 03 Q3 2014... 04 Operating segments... 04 Cash flows... 05 Financial information as of 30 September
Events after balance sheet date
 Austevoll Seafood ASA 0 Financial Report Q4 2011 Successful second fishing season for anchoveta in Peru A positive result recorded for fish farming, sale and distribution, in difficult conditions Seasonally,
Directors Report to Shareholders For the 28 Weeks ended 11 September 2017 (1H 2018)
") RESTAURANT BRANDS NEW ZEALAND LIMITED Directors Report to Shareholders For the 28 Weeks ended 11 September 2017 (1H 2018) Key Points Total Group Sales ($m) 386.1 256.2 +129.9 +50.7 Group NPAT (reported)
RESTAURANT BRANDS NEW ZEALAND LIMITED Directors Report to Shareholders For the 28 Weeks ended 11 September 2017 (1H 2018) Key Points Total Group Sales ($m) 386.1 256.2 +129.9 +50.7 Group NPAT (reported)
Interim Results Presentation. For the six months ended 31 December 2018
 Interim Results Presentation For the six months ended 31 December 2018 1 STEEL & TUBE IS One of New Zealand s leading providers of steel solutions, and a proud New Zealand company, with over 65 years of
FINANCIAL & OPERATIONAL RESULTS
 FINANCIAL & OPERATIONAL RESULTS HALF YEAR ENDED 31 DECEMBER 2016 24 February 2017 DISCLAIMER This presentation contains forward-looking statements. Forward-looking statements often include words such as
Austevoll Seafood ASA
 Austevoll Seafood ASA Financial Report Q4 2016 and preliminary figures for 2016 INDEX Key figures for the group... 03 Q4 2016... 04 Operating segments... 04 Cash Flows Q4 2016... 06 Cash flows 2016...07
Kathmandu Holdings Limited
 Kathmandu Holdings Limited New Zealand Stock Exchange Listing Rules Disclosure Full Year Report For the year ending 31 July 2017 Contents Appendix 1 Media Announcement Financial Statements Auditors Report
Q Nova Austral Financial Reporting May 2nd, 2018
 Q1-2018 Nova Austral Financial Reporting May 2nd, 2018 Agenda A. Nova Austral Pillars & Fundamentals B. Market and company updates C. Financial Report 1) Key Financial summary 2) LTM EBITDA, Revenue and
AUB GROUP LTD FULL YEAR RESULTS FOR THE PERIOD ENDED 30 JUNE 2018 (FY18) 27 AUGUST 2018
 27 AUGUST 2018") AUB GROUP LTD FULL YEAR RESULTS FOR THE PERIOD ENDED 30 JUNE 2018 (FY18) 27 AUGUST 2018 NOTICE SUMMARY INFORMATION This document has been prepared by AUB Group Limited(ABN 60 000 000 715)(AUB). It is a
AUB GROUP LTD FULL YEAR RESULTS FOR THE PERIOD ENDED 30 JUNE 2018 (FY18) 27 AUGUST 2018 NOTICE SUMMARY INFORMATION This document has been prepared by AUB Group Limited(ABN 60 000 000 715)(AUB). It is a
amagroupltd.com Page 1
 amagroupltd.com Page 1 WORLD CLASS AUTOMOTIVE SOLUTIONS Page 2 Page 3 Contents. Highlights AMA Group Overview Financial Performance Vehicle Panel Repairs ACAD and Procurement Strategy and Outlook HIGHLIGHTS
AVI Limited presentation to shareholders & analysts for the year ended June 2018
 AVI Limited presentation to shareholders & analysts for the year ended June 2018 AGENDA Key features and results history Group financial results Business unit performance Prospects Questions and answers
STEEL & TUBE HOLDINGS LIMITED. HY18 Interim Results Presentation. For the Six Months to 31 December February 2018
 STEEL & TUBE HOLDINGS LIMITED HY18 Interim Results Presentation For the Six Months to 31 December 2017 23 February 2018 BECOMING A MODERN AND INNOVATIVE COMPANY Providing Strength to New Zealand Steel
SCALES CORPORATION LIMITED 104 YEARS AND STILL GROWING 2016 Annual Shareholders Meeting. 8 June 2016
 SCALES CORPORATION LIMITED 104 YEARS AND STILL GROWING 2016 Annual Shareholders Meeting 8 June 2016 AGENDA Welcome Chairman s review Managing Director s review Ordinary business and resolutions Scales
AVI Limited presentation to shareholders & analysts for the year ended 30 June 2014
 AVI Limited presentation to shareholders & analysts for the year ended 30 June 2014 AGENDA Key features and results history Group financial results Performance and prospects Questions and answers KEY FEATURES
TELECOM NEW ZEALAND H1 FY11 RESULT BRIEFING. Chief Executive Officer Paul Reynolds Chief Financial Officer Nick Olson
 TELECOM NEW ZEALAND H1 FY11 RESULT BRIEFING Chief Executive Officer Paul Reynolds Chief Financial Officer Nick Olson CONTENTS Paul Reynolds Key messages Product trends Business unit performance Nick Olson
Kathmandu FY12 Results Presentation
 Kathmandu FY12 Results Presentation Contents Results Overview Key Line Items Country Results Cash Flow, Balance Sheet, Dividend Growth Strategy Update FY13 Outlook Questions 2 Results Overview Results
FY18 Results Presentation Bravura Solutions Limited. 28 August 2018
 FY18 Results Presentation Bravura Solutions Limited 28 August 2018 Important notice and disclaimer The information contained in this document (including this notice) and discussed at this presentation
SKYCITY Entertainment Group Limited
 SKYCITY Entertainment Group Limited 1H18 Results Investor Presentation 9 February 2018 Disclaimer All information included in this presentation is provided as at 9 February 2018 This presentation includes
Q August 24th. Lerøy Seafood Group ASA. CEO Henning Beltestad CFO Sjur S. Malm
 Q2 2017 August 24th Lerøy Seafood Group ASA CEO Henning Beltestad CFO Sjur S. Malm Agenda Highlights Key financial figures Outlook Q2 2017 EBIT before FV adj. NOK 801 million Harvest volume 26 156 GWT
Tegel Group Holdings Limited
 Tegel Group Holdings Limited FY17 Interim Results Presentation 15 December 2016 TEGEL GROUP HOLDINGS LIMITED FY17 INTERIM RESULTS 1 Disclaimer This presentation contains summary information about Tegel
Sales increased 8.1% to $128.0m (HY17: $118.4m)
") Nick Scali Limited NCK.ASX HY18 Results Presentation 7th February 2018 Key Highlights Sales increased 8.1% to $128.0m (HY17: $118.4m) Sales Like for like sales growth of +2.6% for Nick Scali Furniture
Nick Scali Limited NCK.ASX HY18 Results Presentation 7th February 2018 Key Highlights Sales increased 8.1% to $128.0m (HY17: $118.4m) Sales Like for like sales growth of +2.6% for Nick Scali Furniture
Transpacific FY15 Half Year Results Presentation
 Transpacific FY15 Half Year Results Presentation Robert Boucher CEO Brendan Gill CFO 20 February 2015 - Disclaimer Forward looking statements - This presentation contains certain forward-looking statements,
Financial Results - Year Ended 31 March 2018 Investor Presentation
 Financial Results - Year Ended 31 March 2018 Investor Presentation Agenda Overview of FY18 Page 4 FY18 Financial Results: Segment Results Centre Metrics Impairments Balance sheet and funding Driving Performance
Grieg Seafood ASA Quarterly report Q4 2018
 bv Grieg Seafood ASA Quarterly report ABOUT GRIEG SEAFOOD Grieg Seafood ASA is one of the world's leading salmon farmers, specializing in Atlantic salmon. The Group has an annual production target of 100
Fliway Group Limited Results for announcement to the market NZX Appendix 1. 6 months to 31 December months to 31 December 2015
 Fliway Group Limited Results for announcement to the market NZX Appendix 1 Reporting Period 6 months to 31 December 2016 Previous Reporting Period 6 months to 31 December 2015 Amount (000s) Percentage
2017 half year results investor presentation
 2017 half year results investor presentation 27 February 2017 contents section presenting slide CEO presentation Julian Ogrin 3 broadband 10 CFO presentation Leanne Wolski 14 summary Julian Ogrin 21 appendix
2017 Half-Year Results
 2017 Half-Year Results Martin Earp, CEO Josée Lemoine, CFO 16 August 2017 Financials Pillars of Growth Summary of Performance H1 2017 Sales Revenue $218.2m 1.7% Demographics Deaths 1 2.8% Australia $44.1m
2018 First Quarter Report
 2018 First Quarter Report Table of Contents Page # Letter to shareholders 2 Management discussion and analysis Non-IFRS Measures 5 Clearwater overview 7 Explanation of annualized financial results 10 Explanation
Marine Harvest. Q Presentation 14 February 2018
 Marine Harvest Q4 2017 Presentation 14 February 2018 1 Forward looking statements This presentation may be deemed to include forward-looking statements, such as statements that relate to Marine Harvest
A S X A N N O U N C E M E N T
 A S X A N N O U N C E M E N T DATE: 24 February 2016 Attached is the Presentation regarding Pact s Half year Financial Results for the half year ended 31 December 2015. The Presentation will occur at 10am
Tassal Group Limited (TGR): Market Release Results for the Half-Year Ended 31 December 2016
: Market Release Results for the Half-Year Ended 31 December 2016") 22 February 2017 The Manager, Listings Australian Securities Exchange Company Announcements Office Level 4, Exchange Centre 20 Bridge Street Sydney, NSW 2000 Via e-lodgement Dear Sir We attach the following:
22 February 2017 The Manager, Listings Australian Securities Exchange Company Announcements Office Level 4, Exchange Centre 20 Bridge Street Sydney, NSW 2000 Via e-lodgement Dear Sir We attach the following:
HUON AQUACULTURE GROUP LIMITED
 HUON AQUACULTURE GROUP LIMITED RESULTS PRESENTATION FOR FIRST HALF FY2017 IMPORTANT NOTICE This presentation is provided by Huon Aquaculture Group Limited (ACN 114 456 781) to provide summary information
MTN Group Limited Results presentation for the six months ended 30 June 2017
 MTN Group Limited Results presentation for the six months ended 30 June 2017 Disclaimer The information contained in this document has not been verified independently. No representation or warranty express
OURNEY ONTINUES. FY19 Interim Results Presentation
 UR OURNEY ONTINUES. FY19 Interim Results Presentation DISCLAIMER This presentation contains forward-looking statements and projections. These reflect thl s current expectations, based on what it thinks
SKYCITY Entertainment Group Limited 2008 Full Year Result Presentation
 SKYCITY Entertainment Group Limited 2008 Full Year Result Presentation Agenda I. Highlights and Result Summary 3 II. Business Unit Results 10 III. Financial Results 23 IV. Strategy and Outlook 30 V Appendix
Q November 9th. Lerøy Seafood Group ASA. CEO Henning Beltestad CFO Sjur S. Malm
 Q3 2017 November 9th Lerøy Seafood Group ASA CEO Henning Beltestad CFO Sjur S. Malm Agenda Highlights Key financial figures Outlook Q3 2017 EBIT before FV adj. NOK 861 million Harvest volume 46 024 GWT
Half year result. 26 August 2016
 2016 Half year result 26 August 2016 Alison Watkins Group Managing Director Martyn Roberts Group Chief Financial Officer Barry O Connell MD Australian Beverages Agenda Group Result Summary Shareholder
FY2014 Full year results
 FY2014 Full year results Peter Watson CEO I Managing Director Ian Poole Chief Financial Officer 28 August 2014 FY2014 year in review Resources capital expenditure conditions subdued Strong underlying result
For personal use only
 ASX ANNOUNCEMENT 11 February 2015 Financial summary Results for the six months ended 31 December 2014 1H15 % change Sales revenue 1 ($m) 1,001.9 906.3 10.6% EBITDA 2 ($m) 49.3 43.9 12.3% EBITDA 2 margin
For personal use only. JB Hi-Fi Limited. HY18 Results Presentation
 JB Hi-Fi Limited HY8 Results Presentation 5 FEBRUARY AUGUST 06 08 PAGE Agenda. Group Performance Overview. JB HI-FI 3. The Good Guys 4. Group Balance Sheet and Cash Flow 5. Outlook Richard Murray Group
UBS Australasia Conference November 2017
 UBS Australasia Conference November 2017 Jonathan Ling Managing Director GUD Holdings Limited GUD HOLDINGS The GUD group Automotive Davey Oates Automotive filters Heavy duty filters Fuel pumps Ignition
For personal use only. Lovisa Holdings Limited 2019 HALF YEAR
 Lovisa Holdings Limited 2019 HALF YEAR SHANE FALLSCHEER CHRIS LAUDER MANAGING DIRECTOR CHIEF FINANCIAL OFFICER Some of the information contained in this presentation contains forward - looking statements
1H FY16 RESULTS PRESENTATION
 FY16 RESULTS PRESENTATION March 2016 Contents 1 Results Overview 2 Key Line Items 3 Country Results 4 Cash Flow, Balance Sheet, Dividend 5 Growth Strategy Update 6 FY16 Outlook 7 Questions A Appendices
For personal use only
 HY14 Results 15 May 2014 Disclaimer This presentation includes both information that is historical in character and information that consists of forward looking statements. Forward looking statements are
COMPUTERSHARE LIMITED (ASX:CPU) FINANCIAL RESULTS FOR THE HALF YEAR ENDED 31 DECEMBER February 2015
 FINANCIAL RESULTS FOR THE HALF YEAR ENDED 31 DECEMBER February 2015") COMPUTERSHARE LIMITED (ASX:CPU) FINANCIAL RESULTS FOR THE HALF YEAR ENDED 31 DECEMBER 2014 11 February 2015 NOTE: All figures (including comparatives) are presented in US Dollars unless otherwise stated.
COMPUTERSHARE LIMITED (ASX:CPU) FINANCIAL RESULTS FOR THE HALF YEAR ENDED 31 DECEMBER 2014 11 February 2015 NOTE: All figures (including comparatives) are presented in US Dollars unless otherwise stated.
GROWING GLOBALLY FY 2018 INTERIM RESULTS PRESENTATION: 22 FEBRUARY 2018
 GROWING GLOBALLY FY 2018 INTERIM RESULTS PRESENTATION: 22 FEBRUARY 2018 Disclaimer This presentation contains forward-looking statements and projections. These reflect thl s current expectations, based
3Q Financial Results Presentation. Manuel Fernandez de Sousa-Faro, Chairman Joaquín Viña Tamargo, CAO & IR
 3Q 211- Financial Results Presentation Manuel Fernandez de Sousa-Faro, Chairman Joaquín Viña Tamargo, CAO & IR Disclaimer This document is purely informative and does not intend to be comprehensive. Financial
Investor & Analyst Presentation Ful YearResults 30 June2016 For personal use only 25th August 2016 Rebekah O Flaherty - CEO I Jonathan Kenny - CFO
 Investor & Analyst Presentation Full YearResults 30 June2016 25th August 2016 Rebekah O Flaherty - CEO I Jonathan Kenny - CFO Agenda 1 Overview 2 Strategic Priorities 3 FY16 Financial Results 4 FY17 Outlook
FY 2017 Results. March 6, 2018
 FY 2017 Results March 6, 2018 Forward looking statements This Presentation may include forward-looking statements. Forward-looking statements are statements regarding or based upon our management s current
For personal use only
 Mantra Group H1FY2015 Results Presentation 26 February 2015 Important notice and disclaimer Important notice and disclaimer This document is a presentation of general background information about the activities
Tegel Group Holdings Limited
 Tegel Group Holdings Limited FY17 Full Year Results Presentation 27 June 2017 1 TEGEL GROUP HOLDINGS FY17 RESULTS PRESENTATION Disclaimer This presentation contains summary information about Tegel Group
Financial results & business update. Quarter ended 30 September October 2016
 Financial results & business update Quarter ended 30 September 2016 19 October 2016 Disclaimer 3 Any remarks that we may make about future expectations, plans and prospects for the company constitute forward-looking
FY17 Results. 17 August David Mair CEO & Executive Director Graham Leaming CFO
 FY17 Results 17 August 2017 David Mair CEO & Executive Director Graham Leaming CFO 1 Skellerup Key Points FY17 NPAT of $22.1 million At the top end of guidance range, up 8% on prior corresponding period
Unaudited Interim results FOR THE SIX MONTHS ENDED 30 JUNE 2018
 Unaudited Interim results FOR THE SIX MONTHS ENDED 30 JUNE 2018 CORPORATE INFORMATION Sea Harvest Group Limited (Incorporated in the Republic of South Africa) Registration number: 2008/001066/06 JSE Code:
TOURISM HOLDINGS LTD FY16 INTERIM RESULTS PRESENTATION. 23 February 2016
 TOURISM HOLDINGS LTD FY16 INTERIM RESULTS PRESENTATION 23 February 2016 $M H1 FY16 Highlights Revenue $134M up 20% Earnings before interest and tax* $15.0M up 42% Net profit after tax $8.2M up 45% H1 EBIT
SCALES CORPORATION LIMITED GROWING YOUR DIVERSIFIED AGRIBUSINESS. Half Year Results For the six months ended 30 June August 2018
 SCALES CORPORATION LIMITED GROWING YOUR DIVERSIFIED AGRIBUSINESS Half Year Results For the six months ended 30 June 2018 28 HIGHLIGHTS Strong first half result whilst delivering on refreshed strategy Positive
Nufarm Interim Results
 Nufarm Interim Results 6 months to January 31, 2018 March 21, 2018 1 Disclaimer General This presentation has been prepared by Nufarm Limited. The information contained in this presentation is for informational
Financial results & business update. Quarter and year ended 31 December February 2016
 Financial results & business update Quarter and year ended 31 December 2015 11 February 2016 Disclaimer 3 Any remarks that we may make about future expectations, plans and prospects for the company constitute
Interim Results 2019 March 2019
 Interim Results 2019 March 2019 Disclaimer This presentation may contain forward-looking statements and projections. There can be no certainty of outcome in relation to the matters to which the forward-looking
2017 Full Year. Results Presentation. 21 February 2018
 2017 Full Year Results Presentation 21 February 2018 CAUTIONARY STATEMENT 2017 Full Year Results Slide 2 Full Year Highlights 2017 Full Year Results Presentation 8TH YEAR OF DOUBLE-DIGIT GROWTH 2017 FINANCIAL
Telecom Corporation of New Zealand
 Telecom Corporation of New Zealand CLSA Conference Chief Financial Officer Marko Bogoievski September 2006 CONTENT 2 OVERVIEW NZ BUSINESS OPERATING PERFORMANCE NZ BUSINESS STRATEGY AUSTRALIA BALANCE SHEET
Financial Report Q FINANCIAL REPORT Q1 2010
 Financial Report Q4 2010 FINANCIAL REPORT Q1 2010 Austevoll Seafood ASA 0 Interim Report Q4 2010 Fourth quarter also achieved record-high operating result Good market and good prices for salmon and trout
Aker Seafoods Second quarter 2010 Profits improved in high season
 Aker Seafoods Second quarter 21 Profits improved in high season CEO Liv Monica B Stubholt CFO Gunnar Aasbø-Skinderhaug Welcome Agenda Topic Speaker Operational Update Liv Monica Stubholt, CEO Group Harvesting
For personal use only
 ABN 87 009 248 720 PRELIMINARY FINAL REPORT For the Year Ending 30 June 2015 (Incorporating information pursuant to ASX listing rule 4.3A) Directors Commentary Move into the Agri-business Sector Style
Kathmandu Holdings Limited
 Kathmandu Holdings Limited Preliminary Full Year Report For the year ending 31 July 2016 Contents Appendix 4E Media Announcement Financial Statements Auditors Report Appendix 4E Kathmandu Holdings Limited
CMS ENERGY CORPORATION Earnings Per Share By Year GAAP Reconciliation (Unaudited)
") GAAP Reconciliation Earnings Per Share By Year GAAP Reconciliation 2003 2004 2005 2006 2007 2008 2009 2010 2011 2012 2013 2014 2015 2016 2017 Reported earnings (loss) per share - GAAP ($0.30) $0.64 ($0.44)
GAAP Reconciliation Earnings Per Share By Year GAAP Reconciliation 2003 2004 2005 2006 2007 2008 2009 2010 2011 2012 2013 2014 2015 2016 2017 Reported earnings (loss) per share - GAAP ($0.30) $0.64 ($0.44)
Your Aquaculture Technology and Service Partner. Company presentation November 2014
 Company presentation November 2014 Important Information About this Company Presentation This Company Presentation has been prepared by AKVA group ASA ("AKVA group" or the "Company") for information purposes
Austevoll Seafood ASA
 Austevoll Seafood ASA Financial Report Q3 2017 Index Key figures for the Group...03 Q3 2017...04 Operating segments...04 Cash flow Q3 2017...07 Financial factors at 30 September 2017...07 Cash flows at
RPC GROUP PLC 2017 / 18 RESULTS
 RPC THE ESSENTIAL INGREDIENT RPC GROUP PLC 2017 / 18 RESULTS Supplemental Information 1 2018 RPC Group Plc. All Rights Reserved. Key figures Sales ( m) +36% Adjusted Operating Profit ( m) +38% Adjusted
NUPLEX INDUSTRIES LIMITED RESULTS PRESENTATION FOR THE YEAR ENDED 30 JUNE 2012 PRESENTATION AGENDA
 NUPLEX INDUSTRIES LIMITED RESULTS PRESENTATION FOR THE YEAR ENDED 30 JUNE 2012 17 AUGUST 2012 Emery Severin, Chief Executive Officer Ian Davis, Chief Financial Officer PRESENTATION AGENDA 1. Group Overview
Investor Presentation
 Investor Presentation Full Year Results FY2018 Raj Naran, Managing Director and CEO, ALS Limited 28 May 2018 www.alsglobal.com IMPORTANT NOTICE AND DISCLAIMER This presentation has been prepared by ALS