New Zealand King Salmon s Prospective Financial Information, a reconciliation of non-gaap to GAAP information and supplementary financial information
|
|
|
- Vernon Pitts
- 5 years ago
- Views:
Transcription
1 New Zealand King Salmon s Prospective Financial Information, a reconciliation of non-gaap to GAAP information and supplementary financial information /
2 A. ABOUT THIS DOCUMENT The information contained in this document should be read in conjunction with New Zealand King Salmon s Product Disclosure Statement dated 23 September 2016 ( the PDS ) and other information presented on the Offer Register. Capitalised terms in this document have the same meaning as the terms defined in the PDS. This document contains the following information: A description of the pro forma adjustments included within the financial information in the PDS and this document. A reconciliation between the GAAP financial information and non-gaap financial information presented in the Table of Selected Financial Information within Section 7 (New Zealand King Salmon s financial information) of the PDS. Prospective financial information for New Zealand King Salmon, including important assumptions that have been made in preparing that prospective financial information. B. PRO FORMA ADJUSTMENTS Introduction The information contained in this section provides a description of the pro forma adjustments included within the pro forma information in the PDS and this document. The pro forma information has been derived from the statutory historical financial information, adjusted for structural changes and non-recurring or infrequent adjustments. We believe these adjustments allow investors to better compare trends in historical financial information and to better compare the historical financial information with the PFI. These adjustments are described below and fall into three broad categories: 1. Adjustments for non-recurring or infrequent items. 2. Timing adjustments (to better reallocate revenues or expenses to the year to which they relate). 3. Adjustments for structural changes to the business. The pro forma adjustments explain the reconciling steps between the GAAP financial information and non- GAAP financial information presented in the Table of Selected Financial Information within Section 7 (New Zealand King Salmon s financial information) of the PDS. The information contained in this section should be read in conjunction with the PDS, the other information contained in this Offer Register filing and other information presented on the Offer Register. Explanations of Pro forma Adjustments The Table of Selected Financial Information within Section 7 (New Zealand King Salmon s financial information) of the PDS presents Pro Forma Operating EBITDA, both Net Profit After Tax and Pro Forma Operating NPAT and pro forma operating total debt. The reconciling steps are contained in Section D of this Offer Register filing. Explanations for the pro forma adjustments are provided below. Adjustments for non-recurring or infrequent items Factors influencing Pro Forma EBITDA /
3 1. Waihinau / Forsyth mortality events. Significant mortality events occurred at the Waihinau / Forsyth seafarm during FY2014 to FY2016, for which the Group received insurance proceeds under its livestock policy. The Waihinau / Forsyth seafarm has been fallowed, with key infrastructure moved to the Ngamahau site and, while the site will no longer be used as a full grow out seafarm, Waihinau is intended to be used in late FY2017F as a site during cooler months for the growth of smolt. Using the seafarm in this way is expected to avoid any future mortality events. Accordingly, the abnormal mortality costs at the Waihinau / Forsyth seafarm, net of insurance proceeds, have been adjusted. 2. EPA cost write off. In 2011 the Group commenced a process to seek new seawater space via the EPA Board of Inquiry process. This process was established by aquaculture enabling legislation passed in 2011 and allowed for the first new waterspace application by the Group in many years. The Group used this process in the belief it would be more expedient, lower cost and have a higher prospect of success than alternative processes. However, the Group applied for nine sites and after a lengthy and expensive process was initially granted consents for four new seafarms, for which the legal and other professional advisory costs associated with gaining the consents were capitalised. Given the protracted nature of the process and the costs involved, the Group would not favour using the EPA Board of Inquiry process again. Furthermore, after the consents were granted, they were subject to further review via two appeals. On final appeal, the Supreme Court overturned one of the consents and the capitalised value recorded against the overturned consent was written off. The Group believes this write down is a one-off and exceptional cost given the circumstances. 3. Loss on sale of Ngamahau property. The business purchased a property near the Ngamahau seafarm to assist with the EPA application. The property was sold when consents had been granted whereupon New Zealand King Salmon realised a loss. This is a one-off cost in relation to gaining the seafarm consents. 4. Consent swap application expense write off. All expenses relating to an ongoing initiative being progressed by the Government and the Marlborough District Council to swap all existing low flow seafarm consents to new sites with improved characteristics were written off in FY2016. The consent swap initiative has not been used before and, in the Group s view, is unlikely to be used in the future. Accordingly, these expenses are regarded as one off in nature and, while the process is progressing positively, there is insufficient certainty of outcome to meet the required test under NZ IAS 38- Intangible Assets for capitalisation of this expenditure. Our financial forecasts do not assume any benefit as a result of this process. 5. Fair value gain in employee loans. In FY2008 New Zealand King Salmon granted interest free loans to certain employees to fund the purchase of shares in New Zealand King Salmon. Between FY2008 and FY2010 an expense was recorded to acknowledge the interest free loan. The outstanding expense was reversed in May This gain relates to costs incurred prior to the historical review period and has been excluded. 6. Offer costs. Costs relating to the Offer that have been recorded as an expense during FY2016 and FY2017F are estimated at $3.825m. Factors influencing Pro Forma NPAT 7. Impairment of non-current assets. Impairment of non-current assets has been excluded from the calculation of Pro Forma NPAT. These items mostly relate to a write off of the physical assets ascribed to the Crail Bay site (this write off reflects the economic reality, with this site having been fallowed and all infrastructure removed, this write off does not include the site licence), and impairments against assets taken following a review of all assets in June 2016 in anticipation of the Offer (this impairment charge has been reversed out in recognition of the nature of the review and likelihood /
4 that the impairments would have accrued over an extended period rather than due to activities and operations in FY2016 only). 8. Interest rate swap close out costs. Excluding the cost of closing out interest rate swaps due to the repayment of bank debt through the Offer. Timing adjustments 9. Timing adjustment of feed rebate. Data gathered on feed and related fish performance highlighted issues with a feed formulation from one of our suppliers. In June 2015 an agreement was reached whereby $913k of feed costs were rebated (and recognised as other income in that year). This adjustment moves the recognition of the rebate to the period to which the original feed cost invoices were incurred (FY2014). 10. Japanese Yen FX contract close out. To assist with the significant investment requirements of the EPA seafarm consent process commencing in 2012, New Zealand King Salmon closed out 2.15b of JPY contracts with maturity dates through FY2017F realising an approximate $10m gain recognised in the FY2013 Statement of Comprehensive Income. In the ordinary course of New Zealand King Salmon s business, however, FX contracts are held to, or near to, maturity and recognised in profit and loss at that point. The effect of closing out these contracts early was to decrease profits in FY2014 to FY2016. This pro forma adjustment restates revenues for foreign exchange gains that would have been recognised as revenue in accordance with normal accounting rules had all contracts been held to maturity. A portion of the gains that would have been recognised as ineffective hedges has not been included in this normalisation. If New Zealand King Salmon had not closed out these contracts, alternative funding would likely have been sourced from the shareholders in the form of an increase in shareholder loans or a capital injection. The incremental funding costs associated with that would have been removed within Adjustment 12 below. 11. Fire insurance claim. During FY2014 a smokehouse flue caught fire damaging inventory and temporarily raising costs for the business. An insurance payment of $515k was received in FY2016. This adjustment removes the insurance receipt from FY2016 and adds back that portion of the receipt that relates to additional expense incurred in FY2014. Adjustments for structural changes to the business 12. Incremental listed company costs. Corporate overheads as a listed company are larger than those of a private company. These additional costs have been estimated at $700k and include items such as increased Director s Fees, NZX listing fees, ASX listing fees, fees associated with running a share registrar and preparing an annual report, company secretary and investor relations costs, and various other items. To better enable a comparison between historical and forecast financial results, historical results have been reduced as if those costs had been incurred. 13. Listed company capital structure. The Group s previous capital structure included a significant amount of shareholder loans that were converted to ordinary equity on 21 September 2016 or repaid prior to the Offer. This adjustment reverses out the interest cost associated with the shareholder loans (so as to present interest costs as if New Zealand King Salmon had only ever had external bank debt, and the shareholder loans had been ordinary equity). C. OPERATING FINANCIAL INFORMATION New Zealand King Salmon has applied full provisions of NZ IFRS. A key element of this application is NZ IAS 41 Agriculture which requires biological assets to be measured at fair value less costs to sell and, in addition, NZ IAS 2 Inventories which requires the initial cost at harvest to be measured at fair value less costs to sell /
5 As these standards result in non-cash gains or losses (during the Prospective Period gains are anticipated), we have restated the Pro Forma Consolidated Statement of Comprehensive Income to remove these fair value gains. We believe that the resulting Operating Financial Information provides investors with useful information that enables them to compare the operation of the business across time periods. We plan to report in this manner in the future, which is generally consistent with other international listed salmon companies. Pro Forma Operating NPAT is also the basis of our proposed dividend policy. No adjustment is required to FY2014 for fair value adjustments as the reported results for this period were prepared under differential reporting requirements and therefore did not include the recognition of biological assets (or the initial cost of inventory) at fair value less costs to sell. As New Zealand King Salmon has applied the full provisions of NZ IFRS to FY2016, FY2015 financial information included in this document is restated to reflect the application of full NZ IFRS (including NZ IAS 41-Agriculture and NZ IAS 2-Inventory) as included in the FY2016 audited financial statements /
6 D. RECONCILIATION OF NON-GAAP TO GAAP INFORMATION Non-recurring or infrequent items Timing adjustments Structural changes FY2014 NZD 000s Statutory Financial Statements Waihinau / Forsyth Mortality events EPA Cost Write Off Fire Insurance claim Timing adjustment of feed rebate Japanese Yen FX Contract Close Out Incremental listed company costs Listed company capital structure Pro Forma Historical Information Sale of goods 95,064 2,670 97,734 Cost of goods sold (69,197) 464 (68,733) Gross Profit 25, , ,001 Other operating income 945 (518) 913 1,340 Distribution expenses (8,129) (8,129) Administrative expenses (14,750) (700) (15,450) Other expenses (2,313) 1,112 1,160 (41) EBIT 1, , ,670 (700) - 6,721 Financial income Financing costs (3,009) 1,263 (1,746) Net financing cost (2,798) ,263 (1,535) Profit/(loss) before Tax (1,178) 594 1, ,670 (700) 1,263 5,186 Income tax expense (352) (166) (325) (130) (256) (748) 196 (354) (2,134) Net Profit/(loss) for the period (1,530) ,922 (504) 910 3,052 EBIT 1, , ,670 (700) - 6,721 Depreciation and amortisation 3,592 3,592 EBITDA 5, , ,670 (700) - 10, /
7 Non-recurring or infrequent items Timing adjustments Structural changes FY2015 (Restated) NZD 000s Statutory Financial Statements Waihinau / Forsyth Mortality events Loss on sale EPA Cost of Ngamahau Write Off Property Impairments Timing adjustment of feed rebate Japanese Yen FX Contract Close Out Incremental listed company costs Listed company capital structure Pro Forma Historical Information Fair Value Adjustments Pro Forma Operating Financial Information Revenue 98,288 2, , ,392 Cost of goods sold (93,682) (93,682) 27,949 (65,733) Fair value gain / (loss) on biological transformation 29,539 29,539 (29,539) - Freight costs to market (8,814) (8,814) (8,814) Gross Profit 25, , ,435 (1,590) 25,845 Other operating income 3,792 (1,829) (913) 1,050 1,050 Overheads Sales, marketing and advertising (5,805) (5,805) (5,805) Distribution overheads (1,758) (1,758) (1,758) Corporate expenses (5,215) (700) (5,915) (5,915) Other expenses (3,961) 2, (543) (543) EBITDA 12,384 1, (913) 2,104 (700) - 14,464 (1,590) 12,874 Depreciation and amortisation (4,049) (4,049) (4,049) Impairment of non-current assets (200) EBIT 8,135 1, (913) 2,104 (700) - 10,415 (1,590) 8,825 Finance income Finance costs (1,654) 105 (1,549) (1,549) Net finance costs (1,522) (1,417) - (1,417) Profit / (loss) before Tax 6,613 1, (913) 2,104 (700) 105 8,998 (1,590) 7,408 Income tax (expense) / credit (354) (305) (10) (130) (56) 256 (589) 196 (29) (1,022) 445 (577) Net Profit / (loss) for the Year 6, (657) 1,515 (504) 76 7,976 (1,145) 6, /
8 Non-recurring or infrequent items Timing adjustments Structural changes FY2016 NZD 000s Statutory Financial Statements Consent Swap Application Expense Fair Value Gain in Employee Loans Offer costs Impairments Fire Insurance claim Japanese Yen FX Contract Close Out Incremental listed company costs Listed company capital structure Pro Forma Historical Information Fair Value Adjustments Pro Forma Operating Financial Information Revenue 114,060 2, , ,151 Cost of goods sold (104,883) (104,883) 30,509 (74,374) Fair value gain / (loss) on biological transformation 30,223 30,223 (30,223) - Freight costs to market (10,134) (10,134) - (10,134) Gross Profit 29, , , ,643 Other operating income 1,281 (515) Overheads Sales, marketing and advertising (6,815) (6,815) (6,815) Distribution overheads (2,041) (2,041) (2,041) Corporate expenses (6,062) 374 (203) (700) (6,591) (6,591) Other expenses (1,813) 841 (972) (972) EBITDA 13, (203) (515) 2,091 (700) - 15, ,990 Depreciation and amortisation (4,244) (4,244) (4,244) Impairment of non-current assets (1,037) 1, EBIT 8, (203) 841 1,037 (515) 2,091 (700) - 11, ,746 Finance income Finance costs (5,215) 3,780 (1,435) (1,435) Net finance costs (5,150) ,780 (1,370) - (1,370) Profit / (loss) before Tax 3, (203) 841 1,037 (515) 2,091 (700) 3,780 10, ,376 Income tax (expense) / credit (792) (105) 57 - (290) 144 (585) 196 (1,058) (2,434) (80) (2,514) Net Profit / (loss) for the Year 2, (146) (371) 1,506 (504) 2,722 7, , /
9 /
10 /
11 Pro forma operating total debt Pro forma operating total debt represents the closing balance of all bank debt and finance leases. It does not include shareholder loans which have been converted into ordinary shares or repaid prior to the Offer. NZD 000s FY2014 FY2015 FY2016 FY2017F FY2018F Statutory total interest-bearing liabilities 86,415 89,191 97,030 10,378 10,267 Shareholder loans (66,371) (68,591) (77,541) - - Pro forma operating total debt 20,044 20,600 19,489 10,378 10, /
12 E. PROSPECTIVE FINANCIAL INFORMATION Prospective consolidated financial statements for the year to 30 June 2017 and 30 June Introduction The prospective consolidated financial statements of New Zealand King Salmon Investments Limited comprise the following Prospective Financial Information ( PFI ): Prospective consolidated statement of comprehensive income; Prospective consolidated statement of financial position; Prospective consolidated statement of changes in equity; Prospective consolidated statement of cash flows; Basis of preparation and significant accounting policies; A description of the general and specific assumptions that support the PFI; and An analysis of the sensitivity of the PFI to changes in specific key assumptions. The information contained in this document should be read in conjunction with the PDS and other information presented on the Offer Register. 2. Basis of Preparation The PFI has been prepared in accordance with the requirements of Financial Reporting Standard 42: Prospective Financial Statements, as required by Clause 53(1)(c) of Schedule 3 to the Financial Markets Conduct Regulations 2014, specifically for the purpose of the Initial Public Offer of shares in New Zealand King Salmon (the Offer ) and may not be suitable for any other purpose. The PFI, including the assumptions underlying it, has been prepared by New Zealand King Salmon s management and approved by the Board. It is based on the Board s assessment of events and conditions existing at the date of this PDS, the accounting policies and best estimate assumptions set out in Sections 3 and 5 below. PFI by its nature involves risks and uncertainties, many of which are beyond the control of New Zealand King Salmon. The Board believes that the PFI has been prepared with due care and attention, and consider the best estimate assumptions, when taken as a whole, to be reasonable at the time of preparing this PFI. Actual results are likely to vary from the information presented as anticipated events and results may not occur as expected, and the variations may be material. Accordingly, neither the Directors nor any other person can provide any assurance that the PFI will be achieved and investors are cautioned not to place undue reliance on the PFI. The prospective consolidated statements of comprehensive income, prospective consolidated statements of changes in equity and prospective consolidated statements of cash flows cover the Prospective Period, comprising the 12 months ending 30 June 2017 ( FY2017F ) and 30 June 2018 ( FY2018F ) (collectively the Prospective Period ). The prospective consolidated statements of financial position are presented as at 30 June 2017 and 30 June Section 5.2 includes disclosures and commentary relating to both the pro forma PFI and the statutory PFI. The Directors are responsible for and have authorised the issue of the PFI on 23 September There is no present intention to update the PFI or to publish PFI in the future, other than as required by regulations. The Group will present a comparison of the PFI with actual financial results in its FY2017F and FY2018F annual reports, as required by Regulation 64 of the Financial Markets Conduct Regulations /
13 The PFI is presented in New Zealand dollars, unless otherwise specified, and is rounded to the nearest thousand dollars or nearest million dollars (as appropriate). 3. Significant Accounting Policies The significant accounting policies applied in preparing the PFI are the same as the accounting policies as set out in the audited financial statements for the year ended 30 June 2016 for New Zealand King Salmon Investments Limited which are included on the Offer Register, and remain consistent through the Prospective Period. Currently there are no anticipated changes to accounting standards under GAAP that are expected to materially affect the Group during the Prospective Period. However, any further changes to GAAP could necessitate changes in the accounting policies currently adopted and any new or amended accounting standards, or interpretation, may affect the actual financial results or financial position /
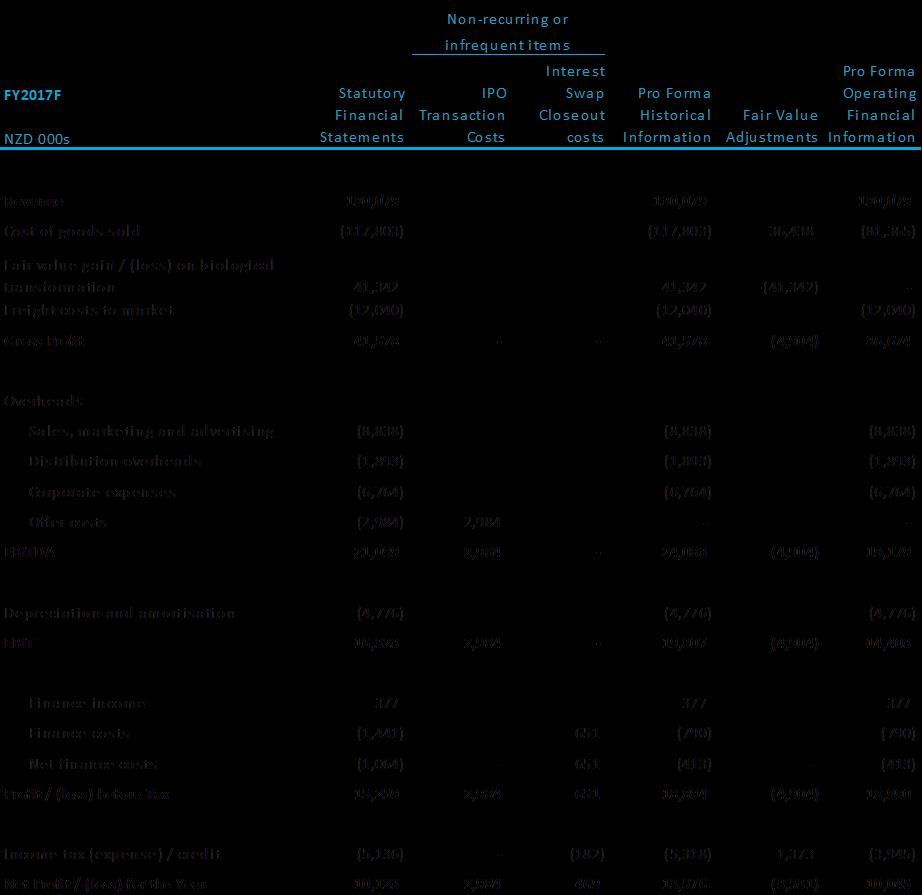
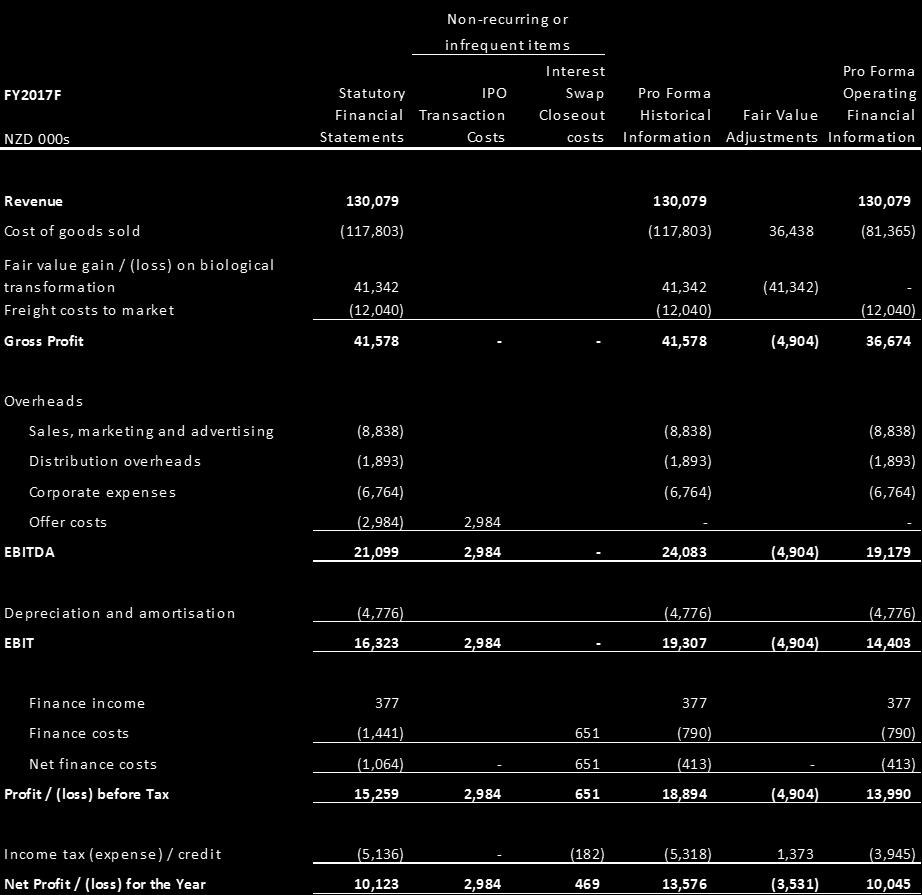
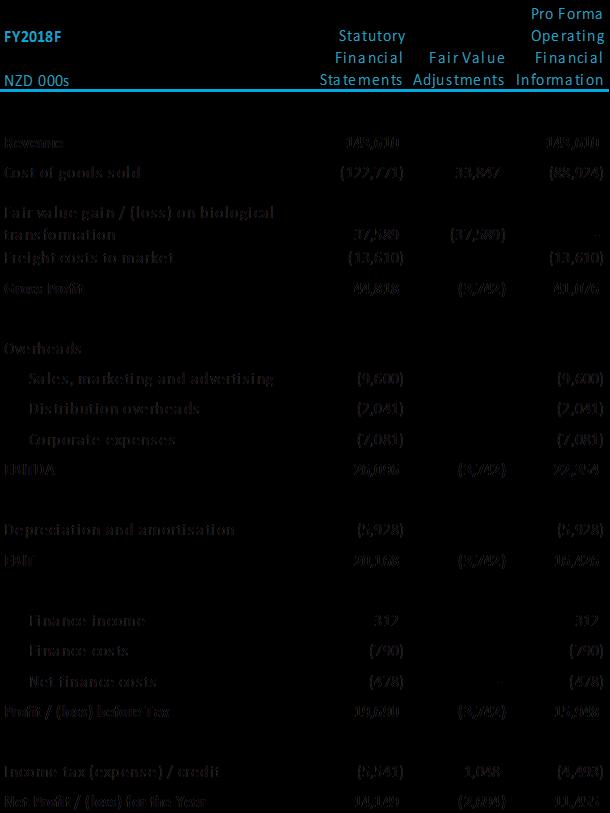
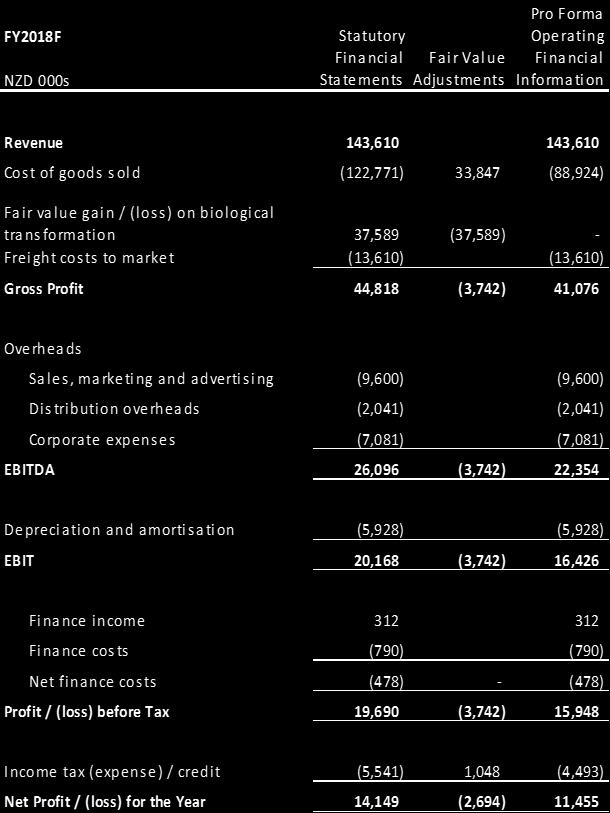
14 4. Prospective Financial Statements 4.1 Prospective consolidated statements of comprehensive income NZD 000s FY2017F FY2018F Revenue 130, ,610 Cost of goods sold (117,803) (122,771) Fair value gain / (loss) on biological transformation 41,342 37,589 Freight costs to market (12,040) (13,610) Gross Profit 41,578 44,818 Overheads Sales, marketing and advertising (8,838) (9,600) Distribution overheads (1,893) (2,041) Corporate expenses (6,764) (7,081) Offer costs (2,984) - EBITDA 21,099 26,096 Depreciation and amortisation (4,776) (5,928) EBIT 16,323 20,168 Finance income Finance costs (1,441) (790) Net finance costs (1,064) (478) Profit before Tax 15,259 19,690 Income tax expense (5,136) (5,541) Net Profit for the Year 10,123 14,149 Total comprehensive income 10,123 14,149 The amounts shown for Cost of goods sold and Fair value gain / (loss) on biological transformation are impacted by the application of IAS 41 Agriculture and IAS 2 Inventory. These standards effectively require us to recognise the anticipated profit on the future sale of our salmon stocks as biomass is being grown. This means that by the time of harvest, the full expected profit from the sale of each salmon has effectively already been recognised in our accounts. Other listed salmon companies choose to show Operating Financial Performance which presents financial information based on cost accounting rules, and reversing out fair value adjustments. We present Operating Financial Performance in Section D Reconciliation of Non-GAAP to GAAP Information above. The prospective consolidated statements should be read in conjunction with the notes to the prospective consolidated financial statements in Sections 1, 2, 3 above and Sections 5 and 6 below /
15 4.2 Prospective consolidated statements of financial position NZD 000s FY2017F FY2018F Assets Cash and cash equivalents 5, Trade and other receivables 11,406 12,499 Inventories 18,515 19,575 Biological Assets 56,937 64,974 Non-current assets held for sale Other financial assets 1,475 1,475 Derivative financial assets Total Current Assets 94,384 99,687 Property, plant & equipment 38,854 44,449 Intangible assets 3,411 2,954 Goodwill 39,255 39,255 Biological assets 9,781 11,162 Deferred tax asset 1,423 1,343 Derivative financial assets 96 - Total Non-Current Assets 92,820 99,163 Total Assets 187, ,850 Liabilities Interest-bearing loans and borrowings Trade and other payables 18,535 20,460 Income tax payable Employee benefits 2,204 2,433 Derivative financial liabilities Total Current Liabilities 21,999 24,643 Interest-bearing loans and borrowings 10,126 10,089 Employee benefits Deferred tax liabilities 9,005 9,899 Deferred financial liabilities Total Non-Current Liabilities 20,588 20,453 Total Liabilities 42,587 45,096 Net Assets 144, ,754 Equity Share capital 123, ,334 Reserves (780) (493) Retained earnings 22,063 30,913 Total Equity 144, ,754 The prospective consolidated statements should be read in conjunction with the notes to the prospective consolidated financial statements in Sections 1, 2, 3 above and Sections 5 and 6 below /
16 4.3 Prospective consolidated statements of changes in equity NZD 000s FY2017F FY2018F Total Equity Balance at beginning of period 37, ,617 Capitalisation of shareholder loans to equity 69,890 Issue of shares 30,000 - Capitalisation of Offer costs (1,275) - Change in other reserves 1, Total profit for the period 10,123 14,149 Dividends paid (2,500) (5,300) Balance at End of Year 144, ,754 Equity breakdown by component Share capital 123, ,334 Reserves (780) (493) Retained earnings 22,063 30,913 Total Equity 144, ,754 The prospective consolidated statements should be read in conjunction with the notes to the prospective consolidated financial statements in Sections 1, 2, 3 above and Sections 5 and 6 below /
17 4.4 Prospective consolidated statements of cash flows NZD 000s FY2017F FY2018F Cash Flows From (Used in) Operating Activities Receipts from customers 128, ,534 Payments to employees and suppliers (117,897) (125,966) Interest paid (1,064) (478) Taxes paid (3,327) (4,567) Net Cash Flows From Operating Activities 6,622 11,523 Cash Flows Used in Investing Activities Acquisition of property, plant and equipment (10,584) (11,065) Net Cash Flows Used in Investing Activities (10,584) (11,065) Cash Flows From (Used in) Financing Activities Repayment of employee loans 1,283 - Draw down / (repayment) of Shareholder Debt (7,651) - Draw down / (repayment) of Bank Debt (9,000) - Dividends paid (2,500) (5,300) Capital issued / (bought back) 30,000 - Transaction costs (5,100) - Net Cash Flows Used in Financing Activities 7,032 (5,300) Net Increase / (Decrease) in Cash and Cash Equivalents 3,070 (4,843) Cash and cash equivalents at beginning of the period 2,419 5,489 Cash and Cash Equivalents at End of Year 5, The prospective consolidated statements should be read in conjunction with the notes to the prospective consolidated financial statements in Sections 1, 2, 3 above and Sections 5 and 6 below /
18 5. General and Specific Assumptions The following general and specific assumptions have been adopted in preparing the PFI. The general and specific assumptions contained in this section should be read in conjunction with Section 8 (Risks to New Zealand King Salmon s business and plans) of the PDS. 5.1 General Assumptions in Respect of the PFI Economic environment there will be no material changes in the economic outlook for the New Zealand and international markets in which we sell products, beyond normal market movements in prices. Political, legislative and regulatory environment there will be no material change to the political, legal or regulatory environments in which the Group acquires its inputs, sells its products or otherwise operates, including in relation to biosecurity controls, food safety regulations, resource management or sea water regulations, and restrictions on the importation of salmon into the offshore markets in which New Zealand King Salmon sells or intends to sell its products. Biosecurity there will not be any disease incursion or other biosecurity events or any other adverse publicity about us, other New Zealand salmon producers, or New Zealand food products, whether or not legitimate. Competitive environment there will be no material change in the competitive dynamics of the markets in which the Group operates or sells its products, including any material change in competitor activity. It is assumed that no new entrants will materially change the competitive environment in which the Group operates and no existing participant will leave the Group s key markets. Industry conditions there will be no material change in the general industry structure, third party relationships, trends in seasonal demand or general employment conditions. Key suppliers and customers other than a potential reduction from three main feed suppliers to two, there will be no change in key suppliers or customers and existing contractual, business and operational arrangements will remain in place. We target a balanced spread of suppliers at any point in time. However, from time to time, there may be transition periods between suppliers which result in greater concentration with a supplier or suppliers. We are currently in such a transition period, but expect to return to the targeted mix across a range of suppliers within the Prospective Period. Should any suppliers or customers be lost it is assumed they could be replaced on materially similar terms. Key suppliers and customers will comply with their contractual obligations. Disruption to operations there will be no material disruption to operations, including through plant and equipment failure, nature disasters, environmental conditions (including water temperature), accidents, fires, product supply or quality issues or through normal hazards associated with activities (including disruptions to or affecting any of the Group s key suppliers or customers). Operating environment there will be no material costs incurred through either industrial or contractual disputes. Business acquisitions or disposals there will be no material business acquisitions or disposals by the Group. Management of the Group no key personnel will leave the Group, and management resources will be sufficient for the Group s requirements. New Zealand and international tax laws there will be no material change to the tax rates or laws (including income tax, excise tax, import duties or goods and services tax) in New Zealand or the offshore markets in which the Group operates /
19 Financial Reporting Standards there will be no change in financial reporting standards or accounting interpretations which would have a material effect on us. Accounting for the Offer Offer costs to 30 June 2016 have been expensed in the statement of comprehensive income. The balance of Offer costs are forecast to be expensed to the statement of comprehensive income and capitalised on the statement of financial position in FY2017F as appropriate. 5.2 Specific Assumptions Harvest volumes New Zealand King Salmon s financial performance is strongly influenced by the harvest volumes that it achieves. Unlike other manufacturing or food producing industries, there is a limited amount of consented waterspace in New Zealand with restrictions that effectively limit the amount of salmon that can be grown at any seafarm. In addition, King salmon take an average of approximately 24 months to reach their average harvest live weight which is assumed to be 4.4kgs. This means that increases in production due to the three newly consented seafarms (and future expected increases in the consented feed discharge limits) take time to be reflected in our financial results. It also means that, at the time of writing, the fish that are expected to be harvested through FY2017F are already at sea. As shown in the chart below, harvest volumes are expected to increase in both FY2017F and FY2018F. The increase in harvest volumes is due to incremental harvest volumes from the new seafarms, with the harvest from existing seafarms forecast to decline (principally due to the cessation of using Waihinau as a grow-out seafarm). Two new seafarms (Waitata and Ngamahau) are currently in operation with fish to be harvested through the Prospective Period. The third new seafarm, Kopāua, has recently had smolt entered and is to be further developed with funds raised through the proposed Offer. It is forecast to contribute to the harvest in FY2018F. Historical and forecast harvest volumes (existing and new seafarms) (MT 000s, G&G) Existing Seafarms Waitata (New Seafarm) Ngamahau (New Seafarm) Kopāua (New Seafarm) FY2014 FY2015 FY2016 FY2017F FY2018F Over time the volume harvested will depend on the Net Growth in Available Biomass which has been forecast using the following formula: Net Growth in Available Biomass = Where: Feed Discharged FCR (1 Premature Mortality %) G&G Factor /
20 Feed Discharged is the total amount of feed (in kg) that is discharged across all of our seafarms (and to a much lesser degree, our hatcheries); FCR is the expected Feed Conversion Ratio and describes the amount of feed (in kg) required to increase the animal s bodyweight by one kg. FCR is considered by management to be the best proxy for fish performance, excluding mortality; The Premature Mortality % is the percentage of fish that die prior to harvest and are therefore not able to be sold (described as the biomass lost due to mortality as a percentage of the total growth in biomass prior to mortalities in any given year); and The G&G Factor reflects the proportion of fish biomass that comprises the guts and gills of the salmon. The biomass net of guts and gills variable has been observed historically at 88%. There have not been, and are not expected to be, any significant biological changes to our salmon that have or are expected to change the relative size of the gills and guts as a proportion of the whole fish. Accordingly this assumption is fixed at 88% through the PFI. All references to volumes in this document are references to the equivalent gutted and gilled ( G&G ) weight. The table below shows historical and forecast amounts for each of these assumptions. Further commentary is provided below. Key Operating Metrics FY2014 FY2015 FY2016 FY2017F FY2018F Seafarms Feed Discharged (MT 000s) FCR 1.83x 1.70x 1.91x 1.76x 1.76x Premature Mortality % 14.5% 18.7% 13.7% 11.0% 11.0% Hatcheries - Net Biomass Grown Harvest Volumes (MT 000s) Existing Seafarms New Seafarms Total Feed Discharged The amount of feed that can be discharged is mostly governed by consent but also by the commercial limits of certain low flow sites. We tend to discharge feed closely to the lesser of the consented limit, seabed limit (considering benthic impact requirements) or the commercial potential of low flow sites. We have a degree of control around feed discharge (for example if we approach feed limits at a particular seafarm we can slow down the rate of feeding, bring forward a harvest or even move fish between sites). The increase in feed discharged in FY2016 over FY2015 is due to our new seafarms becoming operational. Additional feed discharged in our new seafarms continues to explain increases in total feed discharge amounts through the Prospective Period. FCR With feed discharge volumes typically fixed, FCR determines the growth of biomass, which in turn drives the available harvest volumes. A more efficient (lower) FCR results in higher potential harvest volumes and vice versa /
21 Over an extended period, New Zealand King Salmon has generally achieved feed conversion ratios of between 1.60x and 1.70x. During FY2014 and FY2016, we recorded an FCR above that range due to issues principally thought to be related to diet. We monitor FCR closely and are taking a range of measures to improve FCR. FCR has been assumed at 1.76x throughout the Prospective Period. Whilst this is lower than the FCR recorded in FY2016, it is slightly higher than the average FCR recorded for the past 5 years. We believe that an average observation over a longer period is more suitable for a biological performance indicator such as the FCR and we will be targeting to reduce FCR below the level assumed through the Prospective Period. Historical and forecast FCR FCR by Financial Year 10 year average 5 year average 1.70x 1.74x 1.64x 1.67x 1.64x 1.64x 1.67x 1.63x 1.64x 1.83x 1.70x 1.91x 1.76x 1.76x FY2007 FY2008 FY2009 FY2010 FY2011 FY2012 FY2013 FY2014 FY2015 FY2016 FY2017F FY2018F Premature Mortality % Every year, a number of fish will die prior to harvest. This occurs due to a range of natural factors, and can be increased by unusually warm water, feeding issues, changes in environmental conditions (such as algal bloom, a natural event), predators (such as seals), disease or other factors that are known and unknown. Mortality rates are significantly higher on low flow sites. We term a significant increase in the mortality rate at an individual seafarm to more than around 30% as a mortality event. Such events have occurred during previous summers at low flow sites in particular and had a material impact on our production volumes. Two of the seafarms at which these events occurred (Waihinau / Forsyth seafarm) have since been fallowed and are no longer expected to be used for year round production. Other than Ruakaka, which is low flow, the average mortality for all other sites has been relatively consistent for the past three years at 9.8%. Our average mortality assumption of 11.0% is based on a higher level of mortalities at Ruakaka (which is a decreasing percentage of total production volume) and a slightly lower level of mortalities at all other seafarms. We have assumed no mortality events occur during the Prospective Period. We monitor mortality closely and are taking a range of measures to try to improve mortality below the rates assumed /
22 Historical and forecast mortality rates 20.0% 18.0% 16.0% 14.0% 12.0% 10.0% 8.0% 6.0% 4.0% 2.0% 0.0% 18.7% 15.6% 14.5% 13.7% 11.3% 13.6% 12.1% 11.1% 10.9% 11.0% 11.0% 6.3% 8.1% 4.1% Total Seafarm Mortality 4.9% 3.7% Mortality Excl. Waihinau / Forsyth FY2010 FY2011 FY2012 FY2013 FY2014 FY2015 FY2016 FY2017F FY2018F Revenue, direct costs and operating expenses Revenue Revenue is driven by the volume of salmon sold both domestically and to export markets, the average price per kg achieved and the foreign exchange rates used to convert sales to New Zealand dollars. Some additional revenue is earned from the sale of heads, eggs (caviar) and by-products. Sales Volume Sales volume is closely aligned with harvest volume, other than minor losses during further processing. Most of the time, fish will be airfreighted fresh on the day following harvest to our whole fresh customers. Customers who purchase our value added product will typically receive the product within a few days of the harvest. However, we can build inventories of finished goods (and plan to do this at certain times of the year to meet peak demand periods, such as around Christmas). Inventories can also be built where the size of the fish we harvest may not match our customer s current requirements. The table below shows sales volume and movements in inventories of finished goods between FY2014 and FY2018F: Sales Volume MT 000s FY2014 FY2015 FY2016 FY2017F FY2018F Sales Volume Increase / (Decrease) in Inventory (0.1) (0.2) - Sales Prices in Local Currency Recently we have achieved consistent annual increases in the weighted average sales prices of our products across all key markets to which we sell our product. In the chart below, we see that the cumulative annual compounding increase in in-market sales prices over the past 6 years is approximately 6% or greater for most markets, although the actual price increase amount varies significantly from year to year: /
23 Compounding average annual sales price ($ / kg) increases by market (FY2010-FY2016) local currency 11.1% 11.9% 5.6% 5.7% 6.3% 3.6% 3.6% Europe NZ - Foodservice NZ - Retail North America Australia Other Japan There are three components to the increase in weighted average sales prices: Direct price increases. A direct price increase on a single product or item. Direct price increases of 2.3% are forecast for FY2017F and 0.5% for FY2018F. Brand Mix. Sales of Ōra King, which predominantly comprise whole fresh fish sales, achieve a higher price than sales of unbranded or low-branded product (i.e. product sold under the New Zealand King Salmon label). We are focused on growing sales of Ōra King. Since launch in late 2012, sales of Ōra King have grown to approximately 1,700 MT in FY2016, or about 28% of all sales. Our forecasts assume sales of Ōra King continue to increase relative to sales of unbranded or other brands. By FY2018F, sales of Ōra King are forecast to comprise 31% of all sales. Sales of Ōra King as a percentage of total sales 8,000 7,000 6,000 Ōra King Other Brands / Unbranded 5,000 4,000 3,000 81% 76% 72% 70% 69% 2,000 1,000-19% 24% 28% 30% 31% FY2014 FY2015 FY2016 FY2017F FY2018F Product Mix. Value added products (fillets and portions, wood roasted and cold smoked) generally sell for a higher price per kg than whole fish. While increasing the sales percentage of high margin value added products is a key strategic goal, our forecasts do not provide for any material change in the product mix achieved in FY2016: /
24 Product mix whole fish vs. value-added 100% 90% 80% 70% 60% 50% 40% 30% 20% 10% 0% Whole Fish Value Added 55% 54% 50% 48% 48% 45% 46% 50% 52% 52% FY2014 FY2015 FY2016 FY2017F FY2018F Market Mix Our financial forecasts assume that approximately 75% of the increased harvest volume available from new seafarms will be exported reflecting the strong demand we are receiving from current and prospective international customers. In FY2016, export sales (in MT) comprised 41% of all sales. This is forecast to increase to 47% of all sales by FY2018F, with a significant increase in sales volumes to North America, Europe and Asia (ex Japan). To support the strong growth in export sales we are undertaking a range of initiatives. Some of these initiatives include: Two additional personnel have recently been appointed in North America increasing the business development team in that market from two to four. The roles have responsibilities to grow foodservice and retail sales in that market. We are at an advanced stage of simplifying our harvest methods from multiple methods catering to specific markets, to one method that meets the requirements of all export markets. This development, scheduled for the second half of FY2017F, will enable us to sell further volume into the European market. Further appointments in export and local markets to support sales growth. Domestically, we are focused on product innovation and marketing to address consumer queries around how to prepare, cook and present salmon at mealtimes /
25 Sales by market ($, FY2016) Sales by market ($, FY2018F) Australia 8% North America 24% Asia (ex Japan) 5% Japan 5% Europe 2% Australia 7% North America 27% Asia (ex Japan) 8% Japan 5% Europe 3% New Zealand 56% New Zealand 50% /
26 Sales by market and foreign exchange rates The table below sets out historical actual and forecast sales volumes by key markets (G&G weight), the weighted average sales price (in local currency) per kg, and exchange rates for FY2014 through FY2018F for major currencies. Foreign currency is covered in further detail in Section Sales by Market FY2014 FY2015 FY2016 FY2017F FY2018F Sales Volumes by Market (MT 000s) Domestic Sales Foodservice Retail Export Sales North America Australia Asia (ex Japan) Japan Europe Total Sales Average Sales Price per kg Domestic Sales Foodservice NZD Retail NZD NZD Export Sales North America USD Australia AUD Asia (ex Japan) NZD Japan JPY 1,177 1,387 1,428 1,385 1,400 Europe NZD Foreign Exchange Rates Notes: NZD:AUD NZD:USD NZD:JPY Average Sale Prices are gross sale prices. 2. Sales made to Europe and Asia (ex Japan) are made across a wide range of currencies including New Zealand dollars. For simplicity we have presented the average New Zealand dollar price achieved. 3. Historical foreign exchange rates reflect the actual exchange rates achieved by the Group, including hedging. Forecast foreign exchange rates are presented as forecast exchange rates taking into account hedging instruments in place as at 30 June 2016 and a combination of spot rates and forecast spot foreign exchange rates as at 11 July 2016 for any unhedged balance. 4. Our top 10 customers account for approximately 55% of revenues /
27 Direct costs Direct costs include feed costs, other aquaculture costs (which mostly comprise labour), harvest and processing costs, freight and other costs. Direct costs have been forecast based on FY2016 costs adjusted for inflation and other factors, such as operating efficiency initiatives. Pro forma adjustments have been applied in the historical period presented below to reflect pro forma adjustments, direct costs are also presented on an Operating basis (i.e. prior to the recognition of any fair value adjustments) as described in Sections B and C of this document. Direct Costs Pro forma operating NZD Millions FY2014 FY2015 FY2016 FY2017F FY2018F $ / kg Cost of Fish Harvested Harvest & Processing Freight & Other Cost of Fish Harvested ($ / kg sold) Harvest & Processing ($ / kg harvested) Freight & Other ($ / kg sold) Pro Forma Operating Cost of Goods Sold Deduct: Freight charges reported separately (8.1) - - Add: Depreciation in COGS / Other Add: Feed rebate classified as 'Other income' Add / (Deduct): Reclassification adjustments Pro Forma Operating Cost of Goods Sold / Direct Costs Cost of fish harvested The cost of fish harvested comprises feed, labour and overheads. On a cost per kg sold basis, this cost will be affected by movements in the growth efficiency metrics (specifically the FCR and Premature Mortality %) as described above. If the FCR or Premature Mortality % improve the cost on a per kg basis sold will reduce and vice versa. For FY2017F the cost of fish harvested is forecast to increase by $6.8m. On a per kg basis the cost of fish harvested is forecast to remain broadly in line with FY2016 ($8.25 / kg sold). For FY2018F the cost of fish harvested is forecast to increase by a further $5.4m, or an increase from $8.25 / kg sold to $8.37 / kg sold. In addition to the FCR and Premature Mortality %, the key factors influencing the cost of fish harvested on a $ / kg sold basis are as follows: Feed. Our feed costs are affected by feed recipes, global raw material commodity prices, FX rates, hedging cover and supply chain costs. We manage our total cost of feed by sourcing from various suppliers, monitoring movements in global prices, investigating potential recipe changes to either lower the cost or improve fish performance, and agreeing appropriate volume incentives with our suppliers. We have forecast the cost of feed, in New Zealand dollars per kg, to increase by approximately 1% in FY2017F with an underlying increase in feed cost partly offset by a change in mix of feed suppliers /
28 The price of feed, in New Zealand dollars per kg, is forecast to increase by 6% in FY2018F which aligns to the assumed increase in local currency feed costs. Aquaculture labour costs. Aquaculture labour costs have been forecast as follows: o o o For our existing seafarms - based on the FY2016 labour cost per kg harvested at our existing seafarms increased for wage inflation. For our new seafarms based on the total FY2016 labour cost for those seafarms, increased by 10% in FY2017F and by a further 30% in FY2018F to recognise incremental harvest volumes and growth in biomass at these sites. For our hatcheries based on the total labour cost across our three hatcheries (which has been relatively static for the past three years) with an allowance for inflation and increased cost to handle additional volumes. Aquaculture Overheads. Overheads include salaried and supervisory personnel, repairs and maintenance costs, insurance, net cleaning and diving team costs, and various other items. This cost has been assumed to increase by 6.6% in FY2017F and a further 3.0% in FY2018F to recognise increases in the size of our total seafarms as Kopāua is fully developed. Harvest and Processing Costs Harvest and processing costs are forecast to increase by 5.3% in FY2017F and by a further 9.0% in FY2018F due to additional volumes being harvested. On a dollar per kg harvested basis, total harvest and processing costs are forecast to reduce from $3.59 / kg in FY2016 to $3.50 / kg in FY2017F and to $3.46 / kg in FY2018F. The improvement in costs on a per kg basis reflects operational efficiencies associated with increased scale, and certain efficiency initiatives to automate processes that are currently manual. Freight and Other Costs Freight and other direct costs are forecast to increase by 15.1% in FY2017F and 13.1% in FY2018F. The largest component of these costs is domestic and international freight costs. Freight costs have been forecast by applying the FY2016 cost per kg rates of freighting product to our key sales markets against forecast sales volumes by market. Other costs Other costs largely comprise sales, marketing, advertising and promotion costs and corporate costs. Pro forma adjustments have been applied in the historical periods presented below to reflect pro forma adjustments 4, 5 and 12 described in Section B of this document. Other costs Pro forma operating NZD Millions FY2014 FY2015 FY2016 FY2017F FY2018F Sales and Advertising Distribution Corporate Sales and Advertising ($ / kg sold) Notes: 1. Pro forma corporate costs for the historical period have been increased for the assumed level of incremental costs of running a listed company ($0.7m) /
A N N U A L S H A R E H O L D E R S M E E T I N G N O V E M B E R
 A N N U A L S H A R E H O L D E R S M E E T I N G N O V E M B E R 2 0 1 7 AGENDA Welcome Chairman s review Managing Director s review Ordinary business and resolutions 2 CHAIRMAN S REVIEW Successful IPO
Annual Financial Results FOR THE YEAR ENDED 31 JULY 2018
 Annual Financial Results Contents Directors Statement 01 Income Statement 02 Statement of Comprehensive Income 03 Statement of Financial Position 04 Statement of Changes in Equity 05 Cash Flow Statement
INTERIM FINANCIAL REPORT
 INTERIM FINANCIAL REPORT FOR THE SIX MONTHS ENDED 31 DECEMBER 2017 CONTENTS DIRECTORS REPORT... 5 CORPORATE INFORMATION... 8 CONSOLIDATED STATEMENT OF COMPREHENSIVE INCOME...10 FOR THE SIX MONTHS ENDED
Tegel Group Holdings Limited
 Tegel Group Holdings Limited FY17 Interim Results Presentation 15 December 2016 TEGEL GROUP HOLDINGS LIMITED FY17 INTERIM RESULTS 1 Disclaimer This presentation contains summary information about Tegel
For personal use only
 PRELIMINARY FULL YEAR REPORT ANNOUNCEMENT The a2 Milk Company Limited For the year ended 30 June 2016 Preliminary full year (12 month) report on consolidated results (including the results for the previous
FISHER & PAYKEL HEALTHCARE CORPORATION LIMITED
 ASX Listing Rule 4.2A.3 FISHER & PAYKEL HEALTHCARE CORPORATION LIMITED ABN 098 026 281 Australian Stock Exchange Listing Rules Disclosure Preliminary Full Year Report For the year ended 31 March 2011 Contents
FINANCIAL STATEMENTS. As at 29 April 2018
 FINANCIAL STATEMENTS As at 29 April Directors Statement The Board of Directors are pleased to present the consolidated financial statements for Tegel Group Holdings Limited, and the auditors report, for
ANNUAL FINANCIAL RESULTS FOR THE YEAR ENDED 31 JULY 2017
 ANNUAL FINANCIAL RESULTS FOR THE YEAR ENDED 31 JULY 2017 CONTENTS DIRECTORS STATEMENT 1 INCOME STATEMENT 2 STATEMENT OF COMPREHENSIVE INCOME 3 STATEMENT OF FINANCIAL POSITION 4 STATEMENT OF CHANGES IN
Tegel Group Holdings Limited
 Tegel Group Holdings Limited FY17 Full Year Results Presentation 27 June 2017 1 TEGEL GROUP HOLDINGS FY17 RESULTS PRESENTATION Disclaimer This presentation contains summary information about Tegel Group
NEW ZE AL AND KING SALMON INVESTMENTS LIMITED FACT SHEET
 NEW ZE AL AND KING SALMON INVESTMENTS LIMITED FACT SHEET 31 AUGUST 2016 FACT SHEET This document is not a Product Disclosure Statement and does not constitute an offer of shares. New Zealand King Salmon
For personal use only
 31 ST MARCH AUDITORS REPORT INDEPENDENT AUDITORS REPORT TO THE SHAREHOLDERS OF TRILOGY INTERNATIONAL LIMITED Report on the Financial Statements We have audited the financial statements of Trilogy International
For personal use only
 Tegel Group Holdings Limited FY18 Interim Results Presentation 6 December 2017 1 TEGEL GROUP HOLDINGS FY18 INTERIM RESULTS PRESENTATION Disclaimer This presentation contains summary information about Tegel
Depreciation and amortisation expense (7,642) (8,323) (3,584) (4,013) Results from continuing operating activities (293,790) 42,438 (301,977) 26,050
 (8,323) (3,584) (4,013) Results from continuing operating activities (293,790) 42,438 (301,977) 26,050") Statement of Comprehensive Income For the year ended 30 June Continuing operations Operating revenue 4,5 1,131,847 1,336,813 583,062 763,990 Cost of sales (845,875) (1,038,146) (437,440) (611,423) Gross
Statement of Comprehensive Income For the year ended 30 June Continuing operations Operating revenue 4,5 1,131,847 1,336,813 583,062 763,990 Cost of sales (845,875) (1,038,146) (437,440) (611,423) Gross
Livestock Improvement Corporation Limited (LIC) ANNUAL REPORT. Year Ended 31 May 2014
 ANNUAL REPORT. Year Ended 31 May 2014") Livestock Improvement Corporation Limited (LIC) ANNUAL REPORT Year Ended 31 May 2014 Income Statement For the year ended 31 May 2014 In thousands of New Zealand dollars Note 2014 2013 2014 2013 Revenue
Livestock Improvement Corporation Limited (LIC) ANNUAL REPORT Year Ended 31 May 2014 Income Statement For the year ended 31 May 2014 In thousands of New Zealand dollars Note 2014 2013 2014 2013 Revenue
COMVITA LIMITED AND GROUP. Financial Statements. 31 March 2014
 COMVITA LIMITED AND GROUP Financial Statements 31 March 2014 Contents Directors Declaration 2 Income Statement 3 Statement of Comprehensive Income 4 Statement of Changes in Equity 5 6 Statement of Financial
FISHER & PAYKEL HEALTHCARE CORPORATION LIMITED. Results for announcement to the market. Earnings before interest and tax $112, %
 FISHER & PAYKEL HEALTHCARE CORPORATION LIMITED Results for announcement to the market Reporting Period 12 months to 31 March 2013 Previous Reporting Period 12 months to 31 March 2012 Amount (000s) Percentage
Amount $000's. Amount. Imputed amount Foreign tax credit per share. per share per share Dividend payable N/A. N/A N/A Special dividend payable
 Trustpower Limited Results for announcement to the market Reporting period 6 months to 30 September 2016 Previous reporting period 6 months to 30 September 2015 Amount $000's Percentage change Revenue
PAO TMK Unaudited Interim Condensed Consolidated Financial Statements Three-month period ended March 31, 2018
 Unaudited Interim Condensed Consolidated Financial Statements Unaudited Interim Condensed Consolidated Financial Statements Contents Report on Review of Interim Financial Information...3 Unaudited Interim
COMVITA LIMITED AND GROUP FINANCIAL STATEMENTS
 COMVITA LIMITED AND GROUP FINANCIAL STATEMENTS For the year ended 31 March 2015 Comvita Financial Statements 2015 - P2 CONTENTS P4 P5 P6 P7 P8 P9 P10 P52 P53 P58 DIRECTORS DECLARATION INCOME STATEMENT
QUAYSIDE HOLDINGS LIMITED AND SUBSIDIARIES
 QUAYSIDE HOLDINGS LIMITED AND SUBSIDIARIES ANNUAL FINANCIAL STATEMENTS For the year ended 30 JUNE 2015 CONTENTS PAGE Auditor s Report 1 Income Statement 4 Statement of Comprehensive Income 5 Statement
Inghams Group Limited. FY2018 Results Presentation
 Inghams Group Limited FY2018 Results Presentation 22 AUGUST 2018 Important notice and disclaimer Disclaimer The material in this presentation is general background information about the activities of Inghams
COMVITA LIMITED AND GROUP FINANCIAL STATEMENTS
 COMVITA LIMITED AND GROUP FINANCIAL STATEMENTS For the year ended 31 March 2015 Comvita Financial Statements 2015 - P2 CONTENTS P4 DIRECTORS DECLARATION P5 INCOME STATEMENT P6 STATEMENT OF COMPREHENSIVE
TPI Enterprises Limited ABN Preliminary final report for the year ended 31 December 2018
 ABN 26 107 872 453 Preliminary final report for the year ended Appendix 4E The following financial information is presented in accordance with ASX listing rule 4.3A. The financial information presented
Profit/(Loss) before income tax 112, ,323. Income tax benefit/(expense) 11 (31,173) (37,501)
 before income tax 112, ,323. Income tax benefit/(expense) 11 (31,173) (37,501)") Income statement For the year ended 31 July Note 2013 2012 Continuing operations Revenue 2,277,292 2,181,551 Cost of sales (1,653,991) (1,570,657) Gross profit 623,301 610,894 Other income 7 20,677 10,124
Income statement For the year ended 31 July Note 2013 2012 Continuing operations Revenue 2,277,292 2,181,551 Cost of sales (1,653,991) (1,570,657) Gross profit 623,301 610,894 Other income 7 20,677 10,124
Titon Holdings Plc Interim Statement
 Titon Holdings Plc 2006 Interim Statement Interim Financial Statements for the six months ended 31 March 2006 Contents 02 Chairman's Statement 03 Consolidated Interim Income Statement 04 Consolidated Interim
P/F Bakkafrost Condensed Consolidated Interim Report for Q and 9 months 2013
 P/F Bakkafrost Condensed Consolidated Interim Report for Q3 2013 and 9 months 2013 15000 10000 5000 0 Harvest volume - TGW Q3 12 Q4 12 Q1 13 Q2 13 Q3 13 Operational EBIT mdkk 200 150 100 50 0 Q3 12 Q4
Villa Organic AS fourth quarter 2012
 Notice to shareholders; Villa Organic AS fourth quarter 2012 Highlights fourth quarter 2012 The average prices were approximately at the same level as Q3, but improvement was observed towards the end of
COMVITA LIMITED AND GROUP FINANCIAL STATEMENTS
 COMVITA LIMITED AND GROUP FINANCIAL STATEMENTS For the 15 month s end ed 30 June 2016 CONTENTS 2 3 4 5 6 7 8 39 40 45 DIRECTORS DECLARATION INCOME STATEMENT STATEMENT OF COMPREHENSIVE INCOME STATEMENT
GROWING GLOBALLY ANNUAL FINANCIAL STATEMENTS
 GROWING GLOBALLY ANNUAL FINANCIAL STATEMENTS B thl Annual Financial Statements CONTENTS Notes to the consolidated financial statements (continued) 02 Directors statement 03 Consolidated income statement
SUPPLEMENTARY PROSPECTUS INGHAM S. Initial Public Offering of Ordinary Shares. Inghams Group Limited ACN Joint Global Co-ordinators
 Joint Global Co-ordinators Joint Lead Managers INGHAM S SUPPLEMENTARY PROSPECTUS Initial Public Offering of Ordinary Shares Inghams Group Limited ACN 162 709 506 Supplementary prospectus dated 2 November
Diverse Group Limited 2011 Special Edition
 Diverse Limited 2011 Special Edition Illustrative Financial Statements under NZ IFRS (Reduced Disclosure Regime) November 2012 kpmg.com/nz Diverse Limited financial statements 2 This publication has been
METHVEN LIMITED. Results for announcement to the market
 METHVEN LIMITED Results for announcement to the market Reporting Period 6 months ended 31 December 2016 Previous Reporting Period 9 months ended 31 December 2015 Amount (NZD 000s) Percentage change Sales
Comvita Financial Statements PI COMVITA LIMITED AND GROUP FINANCIAL STATEMENTS
 Comvita Financial Statements 2017 - PI COMVITA LIMITED AND GROUP FINANCIAL STATEMENTS FOR THE YEAR ENDED 30 JUNE 2017 Comvita Financial Statements 2017 - PII Comvita Financial Statements 2017 - P1 CONTENTS
HUON AQUACULTURE GROUP LIMITED
 HUON AQUACULTURE GROUP LIMITED RESULTS PRESENTATION FOR FIRST HALF FY2017 IMPORTANT NOTICE This presentation is provided by Huon Aquaculture Group Limited (ACN 114 456 781) to provide summary information
BASIC-FIT CONTINUES STRONG GROWTH WITH SOLID MARGINS
 BASIC-FIT CONTINUES STRONG GROWTH WITH SOLID MARGINS Club openings pipeline strengthens further; at least 100 club openings in 2018 H1 FINANCIAL HIGHLIGHTS Revenue increased by 22% to 190 million (H1 2017:
FINANCIAL STATEMENTS 2018
 FINANCIAL STATEMENTS 2018 CONTENTS 2 Auditor s Report 7 Directors Responsibility Statement 8 Statement of Comprehensive Income 9 Statement of Financial Position 10 Statement of Changes in Equity 11 Statement
The Warehouse Group Limited Financial Statements For the 52 week period ended 27 July 2014
 The Warehouse Limited Financial Statements Financial Statements The Warehouse Limited is a limited liability company incorporated and domiciled in New Zealand. The address of its registered office is Level
QANTM. Full Year Results Presentation. Leon Allen, Managing Director and CEO Martin Cleaver, Chief Financial Officer. 12 months to 30 June 2017
 Full Year Results Presentation 12 months to 30 June 2017 QANTM 30 AUGUST 2017 Leon Allen, Managing Director and CEO Martin Cleaver, Chief Financial Officer Disclaimer This presentation has been prepared
The Warehouse Group Limited Interim Financial Statements. For the 26 weeks ended 28 January 2018
 The Warehouse Group Limited Interim Financial Statements For the 26 weeks ended 28 January 2018 Consolidated Income Statement 26 Weeks 26 Weeks 52 Weeks Ended Ended Ended Note Continuing operations Retail
For personal use only
 ABN 89 112 188 815 Interim Financial Report EMECO HOLDINGS LIMITED INTERIM FINANCIAL REPORT FOR THE HALF YEAR ENDED 31 DECEMBER 2018 1 Contents Directors Report...3 Lead Auditor s Independence Declaration...7
QANTM. Full Year Results Presentation. Leon Allen, Managing Director and CEO Martin Cleaver, Chief Financial Officer. 12 months to 30 June 2018
 Full Year Results Presentation 12 months to 30 June 2018 QANTM 29 AUGUST 2018 Leon Allen, Managing Director and CEO Martin Cleaver, Chief Financial Officer Structure 1. 2018 Summary Features 2. Market
For the 52 weeks ended 2 May 2010
 36 Greene King plc Annual Report 2010 1 Accounting policies Corporate information The consolidated financial statements of Greene King plc for the 52 weeks ended 2 May 2010 were authorised for issue by
Financials. Mike Powell Group Chief Financial Officer
 Financials 98 Group income statement 99 Group statement of comprehensive income 99 Group statement of changes in equity 100 Group balance sheet 101 Group cash flow statement 102 Notes to the consolidated
Paul Maguire Philip Bennett Paul Witheridge Managing Director Chief Financial Officer Chief Financial Officer
 McPherson s Limited Results for the year to 30 June 2011 Paul Maguire Philip Bennett Paul Witheridge Managing Director Chief Financial Officer Chief Financial Officer McPherson s Limited McPherson s Limited
Bell Potter Emerging Leaders Conference
 Bell Potter Emerging Leaders Conference Sydney, 24 October 2017 Leon Allen, Managing Director and CEO Disclaimer This presentation has been prepared by QANTM Intellectual Property Limited ACN 612 441 326
Half-year Report. for the six months ended 31 December 2018
 Half-year Report for the six months ended 31 December 2018 Directory Directors Hilary Poole (Independent Director and Chair) Tony Falkenstein (Executive Director) Ian Malcolm (Non-Executive Director) Steve
A n n u a l f i n a n c i a l r e s u l t s
 A n n u a l f i n a n c i a l r e s u l t s DIRECTORS STATEMENT The directors of Air New Zealand Limited are pleased to present to shareholders the Annual Report* and financial statements for Air New
The following is enclosed for release to the market in relation to MVN s H1 FY19 results:
 28 February 2019 Client Market Services NZX Limited Level1, NZX Centre 11 Cable Street WELLINGTON 6011 Dear Sir/Madam Methven Limited (MVN) HY19 Results The following is enclosed for release to the market
Group Income Statement For the year ended 31 March 2015
 Income Statement For the year ended 31 March Note Pre exceptionals Restated Exceptionals (note 11) Pre exceptionals Exceptionals (note 11) Continuing operations Revenue 5 10,606,080 10,606,080 11,044,763
Unaudited Consolidated Statement Of Comprehensive Income For The Six Months To 31 October 2017 UNAUDITED 6 MONTHS
 Financial Statements For The Six Months To 31 October 2017 (Unaudited) The Interim Financial Statements presented are signed for and on behalf of the Board and were authorised for issue on the 20December
PAO TMK Unaudited Interim Condensed Consolidated Financial Statements Three-month period ended March 31, 2017
 Unaudited Interim Condensed Consolidated Financial Statements Unaudited Interim Condensed Consolidated Financial Statements Contents Report on Review of Interim Financial Information...3 Unaudited Interim
KEY FIGURES.3 MANAGEMENT DISCUSSION AND ANALYSIS OF THE RESULTS GROUP FINANCIAL HIGHLIGHTS BUSINESS UPDATE H
 1 Table of Contents 1. KEY FIGURES...3 2. MANAGEMENT DISCUSSION AND ANALYSIS OF THE RESULTS...4 2.1. GROUP FINANCIAL HIGHLIGHTS...4 2.2. BUSINESS UPDATE...4 3. OPERATING REVIEW PER SEGMENT...5 3.1. REVENUE
Directors Report to Shareholders For the 28 Weeks ended 14 September 2015 (1H 2016)
") Directors Report to Shareholders For the 28 Weeks ended 14 September 2015 (1H 2016) Key Points Total Group Sales ($m) 210.0 185.7 +24.3 +13.1 Group Net Profit after Tax ($m) 13.4 11.5 +1.9 +16.7 Dividend
Directors Report to Shareholders For the 28 Weeks ended 14 September 2015 (1H 2016) Key Points Total Group Sales ($m) 210.0 185.7 +24.3 +13.1 Group Net Profit after Tax ($m) 13.4 11.5 +1.9 +16.7 Dividend
Kathmandu Holdings Limited. FINANCIAL STATEMENTS 31 July 2018
 Kathmandu Holdings Limited FINANCIAL STATEMENTS 31 July 2018 Introduction and Table of Contents In this section The financial statements have been presented in a style which attempts to make them less
Aston Martin Holdings (UK) Limited. Interim financial report. for the period ended 30 June 2018
 Limited. Interim financial report. for the period ended 30 June 2018") Interim financial report for the period ended 30 June 2018 Interim financial report for the period ended 30 June 2018 Pages Business review and outlook 1 Financial review - income statement 2 Financial
Interim financial report for the period ended 30 June 2018 Interim financial report for the period ended 30 June 2018 Pages Business review and outlook 1 Financial review - income statement 2 Financial
NESTLÉ HOLDINGS, INC. (A Wholly Owned Subsidiary of Nestlé S.A.) AND SUBSIDIARIES. Half-yearly Financial Report. (unaudited) June 30, 2011
 AND SUBSIDIARIES. Half-yearly Financial Report. (unaudited) June 30, 2011") N Half-yearly Financial Report (unaudited) June 30, 2011 N Contents Management Report 2 Responsibility Statement 5 Consolidated Interim Financial Statements Consolidated Income Statement 6 Consolidated
N Half-yearly Financial Report (unaudited) June 30, 2011 N Contents Management Report 2 Responsibility Statement 5 Consolidated Interim Financial Statements Consolidated Income Statement 6 Consolidated
FINANCIAL STATEMENTS. Contents Primary statements. Notes to the financial statements A Basis of preparation
 FINANCIAL STATEMENTS Contents Primary statements Consolidated income statement Consolidated statement of comprehensive income Consolidated balance sheet Consolidated statement of changes in equity Consolidated
SalMar ASA First quarter
 SalMar ASA First quarter 2009 1 STRONG SALMON PRICES AND SATISFACTORY EARNINGS Strong salmon prices contributed to satisfactory earnings for the SalMar Group in the first quarter 2009. While Scottish Sea
PRESENTATION Q Oslo, 19 February 2013 John Binde, CEO Ola Loe, CFO
 PRESENTATION Q4 2012 Oslo, 19 February 2013 John Binde, CEO Ola Loe, CFO AGENDA: Highlights for the period Segment information Group financials Outlook 2 Highlights in Q4 2012: Significant improvement
Fiona is happy to do this slide
 Fiona is happy to do this slide DISCLAIMER This presentation contains not only a review of operations, but also some forward looking statements about Sanford Limited and the environment in which the company
2017 Full Year Results. Tuesday 21 November 2017
 2017 Full Year Results Tuesday 21 November 2017 Disclaimer Certain information included in the following presentation is forward looking and involves risks, assumptions and uncertainties that could cause
TOURISM HOLDINGS LTD FY16 INTERIM RESULTS PRESENTATION. 23 February 2016
 TOURISM HOLDINGS LTD FY16 INTERIM RESULTS PRESENTATION 23 February 2016 $M H1 FY16 Highlights Revenue $134M up 20% Earnings before interest and tax* $15.0M up 42% Net profit after tax $8.2M up 45% H1 EBIT
For personal use only
 PRELIMINARY FINAL REPORT RULE 4.3A APPENDIX 4E APN News & Media Limited ABN 95 008 637 643 Preliminary final report Full year ended 31 December Results for Announcement to the Market As reported Revenue
1H18 Results Presentation Sid Takla Interim Chief Executive Officer Lyndal York Chief Financial Officer
 1H18 Results Presentation Sid Takla Interim Chief Executive Officer Lyndal York Chief Financial Officer 21 August 2018 Important Notice and Disclaimer This presentation has been prepared by Asaleo Care
Leveraging Our Strengths
 Leveraging Our Strengths First Quarterly Report for the Three Months Ended March 31, 2016 Management s Discussion and Analysis of Financial Conditions and Results of Operations For the three months ended
Interim Report. For the three and nine months ended 30 September Ardagh Packaging Holdings Limited
 Interim Report For the three and nine months ended 30 September TABLE OF CONTENTS Selected financial information... 2 Operating and financial review... 3 Page UNAUDITED CONDENSED CONSOLIDATED INTERIM FINANCIAL
Annual Report 2018 Financials
 34 Annual Report Financials Annual Report 35 FINANCIAL COMMENTARY CONSTANT CURRENCY ANALYSIS A constant currency income statement is prepared each month to enable the Board and management to monitor and
AUSTRALIA AND NEW ZEALAND BANKING GROUP LIMITED - ANZ NEW ZEALAND REGISTERED BANK DISCLOSURE STATEMENT
 AUSTRALIA AND NEW ZEALAND BANKING GROUP LIMITED - ANZ NEW ZEALAND REGISTERED BANK DISCLOSURE STATEMENT FOR THE YEAR ENDED 30 SEPTEMBER 2017 NUMBER 36 ISSUED NOVEMBER 2017 Australia and New Zealand Banking
Updates to External Reporting. Investor and Analyst Briefing: December 2018
 Updates to External Reporting Investor and Analyst Briefing: December 2018 Summary As outlined at Spark s results announcement the presentation of Spark s financial results will change from FY19 onwards
Evolve Education Group Limited. Consoltdated Financial Statements. For the Year Ended 31 March 2018
 evolve e d u c at io n gro u p Evolve Education Group Limited Consoltdated Financial Statements For the Year Ended 31 March 2018 The Directors present the Consolidated Financial Statements of Evolve Education
Appendix 4E. Preliminary final report Current Reporting Period: 52 weeks ended 28 July 2018 Previous Corresponding Period: 52 weeks ended 29 July 2017
 Appendix 4E (rule 4.3A) Preliminary final report 52 weeks ended on 28 July Appendix 4E Preliminary final report Current Reporting Period: 52 weeks ended 28 July Previous Corresponding Period: 52 weeks
ANZ BANK NEW ZEALAND LIMITED ANNUAL REPORT AND REGISTERED BANK DISCLOSURE STATEMENT
 ANZ BANK NEW ZEALAND LIMITED ANNUAL REPORT AND REGISTERED BANK DISCLOSURE STATEMENT FOR THE YEAR ENDED 30 SEPTEMBER 2017 NUMBER 87 ISSUED NOVEMBER 2017 ANZ Bank New Zealand Limited ANNUAL REPORT AND REGISTERED
Australia and New Zealand Banking Group Limited
 Australia and New Zealand Banking Group Limited ABN 11 005 357 522 31 March 2017 Consolidated Financial Report Dividend Announcement and Appendix 4D The Consolidated Financial Report and Dividend Announcement
Half-Year Financial Report
 Financial Year -2012 Half-Year Financial Report A. HALF-YEAR MANAGEMENT REPORT B. CONDENSED CONSOLIDATED FINANCIAL STATEMENTS C. REPORT FROM THE STATUTORY AUDITORS D. CERTIFICATE OF THE PERSON RESPONSIBLE
Appendix 1 (NZAX Listing Rule ) Half year preliminary announcement. Results for announcement to the market. Solution Dynamics Limited ("SDL")
 Half year preliminary announcement. Results for announcement to the market. Solution Dynamics Limited (SDL)") Appendix 1 (NZAX Listing Rule 10.4.1) Half year preliminary announcement Results for announcement to the market Basis of report Unaudited Reporting period 6 months to 31 December 2017 Previous reporting
Appendix 1 (NZAX Listing Rule 10.4.1) Half year preliminary announcement Results for announcement to the market Basis of report Unaudited Reporting period 6 months to 31 December 2017 Previous reporting
Profit Announcement. For the six months ended 31 March 2007
 Profit Announcement For the six months ended 3 March 2007 Incorporating the requirements of Appendix 4D This interim profit announcement has been prepared for distribution in the United States of America
Backing Precision. Audit Tax Advisory.
 Backing Precision ILLUSTRATIVE FINANCIAL STATEMENTS YEAR ENDED 31 DECEMBER 2015 New Zealand Equivalents to International Financial Reporting Standards Tier 1 For-Profit Reporters Audit Tax Advisory www.bdo.co.nz
PREMIUM BRANDS INCOME FUND. First Quarter 2007
 PREMIUM BRANDS INCOME FUND Management s Discussion and Analysis First Quarter 2007 OVERVIEW Premium Brands owns a broad range of leading branded specialty food businesses with manufacturing and distribution
Interim Report. January September 2013
 Interim Report January September 2013 Disclaimer Albain Bidco Norway AS is providing the following financial results for the third quarter of 2013 to holders of its EUR225,000,000 6.750% Senior Secured
ANNUAL REPORT HUSCOMPAGNIET A/S HUSCOMPAGNIET
 2017 ANNUAL REPORT HUSCOMPAGNIET A/S HUSCOMPAGNIET Consolidated key figures DKK'm Income statement Revenue Gross profit Operating profit before depreciation and amortisation
2. Reconciliation between Japanese GAAP and IFRS
 2. Reconciliation between Japanese GAAP and IFRS Reconciliation of assets, liabilities, and equity as of March 31, 2016 and 2017, and reconciliation of net profit for the fiscal years ended March 31, 2016
Directors Report 3. Income Statements 4. Statements of Changes in Equity 5. Balance Sheets 6. Statements of Cash Flows 7-8
 Rakon Limited Annual Report 2009 Table of Contents Directors Report 3 Income Statements 4 Statements of Changes in Equity 5 Balance Sheets 6 Statements of Cash Flows 7-8 Notes to Financial Statements
Income Statements...39 Statements of Recognised Income and Expense...40 Balance Sheets...41 Statements of Cash Flows...42
 38 GWA INTERNATIONAL LIMITED 2007 ANNUAL REPORT CONTENTS Income Statements...39 Statements of Recognised Income and Expense...40 Balance Sheets...41 Statements of Cash Flows...42 Note 1 Significant accounting
PAO SIBUR Holding. International Financial Reporting Standards Consolidated Financial Statements and Independent Auditor s Report.
 PAO SIBUR Holding International Financial Reporting Standards Consolidated Financial Statements and Independent Auditor s Report 31 December 2017 Table of Contents Independent Auditor s Report IFRS Consolidated
QANTM. Half Year Results Presentation. Leon Allen, Managing Director and CEO Martin Cleaver, Chief Financial Officer. Six months to 31 December 2017
 Half Year Results Presentation Six months to 31 December 2017 QANTM 22 FEBRUARY 2018 Leon Allen, Managing Director and CEO Martin Cleaver, Chief Financial Officer Disclaimer This presentation has been
Livestock Improvement Corporation Limited (LIC) ANNUAL REPORT. Year Ended 31 May 2017
 ANNUAL REPORT. Year Ended 31 May 2017") Livestock Improvement Corporation Limited (LIC) ANNUAL REPORT Year Ended 31 May 2017 Income Statement For the year ended 31 May 2017 Consolidated In thousands of New Zealand dollars Note 2017 2016 Revenue
Livestock Improvement Corporation Limited (LIC) ANNUAL REPORT Year Ended 31 May 2017 Income Statement For the year ended 31 May 2017 Consolidated In thousands of New Zealand dollars Note 2017 2016 Revenue
Financial Statements. Notes to the financial statements A Basis of preparation
 Financial Statements Contents Primary statements Consolidated income statement Consolidated statement of comprehensive income Consolidated balance sheet Consolidated statement of changes in equity Consolidated
Vista Group International Limited
 30 June 2015 Table of Contents Vista Group International Commentary... 2 Interim statement of comprehensive income... 4 Interim statement of changes in equity... 5 Interim statement of financial position...
l 2018 l 1. Airbus SE IFRS Consolidated Financial Statements 2. Notes to the IFRS Consolidated Financial Statements
 Financial Statements l 2018 l 1. Airbus SE IFRS Consolidated Financial Statements 2. Notes to the IFRS Consolidated Financial Statements 3. Airbus SE IFRS Company Financial Statements 4. Notes to the IFRS
QUARTERLY REPORT FOR THE THREE MONTHS AND NINE MONTHS ENDED 30 SEPTEMBER 2014 (unaudited) HYVA GLOBAL B.V. (the Issuer )
 HYVA GLOBAL B.V. (the Issuer )") QUARTERLY REPORT FOR THE THREE MONTHS AND NINE MONTHS ENDED 30 SEPTEMBER 2014 HYVA GLOBAL B.V. (the Issuer ) 28 November 2014 Introduction On 24 March 2011, Hyva Global B.V. (the Issuer or the Company
QUARTERLY REPORT FOR THE THREE MONTHS AND NINE MONTHS ENDED 30 SEPTEMBER 2014 HYVA GLOBAL B.V. (the Issuer ) 28 November 2014 Introduction On 24 March 2011, Hyva Global B.V. (the Issuer or the Company
against last (Effective tax rate)
") CONDENSED CONSOLIDATED INCOME STATEMENTS FOR THE PERIOD ENDED 30.6.2018 (UNAUDITED) Table 1: Financial review for current quarter and financial year to date INDIVIDUAL QUARTER CUMULATIVE QUARTERS CURRENT
CONDENSED CONSOLIDATED INCOME STATEMENTS FOR THE PERIOD ENDED 30.6.2018 (UNAUDITED) Table 1: Financial review for current quarter and financial year to date INDIVIDUAL QUARTER CUMULATIVE QUARTERS CURRENT
Investor Presentation
 NZX Code: ATM ASX Code: A2M 3 May 2017 NZX/ASX Market Release Investor Presentation Please find attached a presentation to be given today by The a2 Milk Company Limited at Macquarie s annual Australia
INDEX TO THE CONSOLIDATED FINANCIAL STATEMENTS
 INDEX TO THE CONSOLIDATED FINANCIAL STATEMENTS Consolidated Interim Income Statement for the three months ended March 31, 2018 and 2017 2 Consolidated Interim Statement of Comprehensive Income for the
Review report and consolidated interim financial information For the nine months period ended 30 September 2014
 INTERNATIONAL FISH FARMING HOLDING COMPANY (PJSC) - ASMAK Review report and consolidated interim financial information For the nine months period ended 2014 INTERNATIONAL FISH FARMING HOLDING COMPANY (PJSC)
For personal use only
 ASX & Media Release 30 April 2015 MARCH QUARTER CASH FLOW REPORT AND BUSINESS UPDATE YEAR TO DATE SALES DOUBLE Clean Seas Tuna Limited (ASX: CSS) is pleased to report that sales momentum is continuing
Financial report Q3 2014
 Financial report Q3 2014 Austevoll Seafood ASA Financial report Q3 2014 Index Key figures for the Group... 03 Q3 2014... 04 Operating segments... 04 Cash flows... 05 Financial information as of 30 September
ACERINOX, S.A. AND SUBSIDIARIES. 31 December 2015
 ACERINOX, S.A. AND SUBSIDIARIES Annual Accounts of the Consolidated Group 31 December 2015 (Free translation from the original in Spanish. In the event of discrepancy, the Spanishlanguage version prevails.)
2018 Full Year Results 20 November 2018
 2018 Full Year Results 20 November 2018 Disclaimer Certain information included in the following presentation is forward looking and involves risks, assumptions and uncertainties that could cause actual
Central Plains Water Limited Annual Report For the year ended 30 June 2016
 CENTRAL PLAINS WATER Central Plains Water Limited Annual Report Central Plains Water Ltd, Unit 1B, 2 Barry Hogan Place, Christchurch PO Box 9424, Tower Junction Ph (03) 982 4267 Contents Page Chairman
Clean Seas Sustainable Seafood
 Clean Seas Sustainable Seafood September 2013 Investor Update September 2013 ASX: CSS IMPORTANT INFORMATION This presentation contains general information in summary form which is current as at 26 May,