ACERINOX, S.A. AND SUBSIDIARIES. 31 December 2015
|
|
|
- Bertina Richardson
- 5 years ago
- Views:
Transcription
1

2
3
4 ACERINOX, S.A. AND SUBSIDIARIES Annual Accounts of the Consolidated Group 31 December 2015 (Free translation from the original in Spanish. In the event of discrepancy, the Spanishlanguage version prevails.) Acerinox Group Page 1 of
5 (Free translation from the original in Spanish. In the event of discrepancy, the Spanish-language version prevails.) CONSOLIDATED ANNUAL ACCOUNTS CONSOLIDATED FINANCIAL STATEMENTS 1. CONSOLIDATED BALANCE SHEETS (In thousands of Euros at 31 December 2015 and 2014) ASSETS Note Non-current assets Goodwill 7 69,124 69,124 Other intangible assets 7 11,181 9,311 Property, plant and equipment 8 2,025,856 1,971,519 Available-for-sale financial assets 9 10,667 8,401 Deferred tax assets , ,130 Other non-current financial assets 11,811 6,032 TOTAL NON-CURRENT ASSETS 2,317,530 2,256,517 Current assets Inventories , ,698 Trade and other receivables 9 470, ,091 Other current financial assets 9 15,497 84,576 Current tax assets 17 17,394 18,390 Cash and cash equivalents , ,368 TOTAL CURRENT ASSETS 1,808,142 2,159,123 TOTAL ASSETS 4,125,672 4,415,640 Notes 1 to 20 form an integral part of the consolidated annual accounts. Acerinox Group Page 2 of
6 (In thousands of Euros at 31 December 2015 and 2014) EQUITY AND LIABILITIES Note Equity Subscribed capital 12 66,677 65,426 Share premium 12 81,403 81,403 Reserves 12 1,525,178 1,431,935 Profit for the period 12 42, ,329 Translation differences ,879 18,048 Parent shares EQUITY ATTRIBUTABLE TO SHAREHOLDERS OF THE PARENT 1,929,027 1,733,141 Non-controlling interests 12 94, ,552 TOTAL EQUITY 2,023,304 1,845,693 Non-current liabilities Deferred income 13 7,513 6,430 Issue of bonds and other marketable securities 9 123, ,050 Loans and borrowings 9 617, ,958 Non-current provisions 14 13,698 13,706 Deferred tax liabilities , ,285 Other non-current financial liabilities 9 6,054 22,758 TOTAL NON-CURRENT LIABILITIES 995,593 1,276,187 Current liabilities Issue of bonds and other marketable securities 9 1,653 Loans and borrowings 9 447, ,079 Trade and other payables 9 641, ,596 Current tax liabilities 17 1,092 35,997 Other current financial liabilities 9 14,417 8,088 TOTAL CURRENT LIABILITIES 1,106,775 1,293,760 TOTAL EQUITY AND LIABILITIES 4,125,672 4,415,640 Notes 1 to 20 form an integral part of the consolidated annual accounts. Acerinox Group Page 3 of
7 (Free translation from the original in Spanish. In the event of discrepancy, the Spanish-language version prevails.) 2. CONSOLIDATED INCOME STATEMENTS (Expressed in thousands of Euros) Note Revenues 15 4,221,426 4,380,289 Other operating income 15 13,017 17,285 Self-constructed non-current assets 15 18,888 15,993 Changes in inventories of finished goods and work in progress -19,783 38,203 Supplies -3,000,348-3,102,614 Personnel expenses , ,164 Amortisation and depreciation 7,8-163, ,345 Other operating expenses , ,960 RESULTS FROM OPERATING ACTIVITIES 120, ,687 Finance income 16 4,292 5,301 Finance costs 16-51,175-61,802 Exchange losses 16 62,400-63,988 Fair value measurement of financial instruments 16-59,509 66,577 Share of profit of equity-accounted investees 1 PROFIT FROM ORDINARY ACTIVITIES 76, ,776 Income tax Other taxes , ,311-4,989-2,778 PROFIT FOR THE PERIOD 26, ,687 Attributable to: NON-CONTROLLING INTERESTS -16,573-13,642 NET PROFIT ATTRIBUTABLE TO THE GROUP 42, ,329 Basic and distributed earnings per share (in Euros) Notes 1 to 20 form an integral part of the consolidated annual accounts. Acerinox Group Page 4 of
8 (Free translation from the original in Spanish. In the event of discrepancy, the Spanish-language version prevails.) 3. CONSOLIDATED STATEMENTS OF COMPREHENSIVE INCOME (Expressed in thousands of Euros) Note 2,015 2,014 A) PROFIT FOR THE YEAR 26, ,687 INCOME AND EXPENSE RECOGNISED DIRECTLY IN EQUITY I. Measurement of financial instruments 1. Available-for-sale financial assets , Other income/expense II. Cash flow hedges ,323 26,236 III. Translation differences , ,779 IV. Actuarial gains and losses and other adjustments ,685 V. Tax effect -4,426-7,902 B) TOTAL INCOME AND EXPENSE RECOGNISED DIRECTLY IN EQUITY 206, ,683 AMOUNTS TRANSFERRED TO THE INCOME STATEMENT I. Measurement of assets and liabilities 1. Measurement of financial instruments 2. Other income/expense II. Cash flow hedges ,412-22,770 III. Translation differences IV. Actuarial gains and losses and other adjustments V. Tax effect 2,161 6,905 C) TOTAL AMOUNTS TRANSFERRED TO THE INCOME STATEMENT -6,251-15,865 TOTAL COMPREHENSIVE INCOME 226, ,505 a) Attributable to the Parent 244, ,992 b) Attributable to non-controlling interests -17,986-3,487 Notes 1 to 20 form an integral part of the consolidated annual accounts. Acerinox Group Page 5 of
9 4. CONSOLIDATED STATEMENTS OF CHANGES IN EQUITY (Free translation from the original in Spanish. In the event of discrepancy, the Spanish-language version prevails.) (Expressed in thousands of Euros) Subscribed capital Share premium Retained earnings (including profit for the year) Property, plant and equipment revaluation reserves Notes 1 to 20 form an integral part of the consolidated annual accounts. Equity attributable to shareholders of the Parent Cash flow hedge reserves Available-forsale asset fair value reserve Actuarial valuation reserves Translation differences Notes Equity at 31/12/ Adjustments to correct errors Adjusted equity at 31/12/ Profit for Measurement of available-for-sale assets (net of tax) Cash flow hedges (net of tax) Actuarial valuation of employee benefit commitments Translation differences Income and expense recognised in equity Total comprehensive income Capital increase Distribution of dividends Transactions with shareholders Acquisition of own shares Disposal of own shares Acquisition of non-controlling shares from noncontrolling interests Other movements Equity at 31/12/ Profit for Measurement of available-for-sale assets (net of tax) Cash flow hedges (net of tax) Valoriación actuarial compromisos Translation differences Income and expense recognised in equity Total comprehensive income Capital increase (scrip dividend) Distribution of dividends (scrip dividend) Transactions with shareholders Acquisition of own shares Disposal of own shares Acquisition of non-controlling shares from noncontrolling interests Other movements Equity at 31/12/ Interim dividend Own shares TOTAL Noncontrolling interests TOTAL EQUITY Acerinox Group Page 6 of
10 5. CONSOLIDATED STATEMENTS OF CASH FLOWS (Free translation from the original in Spanish. In the event of discrepancy, the Spanish-language version prevails.) (Expressed in thousands of Euros) CASH FLOWS FROM OPERATING ACTIVITIES Profit before tax 76, ,776 Adjustments for: Amortisation and depreciation 7 and 8 163, ,345 Impairment 3,705-4,555 Change in provisions -1,373 1,909 Grants recognised in the income statement 13-2, Gains/losses on disposal of fixed assets ,747 Change in fair value of financial instruments 36,733-37,974 Finance income 16-4,292-5,191 Finance costs 16 51,175 61,802 Other income and expense -36,520 62,664 Changes in working capital: Increase/decrease in trade and other receivables 155,849-4,048 Increase/decrease in inventories 48,753-82,630 Increase/decrease in trade and other payables -334, ,740 Other cash flows from operating activities Interest paid -49,452-62,018 Interest received 3,869 5,191 Income tax paid -94, ,392 NET CASH FROM OPERATING ACTIVITIES 17,424 49,885 Notes CASH FLOWS FROM INVESTING ACTIVITIES Acquisition of property, plant and equipment -68,863-77,894 Acquisition of intangible assets -1, Acquisition of non-controlling shares from non-controlling interests 5-1,022-1,094 Acquisition of other financial assets ,294 Proceeds from sale of property, plant and equipment 1,338 3,720 Proceeds from sale of intangible assets 2 Proceeds from sale of other financial assets 2, Dividends received Other amounts received/paid for investments NET CASH USED IN INVESTING ACTIVITIES -67,583-77,276 CASH FLOWS FROM FINANCING ACTIVITIES Issue of own equity instruments Acquisition of own shares Disposal of own shares External financing received 157, ,600 Repayment of interest-bearing liabilities -334, ,363 Dividends paid 12-47,836-56,135 Distribution of share premium Contribution from non-controlling shareholders NET CASH FROM/USED IN FINANCING ACTIVITIES -225,284 95,042 NET INCREASE/DECREASE IN CASH AND CASH EQUIVALENTS -275,443 67,651 Cash and cash equivalents at beginning of year , ,602 Effect of exchange rate fluctuations 17,030 41,115 CASH AND CASH EQUIVALENTS AT YEAR END , ,368 Acerinox Group Page 7 of
11 Notes 1 to 20 form an integral part of the consolidated annual accounts. CONTENTS: NOTES TO THE CONSOLIDATED ANNUAL ACCOUNTS NOTE 1 GENERAL INFORMATION 9 NOTE 2 ACCOUNTING POLICIES 9 NOTE 3 ACCOUNTING ESTIMATES AND JUDGEMENTS 23 NOTE 4 FINANCIAL RISK MANAGEMENT 24 NOTE 5 SCOPE OF CONSOLIDATION 31 NOTE 6 SEGMENT REPORTING 36 NOTE 7 INTANGIBLE ASSETS 39 NOTE 8 PROPERTY, PLANT AND EQUIPMENT 44 NOTE 9 FINANCIAL INSTRUMENTS 50 NOTE 10 INVENTORIES 61 NOTE 11 CASH AND CASH EQUIVALENTS 62 NOTE 12 EQUITY 62 NOTE 13 DEFERRED INCOME 68 NOTE 14 PROVISIONS AND CONTINGENCIES 68 NOTE 15 INCOME AND EXPENSES 70 NOTE 16 NET FINANCE COST 72 NOTE 17 TAXATION 73 NOTE 18 RELATED PARTY BALANCES AND TRANSACTIONS 81 NOTE 19 AUDIT FEES 83 NOTE 20 EVENTS AFTER THE REPORTING PERIOD 84 Acerinox Group Page 8 of
12 6. NOTES TO THE CONSOLIDATED ANNUAL ACCOUNTS (Free translation from the original in Spanish. In the event of discrepancy, the Spanish-language version prevails.) NOTE 1 GENERAL INFORMATION Parent: Acerinox, S.A. (hereinafter the Company). Incorporation: Acerinox, S.A. was incorporated with limited liability under Spanish law on 30 September Registered office: Calle Santiago de Compostela, 100, Madrid, Spain. Statutory and principal activity: the Company s statutory activity, as described in its articles of association, is the manufacture and sale of stainless steel products and other similar or derivative products, either directly or indirectly through shareholdings in companies with the same or similar statutory activities. The Group s principal activity, conducted through its subsidiaries, is the manufacture, transformation and marketing of stainless steel products. The Acerinox Group is one of the main steel manufacturers in the world. It has six stainless steel factories: two manufacturing flat products in Spain and South Africa; one producing flat and long steel in the United States; a further two making long steel products in Spain; and another in Malaysia that makes flat steel and currently has cold rolling production lines. The Group also has a network of sales subsidiaries in Spain and abroad that sell all its products as their main activity. Details of all the companies included in the Acerinox consolidated Group are provided in note 5, as well as the activities they carry out. The Parent's principal activity is that of a holding company, as parent of the Acerinox Group. The Company also renders legal, accounting and advisory services to all the Group companies and carries out financing activities within the Group. Financial year: the financial year of Acerinox, S.A. and all the Group companies is the twelve-month period from 1 January to 31 December. Annual accounts: these consolidated annual accounts were authorised for issue by the board of directors of Acerinox, S.A. on 29 February NOTE 2 ACCOUNTING POLICIES 2.1 Statement of compliance The consolidated annual accounts of the Group have been prepared in accordance with International Financial Reporting Standards (IFRS) and interpretations (IFRIC) as adopted by the European Union (hereinafter IFRS-EU) and other applicable provisions in the financial reporting framework. The annual accounts for 2015 have been prepared using the same accounting principles (IFRS-EU) as for 2014, except for the standards and amendments adopted by the European Union mentioned below, which are obligatory as of 1 January 2015, and which have not had a significant impact on the Group. The standards taking effect from 1 January 2015 are the following: IFRIC 21 Levies. Effective for annual periods beginning on or after 1 January However, effective for periods beginning on or after 17 June 2014 in the EU. This interpretation has no impact on these financial statements. The following are standards or interpretations already adopted or pending adoption by the European Union that will be obligatory in the coming years and are expected to have a greater impact on the Group: IFRS 9 - Financial Instruments. This standard will be applicable for years commencing on or after 1 January Pending adoption by the European Union. This standard reduces the number of financial instrument categories to two: amortised cost and fair value. This standard also stipulates that debt instruments may only be classified as at amortised cost when they are payments of principal and interest, so all other debt should be recognised at fair value. The Group will need to adapt the classification of its financial instruments as a result. Changes in the value of available-for- Acerinox Group Page 9 of
13 sale financial assets are to be recognised as changes in equity, and not transferred to profit or loss, even if the assets are impaired. The standard also proposes significant changes in terms of aligning hedge accounting and risk management, defining a target-based approach and eliminating inconsistencies and shortfalls in the existing model. Some aspects of the measurement of equity instruments have also been modified. The Group is assessing the impact of this standard, although it is not expected to have a significant impact on the Group s assets and liabilities. IFRS 15 - Revenue from Contracts with Customers. Effective for periods beginning on or after 1 January Pending adoption by the EU. The Group is assessing the impact of this standard, although it is not expected to have a significant impact on the Group s assets and liabilities. IFRS 16 Leases. The main impact of this standard is that a lease contract is considered as a right to use the asset identified in the contract, thus it should be recognised as an asset and the debt for future payments as a liability. Effective for periods beginning on or after 1 January The Group is assessing the impact of this standard, which is not expected to be significant. Pending adoption by the EU. No disclosures or accounting principles have been applied in advance. 2.2 Basis of presentation of the consolidated annual accounts The accompanying consolidated annual accounts have been prepared by the directors of the Parent to present fairly the Group s consolidated equity and consolidated balance sheet at 31 December 2015 and 2014, as well as the consolidated results of its operations and changes in consolidated equity and consolidated cash flows for the years then ended. The 2015 annual accounts include comparative figures for the prior year. The consolidated annual accounts are presented in Euros rounded off to the nearest thousand. They are prepared on the historical cost basis, except for derivative financial instruments and available-for-sale financial assets, which have been measured at fair value. Inventories have been measured at the lower of cost or net realisable value. The preparation of the consolidated annual accounts under IFRS-EU requires the Parent s management to make judgements, estimates and assumptions that affect the application of accounting policies and, therefore, the amounts reported in the consolidated balance sheet and the consolidated income statement. These estimates are based on past experience and other factors considered appropriate. The Group may amend these estimates in light of subsequent events or changes in circumstances. The aspects that involve a greater degree of judgement in the application of IFRS-EU or for which the estimates made are significant for the preparation of the consolidated annual accounts are detailed in note 3. Qualitative and quantitative details of the risks assumed by the Group which could have an effect on future years are provided in note 4. The accompanying consolidated annual accounts have been prepared on the basis of the individual accounting records of the Company and the subsidiaries forming the Acerinox Group. The consolidated annual accounts include certain adjustments and reclassifications made to bring the accounting and presentation policies used by different Group companies into line with those of the Company. The consolidated annual accounts for 2014 were approved by the shareholders at their annual general meeting held on 3 June The Group s consolidated annual accounts for 2015 are currently pending approval by the shareholders. The directors of the Company consider that these consolidated annual accounts will be approved with no changes by the shareholders at their annual general meeting. 2.3 Going concern assumption and accruals basis The consolidated annual accounts have been prepared on a going concern basis. Income and expenses are recognised on an accruals basis, irrespective of collections and payments. Acerinox Group Page 10 of
14 2.4 Consolidation principles a) Subsidiaries Subsidiaries are entities over which the Company either directly or indirectly exercises control. The Company exercises control over a subsidiary when it is exposed, or has rights, to variable returns and has the ability to affect those returns through its power over the subsidiary. Furthermore, the Company is understood to have power over a subsidiary when it has existing substantive voting rights that give it the ability to direct the financial and operating activities and policies of the subsidiary. The financial statements of subsidiaries are included in the consolidated annual accounts from the date on which control commences to the date on which control ceases. The Group has considered potential voting rights in assessing its level of control over Group companies. The subsidiaries accounting policies have been adapted to Group accounting policies. The Acerinox Group s consolidated subsidiaries at 31 December 2015 and 2014 are listed in note 5. b) Non-controlling interests Non-controlling interests are shareholders that exercise no control over the Company. They represent the portion of the Group's profit or loss and net assets attributed to non-controlling interests. The portion of the Group's net assets attributed to non-controlling interests are disclosed in consolidated equity separately from that attributable to the shareholders of the Parent. Non-controlling interests share in consolidated profit or loss for the year and in consolidated total comprehensive income for the year are also disclosed separately in the consolidated income statement and in the consolidated statement of comprehensive income. Non-controlling interests in the subsidiaries acquired are recognised at the acquisition date at the proportional part of the fair value of the identifiable net assets. Profit and loss and each component of other comprehensive income are allocated to equity attributable to shareholders of the Parent and to non-controlling interests in proportion to their investment, even if this results in the non-controlling interests having a deficit balance. Agreements entered into between the Group and noncontrolling interests are recognised as a separate transaction. c) Business combinations The Group applies the acquisition method for business combinations. No business combinations took place in 2015 or d) Associates Associates are entities over which the Group has significant influence in financial and operating decisions, but not control or joint control. The financial statements of associates are included in the consolidated annual accounts using the equity method. The Group s share of the profit or loss of an associate from the date of acquisition is recognised with a credit or debit to share in profit/loss for the year of equity-accounted investees in the consolidated income statement. Losses of an associate attributable to the Group are limited to the value of its net investment, as the Group has not acquired any legal or constructive obligations. The Group has no significant investments in associates. Acerinox Group Page 11 of
15 e) Balances and transactions eliminated on consolidation Balances and transactions between Group companies and the resulting unrealised gains or losses with third parties are eliminated on consolidation. 2.5 Translation differences i) Functional and presentation currency The annual accounts of each Group company are expressed in the currency of the underlying economic environment in which the entity operates (functional currency). The figures disclosed in the consolidated annual accounts are expressed in thousands of Euros, the Parent s functional and presentation currency. ii) Foreign currency transactions, balances and cash flows Transactions in foreign currencies are translated using the foreign exchange rate prevailing at the date of the transaction. Monetary assets and liabilities denominated in foreign currencies at the reporting date are translated at the closing exchange rate prevailing at that date. Any exchange differences that may arise from translation are recognised in profit or loss. Non-monetary assets and liabilities denominated in foreign currencies and recorded at historical cost are translated to the functional currency using the exchange rate prevailing at the date of the transaction. Non-monetary assets and liabilities denominated in foreign currencies that are measured at fair value are translated to the functional currency using the exchange rate prevailing at the date on which fair value was determined. Exchange gains and losses on non-monetary items measured at fair value are recorded as a part of the gain or loss on the fair value of the item. In the consolidated statement of cash flows, cash flows from foreign currency transactions have been translated into Euros at the exchange rates prevailing at the dates the cash flows occur. Exchange gains and losses arising on the settlement of foreign currency transactions and the translation into functional currency of monetary assets and liabilities denominated in foreign currencies are recognised in profit or loss. iii) Translation of foreign operations The financial statements of Group companies that are stated in a currency other than the presentation currency have been translated to Euros as follows: assets and liabilities are translated at the closing rate prevailing at the reporting date; income and expenses are translated at the average exchange rate for the period; and exchange differences are recognised separately in equity under translation differences. The Group has applied the exemption permitted by IFRS 1, First-time Adoption of International Financial Reporting Standards, relating to accumulated translation differences. Consequently, translation differences recognised in the consolidated annual accounts generated prior to 1 January 2004 are recognised in retained earnings. Furthermore, the Group did not apply IAS 21 The Effects of Changes in Foreign Exchange Rates retrospectively to goodwill arising on business combinations that occurred before the date of transition to IFRS. Consequently, goodwill is considered as an asset of the acquirer not the acquiree, and is therefore not subject to variations due to exchange rate fluctuations affecting the acquiree. For presentation of the consolidated statement of cash flows, cash flows, including the comparative balances of foreign subsidiaries, are translated into Euros applying the same criteria as that used to translate the financial statements. Acerinox Group Page 12 of
16 No Group companies operate in hyperinflationary economies. 2.6 Intangible assets a) Goodwill Business combinations are accounted for by applying the acquisition method. Goodwill represents the positive difference between the cost of acquisition and the Group s share of the fair value of the acquiree's identifiable net assets (assets, liabilities and contingent liabilities) at the acquisition date. Due to the application of the exemption permitted by IFRS 1, goodwill on acquisitions completed prior to the transition to IFRS is recognised at historical cost, less accumulated amortisation following generally accepted accounting principles in Spain at the acquisition date. As none of the adjustments stipulated in IFRS 1 were required, this amount was considered the deemed cost of goodwill at the transition date. After initial recognition, goodwill is measured at cost less any accumulated impairment losses. Goodwill is not amortised but is tested annually for impairment (or more frequently where there are indications of possible impairment) in accordance with IAS 36 (see note 2.8). Negative goodwill arising on an acquisition of a business combination is recognised directly in the consolidated income statement, after reassessing the measurement of the assets, liabilities and contingent liabilities of the acquiree, as established in the standard. Internally generated goodwill is not recognised as an asset. b) Internally generated intangible assets Expenditure on research activities undertaken with the prospect of gaining new scientific or technical knowledge is expensed in the consolidated income statement when incurred. When research findings are applied to produce new products or to substantially improve existing products and processes, the associated development costs are capitalised if the product or process is technically and commercially feasible, the Group has sufficient resources to complete development and sufficient future cash flows are expected to be generated to recover the costs, with a credit to self-constructed non-current assets in the consolidated income statement. The expenditure capitalised includes the cost of materials, direct labour and directly attributable overheads. Expenditure on activities for which the costs attributable to the research phase are not clearly distinguishable from costs associated with the development stage of intangible assets is recognised in the consolidated income statement. Capitalised development costs are not amortised while the project is underway. Upon successful completion of the project, amortisation begins on a systematic basis over the estimated useful life. In the event of changes in the circumstances that led to the capitalisation of the project expenditure, the unamortised balance is expensed in the year the changes arise. c) Computer software Computer software licences are capitalised at the cost of acquiring the licence and preparing the specific program for use. Computer software maintenance or development costs are charged as expenses when incurred. Costs that are directly associated with the production of identifiable and unique computer software packages by the Group are recognised as intangible assets provided that they are likely to generate economic benefits that exceed the associated costs for more than one year. Capitalised expenses comprise direct labour costs and directly attributable overheads. Acerinox Group Page 13 of
17 d) Emission allowances CO 2 emission allowances are recognised as intangible assets and measured at cost of acquisition. Allowances acquired free of charge under the National Allocation Plan pursuant to Law 1/2007 of 9 March 2007 are initially measured at market value at the date received. At the same time, a grant is recognised for the same amount under deferred income. Emission allowances are not amortised, but rather are expensed when used. At year end, the Group assesses whether the carrying amount of the allowances exceeds their market value in order to determine whether there are indications of impairment. If there are indications, the Group determines whether these allowances will be used in the production process or earmarked for sale, in which case the necessary impairment losses would be recognised. Provisions are released when the factors leading to the valuation adjustment have ceased to exist. A provision for liabilities and charges is recognised for expenses related to the emission of greenhouse gases. This provision is maintained until the company is required to settle the liability by surrendering the corresponding emission allowances. These expenses are accrued as greenhouse gases are emitted. When an expense is recognised for allowances acquired free of charge, the corresponding deferred income is taken to operating income. In the case of swaps of emission allowances, given that all of the Group's allowances were acquired free of charge, the accounting treatment applied by the Group is that of non-commercial swaps. The Group derecognises allowances surrendered at their carrying amount and recognises those received at their fair value when received. The difference between both values is recognised as deferred income. Detailed information on emission allowances received and consumed in 2015 and 2014, as well as the swap performed in the year, is included in note 7 Intangible assets. e) Amortisation Intangible assets with finite useful lives are amortised by allocating the depreciable amount of an asset on a systematic basis over its useful life. Intangible assets are amortised from the date they become available for use. Goodwill and development expenditure on work in progress are tested annually for impairment. Estimated useful lives are as follows: - Industrial property: 5 years - Computer software: 2-5 years The Group does not have any intangible assets with indefinite useful lives. Residual values, amortisation methods and useful lives are reviewed, and adjusted if appropriate, at each reporting date. Changes to initially established criteria are accounted for as a change in accounting estimates. 2.7 Property, plant and equipment a) Owned assets Property, plant and equipment are recognised at cost or deemed cost, less accumulated depreciation and any accumulated impairment losses. The cost of self-constructed assets is determined using the same principles as for an acquired asset, while also considering the criteria applicable to production costs of inventories. The production cost is capitalised by allocating the costs attributable to the asset to self-constructed non-current assets in the consolidated income statement. Acerinox Group Page 14 of
18 Borrowing costs directly linked to financing the construction of property, plant and equipment are capitalised as part of the cost until the asset enters service. The Group also capitalises certain borrowing costs incurred on loans that are not directly designated to finance the investments, applying a capitalisation rate to the amounts used to finance these assets. This capitalisation rate is calculated based on the weighted average of the borrowing costs incurred on loans received by the Company other than those specifically allocated to finance the assets. The amount of borrowing costs capitalised never exceeds the amount of borrowing costs incurred during the period. The cost of property, plant and equipment includes major repair costs, which are capitalised and depreciated over the estimated period remaining until the following major repair. Subsequent to initial recognition of the asset, only improvement costs incurred which will generate probable future profits and for which the amount may reliably be measured are capitalised. Costs of periodic servicing of property, plant and equipment are recognised in profit and loss as incurred. Spare parts are carried as inventory unless the Group expects to use them over more than one period, in which case they qualify as property, plant and equipment and are depreciated over their useful life. The carrying amount of a spare part is written off when it is used to replace a damaged part. Spare parts of property, plant and equipment are classified under technical installations and machinery in the breakdown provided in note 8. b) Investment property Investment property comprises Group-owned buildings held to earn rentals or for capital appreciation but not occupied by the Group. Investment property is initially recognised at cost, including transaction costs. Subsequently the Group applies the same criteria as for property, plant and equipment. As investment property represents only a minor proportion of the Group s assets, it is included within property, plant and equipment. Details are, however, provided in the notes. Lease income is recognised using the criteria described in note 2.17 b). c) Depreciation Property, plant and equipment are depreciated by allocating the depreciable amount of the asset on a systematic basis over its useful life. The depreciable amount is the cost or deemed cost of an asset, less its residual value. Each part of an item of property, plant and equipment with a cost that is significant in relation to the total cost of the item is depreciated separately. Residual values, depreciation methods and useful lives are reviewed, and adjusted if appropriate, at each reporting date. Changes to initially established criteria are accounted for as a change in accounting estimates. Land is not depreciated. Property, plant and equipment are depreciated over the following estimated useful lives: - Buildings: years - Technical installations and machinery: 3-30 years - Other property, plant and equipment: 2-10 years 2.8 Impairment of non-financial assets The carrying amounts of the Group s non-financial assets, other than inventories and deferred tax assets, are reviewed at each reporting date to determine whether there are any indications of impairment. If any such indication exists, the Group estimates the recoverable amount of the asset. The recoverable amount of goodwill, which is not amortised, and of intangible assets not yet available for use is estimated at each reporting date, unless prior to this date there were indications of a possible loss in value, in which case these are tested for impairment. Acerinox Group Page 15 of
19 Impairment losses are recognised whenever the carrying amount of the asset, or its corresponding cash-generating unit, exceeds its recoverable amount. Impairment losses are expensed in the income statement. The recoverable amount of the assets is the higher of their fair value less costs to sell and their value in use. Value in use is the present value of estimated cash flows, applying a discount rate that reflects the current market valuation of the time value of money and the specific risks of the asset in question. For assets that do not generate cash inflows themselves, the recoverable amount is determined for the cash-generating unit to which the asset belongs, considered as the smallest identifiable group of assets that generates cash inflows that are largely independent of the cash inflows from other assets or groups of assets. Details of the variables and assumptions used by the Group to calculate value in use and identify cash-generating units are provided in notes 7.2 and 8.1. Except in the case of goodwill, impairment losses recognised in prior years are reversed through the income statement provided that there has been a change in the estimates used to determine the asset s recoverable amount since the last impairment loss was recognised. However, the new carrying amount cannot exceed the carrying amount (net of amortisation or depreciation) that the asset would have had if no impairment loss had been recorded. 2.9 Financial instruments Classification The Company classifies financial instruments into different categories based on the nature of the instruments and the Group s intentions on initial recognition Financial assets Acquisitions and disposals of investments are accounted for at the date on which the Group undertakes to purchase or sell the asset. Investments are derecognised when the contractual rights to the cash flows from the investment expire or have been transferred and the Group has transferred substantially all the risks and rewards of ownership. On derecognition of a financial asset, the difference between the carrying amount and the sum of the consideration received, net of transaction costs, is recognised in profit or loss. The measurement criteria applied to the financial assets held by the Group in 2015 and 2014 are detailed below. a) Financial assets at fair value through profit or loss Derivative financial instruments, except those that are designated as hedges and qualify for recognition as such, are included in this category. The derivative financial instruments included in this category are classified as current assets and measured at fair value. Transaction costs directly attributable to the acquisition are recognised as an expense. Changes in fair value are recorded under revaluation of financial instruments at fair value in the income statement. b) Loans and receivables Loans and receivables include non-derivative financial assets with fixed or determinable payments that are not quoted in an active market. They are only classified as non-current when they are not due to mature within 12 months of the reporting date. These investments are initially recognised at the fair value of the consideration given, Acerinox Group Page 16 of
20 including transaction costs directly attributable to the purchase, and subsequently measured at amortised cost using the effective interest method. The Group makes the necessary valuation adjustments where there is evidence that a receivable is impaired. The amount of the impairment loss is calculated as the difference between the carrying amount and the present value of the estimated future cash flows, discounted at the effective interest rate determined on initial recognition. These losses are recognised as an expense in the consolidated income statement and are reversed with the recognition of the income when their causes are eliminated. Trade receivables are included in this category, recognised at their nominal value, which is the same as their fair value, as generally they accrue no interest. In cases where the Group considers that amounts will not be collected when due, the provision for bad debts reduces the balance of trade receivables. The Group analyses trade receivables on an individual basis, although in general, all balances past due by more than 180 days or when the debtor has been declared insolvent are considered as impaired. Discounted notes and factored trade receivables are recognised until maturity under both trade receivables and current loans and borrowings, unless the risks and rewards associated with these assets have been substantially transferred, in which case they are derecognised. c) Available-for-sale financial assets The Group classifies in this category non-derivative financial instruments that are designated as available for sale or which do not qualify for recognition in the previous categories. They are initially recognised at fair value plus transaction costs directly attributable to the purchase. After initial recognition financial assets classified in this category are measured at fair value provided this can be measured reliably, recognising the gain or loss in the consolidated statement of comprehensive income. The fair value of listed securities is determined by reference to the share price. The fair value of financial assets that are not quoted in official markets is calculated by reference to discounted future cash flows. Equity investments included in this category whose market value cannot be reliably defined are measured at acquisition cost, as permitted by IFRS-EU, less any impairment losses. When available-for-sale financial assets are sold, the cumulative gains or losses from changes in fair value recognised in the consolidated statement of comprehensive income are transferred to the consolidated income statement. When a decline in the fair value of an available-for-sale financial asset has been recognised in comprehensive income and there is objective evidence that the asset is impaired, the cumulative loss is reclassified from equity to the income statement. This amount is calculated as the difference between the acquisition cost and the current fair value, less any previously recognised impairment. Any impairment losses recognised in the income statement in relation to these assets are reversed against equity rather than through profit and loss. Any subsequent increase in fair value is recognised under valuation adjustments in the consolidated statement of comprehensive income. At the end of each reporting period the Group assesses whether there is objective evidence of impairment. Objective evidence of impairment exists when there is a significant or prolonged decline in the listed price of an investment below its cost. To determine whether this is the case, the Group examines the historical listed prices of its securities and how long they have been trading below cost Financial liabilities For measurement purposes, financial liabilities are classified into the following categories: a) Debts and payables The financial liabilities classified in this category are initially recognised at cost, which is the same as their fair value, less any transaction costs incurred. These liabilities are subsequently measured at amortised cost using the Acerinox Group Page 17 of
21 effective interest method. Any difference between the amount received (net of transaction costs) and the amortised cost is recognised in profit or loss. However, trade payables falling due in less than one year that have no contractual interest rate and are expected to be settled in the short term are measured at their nominal amount. This category also includes the bonds issued by the Group. The Group has contracted reverse factoring facilities with various financial institutions to manage payments to suppliers. Trade payables settled under the management of financial institutions are recognised under trade and other payables until they are settled or repaid or have expired. When debt is refinanced, the Group assesses whether the changes made in the new agreement are sufficiently important to recognise the effects as if it were a cancellation and, simultaneously, a new loan. b) Financial liabilities at fair value through profit or loss This category includes the Group s derivative financial instruments, except for financial guarantee contracts or designated hedging instruments. These are recognised at fair value. Changes in fair value are recognised in profit or loss Hedge accounting Derivative financial instruments are initially recognised at cost of acquisition, which coincides with their fair value. They are subsequently recognised at fair value. Derivative financial instruments that do not meet hedge accounting requirements are classified and measured as financial assets and financial liabilities at fair value through profit or loss. Where derivatives qualify for recognition as cash flow hedges, they are treated as such and the recognition of any resultant unrealised gain or loss depends on the nature of the hedged item. The effective part of the realised gain or loss on the financial instrument is initially recognised in the consolidated statement of comprehensive income and later transferred to the income statement in the year or years in which the hedged transaction affects profit or loss. The Group only undertakes cash flow hedges. At the inception of the hedge the Group formally designates and documents the hedging relationships and the objective and strategy for undertaking the hedges. Hedge accounting is only applicable when the hedge is expected to be highly effective at the inception of the hedge and until it expires. A hedge is considered as highly effective if it offsets the changes in cash flows attributable to the hedged risk throughout the period for which it was designated (prospective analysis) and the actual effectiveness, which can be reliably measured, is within a range of 80%-125% (retrospective analysis). The Group prospectively discontinues the accounting of fair value hedges when the hedging instrument expires, is sold or the hedge no longer meets the criteria for hedge accounting. In these cases, the cumulative gain or loss on the hedging instrument that has been recognised in equity is recorded in profit or loss Determination of fair value Financial instruments measured at fair value are classified based on valuation inputs into the following levels: LEVEL 1: includes financial instruments for which the fair value is determined by reference to quoted prices on active markets. LEVEL 2: includes financial instruments for which the fair value is determined based on observable market variables, other than quoted prices. LEVEL 3: includes financial instruments for which the fair value is determined based on unobservable variables. Acerinox Group Page 18 of
22 2.10 Inventories Inventories are initially measured at cost of acquisition or production. Valuation allowances are made and recognised as an expense in the income statement when the cost of acquisition or production of inventories exceeds the net realisable value. Net realisable value is the expected selling price of these goods less costs to sell. Any write-downs that reduce inventories to their net realisable value are reversed, up to the cost of the inventories, if the circumstances that gave rise to the write-downs cease to exist. Cost of acquisition or production is determined as follows: - Raw materials and other supplies are measured using the weighted average cost method. - Finished goods and work in progress are measured at the weighted average cost of raw and other materials consumed, incorporating applicable direct and indirect labour costs and general manufacturing costs based on the higher of normal operating capacity or actual production. The cost of underutilisation of operating capacity is not included in the value of finished goods and work in progress. The Group uses the same cost model for all inventories of the same nature and with a similar use. The net realisable value for finished goods is the estimated selling price in the ordinary course of business, less costs to sell. In the case of work in progress the estimated costs of completion are also deducted from this price. Raw materials are not written down below cost if the finished goods in which they will be used are expected to be sold at or above cost of production Cash and cash equivalents Cash and cash equivalents include cash balances, demand deposits with banks and other short-term, highly liquid investments that are readily convertible to cash and which are subject to an insignificant risk of changes in value. In the consolidated statement of cash flows, the Group classifies interest paid and received as cash flows from operating activities, while dividends received are considered cash flows from investing activities and dividends paid are classified as cash flows used in financing activities Grants Capital grants Capital grants are those received by the Group for the acquisition of property, plant and equipment and intangible assets. They are recognised as deferred income in the balance sheet. They are initially recognised at the original amount awarded when there is reasonable assurance that this will be received and that the Group will comply with the conditions attached. Subsequently, they are taken to the income statement on a straight-line basis over the useful lives of the assets for which the grants were received, except for those relating to CO 2 emission allowances, which are taken to income in line with the recognition of the corresponding greenhouse gas emission expense Operating grants Operating grants are those received to finance specific expenses. They are recognised as income when the expenses are incurred. Acerinox Group Page 19 of
23 2.13 Employee benefits Certain Group companies have assumed the following long-term commitments with their employees: a) Defined contribution plans A defined contribution plan is a pension plan under which the Group pays fixed contributions into a separate entity, and will have no legal or constructive obligation to pay further contributions if the fund does not hold sufficient assets to pay all employee benefits relating to employee service in the current and prior periods. Certain Group companies pay contributions to pension and life insurance plans on a mandatory, contractual or voluntary basis. The Group has no further payment obligations once these contributions have been paid. The contributions are recognised as an employee benefit expense when they are accrued. Prepaid contributions are recognised as an asset to the extent that a cash refund or a reduction in future payments is available. Provisions are not made for defined contribution plans as they do not generate future obligations for the Group. b) Defined benefit plans A defined benefit plan is a commitment entered into by a company with its employees to remunerate services rendered. These benefits have been established based on local legislation in certain countries, contracts signed to that effect, or as included in collective bargaining agreements prevailing in certain Group companies. Accrued commitments are calculated as the present value of the accumulated benefits accrued by personnel until the reporting date, using actuarial assumptions. Calculations are made by independent experts. Group companies record the corresponding provisions to cover these commitments. Existing obligations may be classified as: Pension plans: certain Group companies have commitments with some employees reaching retirement age. Early retirement benefits: certain Group companies have undertaken to pay benefits to employees who opt to take early retirement. Supplements: these plans are obligations agreed with certain Group employees to supplement their remuneration on retirement. Other post-employment commitments: certain Group companies provide healthcare benefits to their retired employees. Entitlement to these benefits is usually conditional on the employee remaining in service up to retirement age and the completion of a minimum service period. The expected costs of these benefits are accrued over the period of employment using an accounting methodology similar to that for defined benefit pension plans. The Group complies with obligations regarding the externalisation of these commitments in countries where this is applicable. Defined benefit liabilities recognised in the consolidated balance sheet reflect the present value of defined benefit obligations at the reporting date, minus the fair value at that date of plan assets. The Group recognises changes in the actuarial value of obligations in comprehensive income. The actuarial value of the commitments is calculated by an independent expert. The valuation is performed using the Projected Unit Credit method, taking into account mortality tables and estimates of future increases in medical costs. When plan assets include insurance policies that exactly match the amount and timing of some or all of the benefits payable under the plan, the fair value of the insurance policies is considered equal to the present value of the related obligations. c) Share-based payments The Group does not have any share-based payment plans. Acerinox Group Page 20 of
24 2.14 Provisions The Group recognises provisions when: (i) It has a present obligation (legal or constructive) as a result of past events; (ii) It is more likely than not that an outflow of resources will be required to settle the obligation; and (iii) A reliable estimate can be made of the amount of the obligation. The amount recognised as a provision is the best estimate of the expenditure required to settle the present obligation at the end of the reporting period, taking into account all risks and uncertainties surrounding the amount to be recognised as a provision and, where the time value of money is material, the financial effect of discounting provided that the expenditure to be made each period can be reliably estimated Classification of assets and liabilities as current and non-current The Group classifies assets and liabilities in the consolidated balance sheet as current and non-current. Assets and liabilities are considered current when the Group expects to settle, realise, sell or consume them in its normal operating cycle, they are held primarily for the purpose of trading, it expects to realise or settle them within twelve months after the reporting date or they are cash or cash equivalents Income taxes The income tax expense for the year comprises current tax and deferred tax. Current tax is the estimated tax payable on the consolidated taxable income or tax loss for the year using tax rates enacted at the reporting date and any adjustment to tax payable in respect of previous years. Deferred tax is calculated using the balance sheet method, based on temporary differences that arise between the tax base of assets and liabilities and their carrying amounts in the consolidated annual accounts. Deferred tax is measured using the tax rates (and laws) enacted or substantively enacted at the reporting date that are expected to apply to the period when the asset is realised or the liability settled. The effect on deferred tax assets and liabilities of a change in the tax rate is recognised in the income statement, except to the extent that it relates to items previously charged or credited to the consolidated statement of comprehensive income. Deferred tax liabilities are always recognised. Deferred tax assets in respect of temporary differences are recognised only to the extent that it is probable that future taxable income will be available against which the asset can be utilised. Deferred tax assets are reduced when it is no longer considered probable that sufficient future taxable income will be generated or there are no deferred tax liabilities against which the assets can be offset. Reductions are reversed if there is renewed expectation that sufficient taxable income will be available against which the derecognised balance can be utilised. The Group only offsets deferred tax assets and liabilities if it has a legally enforceable right to do so, the assets and liabilities correspond to the same taxation authority and it plans to realise current tax assets or settle current tax liabilities on a net basis. Deferred tax assets and liabilities are recognised in the consolidated balance sheet under non-current assets or liabilities, irrespective of the expected date of recovery or settlement. Certain companies in the consolidated Group have reserves that could be subject to taxation if they were distributed. The Group has not recognised any tax effect in this respect as these reserves are not expected to be distributed in the foreseeable future. Acerinox Group Page 21 of
25 The Parent has filed consolidated tax returns since As agreed by the shareholders at an annual general meeting held on 28 May 2003, Acerinox, S.A. and some of the Spanish-domiciled subsidiaries form part of a consolidated tax group on an indefinite basis, with the exception of Metalinox Bilbao, S.A.U. and Inoxidables de Euskadi, S.A.U., which file tax returns separately. At 31 December 2015 and 2014 the consolidated tax group comprises Acerinox, S.A., Acerinox Europa, S.A.U, Roldán, S.A., Inoxfil, S.A., Inoxcenter, S.L.U. and Inoxcenter Canarias, S.A.U Income a) Sales of goods and rendering of services Revenue from the sale of goods is recognised in the income statement when the risks and rewards of ownership have been transferred to the buyer. No revenue is recognised if there are significant uncertainties regarding the recovery of the consideration due, or the possible return of goods. Revenue is recognised net of taxes, returns and discounts that the Group considers probable at the date the revenue is recognised, and after the elimination of intra-group sales. b) Lease income Rental income from investment property is recognised in the income statement on a straight-line basis over the term of the lease. c) Income from dividends Dividend income is recognised when the Group s right to receive it is established Environmental issues The Group takes measures to prevent, reduce or repair the damage caused to the environment by its activities. Expenses derived from environmental activities are recognised as other operating expenses in the period in which they are incurred. The Group has not recognised any environmental provisions. Property, plant and equipment acquired by the Group for long-term use to minimise the environmental impact of its activity and protect and improve the environment, including the reduction and elimination of pollution, are recognised as assets, applying the measurement, presentation and disclosure criteria described in note Changes in accounting estimates and policies, and correction of errors The Group applies IAS 8 to recognise changes in accounting estimates and accounting policies and to correct errors. The Group recognises changes in accounting estimates in the period in which they occur. Accounting errors are corrected in the year in which they occurred, restating the comparative information presented in the financial statements. Changes in accounting policies are applied retrospectively, adjusting the opening balances of the equity items affected. In 2015 the Group has restated the comparative figures for 2014 to correct accumulated depreciation in respect of certain items of property, plant and equipment. This amount results from a standardisation adjustment made during the transition to international accounting standards that was not reversed in subsequent years. Consequently, the opening balances at 1 January 2014 have been restated, resulting in a reduction in the balances Acerinox Group Page 22 of
26 of property, plant and equipment, deferred tax liabilities and reserves of Euros 14 million, Euros 4 million and Euros 10 million, respectively. This adjustment represents an immaterial percentage of 0.5% of assets and liabilities and has no impact on the profit for 2015 or Therefore basic and diluted earnings per share are not affected. NOTE 3 ACCOUNTING ESTIMATES AND JUDGEMENTS Accounting estimates and judgements are assessed constantly and based on past experience and other factors, including expectations of future events that are considered reasonable. The Group makes estimates and judgements related to future events. The resulting accounting estimates could differ from actual results. In accordance with IAS 8 on Accounting Policies, Changes in Accounting Estimates and Errors, changes in accounting estimates are recognised prospectively in the Group s financial statements. The Group s main estimates are as follows: a) Impairment of goodwill and other non-financial assets The Group tests goodwill annually for impairment, in accordance with the accounting policy described in note 2.8. The Group reviews property, plant and equipment at each reporting date to ascertain whether there is any indication of impairment. If any such indication exists, the Group estimates the recoverable amount of the asset. The recoverable amount of a cash-generating unit (CGU) is determined based on its value in use. These calculations are made using reasonable assumptions based on past returns and future production and market development expectations. Notes 7.2 and 8.1 include details of the analyses conducted by the Group in 2015 and b) Useful lives of plant and equipment Group management determines the estimated useful lives and corresponding depreciation charges for its plant and equipment based on expert valuations. These could alter significantly as a result of technical innovations, variations in plant activity levels, etc. Management regularly reviews the depreciation charge and adjusts it when estimated useful lives are different from those previously applied, fully depreciating or derecognising technically obsolete and non-strategic assets which have been abandoned or sold. Estimated useful lives remain unchanged both in 2015 and c) Fair value of derivatives or other financial instruments The fair value of financial instruments that are not traded in active markets is determined by using valuation techniques mainly based on market conditions existing at each reporting date, and provided that financial information is available to carry out this valuation. Note contains additional information on financial instruments measured in accordance with these assumptions. d) Provisions As mentioned in note 2.14, provisions recognised in the consolidated balance sheet reflect the best estimate at the reporting date of the amount expected to be required to settle a liability, provided that the materialisation of this outflow of resources is considered probable. Changes in foreseen circumstances could cause these estimates to vary and would be reviewed if necessary. Acerinox Group Page 23 of
27 e) Net realisable value As mentioned in note 2.10, the Group estimates the net realisable value of its inventories to recognise any impairment required. Expected selling prices of inventories less costs to sell are considered when calculating net realisable value. f) Recoverability of available tax loss carryforwards and deductions The Group regularly evaluates its available tax credits through projections of profit and loss approved by management, to conclude as to whether they will be recoverable in the future. The Group takes into account the limitations to offsetting tax bases as stipulated in certain legislation. Details of the basis on which the Group assesses the recoverability of tax credits are provided in note The judgements and accounting estimates used by the Group in 2015 and 2014 are the same as in prior years. NOTE 4 FINANCIAL RISK MANAGEMENT The Group s activities are exposed to various financial risks: market risk (currency risk, interest rate risk and price risk), credit risk and liquidity risk. The Group aims to minimise the potential adverse effect on its profits through the use of derivative financial instruments, where appropriate to the risks, and insurance. Note includes a detailed analysis of the Group s derivatives at year end. The Group does not acquire financial instruments for speculative purposes. 4.1 Market risk Market risk arises from variations in market prices due to exchange rate or interest rate fluctuations or changes in the price of raw and other materials, which can affect a company s results and equity as well as the values of its assets and liabilities Currency risk The Group operates internationally and is therefore exposed to foreign currency risk, especially with regard to the US Dollar. Currency risk arises from commercial transactions, financing and investment operations, and from translation of financial statements in functional currencies other than the Group s presentation currency (Euro). In order to control currency risk associated with commercial transactions, Group entities use forward currency sale or purchase contracts negotiated with the Group s Treasury Department in accordance with policies approved by management. The Group also uses derivatives such as cross-currency swaps to control currency risk in financing operations. The Group hedges most of its financial and commercial transactions in currencies other than the functional currency of each country. At the beginning of each month and subject to fortnightly review, each company considers its loans in non-local currency, trade receivables and supplier balances in foreign currency, the sales and purchases in foreign currency forecast for the period and exchange rate insurance coverage. The Group may take commercial and finance transactions as a whole into account when evaluating its total exposure for the purpose of hedging transactions in foreign currency. Not all of the exchange rate insurance contracts entered into by the Group qualify for cash flow hedge accounting as established in note Contracts that do not comply with these criteria have been accounted for as financial instruments at fair value through profit or loss. Acerinox Group Page 24 of
28 In general, financial instruments designated to hedge exposure to currency risk arising from commercial transactions are not recognised as hedging instruments. However, those designated as a hedge of foreign currency risk arising from financial transactions qualify for recognition as hedging instruments. The fair value of forward exchange contracts is their market price at the reporting date, which is the present value of the difference between the insured price and the forward price of each contract. Note includes details of financial instruments contracted by the Group to hedge this type of risk at 31 December 2015 and As most commercial transactions in currencies other than the functional currency of the Company are hedged, any fluctuation in exchange rates that could affect assets or liabilities denominated in foreign currency would be offset by a fluctuation for the same amount in the derivative contracted. Lastly, the Group is exposed to currency risk as a result of the translation to Euros of the individual financial statements of companies whose functional currency differs from the Group s presentation currency, particularly the US Dollar and the South African Rand. Based on the exchange rates of these currencies against the Euro at the end of 2015, sensitivity to changes in exchange rates, with other variables remaining constant, is as follows: (Expressed in thousands of Euros) 10% appreciation Profit and loss 10% depreciation 10% appreciation Equity 10% depreciation 31 December 2015 USD 4,076-3, , ,345 ZAR 1,537-1,257 19,385-15, December 2014 USD 16,442-13, , ,712 ZAR ,340-17, Interest rate risk The Group s financing comes from various countries and in different currencies (mainly the Euro, the US Dollar and the South African Rand), with a range of maturity dates and mostly variable interest rates. The Group s financial liabilities and financial assets are exposed to fluctuations in interest rates. To manage this interest risk rate, curves are analysed regularly and derivatives are used. These derivatives take the form of interest rate swaps and qualify for recognition as cash flow hedging instruments. The fair value of interest rate swaps is the estimated amount that the Group would receive or pay to terminate the swap at the reporting date, taking into account interest and exchange rates at that date and the credit risk associated with the swap counterparties. The Group has therefore hedged the interest rate risk on the majority of its non-current loans in recent years. Note includes details of the financial instruments arranged by the Group to hedge this type of risk at 31 December 2015 and Risk premiums and credit spreads increased between 2009 and the end of 2013 as a result of the international financial crisis and money market turbulence. Since then, the Acerinox Group has witnessed a considerable improvement. The Group has minimised exposure to this risk by ensuring that its non-current borrowings exceed its current borrowings. Acerinox Group Page 25 of
29 Regarding Group sensitivity to interest rates, had interest rates on the loan balances outstanding at the reporting date been 100 basis points higher, with all other variables remaining constant, consolidated profit after tax would have been Euros 5.03 million lower (3.65 million euros lower in 2014). The effect on the Group s equity of higher interest rates across the entire curve would have been a net decrease of Euros 0.79 million (Euros 5.86 million increase in 2014), as the higher borrowing costs would not have been offset by increases in the values of its interest rate hedging derivatives held at the reporting date Price risk The Group is exposed to three types of price risk: 1. Risk due to changes in the listed price of securities held in listed companies The risk of price fluctuations in listed securities relates to the shares held by the Group in Nisshin Steel, which is traded on the Tokyo Stock Exchange. The Group has not hedged this risk with derivative financial instruments. Note provides details of the impact of the fluctuations in listed securities during the year. 2. Risk due to regional crises Acerinox s global presence, with factories in four geographical regions and commercial activities on five continents, reduces its exposure to any specific area. 3. Risk of changes in prices of raw materials The stainless steel market is characterised by healthy demand, which has grown at an annual rate of approximately 6% for over 50 years. Exceptionally, the market shrank by 11.8% in because of the worldwide economic recession, but recovered with growth of 26.4% in The aforementioned annual growth rate is therefore expected to prevail in the medium term.. Stainless steel is required for all industrial applications and used in all sectors, which guarantees that this growth will be sustained in the coming years. Although end consumption continues to grow steadily, the fact that this market is largely controlled by independent wholesalers leads to volatility in apparent consumption, reflecting their expectations regarding nickel price trends in the London Metal Exchange (LME) and their ensuing strategies to stockpile or realise inventories. To counter the risk derived from the fact that independent wholesalers, control the majority of the market, the Acerinox Group has developed a sales network that enables it to supply end customers on a continuous basis, by means of warehouses and service centres through which the Group s production is channelled. This policy has enabled the Group to achieve a significant market share among end customers and, therefore, stabilise sales and reduce this risk. The recent investments made in the Pinto (Madrid) service centre and the newly opened sales branches in Russia, Thailand, the Philippines, Taiwan, Indonesia, Vietnam and Dubai are examples of this strategy. Maintaining sufficient inventory levels in warehouses entails the risk that these inventories might be recognised above their market price. The Group alleviates this risk by maintaining strict control over inventory levels To counter the risk posed by the volatility of raw materials, 90% of Group sales (i.e. all sales made in Europe, America and South Africa) are naturally hedged by applying an alloy surcharge, which allows the Group to pass on any nickel price fluctuations occurring on the London Metal Exchange during production of the order, as well as Euro/US Dollar exchange rate fluctuations, to customers. With this hedge, a fluctuation of 10% in the price of nickel on the London Metal Exchange would alter the Group s gross margin on sales by less than 1%. The valuation of raw materials, work in progress and finished goods at average cost helps to reduce the volatility of costs and, consequently, to decrease the impact of nickel price fluctuations on margins. The Group s policy of taking firm orders naturally hedges the costs of raw materials, as all accepted orders have a known risk. The Group has also made considerable efforts to reduce its production cycle to two weeks. Keeping Acerinox Group Page 26 of
30 strict control over inventories and adapting production to market circumstances help to alleviate the risk of raw material price fluctuations. The aforementioned factors (an own sales network, controlled inventory levels, alloy surcharges, average cost valuations, shortening of the production cycle and a policy of acceptance of short-term orders) help to reduce exposure to the main risk, namely the cyclical nature of apparent consumption due to the volatility of raw materials. As this is a factor beyond this Group's control, effective risk management is not always sufficient to eliminate its impact. In 2015, the uninterrupted decline in the price of nickel by 42% has led independent wholesalers to reduce their inventories, which has affected the flow of orders from manufacturers. Twelve months of uninterrupted decline in the price of this raw material has had an impact on profit margins in the industry worldwide. Had the Group not implemented such a strategy in managing this risk, the damage would have been far greater, as seen in other manufacturers. 4.2 Credit risk Credit risk is defined as the possible loss that could be incurred through failure of a customer or debtor to meet contractual obligations. The Group s exposure to credit risk is determined by the individual characteristics of each customer and, where applicable, by the risk corresponding to the country where the customer operates. Due to the diversity of its customers and the countries in which it operates, credit risk is not concentrated in any individual customer, sector or geographical region. The Group hedges its commercial and political risks either through credit insurance companies, or through letters of credit and bank guarantees extended by banks of recognised solvency located in countries with low financial risk. Credit insurance covers between 85% and 90% of declared commercial risks, depending on the country in which the customer is located and the insurance company, and 90% of political risks. The Group s main credit insurer has an A3 credit rating from Moody s and an A (excellent) rating from A.M. Best. In 2015 pay-outs of Euros 1,674 thousand have been collected under the credit insurance policy (Euros 2,798 thousand in 2014). A risk committee is responsible for monitoring the Group s credit risk policy. Where required, the committee also performs an individual analysis of customers creditworthiness, establishing credit limits and payment terms. New customers are analysed with the insurance company and those that fulfil the necessary credit conditions are offered the Group s general payment terms. Payment in cash is required from those that do not. The risk committee comprises representatives from the sales, financial and legal departments. The risks of the companies that make up the Acerinox Group are analysed and information is in turn received from the respective risk committees of Bahru Stainless, Columbus, NAS or Grupinox (which represents the sales network in Spain). Among other duties, the risk committee reviews the status of past-due debts, monitors sales with excessive exposure, and approves internal loans or, depending on the amount, requests approval from the steering committee. The Group has long-standing commercial relationships with many of its customers. In the event of a late payment, the Group monitors future deliveries and payment terms closely, reviews credit limits and improves existing measures as appropriate. Where permitted under local legislation in the country in which the customer operates, retention of title clauses are used to secure recovery of goods in the event of default on payment. On occasion the Group also uses other financial instruments to reduce credit risk, such as factoring operations. The Group derecognises factored assets when the risks and rewards of these assets have been substantially transferred. The Group makes valuation adjustments to trade receivables where necessary to mitigate the risk of bad debts or provide for past-due balances, or when circumstances indicate that collection is doubtful. In general, the Group recognises impairment on receivables aged over 180 days or when the debtor has filed for insolvency. Details of movement in impairment of trade receivables are provided in note Acerinox Group Page 27 of
31 At 31 December 2015, consolidated trade receivables amount to Euros 439,537 thousand (Euros 443,565 thousand in 2014). Revenues for 2015 total Euros 4,221,426 thousand (Euros 4,380,289 thousand in 2014). Credit risk insurance has been contracted for 55% of consolidated net sales, (50% in 2014). Cash conditions exist for 2% (2% in 2014). Confirmed letters of credit or guarantees are used to hedge credit risk in 2% of consolidated net sales (2% in 2014). Domestic sales by North American Stainless Inc., which have a collection period of under 30 days, account for 37% of consolidated net sales (45% in 2014). The ageing analysis of receivables is as follows: (Expressed in thousands of Euros) 2015 % of payables 2014 % of payables Outstanding 366,051 83% 345,102 78% Less than 30 49,622 11% days 73,555 17% days 8,950 2% 11,923 3% days 3,801 1% 2,055 0% Over 90 days 11,113 3% 10,930 2% TOTAL 439, % 443, % The Group has made provisions for Euros 9,815 thousand (Euros 10,487 thousand in 2014) of which the entire amount is for balances aged more than 90 days. Total known write-offs during the year amount to 0.01% of sales. Most of the Group s past-due receivables are insured and generally reflect customary delays in trading activity (67% of past-due receivables are aged less than 30 days). At 15 February, over 73% of the above past-due debt has been collected (85% in 2014). In view of the default rates in all sectors, we consider that the above figures are highly satisfactory and vindicate the Group s credit risk policy. Any advances to suppliers of property, plant and equipment or intangible assets are hedged through bank guarantees issued by the supplier and confirmed by banks of recognised solvency. 4.3 Liquidity risk Although access to liquidity has improved considerably over the last two years, the Group ensures its solvency and flexibility through long-term loans and financing facilities for amounts exceeding the quantities required at any time. The Group s cash is centrally managed to optimise resources. The Group s net debt is primarily concentrated within the Parent (more than 80% of total gross borrowings at year end). Based on its cash flow estimates and considering its investment plans, the Group has sufficient funding to meet its commitments, and maintains sufficient balances available for drawdown from credit facilities to cover liquidity risk. In 2015 and 2014 no payment defaults occurred on the principal of loans or loan interest on the Group s financing. At year end the Group has been granted current and non-current financing totalling Euros 1,788 million and facilities for factoring without recourse for Euros 420 million. At 31 December 2015 drawdowns comprised Euros 1,191 million from financing facilities and Euros 100 million from factoring facilities. In 2014, the Group had current and non-current financing facilities of Euros 1,909 million and facilities for factoring without recourse of Euros 480 million. Total drawdowns comprised Euros 1,354 million from financing facilities and Euros 251 million from factoring facilities. At 31 December 2015 cash and cash equivalents amount to Euros 480 million (Euros 738 million in 2014). Acerinox Group Page 28 of
32 The high levels of bank borrowings to guarantee mid-term liquidity along with the ongoing effort to reduce working capital continues to provoke high levels of cash in the Group. The cash balances are available and there is no restriction on their use. Cash deposits are always short-term never exceeding three months and with banks of recognised solvency. In April 2015, Columbus Stainless Ltd signed a financing agreement (a Borrowing Base Facility) for ZAR 3,500 million with ten financial institutions. Through this transaction, some inventories (raw materials, work in progress and finished products) and some trade receivables are pledged as collateral for this financing. Details of this loan are provided in note In July 2014 a non-extinctive novation was signed for the Euros 370 million syndicated factoring agreement arranged between Acerinox Europa S.A.U. and a number of trading subsidiaries of Acerinox S.A. This novation extended the expiry and amended the economic conditions of the factoring facility. Through this agreement, various Group subsidiaries factor invoices to end customers in several European countries. The syndicate is led by Banco Santander and the other participants are Santander de Factoring y Confirming S.A. E.F.C., Banca March S.A., Caixabank S.A., Popular de Factoring S.A. E.F.C., Bankinter S.A., Banco Sabadell S.A. and Banco Marocaine Du Commerce Exterieur Internacional S.A. In order to diversify the sources of its financing and extend its debt maturities, in July 2014 the Group filed a base prospectus for the issuance of fixed-income securities of Acerinox S.A. for a maximum notional amount of Euros 500 million at the Spanish National Securities Market Commission. Since then, Acerinox S.A. has carried out two issues through this prospectus: the first issue of Euros 75 million was placed by Deutsche Bank AG, London Branch, in July 2014 with a term of ten years, whilst the second was placed by Banco Bilbao Vizcaya Argentaria, S.A. for a total of Euros 50 million in December 2014 with a term of four years. An analysis of the Group s payment obligations at the 2015 close is as follows: Amount at 31/12/2015 Future cash flow maturities Less than 6 months 6-12 months 1-2 years 2-5 years More than 5 years Non-current payables 741, ,383-6,511-9, , ,050-90,000 Current payables 449, , , ,301 Suppliers and other payables 620, , ,244 FINANCIAL DERIVATIVES Hedged using interest rate swaps and cross-currency swaps 20,450 20,140 4,051 2,326 12,489 1,274 0 Export exchange rate insurance -12, , ,441 Import exchange rate insurance -1, , ,468 TOTAL 1,817, ,260-17, , , ,776-90,000 Payables to public entities are not included in suppliers and other payables. Future cash flow maturities include the loan principal plus interest based on contractual interest rates at year end. This item does not include approved investments not capitalised under property, plant and equipment under construction at the reporting date. 4.4 Capital management The aims of the capital management policy are: - To safeguard the Company s capacity for sustained growth Acerinox Group Page 29 of
33 - To provide appropriate returns to shareholders - To maintain an optimum capital structure The Company manages its capital structure and makes adjustments based on changes in economic circumstances. To maintain and adjust its capital structure, it can adopt different policies relating to the payment of dividends, the reimbursement of the share premium, share buy-backs, self-financing of investments, non-current borrowings, etc. Capital structure is controlled using different ratios, such as the net financial debt/ebitda ratio, understood to be the period necessary for the resources generated by the Company to cover the level of debt; or the gearing ratio, i.e. the relationship between net financial debt and equity of the Company. Net financial debt is taken to be the sum of current and non-current loans and borrowings, plus notes issued, less cash and cash equivalents. EBITDA reflects operating profit or loss before amortisation, depreciation and changes in trade provisions. The ratio of net financial debt to EBITDA is 2.48x, and although this is higher than in 2014 (1.36x), the Group amply complies with all the covenants governing Group borrowings, as detailed in note Investments in 2015 totalled Euros 67.6 million (Euros 77.3 million in 2014), reducing cash by Euros 50.2 million due to the rise in working capital (Euros million). As a result, net financial debt has grown by 15.4% to Euros million (Euros million) since last year. However, due to its strong position in terms of liquidity, the Group has made less use of instruments such as factoring and reverse factoring to finance its working capital. The Group s gearing ratio is 35.1% (33.2% in 2014), below the average ratio for the past five years. With a view to diversifying its sources of financing, the Group s South African subsidiary, Columbus Ltd. Pty., has signed a syndicated financing agreement ( Borrowing Base Facility) for up to ZAR 3,500 million (Euros 275 million) over a three-year period (Note 9.2.4). The volume of investments continues to be in line with the Group s strategic plan. The Group did not base its strategic plan, which was recently revised for the period , on opportunistic criteria, but rather on industrial rationale and long-term efficiency, meaning that, its financial position permitting, the Group can keep to this plan even when the economic climate is unfavourable. The total remuneration offered to shareholders was Euros 0.45 per share in 2015 (as in 2014). Nevertheless, at the ordinary annual general meeting held on 3 June 2015, for the third year running the shareholders approved a scrip dividend also known as a flexible dividend in which Acerinox shareholders were able to choose between cash and new shares. Through this decision the Company abided by its traditional policy of maintaining shareholder remuneration. The dividend finally paid amounted to Euros million. On 20 July, 5,005,253 new Acerinox shares, created as a result of shareholders representing 59.3% of the Company s share capital opting to receive their dividend in the form of shares, began trading. Acerinox, S.A. s share capital is currently represented by 266,707,393 shares. 4.5 Insurance As the Group s four integrated flat product production plants (including one under construction) and three long product production plants are located in different regions, an accident would not affect more than one-third of total production. This guarantees the continuity of the business, while adequate co-ordination between the remaining factories reduces the consequences of material damage to any of the facilities. Sufficient coverage has been contracted for the Group s factories through material damage and loss-of-profit insurance policies, which account for over 54.74% of the Acerinox Group s insurance expenditure. All assets under construction are covered by both the insurance policies taken out by the respective suppliers in addition to a global building and assembly policy. The Group also has a captive reinsurance company based in Luxembourg, Inox Re, which manages these risks by assuming a part as self-insurance and accessing the reinsurance market directly. The Acerinox Group has also arranged general liability, environmental, credit, transport, and group life and accident insurance policies to reduce its exposure to these different risks. Acerinox Group Page 30 of
34 NOTE 5 SCOPE OF CONSOLIDATION 5.1 Subsidiaries and associates At 31 December 2015 and 2014, in addition to Acerinox, S.A., the Acerinox consolidated group includes 40 fully consolidated subsidiaries and one equity-accounted associate. Investments in subsidiaries and associates in 2015 are as follows: Acerinox Group Page 31 of
35 FULLY CONSOLIDATED COMPANIES COUNTRY COST (in thousands of Euro s ) 2015 INTERES T % OWNERSHIP COMP ANY HOLDING INVES TMENT AUDITORS ACERINOX (SCHWEIZ) A.G. Mellingen, Switzerland % ACERINOX S.A KP MG % ACERINOX S.A ACERINOX ARGENTINA S.A. Buenos Aires, Argentina INOXIDABLES DE EUSKADI % S.A.U ACERINOX AUSTRALASIA P TY. LTD. Sydney, Australia % ACERINOX S.A Chinen, Morbelli y asociados ACERINOX BENELUX S.A. - N.V. Brussels, Belgium % ACERINOX S.A KP MG % ACERINOX S.A ACX DO BRASIL REP RESENTAÇOES, LTDA Sao P aulo, Brazil INOXIDABLES DE EUSKADI % S.A.U ACERINOX CHILE, S.A. Santiago de Chile, Chile 7, % ACERINOX S.A KP MG ACERINOX COLOMBIA S.A.S Bogota, Colombia % ACERINOX S.A ACERINOX DEUTSCHLAND GMBH Langenfeld, Germany 45, % ACERINOX S.A KP MG ACERINOX EUROP A, S.A.U Algeciras, Spain 341, % ACERINOX S.A KP MG 18, % AC ERINOX S.A ACERINOX FRANCE S.A.S P aris, France KP M G INOXIDABLES DE EUSKADI % S.A.U ACERINOX INDIA P VT LTD Mumbai, India % ACERINOX S.A Mehta Chokshi & Shah ACERINOX ITALIA S.R.L. Milan, Italy 78, % ACERINOX S.A Collegio Sindicale - Studio Revisori Associatti ACERINOX MALAYSIA SDN. BHD Johor, Malaysia 4, % ACERINOX S.C. MALAYSIA SDN. BHD KP M G % ACERINOX S.A ACERINOX METAL SANAYII VE TICARET L.S. Gumussuyu/Beyoglu, Turkey INOXIDABLES DE EUSKADI % S.A.U ACERINOX MIDDLE EAST DMCC (DUBAI) Dubai, United Arab Emirates % ACERINOX S.A Al Sharid Auditing and Management Consultancy ACERINOX NORWAY A.S Oslo, Norway % ACERINOX S.A ACERINOX P ACIFIC LTD. Wanchai, Hong Kong 5, % ACERINOX S.A KP MG 25, % ACERINOX S.A ACERINOX P OLSKA, SP Z.O.O Warsaw, P oland KP M G INOXIDABLES DE EUSKADI % S.A.U % ACERINOX S.A ACERINOX RUSSIA LLC Saint P etersburg, Russia % ACERINOX SCANDINAVIA AB ACERINOX SCANDINAVIA AB Malmo, Sweden 31, % ACERINOX S.A KP MG ACERINOX S.C. MALAYSIA SDN. BHD Johor, Malaysia 37, % ACERINOX S.A KP MG ACERINOX SHANGAI CO., LTD. Shanghai, China 6, % ACERINOX S.A Shanghai Shenzhou Dalong ACERINOX (SEA), P TE LTD. Singapore, Singapore % ACERINOX S.A KP MG ACERINOX U.K, LTD. Birmingham, United Kingdom 28, % ACERINOX S.A KP MG ACEROL - COMÉRCIO E INDÚSTRIA DE AÇOS INOXIDÁVEIS, UNIP ESSOAL, LDA. Maia, P ortugal 15, % ACERINOX S.A KP MG BAHRU STAINLESS, SDN. BHD Johor, Malaysia 171,769 67% ACERINOX S.A KP MG COLUMBUS STAINLESS (P TY) LTD. Middelburg, South Africa 279,615 76% ACERINOX S.A KP MG CORP ORACIÓN ACERINOX P ERU S.A.C Lima, P eru % ACERINOX S.A INOX RE, S.A. Luxembourg 1, % ACERINOX S.A KP MG INOXCENTER CANARIAS, S.A.U Telde (Gran Canaria), Spain % INOXCENTER KP MG INOXCENTER, S.L.U Barcelona, Spain 17, % ACERINOX S.A KP MG INOXFIL S.A. Igualada (Barcelona), Spain 6, % ROLDAN S.A KP MG INOXIDABLES DE EUSKADI S.A.U Vitoria, Spain 2, % ACERINOX EUROP A, S.A.U KP MG INOXP LATE - COMÉRCIO DE P RODUCTOS DE AÇO INOXIDÁVEL, UNIP ESSOAL, LDA. Maia, P ortugal 13, % ACEROL - COMÉRCIO E INDÚSTRIA DE AÇOS INOXIDÁVEIS, UNIP ESSOAL, LDA. METALINOX BILBAO, S.A.U Galdácano (Vizcaya), Spain 3, % ACERINOX S.A KP MG NORTH AMERICAN STAINLESS INC. Kentucky, U.S.A. 545, % ACERINOX S.A KP MG NORTH AMERICAN STAINLESS CANADA, NORTH AMERICAN STAINLESS Canada 28, % INC INC. KP M G NORTH AMERICAN STAINLESS MEXICO S.A. NORTH AMERICAN STAINLESS Apodaca (N.L.), Mexico 18, % DE C.V. INC. KP M G NORTH AMERICAN STAINLESS FINANCIAL INVESTMENTS LTD. Kentucky, U.S.A % ACERINOX S.A ROLDAN S.A. P onferrada, Spain 17, % ACERINOX S.A KP MG KP M G INTERES T COST (in % COMPANY HOLDING COUNTRY tho us ands o f ASSOCIATES OWNERSHIP INVES TMENT Euro s ) BETINOKS P ASLANMAZ ÇELIK A.S. Turkey % ACERINOX S.A Acerinox Group Page 32 of
36 The activities of the Group companies are as follows: Acerinox, S.A.: holding company of the Acerinox Group. The Company renders legal, accounting and advisory services to all the Group companies and carries out financing activities within the Group. Acerinox Europa, S.A.U.: manufacture and marketing of flat stainless steel products. North American Stainless, Inc.: manufacture and sale of flat and long stainless steel products. Columbus Stainless (PTY), Ltd.: manufacture and sale of flat stainless steel products. Bahru Stainless, Sdn, Bhd: manufacture and sale of flat stainless steel products. Roldán, S.A.: manufacture and sale of long stainless steel products. Inoxfil, S.A.: manufacture and sale of stainless steel wire. Inox Re, S.A.: captive reinsurance company. North American Stainless Financial Investment, Inc.: rendering of foreign trade advisory services. Remaining companies: sale of stainless steel products. Acerinox Group Page 33 of
37 Investments in subsidiaries and associates in 2014 are as follows: FULLY CONSOLIDATED COMPANIES COUNTRY COST (in thousands of Euro s ) 2014 INTERES T % OWNERSHIP COMPANY HOLDING INVES TMENT AUDITORS ACERINOX (SCHWEIZ) A.G. Mellingen, Switzerland % ACERINOX S.A KP MG % ACERINOX S.A ACERINOX ARGENTINA S.A. Buenos Aires, Argentina INOXIDABLES DE EUSKADI % S.A.U ACERINOX AUSTRALASIA P TY. LTD. Sydney, Australia % ACERINOX S.A C hinen, M o rbelli y asociados ACERINOX BENELUX S.A. - N.V. Brussels, Belgium % ACERINOX S.A KP MG % ACERINOX S.A ACX DO BRASIL REP RESENTAÇOES, LTDA Sao P aulo, Brazil INOXIDABLES DE EUSKADI % S.A.U ACERINOX CHILE, S.A. Santiago de Chile, Chile 7, % ACERINOX S.A KP MG ACERINOX COLOMBIA S.A.S Bogota, Colombia % ACERINOX S.A ACERINOX DEUTSCHLAND GMBH Langenfeld, Germany 45, % ACERINOX S.A KP MG ACERINOX EUROP A, S.A.U Algeciras, Spain 341, % ACERINOX S.A KP MG 18, % ACERINOX S.A ACERINOX FRANCE S.A.S P aris, France KP M G INOXIDABLES DE EUSKADI % S.A.U ACERINOX INDIA P VT LTD Mumbai, India % ACERINOX S.A Mehta Chokshi & Shah ACERINOX ITALIA S.R.L. Milan, Italy 78, % ACERINOX S.A KP MG ACERINOX MALAYSIA SDN. BHD Johor, Malaysia 4, % ACERINOX S.C. MALAYSIA SDN. BHD KP M G % ACERINOX S.A ACERINOX METAL SANAYII VE TICARET L.S. Gumussuyu/Beyoglu, Turkey INOXIDABLES DE EUSKADI % S.A.U ACERINOX MIDDLE EAST DMCC (DUBAI) Dubai, United Arab Emirates % ACERINOX S.A Al Sharid Auditing and Management Consultancy ACERINOX NORWAY A.S Oslo, Norway % ACERINOX S.A KP MG ACERINOX P ACIFIC LTD. Wanchai, Hong Kong 5, % ACERINOX S.A KP MG 25, % ACERINOX S.A ACERINOX P OLSKA, SP Z.O.O Warsaw, P oland KP M G INOXIDABLES DE EUSKADI % S.A.U % ACERINOX S.A ACERINOX RUSSIA LLC Saint P etersburg, Russia % ACERINOX SCANDINAVIA AB ACERINOX SCANDINAVIA AB Malmo, Sweden 31, % ACERINOX S.A KP MG ACERINOX S.C. MALAYSIA SDN. BHD Johor, Malaysia 37, % ACERINOX S.A KP MG ACERINOX SHANGAI CO., LTD. Shanghai, China 6, % ACERINOX S.A Shanghai Shenzhou Dalong ACERINOX (SEA), P TE LTD. Singapore, Singapore % ACERINOX S.A KP MG ACERINOX U.K, LTD. Birmingham, United Kingdom 28, % ACERINOX S.A KP MG ACEROL - COMÉRCIO E INDÚSTRIA DE AÇOS INOXIDÁVEIS, UNIP ESSOAL, LDA. Maia, P ortugal 15, % ACERINOX S.A KP MG BAHRU STAINLESS, SDN. BHD Johor, Malaysia 171,769 67% ACERINOX S.A KP MG COLUMBUS STAINLESS (P TY) LTD. Middelburg, South Africa 279,615 76% ACERINOX S.A KP MG CORP ORACIÓN ACERINOX P ERU S.A.C Lima, P eru % ACERINOX S.A INOX RE, S.A. Luxembourg 1, % ACERINOX S.A KP MG INOXCENTER CANARIAS, S.A.U Telde (Gran Canaria), Spain % INOXCENTER KP MG INOXCENTER, S.L. Barcelona, Spain 16, % ACERINOX S.A KP MG INOXFIL S.A. Igualada (Barcelona), Spain 6, % ROLDAN S.A KP MG INOXIDABLES DE EUSKADI S.A.U Vitoria, Spain 2, % ACERINOX EUROP A, S.A.U KP MG INOXP LATE - COMÉRCIO DE P RODUCTOS DE AÇO INOXIDÁVEL, UNIP ESSOAL, LDA. Maia, P ortugal 14, % ACEROL - COMÉRCIO E INDÚSTRIA DE AÇOS INOXIDÁVEIS, UNIP ESSOAL, LDA. METALINOX BILBAO, S.A. Galdácano (Vizcaya), Spain 3, % ACERINOX S.A KP MG NORTH AMERICAN STAINLESS INC. Kentucky, U.S.A. 545, % ACERINOX S.A KP MG NORTH AMERICAN STAINLESS CANADA, NORTH AMERICAN STAINLESS Canada 28, % INC INC. KP M G NORTH AMERICAN STAINLESS MEXICO S.A. NORTH AMERICAN STAINLESS Apo daca (N.L.), Mexico 18, % DE C.V. INC. KP M G NORTH AMERICAN STAINLESS FINANCIAL INVESTMENTS LTD. Kentucky, U.S.A % ACERINOX S.A ROLDAN S.A. P onferrada, Spain 17, % ACERINOX S.A KP MG KP M G Acerinox Group Page 34 of
38 INTEREST COST (in % COMPANY HOLDING COUNTRY thousands of ASSOCIATES OWNERSHIP IN VES T M E N T Euro s ) BETINOKS P ASLANMAZ ÇELIK A.S. Turkey % ACERINOX S.A 5.2 Changes in the consolidated Group The only change in the consolidated Acerinox Group in 2015 was the acquisition in January of the remaining noncontrolling interest of 1.67% in the Spanish trading companies Inoxcenter, S.L.U. and Metalinox Bilbao, S.A.U., giving Acerinox, S.A. a 100% stake in these two companies. These shares were purchased for Euros 1,530 thousand, of which Euros 508 thousand had not been paid up at 31 December The difference between the acquisition price and the carrying amount of the non-controlling interest was taken to equity (Euros 1,241 thousand). Changes in the consolidated Group during 2014 were as follows: Inoxcenter, S.L. and Metalinox Bilbao, S.A. On 5 July 2014 Acerinox, S.A. acquired a non-controlling interest of 0.86% in the Spanish trading companies Inoxcenter, S.L. and Metalinox Bilbao, S.A. As a result, non-controlling interests decreased from 2.5% in 2013 to 1.67% in These shares were purchased for Euros 1,082 thousand. The difference between the acquisition price and the carrying amount of the non-controlling interest was taken to equity (Euros 955 thousand). Roldan, S.A. In 2014, 559 shares in Roldan were acquired from non-controlling shareholders. The stake acquired represented 0.02% of the share capital. These shares were purchased for Euros 13 thousand. 5.3 Capital increases and reductions In 2015 the Parent, Acerinox, S.A., waived a loan granted to its 100% investee, Group company Acerinox Pacific Ltd. This loan amounted to Euros 15.9 million. This loans was waived to redress the Company s equity balance. This transaction has no impact on the consolidated financial statements. Group company in Portugal, Inoxplate Lda, a 100% investee of Portuguese Group company Acerol Ltda has reimbursed in 2015 the supplementary contributions of Euros 1,100 thousand from its parent. On 27 February 2014 Acerinox, S.A. received a partial repayment of Euros 21,110 thousand from Acerinox Italia for the portion of the supplementary contribution made in 2009 to redress this company s equity. 5.4 Impairment of investments The Parent has tested its investments in Group companies for impairment at 31 December 2015 and 2014 to determine whether their carrying amount exceeds the recoverable amount. In 2015, impairment equivalent to the amount of the waived loan mentioned in the preceding note, Euros 15.9 million, was recognised. The impairment tests conducted in 2014 indicated that the cost of the investment in Acerinox Pacific, Ltd. exceeded its recoverable amount, so impairment of Euros 5.6 million was recognised. It has not been necessary to recognise additional impairment of investments in Details of the carrying amounts of investments in Group companies are included in note 5.1 Acerinox Group Page 35 of
39 Based on the recoverable amounts determined for Inoxcenter and Acerol, the impairment losses recorded in 2012 on these investments totalling Euros 7.3 million and Euros 1.9 million, respectively, were reversed in This impairment does not have an impact on consolidated results as these companies are fully consolidated. NOTE 6 SEGMENT REPORTING As described below, the Group is organised internally into operating segments, which are strategic business units. The strategic business units have different products and services and are managed separately. Group management reviews internal reports for each unit at least monthly. The operating segments presented by the Group, associated with the types of products it sells, are as follows: Flat stainless steel products: slabs, flats, coils, plates, sheets, circles and flat bars. Long stainless steel products: bars, angles, wires and wire rod. Other: other stainless steel products not included in the previous segments. The unallocated segment reflects the activities of the holding company and activities that cannot be allocated to specific operating segments. Segment results, assets and liabilities include all items directly or indirectly attributable to a segment. No significant assets are shared between segments and, considering the importance of flat stainless steel products, any assets that could be attributed to both segments are assigned to the flat segment. Inter-segment sales prices are established in accordance with market commercial terms and conditions governing non-related third parties. A segment s performance is measured by its net pre-tax profit. The Group considers this information to be the most relevant in evaluating a segment against other comparable segments in the sector. Acerinox Group Page 36 of
40 6.1 Operating segments Segment results for the year ended 31 December 2015 are as follows: (Expressed in thousands of Euros) 2,015 Flat products Long products Other Unallocated Adjustments Total Income statement Revenues 3,832, ,930 14,377 3, ,322 4,253,331 Inter-segment sales -167,667-11, ,322 0 Total revenues 3,664, ,275 14,377 3, ,253,331 Gross operating profit/loss 244,523 53,874 1,924-15, ,572 Depreciation and amortisation -146,878-16, ,684 Share of profit of equity-accounted investees Finance income 2, , ,292 Finance costs -18, , ,175 Exchange losses 1, ,891 Profit before tax 83,790 37,361 1,599-45, ,896 Income tax -50,438-12, , ,578 Consolidated profit/loss for the period 33,352 25,328 1,200-33, ,318 Attributable to: Non-controlling interests -16, ,573 Net profit/loss attributable to the Group 49,913 25,340 1,200-33, ,891 Balance sheet Segment assets 3,546, ,138 20, , ,125,672 Unallocated assets Total consolidated assets 3,546, ,138 20, , ,125,672 Segment liabilities 1,010,393 42,775 16,185 1,033,015 2,102,368 Unallocated liabilities 0 Total consolidated liabilities (excluding equity) 1,010,393 42,775 16,185 1,033, ,102,368 Property, plant and equipment 1,873, ,499 4,750 10, ,025,856 Investments in property, plant and equipment and i 90,228 2, , ,011 Unassigned liabilities essentially comprise the Parent's financial debt. Acerinox Group Page 37 of
41 2014 figures are as follows: (Expressed in thousands of Euros) 2,014 Flat products Long products Other Unallocated Adjustments Total Income statement Revenues 3,918, ,559 7,519 4, ,776 4,413,567 Inter-segment sales -171,902-11, ,776 0 Total revenues 3,746, ,685 7,519 4, ,413,567 Gross operating profit/loss 376,337 86,396 3,181-17, ,032 Depreciation and amortisation -135,038-14, ,345 Share of profit of equity-accounted investees Finance income 2, , ,301 Finance costs -22, , ,802 Exchange losses 3, ,589 Profit before tax 224,303 71,067 2,685-54, ,776 Income tax -99,613-27,897-2,056 8, ,089 Consolidated profit/loss for the period 124,690 43, , ,687 Attributable to: Non-controlling interests -13, ,642 Net profit/loss attributable to the Group 138,323 43, , ,329 Balance sheet Segment assets 3,523, ,853 20, , ,415,640 Unallocated assets Total consolidated assets 3,523, ,853 20, , ,415,640 Segment liabilities 1,313,040 44,319 16,047 1,200,019 2,573,425 Unallocated liabilities 0 Total consolidated liabilities (excluding equity) 1,313,040 44,319 16,047 1,200, ,573,425 Property, plant and equipment 1,818, ,567 4,296 11, ,971,519 Investments in property, plant and equipment and i 70,385 2, ,662 There are no significant balances that have not been reflected in cash flows other than amortisation and depreciation. 6.2 Geographical segments The flat and long stainless steel product segments are managed at worldwide level. Revenue from geographical segments is presented on the basis of customer location. Segment assets are determined by geographical location. Data relating to geographical segments in 2015 is presented below: Acerinox Group Page 38 of
42 Expressed in thousands of Euros) Spain 2015 Rest of Europe Americas Africa Asia Other Total Revenue by destination of goods 423,273 1,181,103 1,927, , ,391 11,409 4,221,426 Segment assets by origin 994, ,355 1,449, , , ,125,672 Property, plant and equipment at origin Investments in property, plant and equipment and intangible assets at origin 237,830 72, , , , ,025,856 32, ,060 6,497 22, , figures are as follows: (Expressed in thousands of Euros) Revenue by destination of goods Spain Rest of Europe 2014 Americas Africa Asia Other Total 395,328 1,151,440 2,225, , ,086 27,070 4,380,289 Segment assets by origin 1,329, ,468 1,405, , , ,415,640 Property, plant and equipment at origin Investments in property, plant and equipment and intangible assets at origin 253,334 76, , , , ,971,519 17,641 1,138 9,502 6,087 39, ,662 The Group sells its products in more than 80 countries spanning five continents. The following countries accounted for more than 5% of total consolidated sales in 2015 or 2014: the United States, 38.23% (42.36% in 2014); Spain, 10.13% (8.91% in 2014); Germany, 7.28% (7.49% in 2014); and South Africa, 4.99% (5.19% in 2014). No single transaction with an external customer exceeds 10% of the Group s consolidated revenues for 2015 or NOTE 7 INTANGIBLE ASSETS Details of the main intangible assets and movement therein are shown below: (Expressed in thousands of Euros) Acerinox Group Page 39 of
43 COST Computer Emission Industrial software and allowances property other SUBTOTAL Goodwill Balance at 1 January ,680 24,312 23,195 55,187 69,124 Acquisitions 1, ,052 2,280 Transfers Disposals -1, ,196 Translation differences Balance at 31 December ,022 24,312 24,236 55,570 69,124 Acquisitions 3, ,259 4,261 Transfers Disposals -1, ,184-3,010 Translation differences Balance at 31 December ,198 24,312 23,967 56,477 69,124 Computer ACCUMULATED AMORTISATION AND Emission Industrial software and IMPAIRMENT allowances property other SUBTOTAL Goodwill Balance at 1 January ,835 24,310 21,397 48,542 0 Charge Reversals of impairment -2, ,835 Disposals Translation differences Balance at 31 December ,310 21,949 46,259 0 Charge Disposals 0 0-1,184-1,184 Translation differences Balance at 31 December ,310 20,986 45,296 0 CARRYING AMOUNT Emission allowances Industrial property Computer software and other SUBTOTAL Goodwill Cost at 31 December ,680 24,312 23,195 55,187 69,124 Accumulated amortisation and impairment -2,835-24,310-21,397-48,542 Carrying amount at 31 December , ,798 6,645 69,124 Cost at 31 December ,022 24,312 24,236 55,570 69,124 Accumulated amortisation and impairment 0-24,310-21,949-46,259 Carrying amount at 31 December , ,287 9,311 69,124 Cost at 31 December ,198 24,312 23,967 56,477 69,124 Accumulated amortisation and impairment 0-24,310-20,986-45,296 Carrying amount at 31 December , ,981 11,181 69,124 Amortisation for the year is shown under amortisation and depreciation in the income statement. Research and development and innovation (R&D&I) costs directly recognised as expenses for the year and taken to the income statement amount to Euros 16,488 thousand (Euros 16,101 thousand in 2014). At 31 December 2015 the Group has not entered into any contracts to acquire intangible assets (no contracts entered into at 31 December 2014). Acerinox Group Page 40 of
44 7.1 Emission allowances On 15 November 2013 the Spanish Cabinet approved Acerinox Europa, S.A.U. s definitive allocation of free-ofcharge greenhouse gas emission allowances for the period, 1,867,754 allowances in total, which are distributed by year as follows: ,014 2,015 2, , , , , , , , ,687 The following allowances were allocated to the Group company Roldan, S.A.: ,014 2,015 2, ,857 26,391 25,919 25,442 24,960 24,473 23,980 23,486 Movement in emission allowances in 2015 and 2014 is as follows: Number of allowances Value (in thousands of Euros) Balance at 31/12/ ,490 7,680 Allocation for the year 278,583 1,228 Disposals -198,862-1,886 Balance at 31/12/ ,211 7,022 Allocation for the year 266,158 1,860 Swap 153,284 1,142 Sale Disposals -231,405-1,824 Balance at 31/12/2015 1,062,999 8,198 Group company Acerinox Europa has carried out a swap of emission allowances whereby Acerinox sold 249 emission allowances for Euros 2 thousand and simultaneously acquired 153,284 emission reduction units (ERUs) for that same amount. It then exchanged the 153,284 ERUs for the same number of emission allowances (EUAs), recognising the new allowances at their fair value at the date of the swap (Euros 1,142 thousand). In 2015, CO 2 emissions were made requiring 254,345 allowances, which will be surrendered in 2016 (231,405 in 2014, surrendered in 2015). The Group has not sold its surplus allowances. Present conditions pose no significant risk of a shortfall in emission allowances for the period. Disposals for the year are allowances surrendered for CO 2 emissions in the prior year. This information has been audited and approved by an independent expert. At 31 December 2015 the emission allowances held have a fair value of Euros 8,748 thousand (Euros 6,337 thousand at 31 December 2014). In 2014 the Group released the Euros 2,835 thousand provision existing at 31 December As explained in the relevant measurement standard of the Group s annual accounts, the release carried out during the year had no impact on the income statement. This reversal was recognised in the income statement under other operating income. Acerinox Group Page 41 of
45 The expense for the year in respect of CO 2 emissions totals Euros 1,937 thousand in 2015 (Euros 1,827 thousand in 2014) and is included under other operating expenses. This is the value of the allowances surrendered in the year, equivalent to the market value of these allowances when allocated. The Group does not hold any futures contracts for the acquisition of emission allowances. No significant contingency exists in respect of fines over emissions. 7.2 Goodwill impairment testing At 31 December 2015, goodwill totals Euros 69 million and mainly relates to the acquisition of a controlling interest in Columbus Stainless, Ltd. in This goodwill has been allocated to the Columbus cash-generating unit (CGU), which manufactures and sells flat products only. The recoverable amount of a CGU is determined based on its value in use. These calculations are based on cash flow projections from the financial budgets approved by management over a period of five years. Cash flows beyond this five-year period are extrapolated using the estimated growth rates indicated below. The growth rate does not exceed the average long-term growth rate for the business in which the CGU operates. Forecast volumes of sales and production are based on the current capacities of existing machinery and equipment. Management determined budgeted gross margins based on past experience and forecast market performance. The weighted average growth rates are consistent with the forecasts included in industry reports. The discount rates used are pre-tax values and reflect specific risks related to the relevant segments. With economic cycles increasingly difficult to anticipate, particularly in the stainless steel markets, where visibility has diminished significantly over recent years, the projections for each year have reflected these circumstances, as well as management s best estimates. Key assumptions such as exchange rates and raw material prices are, therefore, extrapolated using highly conservative criteria, referring at all times to the most recent market values. In 2015 Columbus Stainless, Ltd improved significantly on the budgeted profit forecast drawn up in the previous year, posting a pre-tax profit of ZAR million (ZAR million in 2014). The Company is confident that the flows to perpetuity will materialise, mainly in terms of its use of production capacity and margins, while still applying prudent criteria to the growth rate (g): estimated growth rates for the country and industry have been used, even though average growth over recent years has been much greater (around 6%, as is mentioned further on). The key assumptions used to calculate value in use are as follows: Budgeted EBIT margin (*) 5.5 % 4.9 % Weighted average growth rate (**) 2.5 % 2.5 % Discount rate applied (***) 11.7 % 11.3 % (*) EBIT margin, considered equivalent to operating (as a percentage of revenue) (**) Used to extrapolate cash flows beyond the budgeted The discount rate applied (weighted average cost of capital or WACC) is 11.7%. It is calculated taking as reference the interest rates on South African sovereign debt (ten-year swap on the South African Rand), a market risk premium of 5% and the capital structure of similar companies. When calculating the terminal value, repayments are considered equal to investments and the change in working capital is calculated as the value of the last projected year, 2020, which is understood to be consistent in the long term, increased by the growth rate (g). Acerinox Group Page 42 of
46 The growth rate (g) remains constant at 2.5%. In 2015 the global stainless steel market continued to consolidate the historical market growth rate of close to 6% ( period). Apparent consumption of stainless steel in the South African market has grown by 1.9% in 2015 vis-à-vis 2014 (-4.6%). Although Columbus's local sales were lower, they were more than offset by the rise in exports, resulting in an overall increase of 1.5% in turnover in 2015 compared with was a very encouraging year for Columbus Stainless, Ltd, which began a return to sustained profitability in the second half of 2014, after having been affected by the crisis for a number of years. Intelligent management of the country's situation and the weakness of the currency (Rand), the rise in sales in strategic markets for the Group, the supply of semi-products to Bahru Stainless, Sdn Bhd, the Group's factory in Malaysia, increased penetration in the Middle East and participation in several high-profile projects have all contributed to this positive trend. The Company s budgets reflect these factors as well as a gradual increase in sales to Bahru Stainless, Sdn Bhd, as the Malaysian factory achieves higher utilisation of its present installed production capacity. Other relevant key assumptions are the Euro-Rand exchange rate (14,2862) and the price of raw materials ( USD/Tn), which are established when drawing up the budget. Both assumptions are extrapolated applying very conservative criteria and are held constant over the period analysed. The variables used in 2014 were an exchange rate of ZAR to the Euro and 16,500 USD/Tn for the price of raw materials. The impairment test performed at 31 December 2015 reveals that the recoverable amount of goodwill exceeds its carrying amount by Euros 66 million (Euros 172 million in 2014). The discount rate (WACC), the growth rate (g) and the budgeted EBIT margin are considered key assumptions in the impairment test. Following a sensitivity analysis entailing different scenarios, impairment of the recoverable amount would only occur by increasing the discount rate (WACC) by 22.3% (more than 39% in 2014). In the case of the growth rate (g), even with a growth rate of 0%, the discount rate (WACC) would have to increase by 12.6% for the recoverable amount to begin to show impairment. The EBIT margin would have to fall 22.5% (27% in 2014) to 4.2% (3.6 in 2014), with the other two assumptions remaining constant, for any impairment to occur. Acerinox Group Page 43 of
47 NOTE 8 PROPERTY, PLANT AND EQUIPMENT Details of property, plant and equipment and movement in 2015 and 2014 are shown in the following table: (Expressed in thousands of Euros) COST Property, Technical Other plant and Land and installations property, equipment buildings and plant and under machinery equipment construction TOTAL Balance at 31 December ,119 2,781, , ,918 4,058,659 Additions ,572 1,743 50,179 71,382 Transfers 45, ,159-34, , Disposals -4,008-11,498-1, ,239 Translation differences 39, ,413 3,281 67, ,352 Balance at 31 December ,418 3,325,272 85, ,708 4,412,072 Additions 1,652 18,592 2,389 67,115 89,748 Impairment Transfers ,153 1,377-12, Disposals ,603-1, ,998 Translation differences 37, ,392 1,941 29, ,373 Balance at 31 December ,982 3,481,622 89, ,930 4,694,938 ACCUMULATED DEPRECIATION AND IMPAIRMENT Property, Technical Other plant and Land and installations property, equipment buildings and plant and under machinery equipment construction TOTAL Balance at 31 December ,310 1,823,168 90, ,179,762 Charge 15, ,816 7, ,678 Transfers 29 19,591-19, Disposals -2,689-3,430-2, ,067 Translation differences 12, ,470 3, ,180 Balance at 31 December ,419 2,070,615 78, ,440,553 Charge 16, ,236 5, ,079 Transfers -1,198-1,334 2, Disposals ,626-1, ,750 Translation differences 10,872 63,142 2, ,200 Balance at 31 December ,602 2,265,033 86, ,669,082 CARRYING AMOUNT Land and buildings Technical installations and machinery Other property, plant and equipment Property, plant and equipment under construction TOTAL Cost at 31 December ,119 2,781, , ,918 4,058,659 Accumulated depreciation and impairment -266,310-1,823,168-90, ,179,762 Carrying amount at 31 December , ,458 26, ,918 1,878,897 Cost at 31 December ,418 3,325,272 85, ,708 4,412,072 Accumulated depreciation and impairment -291,419-2,070,615-78, ,440,553 Carrying amount at 31 December ,999 1,254,657 7, ,708 1,971,519 Cost at 31 December ,982 3,481,622 89, ,930 4,694,938 Accumulated depreciation and impairment -317,602-2,265,033-86, ,669,082 Carrying amount at 31 December ,380 1,216,589 2, ,930 2,025,856 Acerinox Group Page 44 of
48 Depreciation for the year is shown under amortisation and depreciation in the income statement. As explained in note 2.1, the Group has restated the 2014 opening balances to reflect adjustments to depreciation effective retroactively. Property, plant and equipment under construction Details of the investments classified under this heading are as follows: (Expressed in thousands of Euros) Buildings 64,890 52,190 Technical installations and machinery 265, ,223 Other property, plant and equipment 1,307 1,228 Advances 10, TOTAL 341, ,708 Property, plant and equipment under construction at the factory in Malaysia accounts for Euros 302 million of the total (Euros 251 million in 2014), Euros 25 million represents North American Stainless investment in a new coldrolling mill and a bright annealing (BA) line, which is expected to come into service in Spring 2017, and Euros 14 million for Acerinox Europa, which has also approved a new investment in a fifth annealing and pickling line and a seventh cold-rolling mill, which are expected to start operating at the end of During 2014, on completion of the start-up period, phase I investments made by the Group company Bahru Stainless, Sdn Bhd, were reclassified from work in progress to finished goods. The amount reclassified in this company is Euros 349 million. This reclassification increased the cumulative depreciation since that year by Euros 15 million. Assets located outside Spain Details of assets located outside Spain are as follows: (Expressed in thousands of Euros) Cost Accumulated depreciation Cost Accumulated depreciation Land and buildings 520, , , ,551 Technical installations and machinery 2,356,807-1,256,454 2,198,073-1,082,279 Other property, plant and equipment 43,700-42,334 41,027-37,373 Property, plant and equipment under construction 327, ,112 0 TOTAL 3,249,046-1,461,020 2,976,387-1,258,203 Changes in accounting estimates Estimated useful lives remained unchanged in 2015 and Acerinox Group Page 45 of
49 Guarantees At 31 December 2015 and 2014 none of the Group s assets has been pledged to secure loans and borrowings. Commitments At 31 December 2015 the Group has entered into contracts to purchase new equipment and facilities amounting to Euros 154,781 thousand (Euros 71,095 thousand at 31 December 2014), of which Euros 62,622 thousand are for new investments by North American Staunless, Euros 78,865 thousand are for Acerinox Europa and Euros 11,508 thousand are for investments in the new Malaysian plant (Euros 62,530 thousand in 2014). Capitalised borrowing costs Borrowing costs of Euros 7,377 thousand have been capitalised in 2015 (Euros 6,577 thousand in 2014). The capitalisation rate in 2015 was 3.85% (4.36% in 2014). Asset disposals A loss of Euros 332 thousand on the sale of property, plant and equipment or removal of assets from service has been recorded under other operating expenses in the 2015 income statement (Euros 229 thousand in 2014). The gain on the sale of property, plant and equipment or the removal of assets from service totals Euros 517 thousand and is recognised under other operating income in the 2015 income statement (Euros 1,977 thousand in 2014). Environment Property, plant and equipment held to minimise the environmental impact of the Group s activities and to protect and improve the environment at 31 December 2015 and 2014 are as follows: (Expressed in thousands of Euros) Nature and use Gross value Accumulated depreciation Gross value Accumulated depreciation Water treatment 90,759-51,025 80,711-40,322 Acid neutralisation 41,789-25,181 33,860-17,286 Gas emission treatment 75,210-62,434 55,544-42,441 Automatic additions systems 8,459-5,585 8,082-5,205 Other items 121,346-76, ,448-91,311 Total 337, , , ,565 In 2015 and 2014 the Group received no grants for investment in infrastructure aimed at protecting the environment. In 2015 the Group incurred environment-related ordinary expenses of Euros 109,674 thousand (Euros 99,342 thousand in 2014). At 31 December 2015 and 2014 no significant contingencies exist relating to the protection and improvement of the environment and, accordingly, no provision has been made in this respect. Property, plant and equipment not used in ordinary activities Group property, plant and equipment not used in ordinary activities include several industrial bays, all of which are classified as investment property. Details and valuation of this property are provided in the section on investment property. Acerinox Group Page 46 of
50 One of the production lines of the Group company Columbus Stainless (Pty) Ltd. has ceased to be used for production given its age and low productivity. Its net carrying amount is Euros 200 thousand, which the Group has impaired in full. Other Information At 31 December 2015 and 2014 there are no litigation cases, seizures or similar measures that may affect items of property, plant or equipment. The Group companies have taken out insurance policies to cover the risk of damage to their property, plant and equipment. The coverage of these policies is considered sufficient. Investment property Investment property includes Group-owned buildings not occupied by the Group which are held to earn a return, either through rentals or through capital appreciation and subsequent disposal of the buildings. The Group currently holds several industrial bays in Spain amounting to Euros 3,390 thousand that are classified as investment property. They are owned by the companies Acerinox Europa S.A.U. and Inoxcenter, S.L.U. In 2015, an industrial bay belonging to Group company Acerinox UK and amounting to Euros 4,024 thousand was reclassified to this category. None of these buildings is currently leased. The Parent, Acerinox, S.A., leases out several storeys in a building which it owns and which has a carrying amount of Euros 3,253 thousand. Income from these leases amounted to Euros 150 thousand in 2015 (Euros 152 thousand in 2014). The associated operating expenses, including maintenance and repairs, amounted to Euros 53 thousand (Euros 48 thousand in 2014). The lease contract signed between Acerinox, S.A. and the lessee includes a yearly increase in line with the CPI and expires on 31 December Details of movements in investment property in 2015 and 2014 are as follows: (Expressed in thousands of Euros) COST Beginning balance 12,610 7,346 Additions 0 0 Transfers 4,427 5,264 Disposals Cost at 31 December 16,714 12,610 ACCUMULATED DEPRECIATION AND IMPAIRMENT Beginning balance 5,677 3,572 Charge Transfers 403 1,938 Disposals Accumulated depreciation at 31 December 6,053 5,677 CARRYING AMOUNT Cost at 31 December 16,714 12,610 Accumulated depreciation and impairment -6,053-5,677 Carrying amount at 31 December 10,661 6,933 Acerinox Group Page 47 of
51 In 2014, the industrial bays belonging to the aforementioned Spanish Group companies Inoxcenter, S.L.U. and Acerinox Europa were reclassified to this category as these properties ceased to be used for production activities and were earmarked for lease or sale. The carrying amount of the properties transferred totalled Euros 3,326 thousand. In 2015, two industrial bays classified in this category and with a net carrying amount of Euros 130 thousand were sold. Proceeds from the sale totalled Euros 545 thousand, on which the Group recognised a capital gain of Euros 411 thousand, as reflected in the income statement under other operating income. At 31 December 2015 investment property has a total market value of Euros 20,055 thousand (Euros 17,333 thousand in 2014) and a carrying amount of Euros 10,661 thousand (Euros 6,933 thousand in 2014). Consequently no impairment has been recognised. 8.1 Impairment As established in IAS 36, and as mentioned in the accounting policies for the Acerinox Group s consolidated annual accounts (note 2.8), the Group assesses whether there are any indications of impairment of the assets at each year end. The value of an asset is impaired when its carrying amount exceeds its recoverable amount. The Group considers that indications of impairment exist when, among other things, a company has incurred a loss. In 2015 there are indications of impairment in the companies Roldan, S.A. and Inoxfil S.A. The recoverability of the assets of Bahru Stainless, Sdn. Bhd. has also been assessed. The start-up of the Phase II equipment is going ahead as planned and the expected levels of activity have still not been reached given its current installed capacity. The combination of this situation with low prices in the local Malaysian market and in the rest of Asia has resulted in repeated losses and a need to perform impairment tests. As detailed below, the results of this analysis do not indicate a need to make any valuation adjustments to the assets. Property, plant and equipment and intangible assets represent 51% of the Group s assets. A breakdown of these figures by company shows that 93% of the Group s assets (both property, plant and equipment and intangibles) are located in the factories, with the remaining 7% held by its 34 other trading subsidiaries. Subsidiaries % of property, plant and equipment ACERINOX EUROPA, S.A.U. 8.57% ROLDAN S.A. 0.99% INOXFIL S.A. 0.17% NORTH AMERICAN STAINLESS INC % COLUMBUS STAINLESS PTY Ltd 6.46% BAHRU STAINLESS 36.20% Rest of subsidiaries 6.99% TOTAL % The majority of assets do not generate cash inflows independently, as the whole production process needs to be completed. Impairment has therefore not been estimated on an individual basis, but by allocating the assets to cash-generating units. In the case of plants, the smallest cash-generating units that can be considered encompass each plant as a whole. The recoverable amount of the items has been determined based on their value in use. Acerinox Group Page 48 of
52 Value in use of the assets of Bahru Stainless Sdn Bhd., Roldan, S.A. and Inoxfil S.A. was determined based on the estimated future cash flows the entity expects to obtain from the asset and the discount rate, understood to be the weighted average cost of capital (WACC). The following points were taken into consideration when calculating the discount rate: 1. The financing structure based on market participant assumptions. 2. The cost of debt is obtained using the applicable market risk-free rate plus a spread of 2%. 3. The risk-free rate is based on that applied to ten-year bonds. 4. The risk premium has been estimated at 5%. Future cash flows were estimated considering: a) Reasonable assumptions and management s best estimate of the economic conditions that will exist over the remaining useful life of the asset, based on information available at the analysis date. b) Five-year projections that reflect the financial and macroeconomic circumstances and those of the stainless steel market itself, adapted to the operating environment of each CGU analysed. The different parameters used (expected growth, use of installed production capacity, prices, working capital items, etc.) are therefore projected considering historical figures, particularly the last year closed, as well as targets set by management. With economic cycles increasingly difficult to anticipate, particularly in the stainless steel markets, where visibility has diminished significantly over recent years, the projections for each year have reflected these circumstances, as well as management s best estimates. Key assumptions such as exchange rates and raw material prices are, therefore, extrapolated using highly conservative criteria, referring at all times to the most recent market values at the time of the study. The Company is confident that the flows to perpetuity will materialise, mainly in terms of its use of production capacity and margins, while still applying prudent criteria to the growth rate (g). Estimated growth rates for the country and industry in which each CGU is present have been used, in addition to those for the markets to which most of their output is exported. c) Estimated projections for years beyond the period covered, calculated by extrapolating the previous projections using a growth rate of 2.5% in the case of Bahru Stainless Sdn. Bhd and 2% for Roldán, S.A. and Inoxfil, S.A.. Note that the historical growth rate for the global stainless steel market remains close to 6% ( period). No impairment has been recognised on property, plant and equipment during the year (with the exception of that mentioned in the note on property, plant and equipment not used in ordinary activities), as the enterprise value, calculated applying the discounted free cash flow method, exceeds the carrying amount of the Group s operating assets. Bahru Stainless Sdn. Bhd The impairment test performed at 31 December 2015 reveals that the recoverable amount of goodwill exceeds its carrying amount by Euros 175 million. The discount rate (WACC), 8.1%, the growth rate (g), 2.5%, and the budgeted EBIT margin, 3.4%, are considered key assumptions in the impairment test. Following a sensitivity analysis entailing different scenarios, impairment of the recoverable amount would only occur by increasing the discount rate (WACC) by 24.5%. In the case of the growth rate (g), even with a growth rate of 0%, the discount rate (WACC) would have to increase by 4.3% for the recoverable amount to begin to show impairment. The EBIT margin would have to fall 30.5% to 2.4%, with the other two assumptions remaining constant, for impairment to occur. Acerinox Group Page 49 of
53 Roldán, S.A. The impairment test performed at 31 December 2015 reveals that the recoverable amount of goodwill exceeds its carrying amount by Euros 147 million (Euros 107 million in 2014). The discount rate (WACC), 7.12% (8% in 2014) the growth rate (g), 2% (2% in 2014) and the budgeted EBIT margin, 4.5% (4.1% in 2014) are considered key assumptions in the impairment test. According to the sensitivity analysis performed, impairment of the recoverable amount would only occur by increasing the discount rate (WACC) by more than 2.7 times, while simultaneously bringing the growth rate (g) down to zero. The EBIT margin would also have to fall 72.4% to 1.2%, with the other two assumptions remaining constant, for any impairment to occur. Inoxfil, S.A. The impairment test performed at 31 December 2015 reveals that the recoverable amount of goodwill exceeds its carrying amount by Euros 7 million (Euros 11 million in 2014). The discount rate (WACC), 7.12% (8% in 2014), the growth rate (g), 2% (2% in 2104) and the budgeted EBIT margin, 2.7% (4% in 2014) are considered key assumptions in the impairment test. The sensitivity analysis performed indicates that impairment of the recoverable amount would only occur by increasing the discount rate (WACC) by 51.4%. In the case of the growth rate (g), even with a growth rate of 0%, the discount rate (WACC) would have to increase by 43.9% for the recoverable amount to begin to show impairment. The EBIT margin would also have to fall 38.9% to 1.6%, with the other two assumptions remaining constant, for any impairment to occur. NOTE 9 FINANCIAL INSTRUMENTS 9.1 General considerations A financial instrument is a contract that gives rise to a financial asset in one company and, simultaneously, a financial liability or an equity instrument in another company. The Group recognises a financial instrument in its balance sheet when it becomes party to the contract or legal transaction. Acerinox Group Page 50 of
54 9.2 Categories of financial assets and financial liabilities At year end the Group s financial assets are as shown below: (In thousands of Euros) Classes Non-current financial instruments Current financial instruments Equity instruments Debt securities Loans, derivatives and other Equity instruments Debt securities Loans, derivatives and other Categories 2,015 2,014 2,015 2,014 2,015 2,014 2,015 2,014 2,015 2,014 2,015 2,014 Loans and receivables 2,436 6, , ,547 Held-to-maturity investments Assets available for sale - At fair value 10,382 8,391 - At cost Assets at fair value through profit or loss - Held for trading ,503 - Other Hedging derivatives 9, ,338 21,617 TOTAL 10,667 8, ,811 6, , ,667 Acerinox Group Page 51 of
55 At year end the Group s financial liabilities are as shown below: (In thousands of Euros) Classes Non-current financial instruments Current financial instruments Loans and borrowings Bonds and other marketable Bonds and other marketable Derivatives and other Loans and borrowings securities securities Derivatives and other Categories 2,015 2,014 2,015 2,014 2,015 2,014 2,015 2,014 2,015 2,014 2,015 2,014 Debts and payables 617, , , ,050 2,062 2, , ,079 1, , ,596 Liabilities at fair value through profit or loss - Held for trading 14,072 7,655 - Other Hedging derivatives 3,992 20, TOTAL 617, , , ,050 6,054 22, , ,079 1, , ,684 Acerinox Group Page 52 of
56 9.2.1 Determination of fair value Financial instruments measured at fair value are classified based on valuation inputs into the following levels: LEVEL 1: quoted prices in active markets LEVEL 2: observable market variables other than quoted prices LEVEL 3: variables not observable in the market Details at 31 December 2015 and 2014 are as follows: (In thousands of Euros) LEVEL 1 LEVEL 2 LEVEL 3 LEVEL 1 LEVEL 2 LEVEL 3 Available-for-sale financial assets 10,382 8,391 Financial derivatives (assets) 25,346 74,120 TOTAL 10,382 25, ,391 74,120 0 LEVEL 1 LEVEL 2 LEVEL 3 LEVEL 1 LEVEL 2 LEVEL 3 Financial derivatives (liabilities) 18,409 28,264 TOTAL 0 18, ,264 0 In the case of Level 2 financial instruments, the Group uses generally accepted valuation techniques that take into account spot and future exchange rates at the valuation date, forward interest rates, interest rate spreads and credit risk of both the Group and its counterparty, i.e. the financial institution with which it operates Trade and other receivables Details at 31 December are as follows: (In thousands of Euros) Trade receivables 439, ,565 Personnel Public entities 23,356 20,051 Other receivables 8,011 3,636 Prepayments 8,909 9,292 Impairment of bad debts -9,815-10,847 TOTAL 470, ,091 Impairment of bad debts corresponds entirely to trade receivables. Movements in this account are as follows: (In thousands of Euros) Initial balance 10,847 10,219 Charge 648 2,175 Application -1, Reversal Translation differences Balance at 31 December 9,815 10,847 Acerinox Group Page 53 of
57 Impairment losses have been included under other operating expenses in the income statement. No interest was accrued on impaired financial assets in 2015 or No allowances have been made for bad debts with related parties in 2015 or At 31 December 2015 certain Group companies had receivables factored without recourse totalling Euros 99,912 thousand with financial institutions in exchange for cash. This amount was equal to 85%-90% of the total amount of the factored invoices, depending on the conditions of the credit insurance coverage (Euros 251,277 thousand in 2014). These amounts have been derecognised as they meet the conditions specified in IAS 39 regarding the transfer of risks and rewards Trade and other payables Details at 31 December 2015 and 2014 are as follows: (In thousands of Euros) Suppliers and trade payables 568, ,631 Personnel 24,712 24,536 Suppliers of fixed assets 21,174 7,824 Tax and Social Security 21,482 24,680 Other payables 708 2,932 Current provisions 4,721 10,993 TOTAL 641, ,596 In compliance with the disclosure requirements of the Spanish Accounting and Auditing Institute (ICAC) resolution of 29 January 2016, the average payment period for suppliers of the Spanish companies in the Acerinox Group, having eliminated the payments made to Group companies, is as follows: (In thousands of Euros) Days Days Average payment period to suppliers 79 days 88 days Payments made ratio 82 days 90 days Outstanding payments ratio 45 days 79 days Amount Amount Total payments made 1,607,137 1,448,509 Total outstanding payments 176, ,468 The table includes payments made to any Spanish or foreign suppliers; it does not reflect payments to Group companies. Acerinox Group Page 54 of
58 9.2.4 Loans and borrowings and bond issues Details of financial debt at 31 December 2015 and 2014, including loans and borrowings and bonds issued by the Group during the year, are as follows: (In thousands of Euros) Non-current Current Bonds issued 123, ,050 1,653 Loans and borrowings 617, , , ,079 Total financial debt 741,161 1,020, , ,079 Details of the maturity of outstanding debt at 31 December 2015 are as follows: (In thousands of Euros) and subsequent years TOTAL Financial debt 449, , ,762 8,957 79,478 1,190,701 Total financial debt 449, , ,762 8,957 79,478 1,190, figures are as follows: (In thousands of Euros) and subsequent years TOTAL Financial debt 334, , , ,700 88,435 1,354,087 Total financial debt 334, , , ,700 88,435 1,354,087 Debt by currency is as follows: (In thousands of Euros) Non-current loans Current loans EUR 609, , , ,367 USD 132, , , ,616 ZAR ,022 77,468 MYR ,628 TOTAL 741,161 1,020, , ,079 Acerinox Group Page 55 of
59 Details of debt by interest rate are as follows: (In thousands of Euros) Non-current loans Current loans Fixed 213, ,399 18,200 3,199 Variable 527, , , ,880 TOTAL 741,161 1,020, , ,079 Borrowings at fixed interest rates reflect only loans originally arranged at fixed rates with credit institutions, and do not include borrowings for which interest rates have been fixed by contracting derivatives. As the majority of bank debt was extended at variable interest rates, its fair value is the same as its amortised cost. Nevertheless, the fair value of fixed-rate loans and borrowings and private placements is Euros 235,885 thousand at 31 December The fair value of these borrowings at 31 December 2014 was Euros 239,145 thousand. Variable interest rates on loans are reviewed at least once a year. At 2015 year end the Group s Euro-denominated financing instruments, Euros 814 million in total, have a weighted average cost, before hedging, of 2.11%, while the average pre-hedging cost of borrowings in US Dollars, amounting to US Dollars 334 million, is 2.33%. In 2014, the Group s Euro-denominated borrowings, Euros 929 million in total, bore an average cost of 2.15%, while the average cost of borrowings in US Dollars, amounting to US Dollars 387 million, was 1.57%. The Group has arranged interest rate swaps whereby it can exchange the variable interest rates on its borrowings for fixed interest rates, as described in note At 31 December 2015 accrued interest of Euros 2,266 million is payable (Euros 2,960 thousand in 2014). Total borrowing costs calculated using the effective interest rate on loans at amortised cost amount to Euros 2,243 thousand (Euros 2,291 thousand in 2014). At 31 December 2015 the Group has credit facilities with financial institutions with a maximum available limit of Euros 1,788 million, of which Euros 1,191 million were drawn down. In 2014 the maximum available limit was Euros 1,909 million, of which Euros 1,354 million had been drawn down. Certain Group companies have contracted reverse factoring facilities with various financial institutions to manage payments to suppliers. Trade payables settled under the management of financial institutions are recognised under trade and other payables until they are settled or repaid or have expired In April 2015, Columbus Stainless Ltd signed a financing agreement (a Borrowing Base Facility) for ZAR 3,500 million with ten financial institutions. Through this transaction, some inventories (raw materials, work in progress and finished products) and some trade receivables are used as collateral to secure this financing. The amount of financing available through this contract primarily depends on Columbus s current assets at any given time. The amount drawn down at 31 December 2015 amounted to ZAR 1,170 million (Euros 69 million). This contract provides Columbus with financing of its working capital for a three-year period. Deutsche Bank AG, Amsterdam Branch, acted as the Co-ordinating Mandated Lead Arranger for this transaction, whilst Deutsche Bank AG, Johannesburg Branch, Bankinter, Banco Bilbao Vizcaya Argentaria, S.A., and FirstRand Bank Limited were the Mandated Lead Arrangers. Other participating banks included Banco Santander S.A., Banco de Sabadell S.A., London Branch, Nedbank Limited, CaixaBank, S.A., HSBC Bank Plc, Johannesburg Branch and Investec Bank Limited. In order to diversify the sources of its financing and extend its debt maturities, in July 2014 the Group filed a base prospectus for the issuance of fixed-income securities of Acerinox S.A. for a maximum notional amount of Euros 500 million at the Spanish National Securities Market Commission. Since then, Acerinox S.A. has carried out two issues through this prospectus: the first issue of Euros 75 million was placed by Deutsche Bank AG, London Branch in July 2014 with a term of ten years, whilst the second was placed by Banco Bilbao Vizcaya Argentaria, S.A. for a total of Euros 50 million in December 2014 with a term of four years and variable interest of 3-month Euribor %. Acerinox Group Page 56 of
60 Additionally, taking advantage of financial institutions' improved liquidity and the more favourable economic conditions, in 2014 Acerinox S.A. signed new loan agreements or renegotiations of existing loans for a total of Euros 457 million, in 14 operations with relationship banks, including Banco Santander, Banco Popular, Banco Sabadell, Caixabank, Kutxabank, Bankinter, Unicaja and Banca March. In July 2014 a non-extinctive novation was also signed for the Euros 370 million factoring agreement arranged between Acerinox Europa S.A.U., a number of trading subsidiaries of Acerinox S.A. and a syndicate of financial institutions in April This novation extended the expiry and amended the economic conditions of the factoring facility. Through this agreement, various Group subsidiaries factor invoices without recourse of end customers in several European countries. The syndicate is led by Banco Santander and the other participants are: Santander de Factoring y Confirming S.A. E.F.C., Banca March S.A., Caixabank S.A., Popular de Factoring S.A. E.F.C., Bankinter S.A., Banco Sabadell S.A. and Banco Marocaine Du Commerce Exterieur Internacional S.A. In 2014 the ZAR 300 million loan extended by Standard Bank to Columbus Stainless was repaid in full and also the ZAR 397 million loan extended by IFC (World Bank Group) in The refinancing of debt arranged by the Group in 2014 basically involved extending maturity dates and cutting spreads. Given the resulting variations, the Group has recognised the effects of these new agreements as if they were new loans, therefore it has simultaneously recognised the cancellation and new loans. The implicit costs derived from the valuation of these loans at amortised cost amounted to Euros 505 thousand, which were taken to the consolidated income statement in Non-current borrowings subject to covenants At the 2015 reporting date several loans are subject to covenants. These loans include the Borrowing Base Facility arranged by Columbus Steel in 2015, the syndicated loan signed in the United States in 2012 by Acerinox, S.A. and North American Stainless Inc., the loans taken out by Acerinox, S.A. in 2007 and 2008 from the ICO (Spain s Official Credit Institute) in both Euros and US Dollars, as well as financing covered by export credit agencies signed by Acerinox S.A., with Banco Santander and OeKB (Oesterreichische Kontrollbank AG), as well as with Deutsche Bank and JBIC (Japan Bank for International Cooperation). The most significant of the financial ratios stipulated in these loan agreements refer to the debt/capitalisation and interest coverage ratios of North American Stainless Inc., in the case of the syndicated loan in the United States, maintenance of minimum equity levels in the case of Columbus and to net financial debt/ebitda, EBITDA/finance costs and net financial debt/equity ratios in the case of the other financing arrangements mentioned above. At 2015 year end (as in 2014) Acerinox, S.A., North American Stainless Inc. and Columbus Stainless Ltd all comply with the ratios required as borrowers of the financing Available-for-sale financial assets Available-for-sale financial assets total Euros 10,667 thousand at year end, of which Euros 10,382 thousand reflect Acerinox's investment in the Japanese Nisshin Steel Holding Co. Limited., which is listed on the Tokyo Stock Exchange. The quotation value was JPY 1,289 per share at 31 December 2015 (JPY 1,162 per share at 2014 year end). Acerinox holds 1,052,600 shares in this company, representing a percentage ownership of 0.96% (0.96% in 2013). As Nisshin Steel holds a 15.34% interest in Acerinox, this is a strategic investment that Acerinox has no intention of selling. Nisshin Steel not only holds a significant interest in Acerinox, S.A. but is also Acerinox s partner in the new Malaysian venture Bahru Stainless, Sdn. Bhd, which is the Group s fourth flat stainless steel factory. Acerinox has not purchased or sold any shares in Nisshin Steel Holding Co. Limited in 2015 or In 2015 and 2014 the Group recognised the variation in the fair value of assets classified in this category in reserves. The revaluation amounted to Euros 1,991 thousand in 2015 (a loss of Euros 745 thousand in 2014). The accumulated change in value vis-à-vis the cost is a gain of Euros 2,941 thousand, before the tax effect (Euros 950 thousand in 2014). Acerinox Group Page 57 of
61 Also in 2015, the Group company Acerinox Europa acquired a non-controlling interest of 7.36% in Fortia Energía, S.L., whose statutory activity is acquisition of electrical energy on behalf of its shareholders, for Euros 275 thousand. The Group's Spanish factories can obtain more competitive electricity prices as a result of this investment Derivative financial instruments The Group classifies derivative financial instruments that do not qualify for hedge accounting as financial instruments at fair value through profit or loss. Those that qualify as hedging instruments are classified as hedging derivatives and are recognised applying the measurement criteria defined in note As detailed in note 4 in relation to market risk, in its activities the Group is essentially exposed to three types of risk: currency risk, interest rate risk and risk of changes in prices of raw materials. The Group uses derivative financial instruments to hedge its exposure to certain risks. Derivative financial instruments classified by category are as follows: (In thousands of Euros) Assets Liabilities Assets Liabilities Hedging derivatives 24,713 4,337 21,617 20,609 Derivatives at fair value through profit or loss ,072 52,503 7,655 TOTAL 25,346 18,409 74,120 28,264 A breakdown of the Group s financial derivatives at 31 December 2015 and 2014 by type of hedged risk is as follows: (In thousands of Euros) Assets Liabilities Assets Liabilities Exchange rate insurance ,170 54,559 7,683 Interest rate swaps 37 4, ,534 Cross-currency swaps 24,652 19,509 12,047 TOTAL 25,346 18,409 74,120 28,264 Currency risk The Group operates in a large number of countries and bills customers in different currencies, depending on the country where it is billing. Therefore it uses certain financial instruments to hedge cash flow risks related to the settlement of balances in foreign currencies. The contracted operations mainly comprise forward sales and purchases in foreign currencies. Derivatives of this nature do not always qualify for consideration as effective cash flow hedging instruments in accordance with IAS 39. At 31 December 2015 the effect of measuring these derivatives at market value was a negative Euros 59,509 thousand, which is recognised under remeasurement of financial instruments to fair value in the income statement (Euros 66,577 thousand in 2014). This variation was highly influenced by the appreciation of the US Dollar in At 31 December 2015 all exchange rate insurance contracts basically cover both receivables (assets) and payables (liabilities) and include both trade and financing transactions between Group companies. At 31 December 2015 the Group has exchange rate insurance totalling Euros -13,513 thousand (Euros 46,876 thousand in 2014), of which Euros 657 thousand is recognised under assets and Euros 14,170 thousand under liabilities. Only Euros -74 thousand of this amount qualifies for recognition as hedging instruments. In 2015 an amount of Euros -161 Acerinox Group Page 58 of
62 thousand was transferred from the consolidated statement of comprehensive income to profit and loss for the year (Euros 145 thousand in 2014). All of the Group s forward currency purchase and sale contracts have a term of less than one year. At 31 December 2015 the Group has used contracts for foreign currency operations amounting to Euros 252 million for currency sales and Euros 666 million for currency purchases. The comparative figures at 31 December 2014 were Euros 317 million for sales and Euros 505 million for purchases. Details of these contracts by currency are as follows: (In thousands) Assets Liabilities Assets Liabilities USD 144, , , ,881 EUR 47,882 8,327 34,456 2,688 GBP 16,508 19, SEK 30, ,994 PLN 1,459 3,013 AUD 4,775 19,679 NZD 594 3,070 NOK 7,763 MYR 251, ,650 JPY 4,187 The Group has contracted derivatives to hedge exposures to currency and interest rate risks affecting some of its loans and borrowings in currencies other than the functional currency. These instruments are described in the next note. Interest rate risk At 31 December 2015 the Group has arranged the following interest rate swaps to cover part of its current and noncurrent loans and borrowings as well as the following cross-currency swaps for loans in currencies other than the functional currency of the company in question: Notional value contracted Outstanding amount Maturity Variable to fixed rate EUR 30 million EUR 30 million 2016 Variable to fixed rate EUR 15 million EUR 5 million 2016 Variable to fixed rate EUR 10 million EUR 3.33 million 2016 USD variable to EUR fixed rate USD million USD million 2017 Variable to fixed rate EUR 400 million EUR 96 million 2017 USD variable to USD fixed rate USD 63 million USD million 2017 USD variable to EUR fixed rate USD 160 million USD million 2018 Variable to fixed rate EUR million EUR million 2020 In 2015 no additional interest rate hedges have been arranged. The average interest rate applicable to USD-denominated financing for which an interest rate hedge has been arranged is 3.05% (2.70% in 2014), while the average rate for Euro-denominated financing with an associated interest rate hedge is 3.39% (3.43% in 2013). The credit spread has been included in both cases. Acerinox Group Page 59 of
63 Details at 31 December 2014 were as follows: Notional value contracted Outstanding amount Maturity Variable to fixed rate EUR 50 million EUR 50 million 2015 Variable to fixed rate EUR 15 million EUR 15 million 2015 Variable to fixed rate EUR 30 million EUR 30 million 2015 Variable to fixed rate EUR 30 million EUR 30 million 2016 Variable to fixed rate EUR 15 million EUR 10 million 2016 Variable to fixed rate EUR 10 million EUR 6.67 million 2016 USD variable to EUR fixed rate USD million USD million 2017 Variable to fixed rate EUR 400 million EUR 160 million 2017 USD variable to USD fixed rate USD 63 million USD million 2017 USD variable to EUR fixed rate USD 160 million USD million 2018 Variable to fixed rate EUR million EUR million 2020 The most noteworthy of these hedges in terms of amount is the cross-currency swap arranged in January 2012 for USD million to hedge the syndicated loan extended to Acerinox S.A. Through this transaction the benchmark rate plus the initial spread for this loan was exchanged for a fixed rate of 2.56% in Euros. In 2014, the Group arranged various financing facilities totalling Euros 225 million with a fixed interest rate over the term of the financing. The fair value of the fixed interest rate swaps and the cross currency swaps are based on the market value of equivalent derivative financial instruments at the reporting date and amount to Euros 20,450 thousand (a negative Euros 1,020 thousand at 31 December 2014), which are recognised as follows: (In thousands of euros) Current Non-current Current Non-current Other financial assets 15,314 9,375 19,561 Other financial liabilities 247 3, ,176 Net amount 15,067 5,383 19,156-20,176 At 31 December 2015 and 2014 the derivatives contracted qualify as cash flow hedges and therefore the unrealised gain of Euros 15,323 thousand on their measurement at fair value has been recorded in the consolidated statement of comprehensive income (Euros 26,235 thousand in 2014). In 2015 an amount of Euros 8,251 thousand was transferred from the consolidated statement of comprehensive income to profit and loss for the year (Euros 22,624 thousand in 2014). The Group has documented the effectiveness of the derivatives contracted for the purpose of applying hedge accounting, as detailed in note Hedging transactions have been contracted for periods and amounts equivalent to the cash flows deriving from the associated loans. The financial instruments that are considered hedges were not ineffective at any point in 2014 or Other information At 31 December 2015, receivables have been pledged as a guarantee for the financing obtained by Colombus, as described in note Euros 69 million of current assets (inventories and receivables) were used to guarantee the amount drawn down at that date. No guarantees have been received for financial or non-financial assets. Acerinox Group Page 60 of
64 At 31 December 2014: - No financial assets were pledged to secure liabilities or contingent liabilities - No guarantees were received for financial or non-financial assets. See also details of guarantees in note NOTE 10 INVENTORIES Details at 31 December are as follows: (Expressed in thousands of Euros) Raw materials and other supplies 229, ,119 Work in progress 185, ,540 Finished goods 390, ,560 By-products, waste and recoverable materials 18,774 16,588 Advances TOTAL 824, ,698 The cost of goods sold is Euros 3,894 million in 2015 (Euros 3,870 million in 2014). In 2015 the Group wrote inventories down to net realisable value where this was lower than cost, with a total adjustment of Euros 14,248 thousand. The adjustment for 2014 amounted to Euros 9,402 thousand. At 31 December 2015, the Group company Columbus Stainless has pledged inventories as a guarantee for the financing obtained through the borrowing base facility described in note An amount of Euros 69,022 thousand has been drawn down from the loan guaranteed with the Company's working capital. At 31 December 2014 no inventories were pledged as collateral to guarantee repayment of debts or commitments undertaken with third parties. Commitments At 31 December 2015 the consolidated Group has commitments to purchase raw materials for Euros 129,143 thousand (Euros 106,380 thousand in 2014). Although no firm sales commitments exist at these reporting dates, there are formal orders for which the Group does not foresee any circumstances that could prevent delivery by the agreed deadlines. The Group does not have any inventories with a cycle exceeding one year and therefore no borrowing costs have been capitalised. Group companies have taken out insurance policies to cover the risk of damage to their inventories. The coverage of these policies is considered sufficient. Acerinox Group Page 61 of
65 NOTE 11 CASH AND CASH EQUIVALENTS Details at 31 December are as follows: (Expressed in thousands of Euros) Cash in hand and at banks 213, ,779 Current bank deposits 266, ,589 TOTAL 479, ,368 The effective interest rate on current bank deposits is 0.51% for the US Dollar, and 0.30% for the Euro (0.35% for the US Dollar, 2.60% for the Malaysian Ringgit, 5.30% for the South African Rand and 1.08% for the Euro in 2014). At the reporting date, 72% of all deposits have been made by North American Stainless and 27% by Acerinox, S.A. (80% by the Parent in 2014). Deposits are placed for between 45 days and one week with banks of recognised solvency. In 2014 the Group companies generally invested their cash surpluses in deposits with an average term of between 45 days and one week. All cash and cash equivalents are held in current accounts or current deposits. There are no unavailable cash balances at year end. NOTE 12 EQUITY 12.1 Subscribed capital and share premium Movement of issued and outstanding shares in 2015 and 2014 is as follows: (Expressed in thousands of Euros) Number of shares (thousand) Ordinary shares (thousand) Own shares (thousand) Share capital (thousands of Euros) Share premium (thousands of Euros) Balance at 1 January , , ,287 81,403 Capital increase (scrip dividend) 4,555 4,555 1,139 Acquisition of own shares -1 Redemption of own shares 1 Balance at 31 December , , ,426 81,403 Capital increase (scrip dividend) 5,005 5,005 1,251 Acquisition of own shares -1 Disposal of own shares Balance at 31 December , , ,677 81,403 The Parent s share capital solely comprises ordinary shares. All these shares have the same rights and there are no statutory restrictions on their transferability. At 31 December 2015 share capital is represented by 266,707,393 ordinary shares (261,702,140 in 2014) with a par value of Euros 0.25 each, subscribed and fully paid. All the shares are listed on the Madrid and Barcelona stock exchanges. Acerinox Group Page 62 of
66 At 31 December 2015 the only holders of 10% or more of the share capital of Acerinox, S.A. are Alba Participaciones, S.A. (19.62% in 2015 and 23.09% in 2014) and Nisshin Steel Holding, Co. Ltd. (15.34% in 2015 and 15.39% in 2014). At their general meeting the shareholders agreed to increase share capital with a charge to reserves by issuing ordinary shares to be allocated to the shareholders free of charge. Following the shareholders' meeting, on 3 June the board of directors agreed to implement the share capital increase by means of a flexible dividend, known as a scrip dividend. The share capital increase, through the issue of 5,005,253 shares derived from the scrip dividend, was filed at the Madrid Mercantile Registry on 13 July (4,555,963 shares in 2014, also derived from the scrip dividend). These new shares were admitted to trading on 20 July On 15 June, the Parent acquired 100 own shares for use, if necessary, to exchange subscription rights when executing the scrip dividend. There has been no distribution of the share premium in 2014 or The share premium is subject to the same restrictions and may be used for the same purpose as the voluntary reserves of the Parent, including conversion into share capital Distribution of dividends Based on the agreements reached by the shareholders and the board of directors on 3 June 2015, those parties who were shareholders of Acerinox from 16 June to 23:59 hours on 25 June 2015 were to be allocated one right for each share held in the share capital increase. The rights were traded on the stock exchange from 17 June to 1 July 2015 and entitled the shareholders to choose between the following options: - Sell the rights to the Company for Euros per right between 17 June and 25 June inclusive. - Sell the rights on the stock exchange at the listed market price from 17 June to 1 July 2015 inclusive. - Subscribe shares in Acerinox on the basis of one (1) new share for every thirty-one (31) rights allocated to them on 16 June On 27 June 2015 the definitive amount of the dividend payable and the details of the share capital increase were established, as follows: - 106,539,278 rights were sold to Acerinox for Euros per right, with the Company therefore paying out Euros 47,836, to its shareholders on 6 July ,005,253 new shares were issued in the share capital increase. In 2014, at the annual general meeting held on 10 June 2014, the shareholders agreed to increase share capital with a charge to reserves by issuing ordinary shares to be allocated to the shareholders free of charge. Following this meeting, the board of directors agreed to implement the share capital increase by means of a flexible dividend, known as a scrip dividend. Based on the agreements reached by the shareholders and the board of directors, those parties who were shareholders of Acerinox on 23 June 2014 could choose between the following options: - Sell the rights to the Company for Euros per right - Sell the rights on the stock exchange at the market price. - Subscribe shares in Acerinox on the basis of one new share for every twenty-nine rights On 9 July 2014: - 125,023,234 rights were sold to Acerinox, S.A. for Euros per right, with the Company therefore paying out Euros 56,135, to its shareholders on 11 July ,555,963 new shares were issued in the share capital increase. These new shares were admitted to trading on 23 July Acerinox Group Page 63 of
67 12.3 Reserves a) Retained earnings Retained earnings include consolidated profit or loss for the year, reserves in fully consolidated companies and equity-accounted investees, as well as Parent reserves other than those mentioned below. Details of reserves by company are included in note There are no restrictions on the transfer of funds by any Group company in the form of dividends, except for the nondistributable reserves required by applicable legislation. At 31 December 2015 Euros 21,640 thousand of the Group s reserves and retained earnings are subject to restrictions (Euros 20,251 thousand at 31 December 2014). The legal reserve, which is included under retained earnings in the statement of changes in equity, has been appropriated in compliance with article 274 of the Spanish Companies Act, which requires companies to transfer 10% of profits for the year to a legal reserve until this reserve reaches an amount equal to 20% of share capital. At 31 December 2015 the Company has appropriated Euros 12,465 thousand, an amount equivalent to 18.69% of its share capital, to this reserve (Euros 12,465 thousand and 19.05% of share capital in 2014). The legal reserve is not distributable to shareholders and if it is used to offset losses, in the event that no other reserves are available, the reserve must be replenished with future profits. b) Property, plant and equipment revaluation reserve As permitted by Royal Decree-Law 7/1996 of 7 June 1996, containing urgent tax measures and initiatives aimed at boosting and deregulating the economy, the Holding Company revalued its property, plant and equipment. The amount of the reserve reflects the revaluation gains, net of tax at 3%. The deadline for tax inspection was three years from 31 December Consequently, as no inspection took place, this balance can be used to offset losses or increase the Company s share capital. Once ten years had elapsed, Euros 16,592 thousand of the balance of this reserve was released to freely distributable reserves, representing the depreciated or transferred revaluation gains or revalued assets disposed of or otherwise derecognised. The balance of this account will only be distributable, either directly or indirectly, to the extent that gains have been realised. c) Hedging reserve The hedging reserve includes cumulative net changes in the fair value of cash flow hedging instruments associated with highly probable future transactions. d) Adjustment of available-for-sale assets to fair value The Company has classified certain financial instruments as available for sale. In accordance with the applicable measurement criteria, any changes in the fair value of these instruments are recognised directly in the consolidated statement of comprehensive income until the financial asset is impaired or derecognised. Note includes a detailed description of instruments classified as available for sale and their value. Acerinox Group Page 64 of
68 12.4 Translation differences Details of movement in this account are included in the consolidated statement of changes in equity. Details of cumulative translation differences by company at the 2015 and 2014 reporting dates are as follows: (Expressed in thousands of Euros) GROUP COMPANIES ACERINOX (SCHWEIZ) A.G. 1, ACERINOX ARGENTINA S.A. -3,470-3,364 ACERINOX AUSTRALASIA PTY.LTD ACX DO BRASIL REPRESENTAÇOES, LTDA ACERINOX CHILE S.A ACERINOX COLOMBIA S.A.S ACERINOX INDIA PVT LTD ACERINOX MALAYSIA SDN. BHD ACERINOX METAL SANAYII VE TICARET L.S ACERINOX MIDDLE EAST DMCC (DUBAI) ACERINOX NORWAY A.S ACERINOX PACIFIC LTD. -4,816-3,474 ACERINOX POLSKA,SP Z.O.O -1,467-1,515 ACERINOX RUSSIA LLC ACERINOX SCANDINAVIA AB -2,249-2,828 ACERINOX S.C. MALAYSIA SDN. BHD -1,985-2,205 ACERINOX (SEA), PTE LTD ACERINOX SHANGAI CO., LTD. 3,028 2,509 ACERINOX U.K., LTD. -1,641-3,223 BAHRU STAINLESS, SDN. BHD 45,419 30,853 COLUMBUS STAINLESS INC. -150, ,105 CORPORACIÓN ACERINOX PERU S.A.C NORTH AMERICAN STAINLESS CANADA, INC 7,714 2,829 NORTH AMERICAN STAINLESS MEXICO S.A. DE C.V. 5,843 3,002 NORTH AMERICAN STAINLESS FINANCIAL INVESTMENTS, LTD 4 3 NORTH AMERICAN STAINLESS INC. 315, ,246 SUBTOTAL 212,928 18,097 ASSOCIATES BETINOKS PASLANMAZ ÇELIK A.S SUBTOTAL TOTAL 212,879 18,048 Acerinox Group Page 65 of
69 12.5 Details of reserves, profit/loss and non-controlling interests Details at 31 December 2015 and 2014 are as follows: (Expressed in thousands of Euros) Reserves Profit Profit attributable to noncontrolling interests Reserves Profit/(loss) Total noncontrolling interests Profit attributable to noncontrolling interests Total noncontrolling interests ACERINOX, S.A ACERINOX (SCHWEIZ) A.G ACERINOX ARGENTINA S.A ACERINOX AUSTRALASIA PTY. LTD ACERINOX BENELUX S.A. - N.V ACX DO BRASIL REPRESENTAÇOES, LTDA ACERINOX CHILE, S.A ACERINOX COLOMBIA S.A.S ACERINOX DEUTSCHLAND GMBH ACERINOX EUROPA S.A.U ACERINOX FRANCE S.A.S ACERINOX ITALIA S.R.L ACERINOX INDIA PVT LTD ACERINOX MALAYSIA SDN. BHN ACERINOX METAL SANAYII VE TICARET L.S ACERINOX MIDDLE EAST DMCC (DUBAI) ACERINOX NORWAY A.S ACERINOX PACIFIC LTD ACERINOX POLSKA, SP Z.O.O ACERINOX RUSSIA LLC ACERINOX SCANDINAVIA AB ACERINOX S.C. MALAYSIA SDN. BHD ACERINOX SHANGAI CO., LTD ACERINOX (SEA), PTE LTD ACERINOX U.K., LTD ACEROL - COMÉRCIO E INDÚSTRIA DE AÇOS INOXIDÁVEIS, UNIPESSOAL, LDA BAHRU STAINLESS, BDN. BHD COLUMBUS STAINLESS (PTY) LTD CORPORACIÓN ACERINOX PERU S.A.C INOX RE, S.A INOXCENTER CANARIAS S.A.U INOXCENTER, S.L.U INOXFIL S.A INOXIDABLES DE EUSKADI S.A.U INOXPLATE - COMÉRCIO DE PRODUCTOS DE AÇO INOXIDÁVEL, UNIPESSOAL, LDA METALINOX BILBAO S.A.U NORTH AMERICAN STAINLESS CANADA, INC NORTH AMERICAN STAINLESS MEXICO S.A. DE C.V NORTH AMERICAN STAINLESS FINANCIAL INVESTMENTS LTD NORTH AMERICAN STAINLESS INC ROLDAN S.A SUBTOTAL ASSOCIATES BETINOKS PASLANMAZ ÇELIK A.S SUBTOTAL TOTAL The two companies with non-controlling interests are Columbus Stainless, Ltd, 24% of which is held by the South African group IDC (Industrial Development Corporation) and Bahru Stainless Sdn. Bhd, the main non-controlling shareholder of which is Nisshin Steel Holding. Co, Ltd. with an interest of 30%, as well as Metal One Corporation, which has a 3% interest. Details of the assets of these two Group companies are as follows: Columbus's total assets amount to Euros 383 million (Euros 414 million in 2014), of which Euros 133 million are non-current (Euros 174 million in 2014). The assets of Bahru Stainless, Sdn. Bhd. amount to Euros 890 million (Euros 826 million in 2014), of Acerinox Group Page 66 of
70 which Euros 734 million is non-current (Euros 657 million in 2014). Neither of these companies distributed dividends in 2014 or Distribution of profit and shareholder remuneration The distribution of the profit for 2015 of the Parent, Acerinox, S.A., as proposed by the board of directors, to be submitted to the shareholders for approval at their annual general meeting is as follows: (Expressed in thousands of Euros) 2015 Basis of allocation: Loss for the year -20,531 Application: Prior years losses -20,531 At the board meeting held on 15 December, the directors resolved regarding shareholder remuneration to make a unique payment on July 2016 in the way and amount decided by the general meeting. The distribution of profit for the year ended 31 December 2014 was approved by the shareholders at their general meeting on 3 June The profit for the year, which amounted to Euros 16,408 thousand, were carried forward as prior years' losses Earnings per share Basic earnings per share are calculated by dividing the profit for the year attributable to equity holders of the Parent by the weighted average number of ordinary shares outstanding during the year, excluding own shares purchased and held by the Group. (Expressed in thousands of Euros) Profit attributable to the Group 42, ,329 Weighted average number of ordinary shares outstanding 263,964, ,168,276 Earnings/loss per share (in Euros) The weighted average number of shares has been calculated considering the shares outstanding both prior and subsequent to the capital increase and the number of days for which they had been outstanding. The Group has not issued any financial instruments that give access to capital or convertible debt and therefore diluted earnings per share are the same as basic earnings per share. Acerinox Group Page 67 of
71 NOTE 13 DEFERRED INCOME Movement in deferred income, comprising non-refundable government grants, which include emission allowances received free of charge (see note 2.6.d) and other capital grants, is as follows: (Expressed in thousands of Euros) Balance at 1 January 6,430 4,834 Grants awarded 4,352 1,583 Transfer to the income statement -3, Balance at 31 December 7,513 6,430 Deferred income primarily reflects grants received by Acerinox Europe for its research and development activities, and the balancing entry for emission allowances allocated free of charge under the National Allocation Plan and not been used during the year (see note 7). The Group considers that it has met or will meet all the conditions for receipt of these grants in the period stipulated and therefore no significant contingencies exist in connection with the grants obtained. NOTE 14 PROVISIONS AND CONTINGENCIES Details of non-current provisions included in the balance sheets for 2015 and 2014 are as follows: (Expressed in thousands of Euros) Employee benefits 10,509 11,204 Other provisions 3,189 2,502 TOTAL 13,698 13, Employee benefits Defined contribution plans In accordance with legislation in force in their countries of operation, certain Group companies make contributions to pension plans managed by external institutions. An expense of Euros 8,157 thousand has been recognised for the year under personnel expenses in respect of such plans (Euros 7,037 thousand in 2014) Defined benefit plans Details of provisions for employee benefits by type of commitment are as follows: (Expressed in thousands of Euros) Pension plans 2,497 2,136 Early retirement benefits Supplements Post-employment benefits 7,048 8,084 TOTAL 10,509 11,204 Acerinox Group Page 68 of
72 The amount recorded under pension plans comprises the contributions made by North American Stainless to pension plans for certain employees. These liabilities have been duly externalised and the Company has no additional obligations. The Company has recorded an asset for the same amount. Post-employment obligations reflect post-retirement medical care plans provided by certain Group companies to specified plan members. The Company performs actuarial valuations of the obligations every two years. The most recent valuation was performed this year. The assumptions made were as follows: discount rate of 9% (8.8% in accordance with the valuation performed in 2013), inflation of medical services 7% (6.9% in the prior valuation). The opening balance for the period reconciles with the closing balance as follows: (Expressed in thousands of Euros) Balance at 1 st of January 8,084 7,184 Contributions paid Service cost recognised in the income statement Interest cost Actuarial loss recognised in comprehensive income -188 Translation differences -1, Balance at 31 st December 7,048 8, Other provisions Movement in 2015 is as follows: (Expressed in thousands of Euros) Lawsuits CO 2 Other provisions Total Balance at 31 December , ,502 Charge to provision 1, ,488 Application 59-1,824-1,766 Reversal Translation differences Balance at 31 December , ,189 CO 2 These are provisions for CO 2 emissions during the year for which the emission allowances have not yet been surrendered (see note 7.1). Applications for the year are mainly due to the derecognition of emission allowances for 2015 totalling Euros 1,824 thousand (Euros 1,886 thousand in 2014) (see note 7.1). Litigation Litigation includes legal actions for immaterial amounts with the Port Authority of Algeciras and Électricité de France. Acerinox Group Page 69 of
73 Other provisions Other provisions reflect Inoxcenter, S.L.U. s estimate of the probable obligations totalling Euros 386 thousand arising from the workforce restructuring plan implemented in 2013 pursuant to Royal Decree-Law 5/2013. There has been no movement in this provision during the year. In addition, a provision of Euros 545 thousand was made in the year in relation to the environmental deductions applied to income tax from 2012 to 2014, in accordance with the requested validations, which were rejected by the Regional Government of Andalucía. The Company has submitted the pertinent objections Guarantees provided At 31 December 2015 the Group has provided guarantees to third parties, mainly government bodies, totalling Euros 31 million (Euros 25 million in 2014). This amount includes the guarantee provided to the Italian taxation authorities as a result of the assessment arising from the inspection, as explained in note Group management does not expect any significant liabilities to arise from these guarantees. NOTE 15 INCOME AND EXPENSES 15.1 Income and revenue Details of income and revenue in 2015 and 2014 are as follows: (Expressed in thousands of Euros) Sale of goods 4,211,615 4,377,025 Services rendered 9,811 3,264 Self-constructed assets 18,888 15,993 Operating lease income Gains on disposal of fixed assets 517 1,977 Reversal of impairment of intangible assets 0 2,835 Income from grants and subsidies Income from emission allowances 2, Other income 9,014 12,278 TOTAL 4,253,331 4,413,567 Acerinox Group Page 70 of
74 15.2 Personnel expenses Details of personnel expenses in 2015 and 2014 are as follows: (Expressed in thousands of Euros) Salaries and wages 281, ,103 Social Security 67,216 62,777 Contributions to employee benefit plans 8,157 7,037 Termination benefits 645 5,996 Change in the provision for employee benefits Other personnel expenses 9,922 9,466 TOTAL 368, ,164 The average headcount in 2015 and 2014, distributed by category, is as follows: University graduates Administrative staff Manual workers 5,080 4,999 TOTAL 6,769 6,753 At 31 December a breakdown of personnel by gender and category, including directors, is as follows: Board members Male Female 1 1 Senior management personnel Male 4 4 Female 0 0 University graduates Male Female Administrative staff Male Female Manual workers Male 4,908 4,867 Female TOTAL 6,756 6,715 At 31 December 2015 the number of employees in Spain with a disability of at least 33% is 52 (48 male and 4 female) (54 in 2014; 50 male and 4 female). As a general rule, all of the Spanish companies comply with the provisions of the General Law on the Rights and Social Integration of Disabled Persons. Acerinox Group Page 71 of
75 15.3 Other operating expenses Details are as follows: (Expressed in thousands of Euros) Rentals 9,324 8,069 Trading costs 162, ,129 Utilities 222, ,964 Maintenance 53,830 52,876 External services 72,807 66,506 Insurance 14,584 17,001 Other operating expenses 29,162 30,991 Taxes other than income tax 15,376 18,096 Losses on disposal of fixed assets Impairment of fixed assets Other extraordinary expenses TOTAL 580, ,960 Other operating expenses include Euros 3,745 thousand in bank fees and securities depository fees (Euros 3,075 thousand in 2014). NOTE 16 NET FINANCE COST Details of the net finance cost are as follows: (Expressed in thousands of Euros) Interest and other finance income 3,869 5,190 Income from dividends Gain on disposal of investments in consolidated companies 0 0 Gain on remeasurement of financial instruments to fair value (exchange rate insurance) ,427 Exchange gains 62,400 0 TOTAL FINANCE INCOME 67,580 72,728 Interest expense and other finance costs -51,175-61,802 Loss on remeasurement of financial instruments to fair value (exchange rate insurance) -60, Exchange losses 0-63,988 TOTAL FINANCE COSTS -111, ,640 NET FINANCE COST -43,992-53,912 Acerinox Group Page 72 of
76 NOTE 17 TAXATION At 31 December 2015 and 2014 the consolidated tax group in Spain comprises Acerinox, S.A., Acerinox Europa, S.A.U, Roldán, S.A., Inoxfil, S.A., Inoxcenter, S.L.U. and Inoxcenter Canarias, S.A.U Income tax expense Details of the tax expense are as follows: (Expressed in thousands of Euros) Current tax 51, ,503 Deferred tax -5,885 17,808 Total income tax 45, ,311 In 2015 the Parent received dividends from some of its foreign subsidiaries amounting to Euros 13.8 million (Euros 11.2 million in 2014). Under the corresponding double taxation conventions, some of these dividends were subject to withholdings at source amounting to Euros 826 thousand (Euros 1,123 thousand in 2014), which have been recognised under other taxes in the income statement. This account also reflects other withholdings on interest paid to Group companies. A reconciliation of the income tax expense recognised in the income statement and accounting profit is presented below: (Expressed in thousands of Euros) Net profit for the year 42, ,329 Non-controlling interests -16,573-13,642 Income tax 45, ,311 Other taxes 4,989 2,778 Profit before tax 76, ,776 Income tax at the local tax rate 28.00% 21, % 73,133 Effects on tax payable: Effect of tax rates of foreign operations 7,081 10,827 Non-deductible expenses 7,279 5,553 Tax incentives not recognised in the income statement -12,190-14,613 Non-taxable income Prior year adjustments 484 1,411 Adjustment of tax rates, deferred taxes 1,008 22,793 Unrecognised tax credits and impairment 18,865 11,193 Other 1,890 8,528 Total income tax 45, ,311 The amounts recorded under Adjustment of tax rates, deferred taxes in 2015 and 2014 essentially reflect the impact of the income tax reform in Spain, approved through Law 27/2014 of 27 November Details of the amendments under this reform and the impact on the Group are provided in note The tax rate resulting from the Group s consolidated income statement for 2015 was 66% (50% in 2014). This is explained by the combined effect of a higher contribution made to Group profits by the US company North Acerinox Group Page 73 of
77 American Stainless, which is taxed at a rate of 35%, and Euros 77 million of losses in certain companies whose tax credits have not been capitalised. In addition, impairment of tax credits amounting to Euros 2.8 million has been recognised in the year, either due to expiry before it was possible to offset them, or because there was no evidence that they could be recovered within a reasonable period, meaning that they should not be carried forward in the accounts. In 2014, the tax rate was primarily affected by the tax reform in Spain, as explained in note Excluding this effect, the tax rate would have been 9% lower in Deferred tax Movement in deferred tax assets and liabilities is as follows: (Expressed in thousands of Euros) Deferred tax assets Deferred tax Deferred tax liabilities assets Deferred tax liabilities Balance at 1 January 192, , , ,748 Expense/income for the period -9,103-14,988-34,114-16,306 Taxes recognised directly in equity -1, , Exchange rate fluctuations , ,403 Transfers 7,521 7,521 9,346 9,346 Other changes Balance at 31 December 188, , , ,285 The opening balance of deferred tax liabilities from 2014 has been adjusted as explained in note 2.1 The origin of deferred tax assets and liabilities is as follows: (Expressed in thousands of Euros) Assets Liabilities Net Goodwill -7,731-7,515-7,731-7,515 Property, plant and equipment 5,880 6, , ,880 Financial assets 1,574 1,574-16,886-21,593-15,312-20,019 Inventories , Other assets Provisions 6,262 7,009-11,673-11,556-5,411-4,547 Employee benefit plans 3,671 3, ,607 4,519 Financial liabilities 1,732 3, ,744 3,450 Other liabilities Non-deductible finance costs 29,922 24,969 29,922 24,969 Other tax deductions 29,856 30,236 29,856 30,236 Unused tax losses 172, , , ,214 Deferred tax assets/liabilities 251, , , ,409-38,276-21,155 Offsetting of deferred tax assets and liabilities -62,340-81,124 62,340 81,124 Deferred tax assets/liabilities 188, , , ,285-38,276-21,155 Deferred tax liabilities from property, plant and equipment are mainly due to the different tax and accounting depreciation criteria permitted by legislation in force in certain countries. These liabilities essentially relate to North American Stainless, Inc. and Columbus Stainless, Ltd. Acerinox Group Page 74 of
78 The reversal period for most of the deferred taxes is more than one year. The Group has Euros 5.4 million of unrecognised assets arising from temporary differences relating to accounting impairment of subsidiaries which is not tax-deductible. At 31 December 2015 and 2014, the Group has tax credits available as follows: (Expressed in thousands of Euros) Availability limit to 5 years 549 1,464 6 to 10 years to 15 years 5,670 6, to 20 years 0 0 No prescription date 166, ,902 TOTAL 172, ,214 The Group also has tax credits in respect of certain companies' losses of Euros 60,477 thousand (Euros 27,954 thousand in 2014), which, following conservative criteria, have not been recognised. The period for recovery of these credits is open ended, in accordance with prevailing tax legislation. On 22 June, the Group company Bahru Stainless received confirmation from the Malaysian Ministry of Economy of approval of fiscal aid in respect of investments made in the country in 2009 to This aid consists of income tax deductions for an amount equal to the investments made in certain items of property, plant and equipment, which amount to Malaysian Ringgit 1,811 million (Euros 385 million). The Company has already submitted the amendments to the tax returns accrediting the amount of aid receivable. As with tax credits relating to tax loss carryforwards, the Group has not recorded a deferred tax asset as it cannot estimate their recoverability. The Group company North American Stainless also has tax credits similar to those extended to Bahru Stainless, for investments in assets that contribute to recycling. These credits are deducted from the calculation of the Kentucky state tax and amount to Euros 524 million. The Company has used Euros 3,941 thousand in 2014 and expects to use Euros 2,078 thousand in the income tax return for The Group has capitalised Euros 14.6 million in tax credits in this regard, reflecting the amounts it expects to recover over the next five years. The Group prepares projections of profit and loss on an individual basis for all companies with available tax credits to determine whether the credits will be recoverable within the timeframe specified under the applicable legislation, and never in a period exceeding that specified in the budget. Furthermore, the Group takes into account the limitations regarding offsetting tax loss carryforwards stipulated in certain jurisdictions. The Group also assesses the existence of deferred tax liabilities against which tax losses may be offset in the future. Based on these criteria, the directors consider that all capitalised tax credits are likely to be recovered through future taxable income, in a reasonable period not exceeding that permitted by the corresponding local authorities in each country. The Group has performed a sensitivity analysis of the estimates made justifying the recoverability of the tax losses carried forward, in order to determine the potential risk of their not being recoverable. This analysis, applied to 67% of tax credits carried forward, determined that even if estimated results are reduced by 50% the Group could recover all of its tax losses in a period of no more than 10 years. The estimates of results made by the Group reflect financial and macroeconomic circumstances as well as the stainless steel market. Key assumptions such as exchange rates and raw material prices are therefore extrapolated using highly conservative criteria, referring to the most recent market values at all times. These budgets are approved by Group management. Acerinox Group Page 75 of
79 17.3 Legislative amendments Tax reform in Spain On 27 November 2014 the new Corporate Income Tax Law 27/2014 was approved, introducing completely new legislation. The Law repealed the revised Royal Legislative Decree 4/2004 of 5 March 2004, which was previously in force. Of the numerous measures introduced by the new law, those which most significantly affect the Group are as follows: - A progressive reduction of tax rates, from the 30% in force until 2014, to 28% in 2015, and 25% from 2016 onwards. Although this measure is positive as it reduces the tax burden it had a very negative impact on the Group's income statement for 2014, as it also reduced the balance of deferred tax assets. This measure continued to have an unfavourable effect in 2015, due to use at the prevailing rate of 28% of deferred tax liabilities that were recognised at a rate of 25% in 2014 as at that time it was not possible to estimate the amount recoverable in the year. The impact on the income statement for the year amounted to an additional Euros 1 million in tax expenses. As stipulated in the Group's accounting policy for measurement of deferred tax assets and liabilities (note 2.16), in 2014 the Group measured its deferred tax assets and liabilities in accordance with the new tax rates approved, taking into account the period in which they were expected to be recovered, provided that it can be easily estimated, except for deferred tax assets arising from tax losses, which were adjusted for the 25% tax rate. The impact on the income statement was as follows: (Expressed in thousands of Euros) Balances prior to the reform Adjustments to tax rates Balances at 31/12/2014 Tax loss carryforwards 137,722-22, ,945 Deferred tax assets (temporary differences) 45,214-6,330 38,884 Deferred tax liabilities (temporary differences) -39,025 6,427-32,598 Total impact on profit or loss -22,680 Deferred tax assets (temporary differences) 4, ,740 Deferred tax liabilities (temporary differences) Total impact on reserves Limits on offsetting of tax losses, eliminating the time limit. The law establishes a limit of 70% of taxable income for offsetting of tax losses, prior to application of the capitalisation reserve. In 2015, the transitional limit of 25% was maintained for large companies. In 2016, the limit has been set at 60%. The Group assessed the possible impact of this measure. However, in view of the budgets approved by management, no problem was identified with recovery in 2014 or The Group expects to recover all of the tax losses carried forward by the consolidated tax group in less than seven years. - Capitalisation reserve. The law introduces a reduction in taxable income equal to 10% of the increase in capital and reserves for the year, if this is maintained for a period of five years and a special non-distributable reserve is appropriated in the amount of the reduction. This reduction may not exceed 10% of the gross taxable income. Shareholder contributions and capital increases are not taken into account when calculating the increase. The consolidated tax group has not benefited from this measure in the year, as the tax loss generated is less than the total amount of dividends the Group expects to distribute. - Simplification of the tax depreciation/amortisation schedules. The number of items has been reduced to 30. This measure had no material impact on the Group. Acerinox Group Page 76 of
80 - Changes to international double taxation relief. New rules have been established for exemption of dividends and similar income. This measure has no impact on the Group. - Changes to the consideration of certain expenses as non-deductible. - Promotion of the deduction for R&D&i and elimination of other existing deductions. - The temporary limit on deductibility of 30% of depreciation/amortisation, stipulated for 2013 and 2014, has been eliminated and a new deduction has been introduced on tax due for 2015 and thereafter to alleviate the impact of the reduction in tax rates. - A limit of 5% has been established for deduction of goodwill and intangible assets with indefinite useful lives. In 2015, the limit on deductibility of goodwill remains at 1% as in past years. - Amendments to the regulations applicable to related party transactions have been introduced, primarily associated with documentation requirements. Other legislative amendments In 2015 and 2014 the following tax rates applicable to certain Group companies were amended pursuant to local legislation: - U.K: progressive modifications to the income tax rate. The applicable rate will be 20% from 1 April 2016 onwards, 19% from 2017 and 18% in Portugal: the tax rate has been reduced from 25% to 23% from 2014 onwards and 21% from 2015, although a 3% increase has been provided for where profits exceed Euros 1.5 million. Simultaneously, the period for recovering tax loss carryforwards has been extended from 6 to 12 years, establishing a limit for offsetting tax losses of 70% of taxable profit from 2014 onwards. The tax losses that the Group had carried forward in Portugal expired in Impairment has been recorded for the tax credits which it was not possible to recover, with an impact of Euros 194 thousand on profit and loss. - Chile: progressive increase in tax rates, from 17% in 2013 to 27% from 2018 onwards. The applicable rate in 2015 was 22.5% and in 2016 it will be 24%. The Group adjusted its deferred tax assets and liabilities to the new tax rates, taking the difference to the income statement for that year. Certain temporary modifications introduced in Royal Decree 12/2012 and Royal Decree 20/2012 were extended to cover 2014 and These include capping the deductibility of goodwill at 1% of the goodwill amount, extending the limit of R&D tax credits and restricting the offsetting of tax loss carryforwards (to 25% of taxable income declared in the case of the consolidated Group). The amendments to the calculation of instalment payments such as the minimum payment of 12% of accounting profit and the inclusion in taxable income of 25% of all dividend and interest income that entitles the recipient to the exemption set forth in article 21 of the Income Tax Law were also extended to 2014 and Current tax At 31 December 2015 the Group has a current tax asset of Euros 17,394 thousand (Euros 18,390 thousand in 2014) and a current tax liability of Euros 1,092 thousand (Euros 35,997 thousand in 2014) Tax inspections and years open to inspection In accordance with current legislation, taxes cannot be considered definitive until they have been inspected and agreed by the taxation authorities or until the inspection period has elapsed. The new Income Tax Law provides for a new prescription period for tax loss carryforwards declared in the tax returns in the years open to inspection. The new prescription period has been established as ten years from the day following Acerinox Group Page 77 of
81 the deadline for filing the tax return or self-assessment for the tax period in which the right to offset arises. Once this period has elapsed, taxpayers must submit the assessment or self-assessment and the accounting records, as well as evidence that they have been entered at the Mercantile Registry during the aforementioned period, in order to accredit that these tax loss carryforwards and the amount thereof are appropriate. At 31 December 2015 and 2014 Acerinox, S.A. and the companies in the consolidated tax group have open to inspection by the taxation authorities all the main applicable taxes for the following years: Tax rate Income tax 2008 to to 2013 Value added tax 2012 to to 2014 Customs duties 2012 and and 2014 Personal income tax 2012 to to 2014 The other Group companies have open to inspection the taxes for the years stipulated by their respective local legislation. The directors of the Company and subsidiaries do not expect that any significant additional liabilities would arise in the event of an inspection. The situation with regard to tax inspections underway or for which appeals are open at the end of 2015 is as follows: Italy In 2011 the subsidiary Acerinox Italia S.r.l. underwent an inspection of taxes for 2007, 2008 and On completion of this inspection the inspectors issued their report, on the basis of which it looked likely that the taxation authorities would impose an adjustment in relation to transfer prices applied in transactions between Acerinox Italia S.r.l. and the Group s manufacturing companies. On 27 December 2012 the Company received the assessment notice for 2007, primarily indicating transfer pricing adjustments to taxable income in relation to sales and purchases with Group factories. The resulting tax assessment amounted to Euros 8.4 million, plus Euros 1.3 million in interest. No penalties were imposed. The Company challenged this 2007 assessment in an appeal filed before the provincial tax commission of Milan on 23 May 2013, in which it was also requested that a stay be placed on the tax debt until completion of the proceedings. This stay was accepted by the Italian authorities, subject to the pledging of a Euros 3.8 million bank guarantee. On 9 December 2013 the Group applied to the Spanish and Italian authorities for the elimination of double taxation pursuant to Convention 90/436/EEC of 23 July As most of these transactions are with companies resident in Spain (Acerinox S.A. and Roldán, S.A.), any adjustment relating to transfer prices is protected by Convention 90/436/EEC on the elimination of double taxation in connection with the adjustment of profits of associated enterprises. This Convention guarantees the elimination of double taxation due to transfer pricing adjustments within the European Union. Following negotiations between the Spanish and Italian taxation authorities, or an arbitrator s ruling if necessary, this initial adjustment, or whichever adjustment is agreed, will therefore be neutralised by a counter-adjustment in the other member state. Although the financial effect of the time that elapses until completion of the proceedings is not specifically covered by the Convention, when the Spanish authorities record an adjustment in favour of the taxpayer, this includes accrued interest, or else another method is used to ensure that the financial effect does not entail a charge for the taxpayer. The Spanish Directorate-General for Taxation and the Italian authorities have confirmed their acceptance of the initiation of the procedure. This should therefore be concluded within approximately two years from the date of acceptance, although the period is often slightly longer. The assessment for 2008 was received on 13 December 2013, for this company s sales and purchases with the Group s factories. The amount payable in this case is Euros 7.3 million plus Euros 1.2 million in interest. The pertinent submissions were filed during 2014, as was a request for a stay on the debt. Guarantees totalling Euros 3.6 million were pledged in February 2015, to secure the stay. The assessment for 2009 was received on 7 November 2014, which also indicated transfer pricing adjustments. The additional assessment raised in Italy is Euros 953 thousand plus interest. No penalties have been imposed. The Group has followed the same procedure as with previous assessments. It has requested a stay on payment, Acerinox Group Page 78 of
82 providing the corresponding bank guarantees for an amount of Euros 453 thousand, also filing the appropriate submissions to the Milan provincial tax commission. The aforementioned procedure for elimination of double taxation also applies to the double taxation applied to the Group in 2008 and Italian legislation requires that internal appeals be suspended to accept the international arbitration proceedings to eliminate double taxation. Therefore, after it was announced that the proceedings had been accepted, the Group suspended the internal claims relating to transactions with countries in the European Union. Initiation of the mutual agreement procedure allows the Company to reduce the bank guarantees provided, which will be requested in With regard to transfer pricing adjustments, the Company considers it highly unlikely that the final amount of the obligation will be that shown in the assessments and it is difficult to calculate the definitive amount as the inspectors have failed to take into account numerous arguments based on both OECD transfer pricing regulations and Italian (and Spanish) law, such as: - The comparability analyses presented by the Company, demonstrating that the prices applied by Acerinox to independent third parties are in line with those applied to the Italian subsidiary, have not even been considered by the Italian taxation authorities. - No analysis or consideration whatsoever has been made of the economic market and industry conditions, which, based on the aforementioned regulations, are legitimate justification for the companies having returned a loss. - The years of reference used for comparison in the analyses performed are clearly periods in which the economic cycle was noticeably different from the one under analysis, leading to an obvious distortion of results. - There are other minor considerations indicative of serious flaws in the businesses used for comparison. - It is an internationally recognised basic principle that transfer pricing is not an exact science and it is necessary to weigh up the circumstances of each individual case. Even so, this analysis does not give a single value, but rather a range of values, all of which can be considered arm s length prices. The Company can also instigate several procedures to reduce/eliminate these adjustments: - Court appeal in Italy - Court settlement - Mutual agreement procedure application for elimination of double taxation related to the adjustment of profits between associated enterprises under Convention 90/436/EEC of 23 July On 23 March 2014 the Company was notified of the ruling in its favour, in relation to the assessment of transfer prices for The Spanish taxation authorities were also notified of the ruling and filed no submissions. The proceedings were therefore considered to be completed, with a ruling in favour of the Company. The corrections required by this tax assessment include adjustments to the transfer prices applied in transactions between Acerinox Italia and the Spanish Group company Roldan, S.A. As a result, Euros 1 million was recognised in other operating income in The Company expects the same criteria and arguments that led the courts to find in its favour in those cases to be applicable to the assessments for 2007, 2008 and For all of the above reasons, and based on the information available to date, although this company could be required to adjust certain amounts by the Italian taxation authorities, it considers that it would be difficult to determine the amounts of these adjustments. At the reporting date and the date of presentation of these annual accounts, the adjustments derived from the inspection in Italy are therefore considered a contingent liability. In addition to the transfer pricing adjustments for 2007, 2008 and 2009, the assessment contained less significant adjustments for 2006 to 2009 reflecting the consideration of the interest on a loan received by the Company from a Group company registered in Switzerland as non-deductible, as well as applying withholdings which the Company did not apply, in accordance with the Double Tax Treaty between Italy and Switzerland. The Company also filed submissions in relation to these matters. The Provincial Court of Milan has rejected the Company's claim in relation to interest for 2006 and Nonetheless, the Company considers that there are sound arguments against the conclusions of the provincial court and therefore intends to lodge an appeal with the Commizionne Regionale in the next 6 months. The amount of the adjustment is Euros 425 thousand and the maximum risk for all years would be Euros 1.4 million, already included in the amounts for each year explained in the above paragraphs. The Company considers the possibility of these amounts becoming payable to be remote. Acerinox Group Page 79 of
83 Germany As regards the inspections of taxes for 2007, 2008, 2009 and 2010 initiated in 2011 at the Group subsidiary Acerinox Deutschland, GmbH, the assessments of the income tax, solidarity surcharge and VAT for 2007 to 2010 were received on 8 July The assessments mostly indicate adjustments to taxable income for transfer pricing adjustments for sales and purchases between the subsidiary and the Group s factories. No penalties have been imposed. The Company filed the pertinent submissions on 8 August The amount payable in Germany was Euros 384 thousand for the VAT assessments, Euros 2,804 thousand for income tax plus the solidarity surcharge and Euros 489 thousand in interest. These amounts were paid in In the event that the ruling on the objections submitted is in favour of the Company, the German authorities will be required to repay these amounts, include 6% in interest. As is the case with Italy, as most of these transactions are with the companies resident in Spain, any adjustment relating to transfer prices is protected by Convention 90/436/EEC on the elimination of double taxation in connection with the adjustment of profits of associated enterprises. This Convention guarantees the elimination of double taxation due to transfer pricing adjustments within the European Union. Following negotiations between the Spanish and German taxation authorities, or an arbitrator s ruling if necessary, this initial adjustment, or whichever adjustment is agreed, will therefore be neutralised by a counter-adjustment in the other member state. The Company has submitted a request for elimination of double taxation in both Spain and Germany and has received confirmation from the Spanish taxation authorities of their acceptance. In the case of Germany, a request for additional information was recently received for the proceedings to be approved. The requested information will be sent before the deadline and there do not appear to be any legal reasons to reject the proceedings. Malaysia On 24 and 28 December 2014, notice was received of the start of an inspection of taxes for 2010 and 2011 of the Group company Bahru Stainless Sdn. Bhd. Subsequently, on 4 March 2015, notification was received that the inspection was to be extended to 2012 and All requested information has been submitted to date. On 25 November a notification was received that the inspection had been postponed until further notice. In addition, on 20 January 2015 notification was received of the commencement of an inspection of Acerinox SC Malasia, Sdn. Bhd. in relation to transfer prices in the period from 2010 to All the information requested has been submitted and to date, no report on the conclusions has been received which would allow conclusions to be reached with regard to any adjustments. During 2013 the Group company Acerinox Malasia Sdn, Bhd. underwent an inspection of the period. The inspection has been completed and no adjustments are required. Spain On 15 April 2015 the Group was notified of the commencement of an inspection of its import duties and VAT for The inspection was completed on 27 October The Company did not accept the assessment with regard to the external tariff in an amount of Euros 24 thousand plus interest or that concerning VAT on imports amounting to Euros 182 thousand. Both amounts have already been settled. The tax payment arises from the inclusion by the Spanish taxation authorities of services relating to the installation and assembly of machinery imported from Japan as an increase in the value of the imported goods for customs purposes. On 27 May 2014 the tax assessments were accepted, with no adjustments required, thereby concluding the inspection of Acerinox, S.A.'s import duties and VAT for Furthermore, on 8 October, a separate tax assessment of the same taxes for 2012 was accepted by Acerinox Europa S.A.U., with no adjustments required, thereby concluding the inspection of this company's taxes. On 7 January 2016, the Economic-Administrative Tribunal issued a ruling upholding in full the submissions filed by Acerinox, S.A. against the assessment decisions arising from the inspection of rights, antidumping and VAT for 2009, 2010 and At the date of authorisation for issue of these accounts, the period in which the Spanish taxation authorities could have filed submissions has elapsed. All of the assessments issued in relation to these items are therefore cancelled: Euros 925 thousand for antidumping, Euros 649 thousand of VAT on imports and Euros 41 thousand of recoverable external tariffs. The amounts relating to antidumping and import duties were Acerinox Group Page 80 of
84 guaranteed. Over the coming days, the rebate agreements should be received. The Company had not recorded any provisions for these items. South Africa On 24 June 2014 notice was received of the initiation of a tax inspection of transfer prices for 2010 to 2012 in the Group company Columbus Stainless (Pty) Ltd. In the course of the year the assessments were received, finalising the inspections. The assessments stipulate adjustments to taxable income in relation to transfer prices, amounting to Euros 32 million. These adjustments do not result in any payable amounts in South Africa, as the Company has carried forward tax losses which exceed the amount of the assessment. The assessment does not impose any penalties. Columbus Stainless has filed submissions relating to 2010 to the administrative courts and is preparing the submissions regarding 2011 and The Company considers the facts on which the proposed adjustments are based to be incorrect, and also considers the interpretation of the applicable legislation to be erroneous, as this legislation is not in line with the principles or any of the methods approved by OECD guidelines. Columbus has adopted the same OECD-approved transfer pricing method as that applied by the rest of the Group. As this transfer pricing adjustment relates to the sales from South Africa to Group companies, primarily in Europe, the Group is also considering provided that no rectifications are made to the internal claims prior to the final assessment requesting elimination of double taxation in accordance with the double taxation treaties between South Africa and the countries in which the affected distributors are registered (essentially European distributors). Portugal In 2011 a tax inspection of 2008 and 2009 also took place in the Group company Acerol Ltda. in Portugal. This inspection gave rise to a transfer pricing adjustment for sale and purchase transactions between Acerol, Ltda and the Group s plants, primarily Acerinox, S.A. and Roldán, S.A. The adjustment to taxable income amounted to Euros 10 million. However, as the subsidiary had tax losses of Euros 6.7 million pending offset, the amount paid totalled Euros 708 thousand, including interest of Euros 32 thousand. These assessments considered that no offence had been committed and, accordingly, no tax penalties were imposed. On 31 July 2012 an application was submitted to the Directorate-General for Taxation through the European Arbitration Convention, requesting the elimination of double taxation arising from the tax assessments issued in Portugal pursuant to Convention 90/436/EEC of 23 July The Spanish authorities have already issued their report to the Portuguese authorities and are awaiting the decision. NOTE 18 RELATED PARTY BALANCES AND TRANSACTIONS 18.1 Identity of related parties The consolidated financial statements include transactions with the following related parties: - equity-accounted associates; - key management personnel of the Group and members of the boards of directors of Group companies, - significant shareholders of the Parent. Transactions between the Company and its subsidiaries, which are related parties, are carried out in the ordinary course of the Company's business and have been eliminated on consolidation. Therefore, they are not disclosed in this note Related party balances and transactions All transactions between related parties are carried out at arm s length, and are listed below. a) Associates No transactions were carried out with associates in 2015 or Acerinox Group Page 81 of
85 b) Directors and key management personnel Remuneration received by the members of senior management who do not hold positions on the board of directors of Acerinox, S.A. amounts to Euros 2,054 thousand. Euros 1,055 thousand of this amount reflect salaries, Euros 102 thousand are allowances and variable remuneration of Euros 897 thousand corresponding to the prior year's profit. In 2014, the four senior management personnel received Euros 1,510 thousand, of which Euros 979 thousand reflected salaries, Euros 86 thousand were allowances and variable remuneration of Euros 445 thousand corresponding to prior year s profit. The difference, in terms of salaries, is due to the replacement of a member of senior management In 2015 members of the board of directors of Acerinox, S.A., including those that hold key management positions and sit on the boards of other Group companies, received Euros 2,387 thousand in fixed remuneration for attending board meetings and fixed and variable salaries (the latter based on the results from the prior year), of which Euros 1,356 thousand reflect salaries and fixed board member remuneration, Euros 381 thousand are allowances and variable remuneration of Euros 650 thousand corresponding to prior year s profit. In 2014, the remuneration received totalled Euros 2,036 thousand, of which Euros 1,360 thousand reflected salaries and fixed remuneration, Euros 384 thousand were allowances and variable remuneration of Euros 292 thousand corresponding to prior year s profit. Commitments with all senior management, totalling Euros 1,555 thousand in 2015, have been accounted for correctly and are adequately covered through insurance contracts (Euros 1,422 thousand in 2014). No commitments have been contracted with directors representing shareholders or independent directors of Acerinox, S.A. At 31 December 2015 no advances or loans have been extended to the members of the board of directors or senior management and the Company has no balances receivable from or payable to these executives. The directors of the Company and their related parties have had no conflicts of interest requiring disclosure in accordance with article 229 of the Revised Spanish Companies Act. c) Significant shareholders The Group has entered into the following financing transactions with Banca March, part of the March Group (shareholder of Corporación Financiera Alba), all under market conditions: - Credit facilities up to a limit of Euros 4 million, of which Euros 0 million have been drawn down. - Guarantees up to a limit of Euros 0.06 million, of which Euros 0.06 million have been drawn down. - Confirming (reverse factoring) facilities for Euros 16 million, of which Euros million has been drawn down. - Non-current loan of Euros 30 million, which has been drawn down in full. - Factoring facilities for Euros 70 million, of which Euros million have been drawn down. In 2014 the Group contracted the following financing transactions with Banca March, all of which were under market conditions: - Credit facilities up to a limit of Euros 4 million, of which Euros 0 million have been drawn down. - Guarantees up to a limit of Euros 0.06 million, of which Euros 0.06 million have been drawn down. - Confirming (reverse factoring) facilities for Euros 16 million, of which Euros 3.99 million has been drawn down. - Non-current loan of Euros 30 million, which has been drawn down in full. - Factoring facilities for Euros 70 million, of which Euros million have been drawn down. Details of the Group s transactions with Banca March in 2015 and 2014 are as follows: (Expressed in thousands of Euros) Interest cost 863 3,004 Fee and commission expenses TOTAL 915 3,104 Acerinox Group Page 82 of
86 The terms and conditions of the loans and financial transactions listed in the preceding paragraph are in accordance with market conditions. Insurance premiums and other transactions totalling Euros 8,967 thousand (Euros 10,672 thousand in 2014) have been brokered through March J.L.T. Correduría de Seguros (a March Group company). The Acerinox Group has also carried out the following commercial transactions with its shareholder Nisshin or other companies belonging to its Group: (Expressed in thousands of Euros) Dividends Finance costs Sales of goods 1, Trade and other receivables Services rendered NOTE 19 AUDIT FEES Details of fees and expenses accrued by KPMG Auditores S.L. (principal auditor) and associate firms for services provided to the consolidated companies are as follows: (Expressed in thousands of Euros) 2015 KPMG Auditores, S.L. KPMG International TOTAL Audit services Tax advisory services Other services TOTAL 395 1,124 1, KPMG Auditores, S.L. KPMG International TOTAL Audit services Tax advisory services Other services TOTAL 411 1,031 1,442 The amounts detailed in the above table include the total fees for services rendered in 2015 and 2014, irrespective of the date of invoice. Other audit firms invoiced the Group fees and expenses for audit services amounting to Euros 88 thousand in 2015 (Euros 84 thousand for audit services in 2014). Acerinox Group Page 83 of
87 NOTE 20 EVENTS AFTER THE REPORTING PERIOD Winding up of Acerinox Norway AS The Group plans to wind up Acerinox Norway AS in the first quarter of The company is fully owned by Acerinox, S.A. The Group has been carrying out the required legal procedures to wind up the company since November The company previously acted as a commission agent for Acerinox Scandinavia AB, registered in Sweden, for sales in Norway. Acerinox Scandinavia has absorbed the personnel of the entity that is to be wound up. The share capital of Acerinox Norway AS amounts to Euros 11 thousand and accumulated reserves total Euros 610 thousand. The carrying amount of the interest in this company amounts to Euros 12 thousand. Acerinox, S.A. will therefore record a gain in the coming year. Sale of investment property In January 2016, the Group company Inoxcenter, S.L.U. disposed of one of its industrial bays, classified as investment property. The carrying amount of the industrial bay was Euros 2 million and its selling price was Euros 3,750 thousand. In December 2015, an advance of Euros 100 thousand was received, recorded under other current financial liabilities. Antidumping in the United States The United States government has accepted a request for antidumping measures against imports of stainless steel from China. Acerinox Group Page 84 of

88 ANNUAL REPORT 2015
89 Index Acerinox in Numbers..... The Acerinox Group Worldwide. 1. Acerinox and its Production Companies Acerinox Europe North American Stainless Columbus Stainless Bahru Stainless Roldán and Inoxfil Distribution Companies Share Capital, Corporate Governance and Human Capital Share Capital Corporate Governance The Board of Directors and its Committees Shareholders' Meeting Management Committee and Main Executives of the Group's Companies Main Regulations Governing the Group Human Capital Annual Corporate Governance Report Global Strategy Global Position Excellence Plans R+D+i Investments in Fixed Assets Risk Management New Strategic Plan Raw Materials and Main Markets Evolution of Raw Materials Main Stainless Steel Markets Global Production of Stainless Steel
90 The Year of Acerinox in Numbers 1. Production Results Share Price Evolution Shareholder Remuneration 5. Average term of payment to suppliers The Acerinox Group s Individual Companies The Acerinox Group s Commercial Companies Spanish Commercial Companies Foreign Commercial Companies
91 Acerinox in Numbers 3
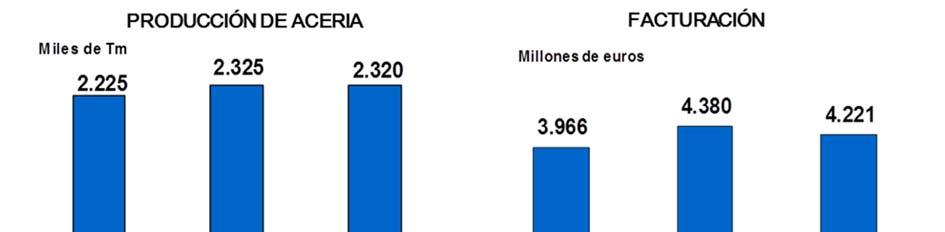
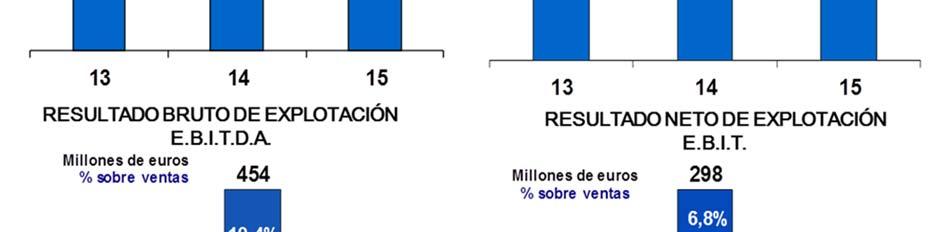
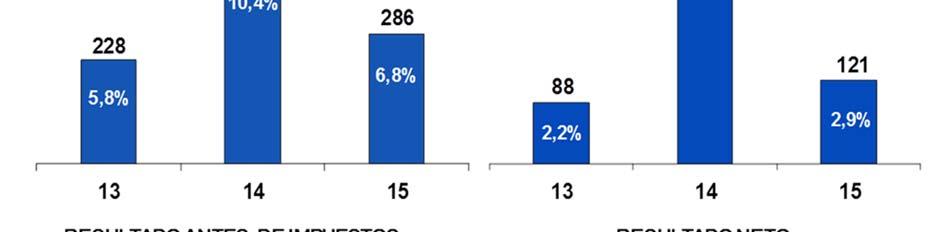
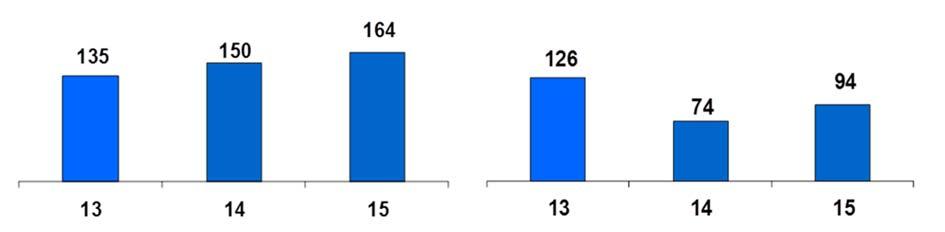
92 4
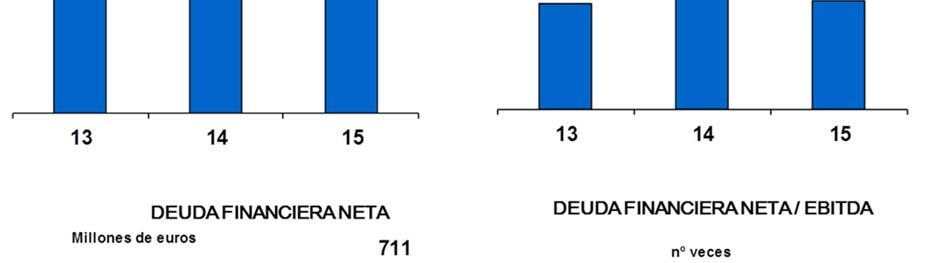
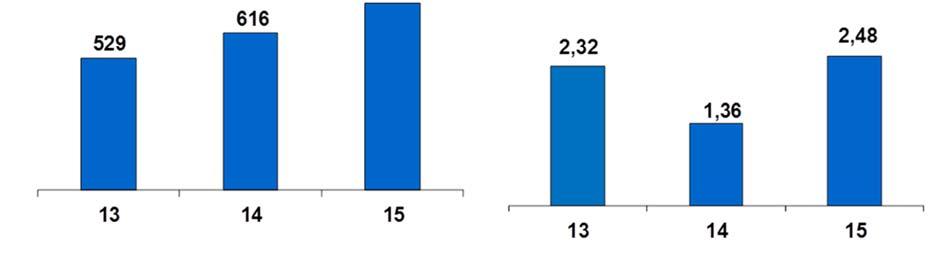
93 5
94 The Acerinox Group Worldwide 6
95 1. The Acerinox Group Worldwide 1. ACERINOX AND ITS PRODUCTION COMPANIES Acerinox is one of the world's most competitive companies in terms of production and selling stainless steel. It is the only company with four factories on four different continents, having reached that size essentially via organic growth by creating and expanding its factories and trade network. Acerinox was founded in Spain in 1970 and its goal, from the very start, was the export market. It is currently one of the Spanish companies with the greatest international presence. It is also one of the leading European companies in its industry, and the clear market leader in the United States and in Africa. Since 2011, it is also the only stainless steel producer in Malaysia. One of the most remarkable characteristics of Acerinox S.A. is the longstanding continuity of its chief shareholders. This connection, in the case of Nisshin Steel Co. Ltd., dates back to the creation of the company itself, in 1970, and in the case of Omega Capital in 1998, Corporación Financiera Alba in 2001 and IDC in The group's corporate structure is organised around the parent company, Acerinox S.A., on which 40 companies from different countries worldwide depend. The details of those companies are included in chapter 2 of this Management Report. The Group's factories are located in Campo de Gibraltar (Spain), Ponferrada and Igualada (Spain), Ghent (Kentucky, USA), Middelburg (Mpumalanga, South Africa) and Johor Bahru (Malaysia). The Group also has other establishments such as warehouses, service centres and representative offices in 35 countries, from where it sells its products in more than 80 countries on all five continents. 1.1 ACERINOX EUROPE - CAMPO DE GIBRALTAR FACTORY (SPAIN) This factory, which belongs to Acerinox Europe SAU, is one of the most competitive factories in Europe. The company was created as a split-off from the parent company, which took place in 2011 for strategic reasons. The factory has been the headquarters for Acerinox Europe SAU since This change in the headquarters turned the factory in Campo de Gibraltar into one of the main employers and exporters in the region of Andalusia. Construction of the factory began in 1970 and expansion and improvement projects have been a constant ever since turning it into the benchmark it is 7
96 today, both for the Group and the entire industry. In recent times, The Board of Directors have ratified this factory's strategic importance by approving considerable investments for an amount of 140 million euro, already started in The Campo de Gibraltar factory is also the hub of a large part of the know-how for which the Group is known. The technical support, work and producing methods adopted by successive factories belonging to the Group. 1.2 NORTH AMERICAN STAINLESS - GHENT FACTORY (KENTUCKY - USA) Belonging to North American Stainless (NAS), the Ghent factory is the largest owned by the Group, and is the reason behind its leading position in the American market. It came into being as a result of a joint venture in 1990, and currently belongs entirely to Acerinox, S.A. This factory leads the American market in terms of production, product quality and profitability. As with the factory in Campo de Gibraltar, the Board of Directors of Acerinox, S.A. recently approved considerable investments, amounting to 116 million, in order to broaden the range of products that it can manufacture and consolidate its position in the American market. 1.3 COLUMBUS STAINLESS - MIDDELBURG FACTORY (MPUMALANGA, SOUTH AFRICA) It is practically the only example of non-organic growth to be found in the Group, as the factory already existed prior to its purchase by Acerinox, S.A. in The Group owns the majority of its capital (76%). The remaining 24% is owned by the South African government via its shell company, IDC, which also participates in its Board of Directors in a similar proportion. The location of the Middleburg factory is motivated by the proximity of raw material transformation and extraction centres. It is the sole stainless steel manufacturing plant in the entire continent and, as well as supplying the African market, it also exports globally via the Group's sales network. 8
97 1.4 BAHRU STAINLESS - JOHOR BAHRU FACTORY (MALAYSIA) This factory is a sign of the Group's efforts to consolidate its position in the growing Asian market. It was established in 2009 and has enabled Acerinox to become the leading, and to this day, the only Malaysian stainless steel manufacturer. The factory's production is currently limited to cold-rolled products, which means that it must source semis or partially finished products from the Group's other factories, mainly from Campo de Gibraltar and Middleburg, which contributes to an increased use of said factories' equipment. Its production levels are evolving adequately, both in terms of quantity and of quality. Since 2015, it has fully integrated the Group's Excellence Plans, with regard to which there is more information provided in this Management Report. 1.5 ROLDAN AND INOXFIL - FACTORIES IN PONFERRADA AND IGUALADA (SPAIN) The long products factory in Ponferrada is the Group's oldest, as it existed before Acerinox, S.A. was founded. The overwhelming majority of the capital of Roldan, S.A. (99.76%) belongs to Acerinox. Inoxfil is a part of the Group through Roldan, which owns 100% of its shares. The factories in Ponferrada (Roldán, S.A.) and Igualada (Inoxfil, S.A.) are specialising in long products. Roldan produces wirerod, angles and bars starting from the billets produced in Campo de Gibraltar. Inoxfil is a wire-drawing factory or wire producer. Roldan thrives on long products of the factory in Campo de Gibraltar, whereas Inoxfil thrives on the wire rod of Roldán in Ponferrada. 2. DISTRIBUTION COMPANIES As of 31 December 2015, our Group's sales network is made up of 39 companies, 18 service centres, 26 warehouses and 31 sales or representative offices, not to mention the sales representatives in various countries where there are no permanent offices. In 2015, the Group opened a new sales office in South Korea. The largest market, in terms of the Group's sales turnover in 2015, was the United States, followed by Spain, Germany and South Africa. 9


98 Acerinox is present in 37 countries in all five continents, and sells its products in more than 80 countries worldwide. 10
99 2. Share Capital, Corporate Governance and Human Capital 1. SHARE CAPITAL At the end of 2015, Acerinox's Share Capital totalled 66,676,848.25, divided into 266,707,393 shares with a nominal value of 0.25 each. On 20 July 2015, a total of 5,005,253 new shares of Acerinox, S.A. were floated on the Madrid and Barcelona Stock Exchanges as a result of the capital increase approved at the Ordinary General Shareholders Meeting of 3 June 2015, held to set up the scrip dividend system (sprip dividen). All of the shares are listed on the official stock markets in Madrid and Barcelona, and are traded on the Continuous Market. As of 31 December 2015, Acerinox, S.A. had a total of 38,669 shareholders. 2. CORPORATE GOVERNANCE In 2015, the Acerinox Group, via its listed parent company, Acerinox, S.A., began the major process of adapting its corporate governance to the provisions of the recent Spanish Capital Companies Act, as well as to the recommendations made in the new Corporate Governance Report for Spanish Listed Companies. These changes have essentially involved improvements in the Group's corporate governance, mainly thanks to the strengthening of the role of the Board of Directors' committees, with more clearly defined responsibilities and a higher number of independent board members on them. The Board of Directors also decided to set in motion all procedures designed to meet the highest number of the Recommendations detailed in the Corporate Governance Report. Details of said levels of compliance can be found in the Annual Corporate Governance Report hosted on our website The process of adapting the Company's Articles of Association, as well as the Regulations governing the General Shareholders' Meeting, the approving of a specific regulations concerning the relationship between the Board of Directors and the Chief Executive Officer, as well as a series of operational policies -a process that must be finished in are all aimed at improving corporate governance and promoting transparency in decision-making, information aimed at shareholders and the relationship with stakeholders. 11
100 Furthermore, in 2015, the Board of Directors also approved the new Crime Prevention model. 2.1 THE BOARD OF DIRECTORS AND ITS COMMITTEES MAIN GOVERNANCE BODIES: THE BOARD OF DIRECTORS AND OTHER EXECUTIVE BODIES The Board of Directors and its Committees The Board of Directors is the body responsible for directing, administering and representing the Company, without prejudice to the powers conferred on the General Shareholders' Meeting. The Board has three committees: the Executive Committee, the Appointments, Remuneration and Corporate Governance Committee and the Audit Committee. The Board of Directors has 15 members, which is the maximum allowed by the Corporate Bylaws. The Secretary does not qualify as a Member of the Board. Its composition responds to the traditional principles of diversity and balance. The company has reduced the number of executive members to one namely the CEO and has eight Proprietary Directors and six Independent Directors, one of them being the Chairman of the Company, in accordance with the recommendations for good corporate governance. All Board members have extensive professional experience in the corporate, business and academic world, as well as that of public administration. In 2010, the company, in following the best practices of Good Governance, decided to separate the posts of Chairman of the Board and of the General Meeting, on the one hand, from the responsibilities of the Chief Executive Officer, the organisation's top executive. Under Spanish law, the remunerations paid to the Directors of the Board and the remuneration policy were the subject of a consultative vote at the General Meeting, with the endorsement of the remuneration policy by 83.12% of the share capital with voting rights that attended the General Meeting. In line with this transparency policy, the Group has made public that, in 2015, all remunerations connected with the Board of Directors and its Committees totalled 1,305,000 (excluding the amounts paid to the CEO as a salary for his management post). For more information on this subject, you may review the Annual Corporate Governance Report and the Report on the Remunerations received by Board Members ( 12
101 The General Shareholder Meeting held on 3 June 2015, on the motion of the Board of Directors, agreed to re-elect the following Board Members for a period of four years, as established in the Corporate Articles: - Pedro Ballesteros Quintana, as External Domanial Director representing Alba Participaciones (Corporación Financiera Alba, S.A.). - Yukio Nariyoshi, as External Domanial Director representing Nisshin Steel Co. Ltd. - Manuel Conthe Gutiérrez, as Independent External Director. Likewise, in the General Shareholders' Meeting, it was approved to appoint and confirm as a Board Member, for a four years period, as established in the Corporate Articles: - George Donald Johnston, who was appointed Independent External Director, by co-option, at the Board Meeting held on October 29 th, This independent director replaces the proprietary director who presented his resignation after the company he represented sold the entirety of his shares. In total, the Board of Directors held eight meetings in The Executive Committee In 2008 the Board of Director stabilised an Executive Committee to manage the normal business course and provide its regular monitoring. This body has proportions of domanial and independent Directors similar to those of the Board of Directors, and it is chaired by the Chairman thereof. The Chief Executive Officer is a necessary member of the Executive Committee. To ease transparency and communication among governing bodies, the company regulations empower the Chairman to submit the plenary Board, the ratification or a new deliberation of any matter treated or decided by the Executive Committee. The number increase of the Board of Directors meetings to eight, following good governance recommendations, has meant a correlative number of meetings reduction of the Executive Committee, which in 2016 has been held three times. The Audit Committee As was the case in previous years, the Audit Committee was the most active body in 2015 in terms of the number of meetings held a total of nine which enabled it to develop its envisaged work plan by devoting itself to its core responsibilities, which are: 13
102 - Reporting on annual, biannual and quarterly accounts. - Supervising internal audit services and the effectiveness of the company's internal monitoring and risk management systems. - Supervising the process of preparing and presenting the regulated financial information. - Proposing to the Board of Directors the appointment of the accounts auditors, to be approved by the General Shareholders' Meeting. The Audit Committee is chaired by an Independent Director, while the Secretary of the Board of Directors acts as secretary. Appointments, Remuneration and Corporate Governance Committee. It held three meetings in It continued with its initiative of previous years of proposing to the Board of Directors a motion for consideration by the General Shareholders' Meeting, to maintain, the remunerations of the Board Members without change. It was also involved in setting the remunerations of senior management. Furthermore, it informed the Board of Directors of the re-election of Board Members Pedro Ballesteros Quintana and Yukio Nariyoshi, as well as proposing the election of Manuel Conthe Gutiérrez as an Independent director as well as the ratification of the appointment by co-optation and the subsequent appointment as independent Director of George Donald Johnston. This Committee coordinates, upon the request from the Chairman of the Board, the assessment of this body's performance. The Appointments, Remunerations and Corporate Governance Committee is chaired by an Independent Director, and the Secretary of the Board of Directors acts as secretary. COMPOSITION OF THE BOARD OF DIRECTORS OF ACERINOX, S.A. Chairman: RAFAEL MIRANDA ROBREDO Chief Executive Officer: BERNARDO VELÁZQUEZ HERREROS Members of the Board: PEDRO BALLESTEROS QUINTANA MANUEL CONTHE GUTIÉRREZ ÓSCAR FANJUL MARTÍN JAVIER FERNÁNDEZ ALONSO ROSA MARÍA GARCÍA GARCÍA JOSÉ RAMÓN GUEREDIAGA MENDIOLA RYO HATTORI GEORGE DONALD JOHNSTON SANTOS MARTÍNEZ-CONDE GUTIÉRREZ-BARQUÍN 14
103 BRAULIO MEDEL CÁMARA YUKIO NARIYOSHI DIEGO PRADO PÉREZ-SEOANE MVULENI GEOFFREY QHENA Secretary of the Board: ÁLVARO MUÑOZ LÓPEZ EXECUTIVE COMMITTEE RAFAEL MIRANDA ROBREDO (Chairman) BERNARDO VELÁZQUEZ HERREROS ÓSCAR FANJUL MARTÍN JAVIER FERNÁNDEZ ALONSO JOSÉ RAMÓN GUEREDIAGA MENDIOLA RYO HATTORI GEORGE DONALD JOHNSTON SANTOS MARTÍNEZ-CONDE GUTIÉRREZ-BARQUÍN Secretary: ÁLVARO MUÑOZ LÓPEZ APPOINTMENTS, REMUNERATION, AND CORPORATE GOVERNANCE COMMITTEE MANUEL CONTHE GUTIÉRREZ (Chairman) RAFAEL MIRANDA ROBREDO OSCAR FANJUL MARTÍN SANTOS MARTÍNEZ-CONDE GUTIÉRREZ-BARQUÍN BRAULIO MEDEL CÁMARA Secretary: ÁLVARO MUÑOZ LÓPEZ AUDIT COMMITTEE JOSÉ RAMÓN GUEREDIAGA MENDIOLA (Chairman) PEDRO BALLESTEROS QUINTANA GEORGE DONALD JOHNSTON DIEGO PRADO PÉREZ-SEOANE Secretary: ÁLVARO MUÑOZ LÓPEZ 15
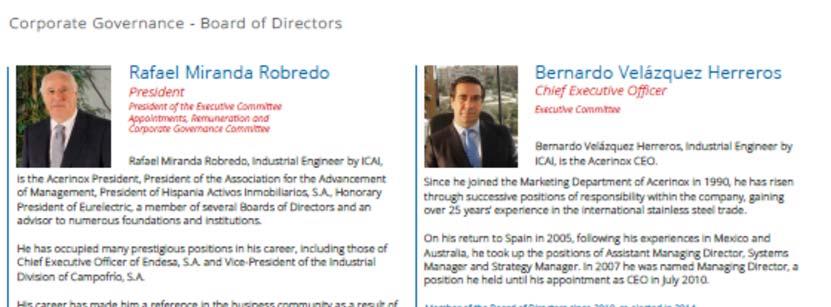
104 16
105 17
106 2.2 SHAREHOLDERS' MEETING The General Shareholders' Meeting was held in Madrid on the 3 rd of June 2015, and was Chaired by Mr. Rafael Miranda Robredo. As it was the case in the previous year, the meeting was held in the Mutua Madrileña Automovilística, Paseo de la Castellana, No. 33. Attendance at the General Meeting, including shareholders present and represented, amounted to the equivalent of 184,251,250 shares, or 70.40% of the company's share capital. No shareholders made use of the on-line discussion forum, but the increase in on-line voting is worthy of being mentioned. The resolutions on the Agenda were approved in their entirety, by the following majorities: Votes in favour % Votes against % 1. Approval of the annual accounts Application of the results Approval of the Board of Directors' management Share capital increase to carry out flexible dividends Appointment of account auditors Re-election of Pedro Ballesteros Quintana as Board Director 6.2 Re-election of Yukio Nariyoshi as Board Director Re-election of Manuel Conthe Gutiérrez Ratification and Appointment of George Donald Johnston as Board Director 7.1 Amendment of Section 6 of the Articles of Association, on increasing and reducing Capital. 7.2 Amendment of Section 8 of the Articles of Association, on the Rights conferred by shares. 7.3 Amendment of Section 12 of the Articles of Association, Calling 7.4. Amendment of Section 14 of the Articles of Association, on Attendance at Meetings and Representation 7.5 Amendment of Section 15 of the Articles of Association, on the Composition of the Committee Discussions. Framework for adopting resolutions 7.6. Amendment of Section 16 of the Articles of Association, Powers of the General Meeting 7.7 Amendment of Section 20 of the Articles of Association, Duration of the post of Board Member 7.8 Amendment of Section 21 of the Articles of Association, Notice and quorum of the Board Meetings. Adoption of resolutions. 7.9 Amendment of Section 22 of the Articles of Association, Board of Directors. General Functions 7.10 Amendment of Section 23 of the Articles of Association, Board Committees
107 7.11 Amendment of Section 24 of the Articles of Association, on Board posts 7.12 Amendment of Section 25 of the Articles of Association, on the Remuneration of Board Members Renumbering of sections 24, 25, 26, 27, 28 and 29 of the Articles of Association, which are now articles 26, 27, 28, 29, 30 and 31, respectively. 8.1 Amendment of Section 3 of the Regulations governing General Meetings, on the Types of General Meetings and Areas of Responsibility. 8.2 Amendment of Section 4 of the Regulations governing General Meetings, on Meeting Notice. 8.3 Amendment of Section 5 of the Regulations governing General Meetings, on shareholders' rights to participation and information. 8.4 Amendment of Section 6 of the Regulations governing General Meetings, on the Right to Attend Amendment of Section 7 of the Regulations governing General Meetings, on representation, remote voting and voting through intermediary organisations. 8.6 Amendment of Section 9 of the Regulations governing General Meetings, on the Chair of General Meetings. 8.7 Amendment of Section 11 of the Regulations governing General Meetings, on Procedures. 9. Approval of Board Members' Annual Remuneration Report, dated 31 December Delegation of powers to the Members of the Board, the Secretary of the Board and the General Secretary. 11. Appointment of administrators to approve the Minutes of the Meeting MANAGEMENT COMMITTEE AND MAIN EXECUTIVES OF THE GROUP'S COMPANIES Management Committee Acerinox's Management Committee is made up of five people: the CEO, the General Manager, the Financial Manager, the Sales Manager and the General Counsel. The remunerations associated with these posts are proposed to the Board of Directors by the Appointments, Remuneration and Corporate Governance Committee. The amount received during 2015 by this Committee, not including the CEO, was 2,054 thousand euros. BERNARDO VELÁZQUEZ HERREROS Chief Executive Officer 19
108 ANTONIO FERNÁNDEZ-PACHECO MARTÍNEZ Managing Director DANIEL AZPITARTE ZEMP Commercial Director MIGUEL FERRANDIS TORRES Chief Financial Officer LUIS GIMENO VALLEDOR General Counsel Top Executives in our Industrial Companies Acerinox Europa: ANTONIO MORENO ZORRILLA North American Stainless: CRISTÓBAL FUENTES TOVAR Columbus Stainless: LUCIEN MATTHEWS Bahru Stainless: OSWALD WOLFE GOMEZ Roldán: JORGE RODRÍGUEZ ROVIRA Inoxfil: ÁNGEL BRUÑÉN CEA Top Executives in our Commercial Companies SPAIN Inoxcenter: LUIS GUTIERREZ MAS Inoxidables de Euskadi: JOSÉ CRUZ DE VICIOLA GARCÍA C.S. de Pinto Florencio Zurdo Gómez C.S. de Gavá Juan Esteve Vestit 20
109 C.S. de Betanzos Álvaro Suarez Llanos EUROPE Acerinox Deutschland (Germany): JOACHIM MAAS Acerinox Benelux (Belgium): LUIS PABLO GONZÁLEZ ROBLES Acerinox France (France): PHILIPPE AUDEON Acerinox Italia (Italy): GIOVANNI DE CARLI Acerol Comércio e Industria de Aços Inoxidáveis Unipessoal (Portugal) : FERNANDO MONTEIRO Acerinox Polska (Poland): PILAR SENISE GARCIA Acerinox Scandinavia (Switzerland): JAN GJERLAUG Acerinox Schweiz (Schweiz) : IVANA HORAKOVA Acerinox UK (United Kingdom): PABLO CANTLE CORNEJO Acerinox Russia (Russia): ROMAN BUTYRIN Acerinox Metal Sanayi (Turkey) : JAAN ROXAN ARROYO AMERICA Acerinox Argentina (Argentina): JOSE CARLOS RODRÍGUEZ ARANDA Acerinox Brasil (Brasil): JUAN ANTONIO RODRIGUEZ Acerinox Chile (Chile): 21
110 IGNACIO MARTÍNEZ ALLUE Acerinox Colombia (Colombia): GONZALO DEL CAMPO BARCÓN Corporación Acerinox Perú (Perú): GONZALO DEL CAMPO BARCÓN Acerinox, SA. Venezuela (Venezuela): GONZALO DEL CAMPO BARCÓN North American Stainless México (México): BÁRBARA THIRION North American Stainless Canada (Canada): ROGER MANSFIELD ASIA Acerinox South East Asia (Singapore): IRENE TEO LIN LING Acerinox India (India): PRATIK KACHCHHI Acerinox SA. Shanghai (China): MARY XU Acerinox SC. Malaysia (Malaysia): BARRY FOO Acerinox SA.Shanghai (China): MARY XU Acerinox Indonesia S.A. (Indonesia): EFRAT AGUNG Acerinox (SEA) (Vietnam): JAIME DEL DIEGO SANZ Acerinox (SEA) (Thailand): PRAWIT LERTWIMONRAT Acerinox (SEA) (Philippines): ENRIQUE DAVID B. SANTIAGO Acerinox Pacific (Korea): JUNGHO CHOI 22
111 Acerinox Pacific (Taiwan): SAMUEL TAM Acerinox Middle East (United Arab Emirates): FERNANDO GÓMEZ AIELLO OCEANIA Acerinox Australasia (Australia): CLAUDIO LEÓN DE LA BARRA 2.4. MAIN REGULATIONS GOVERNING THE GROUP The main regulations governing ACERINOX, S.A. and its group of companies are: - Its Articles of Association, which were amended at the General Shareholders' Meeting held on 3 June 2015 so as to adapt them to the Capital Companies Act. - The Regulations governing the Board of Directors, which encompasses the Board's Committees and were amended, so as to adapt them to the Capital Companies Act, by the Board of Directors and announced at the General Shareholders' Meeting held on 3 June The regulations governing the General Meeting, approved by the General Shareholders' Meeting held on 3 June Operating guidelines for the Senior Management Committee. - Operating guidelines for the Internal Audit Service. - Code of Conduct and Good Practices, and related regulations. - Internal Conduct Regulations concerning matters relating to the Stock Market. - Other lower regulations which are compulsory. The articles and regulations governing the General Shareholders' Meeting and the Board of Directors can be found on 3. HUMAN CAPITAL At the end of the 2015 financial year, the workforce of Acerinox comprised 6,506 people, not including partially-retired personnel. From among the total, 3,134 (48.2%) staff members work in Europe which means that, for the first time since the company was founded in 1970, more than half of the Group's employees work outside the European Continent. Specifically, Acerinox has 1,406 employees in America (21.6%), 1,345 in Africa (20.7%) and 621 in Asia (9.5%). In this last continent is where the Bahru 23
112 Stainless factory is located, where there was the greatest growth in the number of employees, which went from 447 workers in 2014 to 521 last year. The number of employees remained stable with small downward variations. This same stability also applies to the trading companies, both in Spain and abroad, which total a workforce of 628 people. The 55.8% of the staff carry out their tasks outside Spain Acerinox, S.A. 57 Acerinox Europe 2,073 NAS 1,370 Columbus 1,345 Bahru Stainless 521 Roldán and Inoxfil 512 National Sales Companies 235 Overseas Sales Companies 393 Total 6, ANNUAL CORPORATE GOVERNANCE REPORT As published on Acerinox's website ( the Company complied almost entirely with the recommendations made in the previous Unified Code on Good Governance, which was in force until The Company made considerable efforts to comply with the recommendations made in the new Corporate Governance Code of 2015, even before it came into force. In 2015 and the first months of 2016, there have been improvements in Corporate Governance. The most important improvements are the following: - The number of shares required to be able to attend a General Shareholders' Meeting was reduced from 1,000 to Plans to broadcast the General Meeting in real time. - Increase in the number of independent board members. - Plans for digital attendance at the meetings held by the Board of Directors and its Committees. - Commitment to increase the number of board members belonging to the least-represented gender to 30% by Details of compliance with these recommendations can be found in the Annual Corporate Governance Report, on the Acerinox website ( 24
113 Global Strategy 25
114 3. Global Strategy 1. GLOBAL POSITION Acerinox is the most global stainless steel producer and the only group to have factories in four continents and a sales network present in 37 countries throughout 5 continents. The Group is one of the leading producers in Europe, the largest one in the United States, the only one in Africa, and currently, it is increasing its market shares in Asia and Oceania thanks to the sale of the material produced in the new plant in Malaysia. In the year 2015, America continues to be the area where Acerinox has the higher volume of sales mainly in the Unites States followed by Europe. The Group's sales in Asia, where there is a great deal of potential, continue to grow and have clearly overtaken those in Africa. In terms of markets, the Group's ten main markets remain the same as the previous year, being the US the main one, followed by Spain, Germany, South Africa, Italy, Canada, the United Kingdom, Malaysia, India and France. The geographic diversification has enabled the Group to take better advantage of the opportunities that have arisen at every moment, when some years ago emerging countries grew significantly, and at present when the growth is mostly supported by those developed countries. The decision to be established in all markets continues to be a constant in the Group s strategy, with the opening of new trading companies in countries whose development is bringing about a significant demand for stainless steel. As has already been mentioned, the Group currently sells its products in more than 80 different countries. 2. EXCELLENCE PLANS EXCELLENCE PLAN IV Based on the good results obtained thanks to Excellence Plan III in , the new Excellence Plan IV for was presented and approved at the meeting held by the Board of Directors on 16 December This fourth Plan further develops the chapters included in the previous editions, and incorporates new chapters, making a total of 23 chapters: 13 of them have to do with the factories, and 10 with the Sales and Financial areas. 26
 it had implemented its own plan independently.")
115 Another development is that Bahru Stainless is now integrated into the Plan. It is important to take into account, the fact that for the two previous years (during the initial stage) it had implemented its own plan independently. The potential scope of this new Plan is 67 million euros in recurring annual savings, if 100% of the goals are achieved. During this first year of the Plan, recurring savings of 37.1 million euros were achieved, originating from the Group's compliance with 55% of the goals set for this biennial Plan. Excellence Plan IV progress percentages The Excellence Plans are part of the Group's culture. Its internal benchmarking activities are one of its most powerful improvement and appraisal tools. Comparing similar business departments is a reliable form of gauging what and how much can be achieved and how far can we get. After several years and several plans, a culture of progress, imitation and selfmotivation has become integrated into the Group's practices; a culture that has resulted in better techniques, processes and economic policies in all areas concerned. So deeply engrained is this modus operandi that the most recent Plans are the result both of management's drive and of the initiatives formulated by business units themselves, which constantly propose and set new goals and challenges. 27
116 3. R+D+I Acerinox competes successfully in the global arena, thanks to the unrivalled quality of the products it delivers to end customers and the efficiency it has managed to develop for each step of the production process, among other reasons. Both conditions are made possible thanks to the constants efforts made to improve the manufacturing process and always provide the very highest quality in our range of products was yet another year in which the Group improved the quality of its stainless steel, proving that it continues to be at the cutting edge of technological development and can produce longer-lasting, more corrosionresistant materials with a better mechanical performance. All these qualities are the result of the constant studies conducted at the factories that the Group owns on four continents. There is a research laboratory in each factory, where new manufacturing technologies are studied and research is conducted into the optimisation of manufacturing processes and the properties of the steel produced, as well as to find new applications for our products. The aim of Acerinox is also to promote the research and development of stainless steel beyond its factories. To this end, by making use of the many partnerships it has developed over the years with different educational institutions, it fosters research by university students. Acerinox Europe has an Acerinox Professorship at the University of Cádiz, as well as teaching and university training agreements with the universities of Malaga and Seville. In South Africa, Columbus maintains a close partnership with the University of Pretoria, while NAS collaborates with the School of Engineering in Louisville (United States). Moreover, Acerinox has collaborative educational and training internship agreements with six universities in Madrid (Universidad Pontificia de Comillas; Universidad Complutense; Universidad Rey Juan Carlos; Universidad de Alcalá; Universidad Carlos III and Universidad Politécnica de Madrid). The Spanish Stainless Steel Research and Development Association (CEDINOX), with the support of Acerinox, offered courses in several Spanish universities, including Universidad de Deusto, Universidad Pontificia de Comillas, Universidad Carlos III and the universities of Zaragoza, León, Seville, Cartagena and Mondragón. Many of the world's top experts in the production of stainless steel are employed by the Group. Well aware of the potential that results from the knowledge held by the people who make up the company, every year Acerinox promotes research aimed at improving the manufacturing process via the Rafael Naranjo Awards for Process, Safety and Environmental quality. Thus, Acerinox rewards the best ideas of its employees, with regard to cost reduction, 28

117 and excellence in production processes, safety management and environmental impact. The Technical Committee for Project Evaluation for the 2015 edition of the awards, assessed the 20 competing projects, offering prizes amounting to 45,000 euros. The first prize for Process Quality was awarded to José María Bianchi Pérez for his project Saving energy in the hot-rolling mill process. The second prize went to Franciso García Montero for his work Installation of an auxiliary braking system at flange 0 for the final annealing processes in AP2. The panel awarded third prize to the work of Fernando González Bayo for his project Oil retaining system for the ZM5 production line. The Safety award was awarded to José María Gómez Muñoz and Conrado Ángel Montoya Avilés for their project, Blade changing on the Sheet Line. The Environment prize went to the project, Elimination of acid and nitrate spills caused by overflow of AP2 pickling tank no. 1, by Francisco García Montero. The technical progress made by Acerinox enabled it to participate in projects as iconic as the One World Trade Centre in New York, using materials supplied by NAS, or the construction of the Louvre Museum in Abu Dhabi, designed by the architect Jean Nouvel, for which 300 tonnes of duplex steel were provided by the Columbus factory. Other major works that the company is participating in are the construction of the new Champlain Bridge, which will cross the St Lawrence River, near Toronto (Canada), or the refurbishment of the cellars of the historic Chateaux Margaux in Bordeaux (France). The total investment in R&D&i grew last year, from 16.1 million euros in 2014 to 16.4m in Growth in R&D&i investment was led by NAS and Acerinox Europe, with increases of 2.2 and 0.7 million euros respectively. There was also an increase of 30,000 with regard to research, development and innovation in the cases of Roldán and Inoxfil. The research areas these investments were aimed at were mainly the quest for new types of steel, developing the properties of currently-existing types and improving welding points. The amounts invested in R&D&i ( ) were as follows: (Million euros) 29
118 4. INVESTMENTS IN FIXED ASSETS In the meeting held in March, the Board of Directors authorised an investment of 116 million euros to develop a line of bright annealed steel BA, with the goal of increasing capacity and range of finished products at its North American Stainless (NAS) factory in Kentucky. This new line will mean that NAS will produce stainless steel with a bright finish. This great opportunity for project development stems from high annual consumption of this product coupled with the fact that, due to the lack of internal production, most of it must be imported into the United States. The start-up of these equipment is scheduled for march Acerinox will thus become the main producer of this material on American soil, thereby reducing turnaround time and transport and import costs, as well as offering North American customers more competitive prices. At their meeting held in December last year, The Board of Directors approved the purchase of an annealing and pickling line (AP) and a new cold-rolling mill, as well as the engineering work and additional equipment required for the Campo de Gibraltar factory, for an additional amount of 140 million. This investment is part of the Strategic Plan for , with which it was decided to boost the activity of Acerinox Europe and in the United States in expectation of new opportunities arising in emerging markets. The new AP line will provide significant savings in maintenance, as well as in energy and consumables. Acerinox will improve its production equipment, thus providing our end customers with better-quality products with higher added value and enabling us to considerably reduce the emissions generated during the production process. The new facilities will come into operation at the end of 2017, according to the commissioning deadlines agreed with suppliers. This new 140 million investment is in addition to the 300 million the company has allocated to its Spanish factory in the past few years in order to modernise its equipment and maintain its position as one of the most competitive factories in Europe. The amounts in fixed assets derived from the progressive execution of the approved investments are as follows: 30

119 5. RISK MANAGEMENT The goal of Acerinox's Risk Management System is to provide a reasonable level of safety while achieving the goals that have been established, providing shareholders, other interest groups and the market in general with a suitable level of value and guarantee-assurance. Acerinox establishes a series of key operational principles within the framework of it Risk Management System which enable it to improve its ability to generate value. Acerinox's Risk Management System is built around management based on business units, processes, geographical areas and functions, and is an integral element in decision-making processes. The methodology behind the Risk Management System is contingent on identifying and assessing risks, as well as monitoring control activities and improvement plans, thus making it easier for Acerinox to reasonably manage the risks it is exposed to. Based on the valuation scales established for each impact and probability variable, we obtain the risk valuation matrix, which reflects four different levels for every risk: very high risk, high risk, moderate risk and low risk, all of which are represented on the company's high-level Global Risks Map, which is systematically and periodically updated under regular supervision on the part of the pertinent bodies: The Management Committee, the Audit Committee and the Board of Directors. The policies and procedures applied in relation to Acerinox's Risk Management System are established and implemented to ensure that, among other things, responses to risks are carried out effectively. Risk Management involves rigorously identifying risks and choosing the most appropriate from among a series of possible responses. The complexity and international scale of the sector in which Acerinox carries out its activities entails a great variety of risks, the most relevant of which are detailed below. 31
120 ACERINOX'S MAIN RISKS Overcapacity Excess in installed capacity, on a global scale, which would result in lower prices. The stainless steel industry is affected by global production capacity and the fluctuation in imports and exports. Global production capacity has grown considerably, particularly in China, which is currently the world's largest stainless steel manufacturer by a large margin. Raw Material Price Volatility Considerable variations in the price of the main Raw Materials. The production of stainless steel requires considerable amounts of raw materials (mainly nickel, chrome and molybdenum). The price of nickel, which is listed on the LME (London Metal Exchange), is subject to the volatility of financial markets, which has a direct effect on the apparent consumption of stainless steel. Economic Crises and Cycles The demand for steel products is directly related to the global market's macroeconomic fluctuations and recessions. These circumstances produce imbalances between supply and demand, and have a significant impact on prices. Competition Sales policies used by competitors to increase or maintain market share. The stainless steel market is characterised by a high level of competition, which leads to price reductions in order to increase or maintain market quotas on a global scale. Financial Risks Lack of liquidity, restricted access to funding sources, increasing funding costs, the volatility of exchange rates, the volatility of interest rates and credit risks. Regulatory Risks The Acerinox Group's presence on the international stage means that it carries out its activities in a number of different countries, subject to different regulatory frameworks and in different business areas within the stainless steel industry. 32
121 6. NEW STRATEGIC PLAN At its meeting held on 29 October 2015, the Board of Directors approved a new Strategic Plan which will remain in force from 2016 to This Plan is a revision of the Strategic Plan for , which has been adapted to the changes in the market and the global production of stainless steel, resulting from an excess in global production capacity. The Plan for is a guideline for the Group's initiatives in its different fields of activity and different territories. The recent investments in equipment mentioned in other parts of this Report were carried out in accordance with the new Strategic Plan. This Plan is broadly based on ideas that have traditionally been a core element of Acerinox's DNA: an optimum use of its plants' production capacities, quickreturn investments, adapting production to market trends, meticulous management of stock and production, solid finances, the quest for operational excellence and an emphasis mainly on organic growth, without discarding opportunities that may arise. Meeting the provisions detailed in all its sections should consolidate the Group as one of the world's most efficient stainless steel producers and a leading company in all key markets. 33
122 Raw Materials and Main Markets 34
123 4. Raw Materials and Main Markets 1. EVOLUTION OF RAW MATERIALS If there is one thing that stands out about this past year, it is that the price of raw materials has fallen drastically in all world markets. Slow growth in China and other emerging economies, as well as uncertainties about the worldwide economic situation fuelled the collapse in raw material prices, not only in the case of metals but also fuel, which reached its lowest level in this decade - in some cases falling below production cost - leading to serious consequences for production and extraction companies. 1.1 NICKEL According to industry analysts, China was expected to run low on nickel because of the decrease in the production of nickel pig iron, and this was expected to drive its price up. In fact, the opposite happened. While it is true that production of nickel pig iron in China fell by 17% in 2015, excess production around the world meant that the supply and demand ratio for nickel remained positive throughout the year, meaning that supply outstripped demand. Stocks of nickel on the London Metal Exchange rose throughout the year, reaching a historic peak of 470,376 mt in June. At the end of the year they stood at 441,294 mt, which represented an increase of 6.4% compared to the end of Taking into account the new stocks on the Shanghai Exchange, as well as those held by producers, distributors and consumers, global stocks of nickel at the end of 2015 were the equivalent of 7 months of global consumption. 35
124 Official raw material prices on the LME (2015) Daily trading data (USD/mt) In these circumstances, the price of nickel showed a year long decline from 14,880 USD/mt at the beginning of January to 8,665 USD/mt by the end of the year. We have to go back as far as February 2003 to find similar prices. It is estimated that around 70% of nickel producers operate at a loss at this market price, including many Chinese nickel pig iron producers, which means that the competitive advantage of this product is disappearing. The prices of all metals suffered a decline in However, nickel s fall of 41.8% meant that it was the metal with the worst performance, followed by zinc, which fell by 26.7%, copper, 23.5% and aluminium, which fell by 17.2%. Nickel also broke records on the London Metal Exchange for the volume of contracts, with an increase of 6.9%,while the global volume of contracts for all metals fell by 4.3%. Official price of nickel on the LME (2014 and 2015) Average trading price / three months (USD/mt) 36
125 1.2 FERROCHROME Prices fell by 7 US /lb in the first quarter, to 108 US /lb. Solid demand enabled them to remain stable in the following two, but the fall in prices in China and reduced demand in the fourth quarter forced prices yet further downwards, to 104 US /lb, which was its lowest level since Despite this price stability, this level is too low for many ferrochrome producers, including the Chinese. Two producers in South Africa closed down due to the impossibility of maintaining production at current prices. Average quarterly price of ferrochrome US / lb. 1.3 MOLYBDENUM There was an excess of supply of this metal throughout the whole year while global demand for it remained relatively weak, especially in the energy sector, which is one of the main applications of molybdenum in the steel industry. Prices stood at 9 USD/lb at the start of the year and despite the announcement of numerous mine closures and production cutbacks over the year, they dropped to levels around 4 USD/lb by October. We have to go back to March 2003 to find similar prices. 37
126 Price of molybdenum USD / lb. November s announcement by some of the world s main producers to significantly cut back production helped prices to recover somewhat, and the price at the close of the year was slightly above 5 USD/lb. This level of prices cannot be sustained by many producers, so further production cutbacks are likely. 1.4 SCRAP IRON The steep drop in iron ore prices in 2015 forced scrap into a similar descent in order to preserve its status as a competitive and alternative raw material. The first of these price drops came in February, registering 70 USD/mt. A feeble recovery then lasted until May, when prices tumbled yet again, reaching 160 USD/mt in October, the lowest level since November To these causes we must add the fact that a new competitor has emerged as a raw material for the production of steel. The low purchase prices of Chinese billets has led Turkish producers to buy them to smelt them again to make steel, thus replacing scrap iron. Until then, Turkey had been the world s number one importer of scrap iron. Other steel producers in other markets, such as the Italian and Spanish producers, have gone down the same road, importing Chinese billets as a raw material since it is being sold at prices below production costs. 38
127 Prices of scrap iron, HMS 1&2 FOB Rotterdam USD / mt Source: Metal Bulletin 2. MAIN STAINLESS STEEL MARKETS Following the apparent increase in consumption and the replacement of stock that took place in 2014 across all markets, 2015 was marked by the correction of stock levels along the supply chain. This need to reduce stocks, along with the continuous fall in the value of nickel and strong competition, made 2015 a challenging year for our industry, with prices reaching historically low levels. There is still excess capacity in China, which continues to flood other markets with its products. 2.1 Europe The event which had the biggest impact on the European market in 2015 was undoubtedly the anti-dumping process against cold-rolled stainless steel imports from both China and Taiwan. The European Commission passed a series of provisional measures which, after a minor modification in the case of imports from Taiwan, became definitive in August. The European Commission considered proven the practice of dumping in both cases, and that the practices in question gave an unfair advantage to importers over the European industry. The tariffs imposed were 25.3% in the case of China and 6.8% in the case of Taiwan. This resolution, published in the DOCE in August, represents a significant advance for European industry against unfair imports. When the process was announced in June 2014, some stockists began to increase their purchases in preparation for the imposition of tariffs, and this meant that 2015 started with an excess of stock in the supply chain. This fact, coupled with the steady decline in the price of nickel throughout the year - with the consequent decline in the alloy surcharge - meant that suppliers kept their purchases to a minimum and adjusted their levels of stock. This had a knock on effect on orders received by European factories. 39
, in the construction industry and in domestic appliances, which rose for the first time since 2007.")

128 Once stock levels were corrected, apparent consumption recovered in the second half of the year, since final levels of consumption in the main user sectors responded well, with strong growth in the automotive industry (new registrations in the European Union rose by +9,3%), in the construction industry and in domestic appliances, which rose for the first time since The final balance over the whole year showed a reduction of 1.7% in apparent consumption of stainless steel plate in the European Union, according to Acerinox estimates. This reduction in apparent consumption, together with the fact that the importing countries affected by the anti-dumping measures were partially substituted by third countries - mainly Korea and India - and the fact that nickel continued its slow but steady decline, prevented prices from recovering, so that at the end of the year, margins were very tight. As for the breakdown, there was slight growth in the apparent consumption of plate in countries in the south and east of the European Union: Spain +4.8%, Portugal +1.4%, Italy +1.8%, UK +0.5%, Poland +1.2%, Czech Republic +3.2%, Slovakia +8.1% and Hungary +5.1%. The larger economies in the north of Europe, such as Germany -3.9%, Austria -12.2%, Sweden -6%, Finland -11.7%, Denmark -20.2% or even France -8.1 in contrast, saw a decrease. Prices of stainless steel plate 2.0mm cold-rolled AISI and 2015 Source: Metal Bulletin 40


129 2.2 NAFTA This was the area in which the new market situation was most strongly felt, and the profitability of American producers suffered greatly as a result. Delivery times from local producers began to lengthen at the end of 2014 due to the strong demand and the problems in production faced by some of them, ensuring that prices remained high through the end of 2014 and the start of This generated a pull effect on imports, and their increase became more noticeable during this period. The result of this process has been that the year started with very high level of stocks. This situation, along with the continued decline in nickel, and the consequent decline of the alloy surcharge, and the aggressive sales policy of the new producers in the American market, led to a continuous fall in prices and a deterioration of market conditions which made 2015 a truly difficult year, with an estimated reduction in the apparent consumption of steel plate of 7% in the United States and 6.8% in Canada. However, apparent consumption increased 7% in Mexico favoured by exports to United States, according to our estimates. Even so, real consumption has been steady in the consumer goods industry, and this has enabled excess stock to be absorbed along the supply chain, and inventories were adjusted, so that the prospects for 2016 are optimistic. According to Acerinox data, car sales have risen by +5.8% and there has been growth of +10.7% in construction and +8.1% in domestic appliances. Prices of stainless steel plate 2.0mm cold-rolled AISI and 2015 Source: Metal Bulletin 41
130 2.3 South Africa This country has suffered the effects of the changes in economic policy in the developed world and its own growth problems, which include difficulties in the supply of electricity, transport bottlenecks and a fall in the price of the raw materials produced or obtained in that country. These issues go some way towards explaining why the local market for stainless steel has declined considerably in recent years, despite it has risen 1.9% during The interest rate policy of the U.S. Federal Reserve set large currency flows in motion, which in turn affected the exchange rates of emerging economies, one of which was South Africa. The South African Rand lost 35% of its value against the U.S. dollar throughout the year, which made South African industrial exports more competitive, which offered some compensation for the decline in the local market. 2.4 Asia The prevailing uncertainty over the Chinese economy in 2015 drove the price of all raw materials down all over the world. On this continent, the excess installed capacity, especially in China, has kept the price of stainless steel steady all year at unprecedented levels. This resulted in many companies in the industry accumulating large losses which, according to CISA (China Iron and Steel Association) could total more than 8 billion euros. We hope that the government s plans for the coming year are carried out, with the consequent reduction of capacity and the closure of inefficient and polluting plants. If they are, this excess capacity could be absorbed within a reasonable period. For its part, India was the country in Asia whose apparent consumption grew the most, partly replacing China as engine for stainless steel growth. Some countries in the ASEAN area have frankly interesting apparent consumption growth rates, and we feel that this is the area that will see greatest growth in the coming years. However, the fact that it is the natural destination of Chinese excess production means that the prevailing prices are far lower than the European or North American market, as the following graph shows. 42


131 Prices of stainless steel plate 2.0mm cold-rolled AISI and 2015 Source: Metal Bulletin 3. GLOBAL PRODUCTION OF STAINLESS STEEL After years of strong growth, production has consolidated and excess inventories have been trimmed, which will enable growth to resume in the coming years, with a return to growth rates of around 6%. Although there are no definitive results at the time of writing, we estimate world production of stainless steel in 2015 was 41.7 million tonnes, which is a similar figure to the 41.7 million tonnes produced in After the period of strong growth after 2009 (CAGR = 9.2%) this phase of relatively weak growth could form the basis for future expansion, as it did in the other periods. Worldwide production of stainless steel Thousands of mt. 43

132 Our general analysis by geographical regions shows that China s production slowed in 2015 after years of double-figure growth. Asia, excluding China, grew by 2% and the United States remains with a slightly growth, probably due to the switch from importing European black coil to using its domestic product. All other regions have registered modest growth, which shows that the gap between capacity and consumption has been closed all around the world, except in China. This leads us to expect more solid growth in the industry in the future, keeping pace with the growth of the developed economies. Total production in Asia increased its weight in the global market, as it reached 74% of the total. 44
133 Evolution of production worldwide Millions of tonnes 45
134 The Year of Acerinox in Numbers 47

135 5. The Year of Acerinox in Numbers 1. PRODUCTION Steel production by the Acerinox Group in 2015 was 2.3 million mt, equalling the results of 2014 and 2004, and second only to 2006, which was the year with the highest production in the Group s history. Production of Hot Rolled steel was 2.0 million mt, similar to the previous year, while Cold Rolled rose by 3.4% to 1.6 million mt, making it the largest production quantity ever. Factory production in Acerinox Europe continued to grow compared with 2014, in the same way that year-on-year production did. Steel production rose by 6.6%, hot-rolling by 6%, and cold-rolling by 10%. North American Stainless beat all its own records for every shop in 2014, but repeating this achievement in 2015 was complicated by the circumstances mentioned above: productions fell by 9%, 9.8% and 7% in each of its workshops. Columbus increased its production notably in all its workshops, which shows the competitiveness achieved. Melting s output rose by 8.9%, hot-rolling by 8.7% and the cold-rolling workshop by 7.3%. Finally, Bahru Stainless continued to increase production, which rose by 34.7% over the results of 2014, setting a new record. 48

 fell by 1.9% in Europe, 19.9% in the U.S. and by 21.5% in Asia compared with the same period of 2014.")
136 2. RESULTS The results of the Acerinox Group in 2015 show how difficult the market for stainless steel products was this year. With continues fall in prices as a result of the fierce competition in all markets, high level of inventories and a decline in the price of raw materials. Most significant Acerinox figures Thousands of euros The turnover of the Consolidated Group in 2015 reached 4,221 million euros, 3.6% less than the previous year. The average price of the coil AISI 304 (according to Platts) fell by 1.9% in Europe, 19.9% in the U.S. and by 21.5% in Asia compared with the same period of Geographical Distribution of Acerinox Revenue in 2015 (*) Figures for Acerinox, S.A. in After 2011, figures correspond to Acerinox Europe 49
137 The worsening of market conditions had a negative effect on the Group s margins. The correction was only partially offset by the rise in the value of the dollar during the year. The international nature of the Group and the importance of the factories working in dollars (NAS and Bahru Stainless) made this factor more significant. Fortunately, the competitive edge acquired through the Excellence Plans and those for reducing fixed costs enabled the most important expenditure items on the balance sheet to fall in 2015 in local currency, although the rise in the dollar had the opposite effect on the consolidated accounts. The following graphs show the effects of the increase in the value of the dollar and the total variation in the profit and loss account: 50


138 Financial costs feel by 17%: 11 million euros 51
 Pre-tax profits, 77 million euros, are 68.5% lower than those obtained the previous year.")
139 The EBITDA generated in the year amounted to 286 million euros, 37.0% lower than the previous year, after adjusting inventories to their net realizable value for an amount of 14 million euros. The margin on sales rose to 6.8%. Evolution in the EBITDA of Acerinox Millions of euros (% of sales) Pre-tax profits, 77 million euros, are 68.5% lower than those obtained the previous year. The results of 43 million euros, after taxes and minorities, were 68.5% lower than those of the previous year Profits after tax and minority interests Millions of euros 52


140 The net financial debt of the group at year-end amounted to 711 million euros, with a ratio to shareholder equity of 35.1% and to EBITDA of 2.48 times. All covenants imposed by the finance credits and those relating to the Group's ratios were fully satisfied. Abridged Balance Sheet Millions of euros At 31st December, Acerinox held valid credit lines in force for an amount of 1,788 million euros, 40% of which were available for use. Evolution in the net financial debt Millions of euros 53

141 Columbus: Borrowing Base Facility In April, Columbus signed a syndicated financing contract (secured borrowing base facility) for up to 3,500 million Rand (275 million euros), for 3 years. This contract allows Columbus to finance its current and future working capital needs which could occur as a result of prices increases of raw materials and activity. The contract was signed by 10 international banks, led by Deutsche Bank, which acted as agent bank and global coordinator. The operation was jointly led by BBVA, Rand Merchand Bank and Bankinter, with the following banks participating as financing banks: Banco Santander, Nedbank, Banco Sabadell, HSBC, Caixabank and Investec. The operation was over-subscribed by a factor of 1.3. Working Capital Working capital increased by 244 million euros as a consequence of the lower use of working capital financial instruments such as factoring and confirming, due to the Group s good liquidity situation. If the use of working capital financial instruments had been similar to that of December 2015, working capital would have been reduced by 273 million euros and the free cash flow (total cash flow generated) would have been 353 million euros, as can be seen in the pro-forma cash flow: 54
 caused that the total cash flow generated by")
142 Pro forma cash flow 2015 (Millions of euros) The cash flow situation shows how important working capital is in our sector. Despite the generation of cash as a consequence of the results, the 1130 million increase in working capital (lower use of financing of working capital) caused that the total cash flow generated by the group was a negative 50 million euros, after having made investment payments for an amount of 68 million euros. 55
 3.")


143 Abridged cash flow statement 2015 (Millions of euros) 3. SHARE PRICE EVOLUTION 3.1. EVOLUTION OF SHARES The year was particularly complicated in terms of global equity, and Spanish equity in particular. The IBEX 35 closed with a decline of 7%, which was the 56
144 largest drop in the last four years, although still far from the 13% drop registered in 2011, in the resurgence of the financial crisis. Market evolution of the IBEX-35 Daily data in EUR However, the IBEX 35 was not the only market to close with a fall. The British FTSE 100 fell by 5%, under pressure from the mining companies that are listed on the index and which suffered from the fall in price of raw materials. Wall Street ended the year with slight losses: 2% in the case of Dow Jones and 1% in the S&P 500. The bullish start to the year at the IBEX 35 was soon halted by the Greek crisis and the doubts about real growth in China, the devaluation of the yuan and the uncertainties this raised about the effect on emerging economies and the adjustment of oil prices, among other causes. These factors affected stock markets around the world, but we also have to consider the effect of political uncertainty in Spain on the Spanish exchange. Acerinox was one of the worst-performing securities on the Spanish list, largely because of the fall in raw materials throughout the year. The London Metal Exchange saw copper fall by 26%, zinc by 26% and aluminium by 18%, but it was nickel that fell the most, with a drop of 42%. The limited presence of industrial securities on the IBEX 35 and the absence of other stocks linked with raw materials meant that Acerinox s fall was out of proportion to the other stocks on the Spanish list. The graph below shows how the year started with Acerinox stock rising to an annual high (16.05 euro/share) on 25 March, boosted by the preliminary antidumping measures against cold-rolled stainless steel from China and Taiwan which the European Union was considering. 57
 on 28 September, after three months of continuous decline following the panic generated by the Chinese slowdown and the punishment suffered by all traded metals.")
145 Market Evolution of Acerinox and the Ibex 35 Daily percentages, 2015 Acerinox reached its annual minimum (7.835 euro/share) on 28 September, after three months of continuous decline following the panic generated by the Chinese slowdown and the punishment suffered by all traded metals. Even so, at the end of 2015, Acerinox was one of the IBEX 35 stocks that were most widely recommended by analysts. Source: Bloomberg, On average, 73% of recommendations were Buy as opposed to 4% who advised Sell, on 31 December


146 In 2015, Acerinox shares were traded for the 256 days the Continuous Market was open for business. The total number of shares traded amounted to 527,865,068, with average daily trading of 2,061,973 shares. In respect to the trading volume, it reached a total of billion euros for the entire year of 2015, with a daily average of million euros, which was well above the preceding years. Shares and Volume Traded It is worth noting that the composition of the IBEX 35 was reviewed in June by a Technical Assessment Committee, which determined the return of Acerinox to this index to which it belonged since its beginning almost continuously. 3.2 CAPITALISATION On 31 December 2015, the market capitalisation of Acerinox reached 2,512 million euros (23% lower than 2014). Market Capitalisation of Acerinox, S.A. Millions of euros 59

147 ANALYST AND INVESTOR DAY Investor and Analyst Day was celebrated in New York on 15 October. A total of 50 investors, analysts and other banking representatives attended. Another 75 people followed the event through a live internet transmission. The following presentations were given during the day by Management team to show investors how important the presence of Acerinox in the American market is: - Stainless Steel in our World - NAS A Leader in the Industry - The Strategy of NAS in the American Market The Great Paradox A guided tour of the North American Stainless factory was made on 16 October with all the attendees who had the opportunity to travel there. This type of event ensures that the financial community can get a closer look at the company and gain a greater understanding both of its production processes and the market for stainless steel, and the strategies and values of Acerinox. 60

148 4. SHAREHOLDER REMUNERATION The General Shareholders Meeting held on 03 June 2015 approved payment of a scrip dividend to a maximum sum of 117,765, euros, equivalent to the sum of approximately 0.45 per share. This amount is the same as the one the company has offered shareholders since 2007, despite the difficulties of this period. For the third year running, the General Meeting decided to offer shareholders a scrip dividend, given that in the previous two years, most shareholders, representing most of the company s capital, opted to acquire new shares. In 2015, shareholders representing 59.30% of the company capital also opted to acquire new shares. The rate applied was 1 new share for every 31 already held. On 20 July 2015, the 5,005,253 new shares from the capital increase of the scrip dividend approved at the General Meeting of 3 June 2015 were admitted to official trading on the Continuous Market in the Madrid and Barcelona Stock Markets. Shareholders who chose to subscribe to shares with their free allotment rights saw their number of shares increase by 3.23%. Annual Shareholder Returns The scrip dividend for the last three years and the uptake of the option by shareholders is shown in the following table: 61
Acerinox, S.A. and Subsidiaries
 Acerinox, S.A. and Subsidiaries Consolidated Annual Accounts 31 December 2016 Consolidated Directors' Report 2016 (With Auditors Report Thereon) (Free translation from the original in Spanish. In the event
GRIFOLS, S.A. Annual Accounts and Directors Report. 31 December (With Auditor's Report Thereon)
") Annual Accounts and Directors Report 31 December 2014 (With Auditor's Report Thereon) (Free translation from the original in Spanish. In the event of discrepancy, the Spanishlanguage version prevails)
Annual Accounts and Directors Report 31 December 2014 (With Auditor's Report Thereon) (Free translation from the original in Spanish. In the event of discrepancy, the Spanishlanguage version prevails)
Profit/(Loss) before income tax 112, ,323. Income tax benefit/(expense) 11 (31,173) (37,501)
 before income tax 112, ,323. Income tax benefit/(expense) 11 (31,173) (37,501)") Income statement For the year ended 31 July Note 2013 2012 Continuing operations Revenue 2,277,292 2,181,551 Cost of sales (1,653,991) (1,570,657) Gross profit 623,301 610,894 Other income 7 20,677 10,124
Income statement For the year ended 31 July Note 2013 2012 Continuing operations Revenue 2,277,292 2,181,551 Cost of sales (1,653,991) (1,570,657) Gross profit 623,301 610,894 Other income 7 20,677 10,124
DEOLEO, S.A. AND SUBSIDIARIES
 1 Translation of consolidated financial statements originally issued in Spanish and prepared in accordance with the regulatory financial reporting framework applicable to the Group (see Notes 2 and 34).
 ABERTIS INFRAESTRUCTURAS, S.A. Financial Statements and Directors' Report for the year ended 31 December 2017 CONTENTS Balance sheets as at 31 December... 2 Statements of profit or loss... 4 Statements
ACCOUNTING POLICIES 1 PRESENTATION OF FINANCIAL STATEMENTS. for the year ended 30 June BASIS OF PREPARATION 1.2 STATEMENT OF COMPLIANCE
 14 MURRAY & ROBERTS ANNUAL FINANCIAL STATEMENTS 15 ACCOUNTING POLICIES for the year ended 30 June 2015 1 PRESENTATION OF FINANCIAL STATEMENTS 1.1 BASIS OF PREPARATION These consolidated and separate financial
The consolidated financial statements were authorised for issue by the Board of Directors on 1 June 2015.
 ACCOUNTING POLICIES for the year ended 31 March 2015 Transnet SOC Ltd (the Company ) is a company domiciled in South Africa. The consolidated financial statements for the year ended 31 March 2015 comprise
Introduction Consolidated statement of comprehensive income for the year ended 31 December 20XX... 6
 PKF International Limited administers a network of legally independent member firms which carry on separate businesses under the PKF Name. PKF International Limited is not responsible for the acts or omissions
ABERTIS INFRAESTRUCTURAS, S.A. Financial Statements and Directors' Report for the year ended 31 December 2016
 ABERTIS INFRAESTRUCTURAS, S.A. Financial Statements and Directors' Report for the year ended 31 December 2016 CONTENTS Balance sheets as at 31 December... 2 Statements of profit or loss... 4 Statements
PAO TMK Consolidated Financial Statements Year ended December 31, 2017
 Consolidated Financial Statements Consolidated Financial Statements Contents Independent auditor s report...3 Consolidated Income Statement...8 Consolidated Statement of Comprehensive Income...9 Consolidated
 Balance Sheets 31 December 2017 and 2016 (Expressed in ) Assets Note 2017 2016 Intangible assets Note 5 12,911,968 10,356,819 Computer softw are 12,911,968 10,356,819 Property, plant and equipment Note
The notes on pages 7 to 59 are an integral part of these consolidated financial statements
 CONSOLIDATED BALANCE SHEET As at 31 December Restated Restated Notes 2013 $'000 $'000 $'000 ASSETS Non-current Assets Investment properties 6 68,000 68,000 - Property, plant and equipment 7 302,970 268,342
ACCOUNTING POLICIES. for the year ended 30 June MURRAY & ROBERTS ANNUAL FINANCIAL STATEMENTS 13
 12 MURRAY & ROBERTS ANNUAL FINANCIAL STATEMENTS 13 ACCOUNTING POLICIES for the year ended 30 June 2013 1 PRESENTATION OF FINANCIAL STATEMENTS These accounting policies are consistent with the previous
TÉCNICAS REUNIDAS, S.A.
 This version of the annual accounts is a free translation from the original, which is prepared in Spanish. All possible care has been taken to ensure that the translation is an accurate representation
PAO TMK Consolidated Financial Statements Year ended December 31, 2016
 Consolidated Financial Statements Consolidated Financial Statements Contents Independent auditor s report...3 Consolidated Income Statement...8 Consolidated Statement of Comprehensive Income...9 Consolidated
Financial statements. The University of Newcastle newcastle.edu.au F1
 Financial statements The University of Newcastle newcastle.edu.au F1 Income statement For the year ended 31 December Consolidated Parent Revenue from continuing operations Australian Government financial
BLUESCOPE STEEL LIMITED FINANCIAL REPORT 2011/2012
 BLUESCOPE STEEL LIMITED FINANCIAL REPORT / ABN 16 000 011 058 Annual Financial Report - Page Financial statements Statement of comprehensive income 2 Statement of financial position 3 Statement of changes
EDP Renováveis, S.A. Condensed Consolidated Financial Statements 30 June 2012
 EDP Renováveis, S.A. Condensed Consolidated Financial Statements 30 June 2012 EDP Renováveis, S.A. and subsidiaries Condensed Consolidated Income Statement for the six months period ended 30 June 2012
Vitafoam Nigeria Plc. Consolidated and Separate financial statements Year ended 30 September 2014
 . Year ended 30 September 2014 Table of Contents Statement of Directors Responsibilities... i Report of the independent auditors... 1 & Statement of Profit or Loss and other Comprehensive Income... 2 &
(Continued) ~3~ March 31, 2017 December 31, 2016 March 31, 2016 Assets Notes AMOUNT % AMOUNT % AMOUNT % Current assets
 ~3~ March 31, 2017 December 31, 2016 March 31, 2016 Assets Notes AMOUNT % AMOUNT % AMOUNT % Current assets") Current assets DAVICOM SEMICONDUCTOR, INC. AND SUBSIDIARIES CONSOLIDATED BALANCE SHEETS (Expressed in thousands of New Taiwan dollars) (The consolidated balance sheets as of March 31,2017 and 2016 are
Current assets DAVICOM SEMICONDUCTOR, INC. AND SUBSIDIARIES CONSOLIDATED BALANCE SHEETS (Expressed in thousands of New Taiwan dollars) (The consolidated balance sheets as of March 31,2017 and 2016 are
NOTES TO THE GROUP ANNUAL FINANCIAL STATEMENTS FOR THE YEAR ENDED 30 SEPTEMBER 2014
 14 NOTES TO THE GROUP ANNUAL FINANCIAL STATEMENTS 1. ACCOUNTING POLICIES The financial statements are presented in South African Rand, unless otherwise stated, rounded to the nearest million, which is
For personal use only
 Statement of Profit or Loss for the year ended 31 December Note Continuing operations Revenue 2 100,795 98,125 Product and selling costs (21,072) (17,992) Royalties (149) (5,202) Employee benefits expenses
Financial statements. The University of Newcastle. newcastle.edu.au F1. 52 The University of Newcastle, Australia
 Financial statements The University of Newcastle 52 The University of Newcastle, Australia newcastle.edu.au F1 Contents Income statement................. 54 Statement of comprehensive income..... 55 Statement
ACCOUNTING POLICIES 1 PRESENTATION OF FINANCIAL STATEMENTS MURRAY & ROBERTS ANNUAL FINANCIAL STATEMENTS 17
 20 ACCOUNTING POLICIES FOR THE YEAR ENDED 30 JUNE 2017 1 PRESENTATION OF FINANCIAL STATEMENTS 1.1 Basis of preparation These consolidated and separate financial statements have been prepared under the
2.4 SUMMARY OF SIGNIFICANT ACCOUNTING POLICIES
 Franshion Properties (China) Limited Annual Report 2013 175 2.4 SUMMARY OF SIGNIFICANT ACCOUNTING POLICIES Subsidiaries A subsidiary is an entity (including a structured entity), directly or indirectly,
Amadeus IT Group, S.A. Auditors Report, Annual Accounts and Directors Report for the year ended December 31, 2014
 Amadeus IT Group, S.A. Auditors Report, Annual Accounts and Directors Report for the year ended December 31, 2014 Amadeus IT Group, S.A. Auditors Report for the year ended December 31, 2014 Amadeus IT
FLUIDRA, S.A. AND SUBSIDIARIES. Consolidated Financial Statements and Consolidated Management Report. 31 December 2017
 FLUIDRA, S.A. AND SUBSIDIARIES Consolidated Financial Statements and Consolidated Management Report 31 December 2017 (Together with the Audit Report thereon) Translation of consolidated financial statements
Group Income Statement For the year ended 31 March 2015
 Income Statement For the year ended 31 March Note Pre exceptionals Restated Exceptionals (note 11) Pre exceptionals Exceptionals (note 11) Continuing operations Revenue 5 10,606,080 10,606,080 11,044,763
CONSOLIDATED STATEMENT OF FINANCIAL POSITION as at 31 March 2016
 CONSOLIDATED STATEMENT OF FINANCIAL POSITION as at 31 March Notes (Restated) (Restated) 2014 ASSETS Non-current assets 5 604 3 654 3 368 Property, equipment and vehicles 5 3 199 2 985 2 817 Intangible
Consolidated Cash Flow Statement
 Consolidated Cash Flow Statement For the Financial 30 September 2016 Notes 000 000 Cash flows from operating activities Profit after taxation 8,722 33,782 Depreciation of property, plant and equipment
Accounting policies extracted from the 2016 annual consolidated financial statements
 Steinhoff International Holdings N.V. (Steinhoff N.V.) is a Netherlands registered company with tax residency in South Africa. The consolidated annual financial statements of Steinhoff N.V. for the period
ACCOUNTING POLICIES Year ended 31 March The numbers
 ACCOUNTING POLICIES Year ended 31 March 2015 Basis of preparation The consolidated and Company financial statements have been prepared on a historical cost basis. They are presented in sterling and all
FOMENTO DE CONSTRUCCIONES Y CONTRATAS, S.A. AND SUBSIDIARIES (CONSOLIDATED GROUP)
") FOMENTO DE CONSTRUCCIONES Y CONTRATAS, S.A. AND SUBSIDIARIES (CONSOLIDATED GROUP) Translation of financial statements originally issued in Spanish. In the event of a discrepancy, the Spanish-language version
FOMENTO DE CONSTRUCCIONES Y CONTRATAS, S.A. AND SUBSIDIARIES (CONSOLIDATED GROUP) Translation of financial statements originally issued in Spanish. In the event of a discrepancy, the Spanish-language version
Financial review Refresco Financial review 2017
 Financial review 2017 Financial review 2017 Financial review 2017 1 69 Consolidated income statement For the year ended December 31, 2017 (x 1 million euro) Note December 31, 2017 December 31, 2016 Revenue
YIOULA GLASSWORKS S.A. AND SUBSIDIARIES NOTES TO THE CONSOLIDATED FINANCIAL STATEMENTS JUNE 30, 2011
 1. CORPORATE INFORMATION: Yioula Glassworks S.A., a corporation formed under the laws of the Hellenic Republic (also known as Greece), οn August 5, 1959, by Messrs Kyriacos and Ioannis Voulgarakis is the
Principal Accounting Policies
 1. Basis of Preparation The accounts have been prepared in accordance with Hong Kong Financial Reporting Standards ( HKFRS ). The accounts have been prepared under the historical cost convention as modified
YIOULA GLASSWORKS S.A. AND SUBSIDIARIES NOTES TO THE CONSOLIDATED FINANCIAL STATEMENTS SEPTEMBER 30, 2012
 1. CORPORATE INFORMATION: Yioula Glassworks S.A., a corporation formed under the laws of the Hellenic Republic (also known as Greece), οn August 5, 1959, by Messrs Kyriacos and Ioannis Voulgarakis is the
Consolidated Financial Statements of ANGOSTURA HOLDINGS LIMITED. December 31, 2014 (Expressed in Trinidad and Tobago Dollars)
") Consolidated Financial Statements of (Expressed in Trinidad and Tobago Dollars) Consolidated Statement of Comprehensive Income Year ended (Expressed in Trinidad and Tobago Dollars) Restated Notes 2014
Consolidated Financial Statements of (Expressed in Trinidad and Tobago Dollars) Consolidated Statement of Comprehensive Income Year ended (Expressed in Trinidad and Tobago Dollars) Restated Notes 2014
Financial statements and Directors report
 Financial statements and Directors report Contents 04 Auditing 07 Economic profile of the Elecnor Group 15 Consolidated Annual Report 109 Directors Report 123 Economic profile of Elecnor, S.A. CUENTAS
For personal use only
 FINANCIAL REPORT FOR THE FINANCIAL YEAR ENDED 30 JUNE 1 FINANCIAL STATEMENTS YEAR ENDED 30 JUNE CONTENTS Page Directors Responsibility Statement 3 Independent Auditor s Report 4 Consolidated Income Statement
Accounting policies for the year ended 30 June 2016
 Accounting policies for the year ended 30 June 2016 The principal accounting policies adopted in preparation of these financial statements are set out below: Group accounting Subsidiaries Subsidiaries
Consolidated Income Statement
 59 Consolidated Income Statement For the year ended 31 December In millions of EUR Note 2016 2015 Revenue 5 20,792 20,511 income 8 46 411 Raw materials, consumables and services 9 (13,003) (12,931) Personnel
FInAnCIAl StAteMentS
 Financial STATEMENTS The University of Newcastle ABN 157 365 767 35 Contents 106 Income statement 107 Statement of comprehensive income 108 Statement of financial position 109 Statement of changes in equity
CONSOLIDATED STATEMENT OF FINANCIAL POSITION
 PETRONAS Dagangan Berhad Annual Report CONSOLIDATED STATEMENT OF FINANCIAL POSITION as at 31 December Note ASSETS Property, plant and equipment 3 3,372,292 3,794,252 Prepaid lease payments 4 456,821 476,856
NOTES TO THE FINANCIAL STATEMENTS For the year ended 31st December, 2013
 1. GENERAL Cosmos Machinery Enterprises Limited (the Company ) is a public limited company domiciled and incorporated in Hong Kong and its shares are listed on The Stock Exchange of Hong Kong Limited (the
OAO Scientific Production Corporation Irkut
 Consolidated Financial Statements for the year ended 31 December 2011 Consolidated Financial Statements for the year ended 31 December 2011 Contents Independent Auditors Report 3 Consolidated Income Statement
BlueScope Financial Report 2013/14
 BlueScope Financial Report /14 ABN 16 000 011 058 Annual Financial Report - Page Financial statements Statement of comprehensive income 2 Statement of financial position 4 Statement of changes in equity
Group accounting policies
 81 Group accounting policies BASIS OF ACCOUNTING AND REPORTING The consolidated financial statements as set out on pages 92 to 151 have been prepared on the historical cost basis except for certain financial
Accounting policies Year ended 31 March The numbers
 Accounting policies Year ended 31 March 2014 Basis of preparation The consolidated and Company financial statements have been prepared on a historical cost basis. They are presented in sterling and all
TOWARDS A SUSTAINABLE ENERGY FUTURE
 > INDEPENDENT AUDIT > CONSOLIDATED CONSOLIDATED ANNUAL ACCOUNTS TOWARDS A SUSTAINABLE ENERGY FUTURE 2 CONTENTS INDEPENDENT AUDIT 3 CONSOLIDATED BALANCE 5 CONSOLIDATED 14 CONSOLIDATED DIRECTOR S 84 InDEPENDENT
9. Share-Based Payments Jointly Controlled Entities Other Operating Income Other Operating Expense 130
 92 Financial Report Detailed contents: Consolidated financial statements Consolidated Income Statement for the year ended 31 December Consolidated Statement of Comprehensive Income for the year ended 31
ORASCOM CONSTRUCTION LIMITED
 ORASCOM CONSTRUCTION LIMITED Consolidated Financial Statements For the year ended 31 December 2016 TABLE OF CONTENTS Independent auditors report on the consolidated financial statements 1-8 Consolidated
May & Baker Nig Plc RC. UNAUDITED CONSOLIDATED FINANCIAL STATEMENTS 31 MARCH 2017
 ` May & Baker Nig Plc RC. 558 UNAUDITED CONSOLIDATED FINANCIAL STATEMENTS 31 MARCH 2017 UNAUDITED CONSOLIDATED STATEMENT OF PROFIT OR LOSS AND OTHER COMPREHENSIVE INCOME Note Continuing operations Revenue
Livestock Improvement Corporation Limited (LIC) ANNUAL REPORT. Year Ended 31 May 2014
 ANNUAL REPORT. Year Ended 31 May 2014") Livestock Improvement Corporation Limited (LIC) ANNUAL REPORT Year Ended 31 May 2014 Income Statement For the year ended 31 May 2014 In thousands of New Zealand dollars Note 2014 2013 2014 2013 Revenue
Livestock Improvement Corporation Limited (LIC) ANNUAL REPORT Year Ended 31 May 2014 Income Statement For the year ended 31 May 2014 In thousands of New Zealand dollars Note 2014 2013 2014 2013 Revenue
JAMAICAN TEAS LIMITED CONSOLIDATED FINANCIAL STATEMENTS 30 SEPTEMBER 2017
 CONSOLIDATED FINANCIAL STATEMENTS CONSOLIDATED FINANCIAL STATEMENTS I N D E X PAGE Independent Auditors' Report to the Members 1-4 FINANCIAL STATEMENTS Consolidated Statement of Profit or Loss and Other
Total assets Total equity Total liabilities
 Group balance sheet as at 31 December Notes R 000 R 000 ASSETS Non-current assets Property, plant and equipment 3 3 263 500 3 166 800 Intangible assets 4 69 086 66 917 Retirement benefit asset 26 117 397
OAO GAZ. Consolidated Financial Statements
 Consolidated Financial Statements for the year ended 31 December 2012 Contents Auditors Report 3 Consolidated Statement of Comprehensive Income 5 Consolidated Statement of Financial Position 7 Consolidated
Parques Reunidos Servicios Centrales, S.A.
 Annual Accounts and Directors Report for the year ended 30 September 2016 (With Independent Auditor s Report Thereon) (Free translation from the original in Spanish. In the event of discrepancy, the Spanish-language
Rhodia. Consolidated financial statements. Year ended December 31, 2009
 Rhodia Consolidated financial statements Year ended December 31, 2009 Rhodia Notes to the Consolidated Financial Statements for the Year ended December 31, 2009 1 / 82 CONTENTS A. CONSOLIDATED INCOME STATEMENTS...
Notes to the Financial Statements
 1. CORPORATE INFORMATION The Company was incorporated as an exempted company with limited liability in the Cayman Islands on 26 November 2003 under the Companies Law, Cap. 22 (Law 3 of 1961, as consolidated
Red Eléctrica Corporación, S.A. and Subsidiaries. Consolidated Annual Accounts 31 December Consolidated Directors Report 2013
 Red Eléctrica Corporación, S.A. and Subsidiaries Consolidated Annual Accounts 31 December 2013 Consolidated Directors Report 2013 (With Auditors Report Thereon) (Free translation from the original in Spanish.
Interregional Distribution Grid (IDG) Company of North-West. Consolidated Financial Statements for the year ended 31 December 2010
 Company of North-West. Consolidated Financial Statements for the year ended 31 December 2010") Interregional Distribution Grid (IDG) Company of North-West Consolidated Financial Statements for the year ended 31 December 2010 Contents INDEPENDENT AUDITORS REPORT 3 CONSOLIDATED STATEMENT OF COMPREHENSIVE
Interregional Distribution Grid (IDG) Company of North-West Consolidated Financial Statements for the year ended 31 December 2010 Contents INDEPENDENT AUDITORS REPORT 3 CONSOLIDATED STATEMENT OF COMPREHENSIVE
Vidrala, S.A. and Subsidiaries
 Vidrala, S.A. and Subsidiaries Consolidated Annual Accounts 31 December 2017 Consolidated Directors Report 2017 (With Independent Auditor's Report Thereon) Prepared in accordance with International Financial
BAWAN COMPANY AND SUBSIDIARIES (SAUDI JOINT STOCK COMPANY)
") CONSOLIDATED FINANCIAL STATEMENTS AND INDEPENDENT AUDITOR S REPORT CONSOLIDATED FINANCIAL STATEMENTS INDEX PAGE Independent auditor s report 3-9 Consolidated statement of financial position 10 Consolidated
CONSOLIDATED FINANCIAL STATEMENTS AND INDEPENDENT AUDITOR S REPORT CONSOLIDATED FINANCIAL STATEMENTS INDEX PAGE Independent auditor s report 3-9 Consolidated statement of financial position 10 Consolidated
OAO SIBUR Holding. International Financial Reporting Standards Consolidated Financial Statements and Independent Auditor s Report.
 OAO SIBUR Holding International Financial Reporting Standards Consolidated Financial Statements and Independent Auditor s Report 31 December 2013 IFRS CONSOLIDATED STATEMENT OF PROFIT OR LOSS (In millions
Bank Muscat (SAOG) NOTES TO THE CONSOLIDATED FINANCIAL STATEMENTS YEAR ENDED 31 DECEMBER 2012
 NOTES TO THE CONSOLIDATED FINANCIAL STATEMENTS YEAR ENDED 31 DECEMBER 2012") YEAR ENDED 1 LEGAL STATUS AND PRINCIPAL ACTIVITIES Bank Muscat (SAOG) (the Bank or the Parent Company) is a joint stock company incorporated in the Sultanate of Oman and is engaged in commercial and investment
YEAR ENDED 1 LEGAL STATUS AND PRINCIPAL ACTIVITIES Bank Muscat (SAOG) (the Bank or the Parent Company) is a joint stock company incorporated in the Sultanate of Oman and is engaged in commercial and investment
THE VALUE OF CONNECTED ENERGY CONSOLIDATED ANNUAL ACCOUNTS 2014
 THE VALUE OF CONNECTED ENERGY CONSOLIDATED _ Independent Audit Director s 2 Contents Independent Audit 3 Consolidated Balance 6 Consolidated 15 Consolidated Director s 79 THE VALUE OF CONNECTED ENERGY
Group Income Statement
 MASSMART GROUP ANNUAL FINANCIAL STATEMENTS 2014 Group Income Statement December 2014 December 2013 Rm Notes 52 weeks 53 weeks Revenue 5 78,319.0 72,512.9 Sales 5 78,173.2 72,263.4 Cost of sales (63,610.8)
International Financial Reporting Standards Consolidated Financial Statements and Auditors Report
 JSC Chelyabinsk Zinc Plant International Financial Reporting Standards Consolidated Financial Statements and Auditors Report For the years ended 31 December 2005, 2004 and 2003 Contents STATEMENT OF MANAGEMENT
Notes To The Financial Statements
 Notes To The Financial Statements 1. General Information EirGrid plc ( the Company ) is a public limited company, incorporated in Ireland, established pursuant to S.I. No 445 of 2000 European Communities
Notes to the Accounts
 Notes to the Accounts 1. Accounting Policies Statement of compliance The Group financial statements consolidate those of the Company and its subsidiaries (together referred to as the Group ), equity account
Continuing operations Revenue 3(a) 464, ,991. Revenue 464, ,991
 464, ,991. Revenue 464, ,991") STATEMENT OF PROFIT OR LOSS For the year ended 30 June 2017 Consolidated Consolidated Note Continuing operations Revenue 3(a) 464,411 323,991 Revenue 464,411 323,991 Other Income 3(b) 4,937 5,457 Share
STATEMENT OF PROFIT OR LOSS For the year ended 30 June 2017 Consolidated Consolidated Note Continuing operations Revenue 3(a) 464,411 323,991 Revenue 464,411 323,991 Other Income 3(b) 4,937 5,457 Share
Coca- Cola Hellenic Bottling Company S.A.
 Coca- Cola Hellenic Bottling Company S.A. Annual Report Table of Contents A. Independent Auditor s Report B. Consolidated Financial Statements Consolidated Balance Sheet... 1 Consolidated Income Statement........
CHELLARAMS PLC RC 639
 CHELLARAMS PLC RC 639 QUARTERLY FINANCIAL STATEMENTS FOR THE PERIOD ENDING 31 DECEMBER, 2018 FRC/2013/IODN/00000005336 FRC/2013/IODN/00000005335 Page 1 CONTENTS COMPLIANCE CERTIFICATE 3-4 CONSOLIDATED
Frontier Digital Ventures Limited
 Frontier Digital Ventures Limited Significant accounting policies This note provides a list of the significant accounting policies adopted in the preparation of these consolidated financial statements
Notes To The Financial Statements
 Notes To The Financial Statements 1. General Information EirGrid plc ( the Company ) is a public limited company, incorporated in Ireland, established pursuant to S.I. No 445 of 2000 European Communities
Selecta Group B.V. and its subsidiaries, Amsterdam (The Netherlands)
") Selecta Group B.V. and its subsidiaries, Amsterdam (The Netherlands) Consolidated financial statements for the year ended 30 September and report of the independent auditor Table of Contents Consolidated
Selecta Group B.V. and its subsidiaries, Amsterdam (The Netherlands) Consolidated financial statements for the year ended 30 September and report of the independent auditor Table of Contents Consolidated
Notes to the Consolidated Accounts For the year ended 31 December 2017
 National Express Group PLC Annual Report Financial Statements 119 Notes to the Consolidated Accounts 1 Corporate information The Consolidated Financial Statements of National Express Group PLC and its
RANBAXY SOUTH AFRICA (PTY) LTD (Registration Number 1993/001413/07) Audited Consolidated and Separate Annual Financial Statements for the year ended
 LTD (Registration Number 1993/001413/07) Audited Consolidated and Separate Annual Financial Statements for the year ended") Audited Consolidated and Separate Annual Financial Statements for the year ended 31 March Audited Consolidated and Separate Annual Financial Statements for the year ended 31 March Index The reports and
Audited Consolidated and Separate Annual Financial Statements for the year ended 31 March Audited Consolidated and Separate Annual Financial Statements for the year ended 31 March Index The reports and
RAS AL KHAIMAH POULTRY & FEEDING CO. P.S.C. Financial statements and independent auditor s report for the year ended 31 December 2016
 RAS AL KHAIMAH POULTRY & FEEDING CO. P.S.C. Financial statements and independent auditor s report for the year ended 31 December 2016 RAS AL KHAIMAH POULTRY & FEEDING CO. P.S.C. Contents Pages Independent
UNITED INTERNATIONAL TRANSPORTATION COMPANY (A SAUDI JOINT STOCK COMPANY) AND IT S SUBSIDIARY
 AND IT S SUBSIDIARY") (A SAUDI JOINT STOCK COMPANY) AND IT S SUBSIDIARY CONSOLIDATED FINANCIAL STATEMENTS 31 DECEMBER 2018 CONSOLIDATED FINANCIAL STATEMENTS 31 DECEMBER 2018 INDEX PAGE 1-6 Consolidated Statement of Profit or
(A SAUDI JOINT STOCK COMPANY) AND IT S SUBSIDIARY CONSOLIDATED FINANCIAL STATEMENTS 31 DECEMBER 2018 CONSOLIDATED FINANCIAL STATEMENTS 31 DECEMBER 2018 INDEX PAGE 1-6 Consolidated Statement of Profit or
Mining and Metallurgical Company Norilsk Nickel. Consolidated financial statements for the year ended 31 December 2015
 Mining and Metallurgical Company Norilsk Nickel Consolidated financial statements for the year ended 31 December 2015 CONSOLIDATED FINANCIAL STATEMENTS INDEX Page Statement of management s responsibilities
INTERNATIONAL FINANCIAL REPORTING STANDARDS
 INTERNATIONAL FINANCIAL REPORTING STANDARDS Model Financial Statements 2006 (Preliminary Version) About Deloitte Touche Tohmatsu Deloitte refers to one or more of Deloitte Touche Tohmatsu, a Swiss Verein,
in accordance with International Financial Reporting Standards (IFRS) as adopted by the European Union (EU)
 as adopted by the European Union (EU)") Financial Statements as at 31 December 2017 and for the year then ended in accordance with International Financial Reporting Standards (IFRS) as adopted by the European Union (EU) (Translation) Contents
Financial Statements as at 31 December 2017 and for the year then ended in accordance with International Financial Reporting Standards (IFRS) as adopted by the European Union (EU) (Translation) Contents
Notes to the Financial Statements For the financial year ended 31 December 2016
 Notes to the Financial Statements For the financial year ended These notes form an integral part of the financial statements. The financial statements for the financial year ended were authorised for issue
NOTES TO FINANCIAL STATEMENTS
 NOTES TO FINANCIAL STATEMENTS 1. CORPORATE INFORMATION CNT Group Limited is a limited liability company incorporated in Bermuda. The principal place of business is located at 31st Floor and Units E & F
Consolidated Financial Statements For the Year Ended 31 December 2017
 Consolidated Financial Statements For the Year Ended 31 December 2017 Consolidated Income Statement 2017 2016 Notes QR000 QR000 Interest Income 25 41,958,662 36,936,478 Interest Expense 26 (24,070,437)
QUAYSIDE HOLDINGS LIMITED AND SUBSIDIARIES
 QUAYSIDE HOLDINGS LIMITED AND SUBSIDIARIES ANNUAL FINANCIAL STATEMENTS For the year ended 30 JUNE 2015 CONTENTS PAGE Auditor s Report 1 Income Statement 4 Statement of Comprehensive Income 5 Statement
FINANCIAL STATEMENTS CONSOLIDATED BALANCE SHEET PROVISIONS CONSOLIDATED INCOME STATEMENT TRADE AND OTHER PAYABLES 84
 56 AALBERTS INDUSTRIES N.V. ANNUAL REPORT 2015 1. CONSOLIDATED BALANCE SHEET 58 18. PROVISIONS 81 2. CONSOLIDATED INCOME STATEMENT 59 19. TRADE AND OTHER PAYABLES 84 3. CONSOLIDATED STATEMENT OF COMPREHENSIVE
Consolidated Profit and Loss Account
 Consolidated Profit and Loss Account For the year ended 31st December 2008 US$ 000 Note 2008 2007 Revenue 5 6,545,140 5,651,030 Operating costs 6 (5,668,906) (4,645,842) Gross profit 876,234 1,005,188
ASSOCIATED BRITISH ENGINEERING PLC INTERIM REPORT FOR THE SIX MONTHS ENDED 30 SEPTEMBER 2018
 INTERIM REPORT FOR THE SIX MONTHS ENDED 30 SEPTEMBER INTERIM REPORT CONTENTS PAGE Chairman s statement 1 Responsibility statement 2 Group income statement 3 Group statement of comprehensive income 4 Group
Notes To The Financial Statements For the year ended 31 December 2014
 1. Corporate information Ornapaper Berhad is a public limited liability company, incorporated and domiciled in Malaysia, and is listed on the Main Market of Bursa Malaysia Securities Berhad. The principal
financial statements 2017
 financial statements 2017 1. Consolidated balance sheet 60 18. Provisions 84 2. Consolidated income statement 61 19. Trade and other payables 87 3. Consolidated statement of comprehensive income 62 20.
AIR ARABIA P.J.S.C. (AIR ARABIA) AND SUBSIDIARIES SHARJAH - UNITED ARAB EMIRATES
 AND SUBSIDIARIES SHARJAH - UNITED ARAB EMIRATES") AIR ARABIA P.J.S.C. (AIR ARABIA) AND SUBSIDIARIES SHARJAH - UNITED ARAB EMIRATES CONSOLIDATED FINANCIAL STATEMENTS AND INDEPENDENT AUDITOR S REPORT FOR THE YEAR ENDED DECEMBER 31, 2009 Consolidated Financial
AIR ARABIA P.J.S.C. (AIR ARABIA) AND SUBSIDIARIES SHARJAH - UNITED ARAB EMIRATES CONSOLIDATED FINANCIAL STATEMENTS AND INDEPENDENT AUDITOR S REPORT FOR THE YEAR ENDED DECEMBER 31, 2009 Consolidated Financial
FLUIDRA, S.A. AND SUBSIDIARIES. Consolidated Financial Statements and Consolidated Management Report. December 31, 2016
 FLUIDRA, S.A. AND SUBSIDIARIES Consolidated Financial Statements and Consolidated Management Report December 31, 2016 (Together with the Audit Report thereon) Translation of consolidated financial statements
Oman Telecommunications Company SAOG
 1 LEGAL INFORMATION AND ACTIVITIES Oman Telecommunications Company SAOG (the Parent Company or the Company ) is an Omani joint stock company registered under the Commercial Companies Law of the Sultanate
159 Company Income Statement 160 Company Balance Sheet 162 Notes to the Company Financial Statements
 73 Annual Report and Accounts 2018 Consolidated and Company Financial Statements 2018 Page Consolidated Financial Statements, presented in euro and prepared in accordance with IFRS and the requirements
EDP Renováveis, S.A. Balance Sheets at 31 December 2012 and (Expressed in thousands of Euros)
") EDP Renováveis, S.A. Balance Sheets at 31 December 2012 and 2011 (Expressed in thousands of Euros) Assets Note 2012 2011 Intangible assets 5 2,374 2,555 Property, plant and equipment 6 1,628 1,942 Non-current
EDP Renováveis, S.A. Balance Sheets at 31 December 2012 and 2011 (Expressed in thousands of Euros) Assets Note 2012 2011 Intangible assets 5 2,374 2,555 Property, plant and equipment 6 1,628 1,942 Non-current
Amadeus IT Group, S.A. Auditor s Report, Annual Accounts and Directors Report for the year ended December 31, 2018
 Auditor s Report, Annual Accounts and Directors Report for the year ended December 31, 2018 Auditor s Report for the year ended December 31, 2018 Annual Accounts for the year ended December 31, 2018
Independent Auditor s Report to the Members of Caltex Australia Limited
 61 Independent Auditor s Report to the Members of Caltex Australia Limited Report on the financial report We have audited the accompanying financial report of Caltex Australia Limited (the Company), which