Third Quarter
|
|
|
- MargaretMargaret Brooks
- 5 years ago
- Views:
Transcription

1 Third Quarter
2 Financial highlights NOK million 3Q 05 3Q 04 YTD 05 YTD 04 Revenues RVM Technology Collection & Materials Handling Recycling Technology Other non-deposit activities Operating profit excluding restructuring charges Operating profit including restructuring charges (12) 159 Cash flow from operations
3 Initial remarks The process of assessing which business areas will be included in the future strategic scope of TOMRA has been completed Divestment of Brazilian operations was concluded on 31 August for a sales price of 19 MUSD (122 MNOK) in cash payment The remaining business areas constitute TOMRA s future platform Ambition level for the previously announced cost reduction program is maintained despite increased activity level in Germany Cost reduction target of ~80 MNOK maintained despite increased activity level in R&D and engineering and capacity ramp-up in production Expected total restructuring charges in 3Q and 4Q will be reduced from 30 MNOK to 20 MNOK 2

4 SEGMENT: RVM Technology 3
5 RVM Technology - Financials NOK million 3Q 05 3Q 04 YTD 05 YTD 04 Revenue Nordic Central Europe & UK Rest of Europe US East/Canada Gross contribution (in %) 141 (47%) 159 (52%) 382*** (46%) 469 (51%) Operating expenses 101* 101** 331**** 309** Operating profit (in %) 40 (13%) 58 (19%) 51 (6%) 160 (17%) * Including restructuring charges of 6 MNOK in 3Q 05 ** Including restructuring charges of 7 MNOK in 3Q 04 *** Including write-downs of 12 MNOK (in 2Q 05) **** Including restructuring charges of 40 MNOK (1Q+2Q+3Q 05) 4
6 RVM Technology Highlights Europe Revenue decrease of 4% to 201 MNOK in 3Q 05 versus 209 MNOK in 3Q 04; year-to-date revenues down 14% due to weaker EURO and lower sales Increased sales in Denmark in August and September due to several new store openings Increased RVM installation rate in Holland from September due to new legislation North America Revenue increase of 11% to 15.1 MUSD in 3Q 05 versus 3Q 04, 4% increase in NOK to 98 MNOK; yearto-date revenues in USD up 7%, unchanged in NOK Stronger volumes main driver behind growth 5
7 RVM Technology Orders from Germany ~100 reverse vending systems to be installed in ~35 GLOBUS hypermarkets Total contract value of MEUR depending on choice of backroom solutions and share of machines delivered with crate unit Systems to be installed end of 2005 and beginning of 2006 A firm order for ~1,200 RVMs and an option for up to 500 additional machines to Ali Süd s ~1,650 stores Most of the machines are stand-alone machines with limited backroom solutions The machines will be delivered and installed during 1H 2006 There is a need to keep tight control over the supply chain during the roll-out in Germany Therefore, a potential change of strategic ownership of Tomra Production AS has been postponed Harmonization of product portfolio and outsourcing of certain components/platforms will continue 6

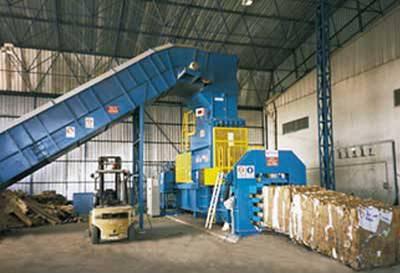
8 SEGMENT: Collection and Materials Handling
9 Collection & Materials Handling - Financials NOK million 3Q 05 3Q 04 YTD 05 YTD 04 Revenue US East/Canada US West Gross contribution (in %) 65 (26%) 59 (25%) 153 (24%) 143 (23%) Operating expenses Operating profit (in %) 32 (13%) 26 (11%) 60 (9%) 46 (7%) 8
10 Collection & Materials Handling Highlights US East/ Canada 3Q 2005 revenue increase of 7% to 22.1 MUSD in Materials Handling operations vs. 3Q 2004; up 1% in NOK to 143 MNOK YTD revenues in USD up 4% to 57 MUSD; down 3% measured in NOK US West/ California) 3Q 2005 Collection revenues up by 18% vs. 3Q 2004 to 16.3 MUSD; up 9% measured in NOK to 104 MNOK YTD revenues in USD up 19% to 44.4 MUSD; up 11% in NOK 9
11 Collection & Materials Handling margin development 12-months rolling average operating profit (EBIT) margin Percent Continued efficiencies driving improved profitability in Materials Handling operations JAN 04 FEB 04 MAR 04 APR 04 MAY 04 JUN 04 JUL 04 AUG 04 SEP 04 OCT 04 NOV 04 DEC 04 JAN 05 FEB 05 MAR 05 APR 05 MAY 05 JUN 05 JUL 05 AUG 05 SEP 05 Higher aluminum price and collection volumes main reason for growth and improved profitability in Collection 10

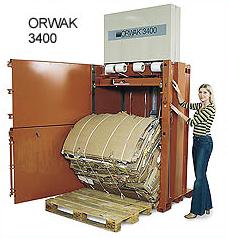
12 SEGMENT: Recycling Technology 11
13 Recycling Technology - Financials NOK million 3Q 05 3Q 04 YTD 05 YTD 04 Revenue Nordic Central Europe & UK Rest of Europe US/Canada Rest of World Gross contribution (in %) 45 (47%) 16 (67%) 121 (46%) 16 (67%) Operating expenses * 11 Operating profit (in %) 15 (16%) 5 (21%) 18 (7%) 5 (21%) * Including restructuring charges of 3 MNOK in 2Q 05 12
14 Recycling Technology Highlights Continued strong performance in both TiTech and Orwak Group operating margin of 16% in 3Q Strong operating margins driven by operational leverage in both TiTech and Orwak Group Order backlog of 77 MNOK end of 3Q 2005 vs. 65 MNOK end of 3Q 2004 supports strong development in 4Q 13
15 Recycling Technology - Order book Order book NOK million Q02 1Q03 2Q03 3Q03 4Q03 1Q04 2Q04 3Q04 4Q04 1Q05 2Q05 3Q05 Timing 14


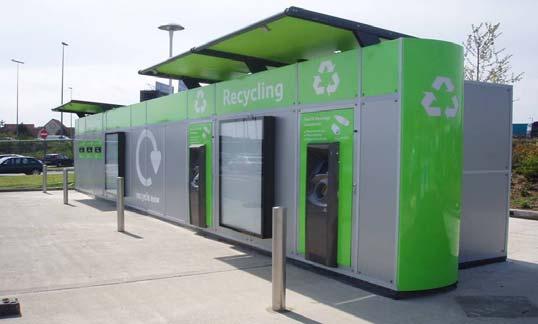
16 SEGMENT: Other non-deposit activities 15
17 Other non-deposit activities - Financials NOK million 3Q 05 3Q 04 YTD 05 YTD 04 Revenue Gross contribution (in %) 9 (15%) 15 (15%) 39 (16%) 39 (14%) Operating expenses * 79 Operating profit (10) (-17%) (10) (-10%) (124) (-49%) (40) (-15%) * Including total restructuring charges of 86 MNOK in 2Q 05 16
 commodity prices Current TOMRA technology applicable (with some")

18 Other non-deposit activities Japan Prerequisites for success in place High UBC volumes Consumer behavior favorable Existing manual solutions expensive Increasing PET (aluminum) commodity prices Current TOMRA technology applicable (with some modification) 10 RVMs operating in Tokyo municipalities Municipalities satisfied Positive consumer response sufficient volumes Retailers satisfied by higher customer traffic STRONG MOMENTUM CREATED, BUT SIGNIFICANT VOLUMES EXPECTED NO EARLIER THAN 2007/
19 Other non-deposit activities UK Key elements in business model to be assessed Current system costs low due to low recycling rates (but potential future costs high) Business model depends on high collection volumes to finance cost of technology Current TOMRA technology applicable, but must be industrialized 5 TRCs operating in the UK Consumers like them and use them, however Harder to change behavior than in Japan Volumes without incentives too low Plastics/metal mix unfavorable Incentives implemented Positive initial effect, too early to conclude Simple awareness building just initiated SIGNIFICANTLY INCREASED VOLUMES NEEDED 18
20 Invitation to Capital Markets Day Tomra Systems ASA invites all investors, fund managers and analysts to a Capital Markets Day on 8 November 2005 between 08:30 AM and 12:30 PM. Visiting address will be Drengsrudhagen 2, Asker. Registration will start at 8:00 AM. Key topics include: Overall TOMRA strategy and business plan going forward Project Germany expectations and preparations North America business strategy overview Non-deposit initiatives RVM product development and harmonization If you would like to attend the event, please send your confirmation to Ragnhild Ringheim via at ragnhild.ringheim@tomra.no or via fax , including your contact information, by 1 November
21 20
22 Addendum slides
23 Major shareholders* Shares Ownership 1. Folketrygdfondet % 2. State Street Bank & Client Omnibus D % 3. Danske Bank A/S 3887 Operations Sec % 4. Orkla ASA % 5. Morgan Stanley & Co. S/A Custrom Segrega % 6. Vital Forsikring ASA DnB NOR Kapitalforvaltning % 7. JP Morgan Chase Bank Clients Treaty Account % 8. Clearstream Banking CID Dept, Frankfurt % 9. VPF DNB NOR Norge % 10. SIS Segaintersettle % SUB-TOTAL % Other shareholders % TOTAL ( shareholders) % Total foreign ownership % *Registered 30 September
24 Shares & shareholders* Number of Country Shares shareholders Ownership 1. Norway ,2 % 2. Great Britain ,2 % 3. USA ,2 % 4. Denmark ,3 % 5. Luxembourg ,9 % 6. Switzerland ,0 % 7. Sweden ,0 % 8. Belgium ,8 % 9. Germany ,7 % 10. Irland ,6 % Total ,8 % *Registered 30 September
Checklist 2005 Q404 Q105 Q205 Q305
 FY 20 0 Checklist 20 To-do list 20 Status Q404 Q1 Q2 Q3 Integrate TiTech and Orwak Group into TOMRA Successfully complete pilots in the UK and Japan Execute on German opportunity Revitalize and achieve
Second Quarter
 Second Quarter 2005 0 Financial highlights NOK million 2Q 05 2Q 04 YTD 05 YTD 04 Revenue 687 591 1,286 1,184 RVM Technology 278 301 528 619 Collection & Materials Handling 213 206 400 395 Recycling Technology
THIRD QUARTER Highlights from third quarter 2005 include: Operating profit of 79 MNOK before restructuring charges (83 MNOK last year)
") THIRD QUARTER 2005 Highlights from third quarter 2005 include: Revenues of 701 MNOK (+5% percent relative to third quarter 2004) Operating profit of 79 MNOK before restructuring charges (83 MNOK last year)
THIRD QUARTER 2005 Highlights from third quarter 2005 include: Revenues of 701 MNOK (+5% percent relative to third quarter 2004) Operating profit of 79 MNOK before restructuring charges (83 MNOK last year)
Financial highlights Profit and loss statement
 First Quarter 2007 Financial highlights Profit and loss statement Figures in NOK million Revenues Collection Technology, Deposit Solutions Materials Handling Industrial Processing Technology Collection
Financial highlights Profit and loss statement
 Third Quarter 2007 Financial highlights Profit and loss statement Figures in NOK million 3Q 2007 3Q 2006 YTD 2007 YTD 2006 Revenues 861 1068 2542 2911 Collection Technology, Deposit Solutions 426 645 1228
Third Quarter October 2008
 Third Quarter 2008 15 October 2008 Financial Highlights g Profit and loss statement Figures in NOK million 3Q 2008 3Q 2007 YTD 2008 YTD 2007 Revenues 881 861 2546 2542 Collection Technology, Deposit Solutions
Financial highlights Profit and loss statement
 Second Quarter 2007 Financial highlights Profit and loss statement Figures in NOK million 2Q 2007 2Q 2006 YTD 2007 YTD 2006 Revenues 887 1020 1681 1843 Collection Technology, Deposit Solutions 430 656
Another strong quarter for TOMRA
 Another strong quarter for TOMRA Strong overall performance Revenues of 1,068 MNOK (+67 percent vs. 641 MNOK in third quarter 2005) Operating profit of 194 MNOK (71 MNOK in third quarter 2005) Cash flow
FOURTH QUARTER Highlights from fourth quarter 2006 include: Strong cash flow from operations of 254 MNOK (131 MNOK in fourth quarter 2005)
") FOURTH QUARTER 2006 Highlights from fourth quarter 2006 include: Revenues of 1,054 MNOK (+56 percent relative to 675 MNOK in fourth quarter 2005) Operating profit of 135 MNOK (79 MNOK in fourth quarter
FOURTH QUARTER 2006 Highlights from fourth quarter 2006 include: Revenues of 1,054 MNOK (+56 percent relative to 675 MNOK in fourth quarter 2005) Operating profit of 135 MNOK (79 MNOK in fourth quarter
2 ND QUARTER 2013 RESULTS ANNOUNCEMENT
 2 ND QUARTER 2013 RESULTS ANNOUNCEMENT TOMRA SYSTEMS ASA 18th of July 2013 HIGHLIGHTS FROM THE QUARTER INCLUDE Revenues Gross margin Revenues of 1,177 MNOK (948 MNOK in second quarter 2012). Organic, currency
Fourth Quarter 2010 Results
 Fourth Quarter 2010 Results 18 February 2011 1 Highlights from the quarter include Improved Group performance: Revenues up 9% (local currencies) Gross margin 41%, up from 33% (or up from 35% adjusted for
Financial highlights - 2nd quarter 2002
 Second Quarter 2002 Financial highlights - 2nd quarter 2002 Revenues from continuing operations 670 MNOK, up 4%! Europe 258 MNOK, up 14%! North America 323 MNOK, down 3%! South America 89 MNOK, up 3% 14%
THIRD QUARTER Strong performance in Collection Technology Deposit. Improved performance and outlook in Industrial Processing Technology
 THIRD QUARTER 2009 Highlights from third quarter 2009 include: Strong performance in Collection Technology Deposit Improved performance and outlook in Industrial Processing Technology California negatively
FOURTH QUARTER Highlights from fourth quarter 2008 include:
 FOURTH QUARTER 2008 Highlights from fourth quarter 2008 include: Revenues of 1076 MNOK (947 MNOK in fourth quarter 2007). Positive currency impact by 18% Operating profit of 136 MNOK (131 MNOK in fourth
FOURTH QUARTER Solid performance in Collection Technology. Continued improved performance and order inflow in Industrial Processing Technology
 FOURTH QUARTER 2009 Highlights from fourth quarter 2009: Solid performance in Collection Continued improved performance and order inflow in Industrial Processing California adversely affected by reduced
Six good reasons for choosing DNB in the new banking environment
 Six good reasons for choosing DNB in the new banking environment Bank of America Merrill Lynch, 18th Annual Banking & Insurance CEO Conference 2013 24 September, London Rune Bjerke, CEO of DNB 1 Reason
Third Quarter 2001 initials/subject/1
 Third Quarter 2001 Tomra Group 3rd Quarter 2001 NOKm Cont. Disc. Total Operating revenues 697 87 784 Cost of goods sold 408 99 507 Gross contribution 289 (12) 277 Operating expenses 176 4 180 Operating
SECOND QUARTER and FIRST HALF 2012
 SECOND QUARTER and FIRST HALF 2012 Highlights from second quarter 2012 include: Revenues of 948 MNOK (952 MNOK in second quarter 2011) Unchanged in local currencies +4% in Sorting Solutions - 2% in Collection
Executive Board meeting. 14 December 2011
 Executive Board meeting December EU measures ECB Key policy rate has been reduced to. percent Measures: Liquidity operation with a maturity of months Reserve requirements reduced from to per cent Reduced
Shareholder information
 SHAREHOLDER INFORMATION Index 89 06: Shareholder information Share price development in 2009 NOK NOK 60 50 40 30 20 10 0 Jan. Feb. Mar. Apr. May Jun. Jul. Aug. Sept. Oct. Nov. Dec. Introduction p.90 Dividend
Your Aquaculture Technology and Service Partner. Q Presentation Oslo - August 17 th, 2016 Trond Williksen, CEO Eirik Børve Monsen, CFO
 Q2 2016 Presentation Oslo - August 17 th, 2016 Trond Williksen, CEO Eirik Børve Monsen, CFO Agenda 1 Highlights 2 Financial performance 3 Outlook 4 Q&A Highlights Q2 2016 - by CEO Trond Williksen 3 Improved
Your Aquaculture Technology and Service Partner. Q Presentation Oslo - February 19 th, 2016 Trond Williksen, CEO Eirik Børve Monsen, CFO
 Q4 2015 Presentation Oslo - February 19 th, 2016 Trond Williksen, CEO Eirik Børve Monsen, CFO Agenda 1 Highlights 2 Financial performance 3 Outlook 4 Q&A Highlights Q4 2015 - by CEO Trond Williksen 3 MNOK
Lindab Group presentation Q3 2010
 lindab group presentation Lindab Group presentation Q3 2010 David Brodetsky, CEO Nils-Johan Andersson, CFO Agenda Highlights Group Business Areas Strategy Trends and outlook Q & A 2 Lindab Group Highlights
Your Aquaculture Technology and Service Partner. Q Presentation Oslo - May 11 th, 2016 Trond Williksen, CEO Eirik Børve Monsen, CFO
 Q1 2016 Presentation Oslo - May 11 th, 2016 Trond Williksen, CEO Eirik Børve Monsen, CFO Agenda 1 Highlights 2 Financial performance 3 Outlook 4 Q&A Highlights Q1 2016 - by CEO Trond Williksen 3 MNOK On
DNB SICAV High Yield. Monthly report - March 2018
 Monthly report - March 2018 140 120 100 80 60 40 20 0 (Net) BCGAXJPXC9 (Gross) Nov-15 May-16 Nov-16 May-17 Nov-17 Key figures Fund Index YTM 5.8 1.8 Effective duration 0.9 6.7 Credit duration 3.2 1.5 Volatility
Q Presentation. Oslo November 2 nd 2018 Hallvard Muri, CEO Simon Nyquist Martinsen, CFO
 Q3 218 Presentation Oslo November 2 nd 218 Hallvard Muri, CEO Simon Nyquist Martinsen, CFO Agenda Highlights Financial performance Outlook Q&A Highlights Q3 218 by CEO Hallvard Muri Order Intake development
INVESTMENT MARKET UPDATE UBC FACULTY PENSION PLAN
 INVESTMENT MARKET UPDATE UBC FACULTY PENSION PLAN MIKE LESLIE, FACULTY PENSION PLAN NEIL WATSON, LEITH WHEELER FEBRUARY 11, 2015 Presenters Mike Leslie Executive Director, Investments Faculty Pension Plan
Interim results briefing. Jyri Luomakoski President and CEO Riitta Palomäki CFO 1 9 / 2016
 Interim results briefing Jyri Luomakoski President and CEO Riitta Palomäki CFO 1 9 / 2016 Q3/2016: Performance in Europe improved, supply issues impacted North American business July - September, M Net
Economic outlook. Address by Central Bank Governor Svein Gjedrem to invited foreign embassy representatives. Norges Bank 18 March 2004
 Economic outlook Address by Central Bank Governor Svein Gjedrem to invited foreign embassy representatives Norges Bank 1 March SG Diplomat 1.. Long-term interest rates Per cent 15 1 9 Norway US Germany
Annika Falkengren. President and CEO. Result presentation. January September 2010
 Annika Falkengren President and CEO Result presentation January September 2010 Highlights Income Seasonally slow quarter supported by diversified earnings Further improved asset quality Baltics back in
Chapter 1 International economy
 Chapter International economy. Main points from the OECD's Economic Outlook A broad-based recovery has taken hold Asia, the US and the UK have taken the lead. Continental Europe will follow Investment
ENIRO Q3 REPORT Johan Lindgren, CEO Mattias Lundqvist, CFO Cecilia Lannebo, Head of IR
 ENIRO Q3 REPORT 2012-10-25 Johan Lindgren, CEO Mattias Lundqvist, CFO Cecilia Lannebo, Head of IR CEO INTRODUCTION & SUMMARY A digital media company with 74 percent of revenues being digital the transformation
LOAN MARKET DATA AND ANALYTICS BY THOMSON REUTERS LPC
 LOAN MARKET DATA AND ANALYTICS BY THOMSON REUTERS LPC GLOBAL LOAN MARKET DATA AND ANALYTICS BY THOMSON REUTERS LPC Secondary Market Bid Levels: Europe Slide 2 European CLO New Issue Volume Monthly Slide
Shareholder information
 SHAREHOLDER INFORMATION Index 107 07: Shareholder information Share price development in 2010 NOK 65 60 55 50 45 40 35 30 25 Jan. Feb. Mar. Apr. May Jun. Jul. Aug. Sept. Oct. Nov. Dec. Hydro Oslo Børs
THE NASDAQ OMX CLEARING MODEL 27 NOVEMBER 2013
 THE CLEARING MODEL 27 NOVEMBER 2013 THE CLEARING MODEL AGENDA Introduction + Regulations + Roadmap 2013 + EMIR License Clearing model + Account structure + Segregation + Portability Legal certainty 2 Introduction
XML Publisher Balance Sheet Vision Operations (USA) Feb-02
 Feb-02") Page:1 Apr-01 May-01 Jun-01 Jul-01 ASSETS Current Assets Cash and Short Term Investments 15,862,304 51,998,607 9,198,226 Accounts Receivable - Net of Allowance 2,560,786
Page:1 Apr-01 May-01 Jun-01 Jul-01 ASSETS Current Assets Cash and Short Term Investments 15,862,304 51,998,607 9,198,226 Accounts Receivable - Net of Allowance 2,560,786
DERIVATIVES, OSLO BØRS - OCTOBER 2012
 DERIVATIVES, OSLO BØRS - OCTOBER 2012 The OBX index fell slightly in October. The index decreased by 1.1% to 410.64 points. So far this year, the index is up 14.8%. The average number of contracts traded
Shareholder information
 SHAREHOLDER INFORMATION Index 115 05: Shareholder information Share price development in 2011 NOK 55 50 45 40 35 30 25 20 Jan. Feb. Mar. Apr. May Jun. Jul. Aug. Sept. Oct. Nov. Dec. Introduction p.116
Outlook for the Norwegian economy
 .9.9 Outlook for the Norwegian economy Governor Svein Gjedrem, Norges Bank, September 9 Indicator for world trade -month change. Per cent. January July 9 Manufacturing production Growth in past months.
Executive Board Meeting. 21 September 2011
 Executive Board Meeting September Global economic growth GDP growth. Four-quarter change. Q Q - US Euro area Emerging economies¹) Emerging Asian economies¹) - - - 8 ) GDP-weighted (PPP) Sources: IMF, Thomson
Investor Presentation For the Six Months Ended September 30, 2006
 Investor Presentation For the Six Months Ended September 30, 2006 November 15, 2006 Information Development Co., Ltd 1 Today s Presentation 1. Performance Overview 2. Industry Trends and ID s Operating
Chart pack to council for cooperation on macroprudential policy
 Chart pack to council for cooperation on macroprudential policy Contents List of charts... 3 Macro and macro-financial setting... 5 Swedish macroeconomic setting... 5 Foreign macroeconomic setting... Macro-financial
ENIRO Q1 REPORT Johan Lindgren, CEO Mattias Lundqvist, CFO Cecilia Lannebo, Head of IR
 ENIRO Q1 REPORT 2012-04-25 Johan Lindgren, CEO Mattias Lundqvist, CFO Cecilia Lannebo, Head of IR FINANCIAL HIGHLIGHTS, Q1 2012 Revenues SEK 959 M (966), a decline of 0,7% (-24). Organically revenues declined
Q presentation. 19 November 2015
 Q3 2015 presentation 19 November 2015 1 Today s presenters Axel Hjärne Chief Executive Officer Gert Sköld Chief Financial Officer 2 Eltel in brief Q3 2015 business performance Q3 2015 financials Market
Interim Jan June/ 2005 results briefing
 Interim Jan June/ 2005 results briefing Helsinki, 4 August 2005 Market and business review Financial results Outlook Jan Lång, President and CEO Jyri Luomakoski, CFO and Deputy CEO Jan Lång Questions Interim
Exchange Rate Requirements
 C APPENDIX Foreign Currency Financial Reporting from Euro to Yen to Yuan: A Guide to Fundamental Concepts and Practical Applications By Robert Rowanc Copyright 2011 by SAS Institute, Inc. Exchange Rate
EMGS ASA FIRST QUARTER PRESENTATION 2012
 EMGS ASA FIRST QUARTER PRESENTATION 2012 CEO, Roar Bekker CFO, Svein Knudsen Hotel Continental, 16 May 2012 DISCLAIMER This quarterly presentation includes and is based, inter alia, on forward-looking
Euro GC Pooling. Continues Dynamic Growth. Frankfurt, February 29, 2008
 Continues Dynamic Growth Frankfurt, February 29, 2008 Agenda Introduction Eurex Repo: Latest Development Euro GC Pooling: Overview and latest Development Outlook Page 2 Eurex Repo Development of Outstanding
Revenue growth of 15% compared to last year Q revenues up to NOK 251m from NOK 218m in Q3 2014
 Interim report Revenue growth of 15% compared to last year revenues up to NOK 251m from NOK 218m in Increased profitability Operating margin of 18% relative to 17% in EPS of NOK 0.08 compared to NOK 0.06
Spheria Australian Smaller Companies Fund
 29-Jun-18 $ 2.7686 $ 2.7603 $ 2.7520 28-Jun-18 $ 2.7764 $ 2.7681 $ 2.7598 27-Jun-18 $ 2.7804 $ 2.7721 $ 2.7638 26-Jun-18 $ 2.7857 $ 2.7774 $ 2.7690 25-Jun-18 $ 2.7931 $ 2.7848 $ 2.7764 22-Jun-18 $ 2.7771
Please scroll to find the 2018 and 2019 global fund holiday calendars.
 Please scroll to find the 2018 and 2019 global fund holiday calendars. 2018 Exchange-Traded fund holiday Vanguard Ireland-domiciled ETFs Jan Feb Mar Apr May Jun 1 2 5 12 15 25 9 12 14 15 16 19 28 20 29
SIX MONTHS REPORT, JAN JUN 2018
 SIX MONTHS REPORT, JAN JUN 2018 TELEPHONE/AUDIO CONFERENCE 11 JULY 2018, AT 11.00 CET TOMMY ANDERSSON, PRESIDENT AND CEO HELENA WENNERSTRÖM, EVP AND CFO DIRECT LINK AUDIOCAST: HTTPS://TV.STREAMFABRIKEN.COM/BULTEN
Financial results briefing Q3/2015
 Financial results briefing Q3/2015 Jyri Luomakoski President and CEO Uponor Corporation Uponor, Inc. factory, Apple Valley, Minnesota, USA Q3/2015 market overview Nordics Construction activity in Sweden
HUD NSP-1 Reporting Apr 2010 Grantee Report - New Mexico State Program
 HUD NSP-1 Reporting Apr 2010 Grantee Report - State Program State Program NSP-1 Grant Amount is $19,600,000 $9,355,381 (47.7%) has been committed $4,010,874 (20.5%) has been expended Grant Number HUD Region
Investor presentation, Interim report June 2018 August 2018 NOBINA AB. Nobina investor presentation, Q2 2018/19
 1 Investor presentation, Interim report June 2018 August 2018 NOBINA AB SECOND QUARTER WITH SOLID PERFORMANCE NET SALES EBIT EBT CASH FLOW SEK Millions 2,235 (2,169) SEK Millions 117 (106) SEK Millions
2 ND QUARTER 2017 RESULTS ANNOUNCEMENT
 2 ND QUARTER 2017 RESULTS ANNOUNCEMENT TOMRA SYSTEMS ASA 2 nd Quarter Results 19.07.2017 HIGHLIGHTS FROM THE QUARTER Revenues Gross margin Operating expenses EBITA Cashflow TOMRA Collection TOMRA Sorting
1 st Quarter 2002 DNO ASA 23 May 2002
 1 st Quarter 2002 DNO ASA 23 May 2002 1 Highlights 1st Quarter 2002 Operations Achieved record production > 20.000 BOPD Yemen production up 100 % due to Sharyoof Maintaining good operating margins Reduced
Financial & Business Highlights For the Year Ended June 30, 2017
 Financial & Business Highlights For the Year Ended June, 17 17 16 15 14 13 12 Profit and Loss Account Operating Revenue 858 590 648 415 172 174 Investment gains net 5 162 909 825 322 516 Other 262 146
ELECTROMAGNETIC GEOSERVICES ASA FIRST QUARTER 2014 RESULTS. CEO, Roar Bekker CFO, Svein Knudsen 8 May 2014
 ELECTROMAGNETIC GEOSERVICES ASA FIRST QUARTER 2014 RESULTS CEO, Roar Bekker CFO, Svein Knudsen 8 May 2014 DISCLAIMER This quarterly presentation includes and is based, inter alia, on forward-looking information
Revenue 1,716 million (7% y/y) EBITA 150 million (11% y/y) EBITA margin 8,8 %
 EBITA 150 million (11% y/y) EBITA margin 8,8 %") Q3 HIGHLIGHTS GROUP Revenue 1,716 million (7% y/y) EBITA 150 million (11% y/y) EBITA margin 8,8 % Gaining share in Bank & Finance; +6% y/y Change in pension scheme implemented Significant restructuring
Q3 HIGHLIGHTS GROUP Revenue 1,716 million (7% y/y) EBITA 150 million (11% y/y) EBITA margin 8,8 % Gaining share in Bank & Finance; +6% y/y Change in pension scheme implemented Significant restructuring
NASDAQ Global Index. More information about the Index can be found at
 NASDAQ Global Index The NASDAQ Global Index is a float adjusted market capitalization-weighted index designed to track the performance of global equities covering over 98% of the entire listed market capitalization
Annual Accounts Annika Falkengren President & CEO
 Annual Accounts 2014 Annika Falkengren President & CEO Unique economic environment Key Interest rates % 2.00 1.80 1.60 1.40 1.20 1.00 0.80 0.60 0.40 0.20 0.00 Jan-14 Sweden Norway Eurozone Feb-14 Mar-14
FULL YEAR REPORT, 2017 TELEPHONE/AUDIO CONFERENCE 8 FEBRUARY 2018, AT CET TOMMY ANDERSSON, PRESIDENT AND CEO HELENA WENNERSTRÖM, EVP AND CFO
 TELEPHONE/AUDIO CONFERENCE 8 FEBRUARY 2018, AT 15.30 CET TOMMY ANDERSSON, PRESIDENT AND CEO HELENA WENNERSTRÖM, EVP AND CFO DIRECT LINK AUDIOCAST: HTTPS://TV.STREAMFABRIKEN.COM/BULTEN Q4 2017 TELECONFERENCE:
FOR RELEASE: MONDAY, MARCH 21 AT 4 PM
 Interviews with 1,012 adult Americans conducted by telephone by Opinion Research Corporation on March 18-20, 2011. The margin of sampling error for results based on the total sample is plus or minus 3
General Fund Revenue
 Millions Percent of Kathy Steinert, Director of Fiscal Services Phone: 541.923.8927 145 SE Salmon Ave Redmond, OR 97756 kathy.steinert@redmond.k12.or.us Date: May 23, 2014 To: Redmond School District Board
Theta Capital Management. Distressed Investing - Deep value opportunities through the cycle
 Theta Capital Management Distressed Investing - Deep value opportunities through the cycle VBA Wouter ten Brinke 19 May 2010 2 Theta Capital Management Products Product Investment style Target return Target
Investors and Analysts Presentation: 9M 2010 Financial Results
 Investors and Analysts Presentation: 9M 2010 Financial Results Moscow, 30 November 2010 Disclaimer This presentation contains "forward-looking statements" which include all statements other than statements
Interim Results for the 6 months to 30 September NOVEMBER 2010
 Interim Results for the 6 months to 30 September 2010 8 NOVEMBER 2010 Nick Robertson Introduction Strong H1 Retail sales up 50%, group revenues up 45% Strong UK and international retail sales, up 26% and
Webcast Q Kista,
 Webcast Q2 2016 Kista, 2016 08 15 Agenda 1) Q2 highlights 2) Traffic and product development 3) Financials 2 Revenues are still the problem, efficiency enhancing activities continues to deliver Operating
Market and Economic Charts. Retail Fund Management Team Investec Asset Management
 Market and Economic Charts Retail Fund Management Team Investec Asset Management 30 April 2010 Looking at Markets Global SA Economics Major Index Performance Major Index Performance Market Drivers Inflation
- Victor Haghani, Founder Elm. Watch the full talk here
 "After more than 20 years in finance, from the LSE to Salomon Brothers to LTCM, you d have thought that I d have figured out how to invest my family s savings. Well, it was 2002, I just turned 40, and
Credit Suisse Swiss Pension Fund Index Q2 2017
 Credit Suisse Swiss Pension Fund Index Q2 217 YTD 217: 3.94% Q2 217: 1.15% Positive second quarter, with slowdown in June Significant positive contribution from Swiss equities in reporting quarter Sharp
Results 2Q18. August 2, 2018
 Results August 2, 2018 Highlights Indicators Var. x 2Q17 Operating Income (R$ MM) 42.8 +92.7% Operating Margin 1.8% +0.8 p.p. Net operating revenues: R$2.4 billion (+9.0% vs. 2Q17) ASK (BN) 10.7 +2.2%
Exam 1 Problem Solving Questions Review
 Exam 1 Problem Solving Questions Review SECTION 1 The following data were obtained from a recent quarterly report for Dell Computer (in millions): Net revenue $8,028 Cost of revenue $6,580 Inventories:
Informed Storage: Understanding the Risks and Opportunities
 Art Informed Storage: Understanding the Risks and Opportunities Randy Fortenbery School of Economic Sciences College of Agricultural, Human, and Natural Resource Sciences Washington State University The
Multi Asset Indices Selection and Rebalance Dates
 29 January 2015 DBIQ Index Selection Report Multi Asset Indices Selection and Rebalance Dates The report is designed to provide the details of future dates of selection and rebalance of various Multi-Asset
DnB NOR Norway and beyond
 DnB NOR 2008-2010 Norway and beyond Presentation by Rune Bjerke, group chief executive Capital Markets Day, 9 October 2007 DnB NOR has a strong track record Development in pre-tax operating profit before
Second estimate for the third quarter of 2008 EU27 current account deficit 39.5 bn euro 19.3 bn euro surplus on trade in services
 STAT/09/12 22 January 2009 Second estimate for the third quarter of 20 EU27 current account deficit 39.5 bn euro 19.3 bn euro surplus on trade in According to the latest revisions1, the EU272 external
FINANCIAL RESULTS AND COMPANY OVERVIEW Second-Quarter Performance
 FINANCIAL RESULTS AND COMPANY OVERVIEW 08 Second-Quarter Performance September 5 th, 08 Disclaimer Forward-Looking Statements and Preliminary Results This presentation includes forward-looking statements
Transparency in the U.S. Repo Market
 Transparency in the U.S. Repo Market Antoine Martin Federal Reserve Bank of New York October 11, 2013 The views expressed in this presentation are my own and may not represent the views of the Federal
Economic and Revenue Update
 Economic and Revenue Update A Briefing for the Money Committees Aubrey L. Layne, Jr. Secretary of Finance Commonwealth of Virginia www.finance.virginia.gov January 2018 Topics for Discussion National and
Interim results briefing Jyri Luomakoski President and CEO Riitta Palomäki CFO 1 3 / 2016
 Interim results briefing Jyri Luomakoski President and CEO Riitta Palomäki CFO 1 3 / 2016 Q1/2016: Steady progress in Europe, strong growth in North America January - March, M Net sales Healthy U.S. market
Executive Board meeting
 Executive Board meeting September 7 Growth forecasts Consensus Forecasts GDP. Percentage change on previous year 9 7 Forecasts August Forecasts September World North Western Japan America Europe 7 Asia
INTERIM REPORT Q2-2011
 INTERIM REPORT Q2-2011 Live presentation 23 August 2011 at 11:00 am NKT Holding A/S / IR presentation / Interim Report 2, 2011 1 Agenda Highlights Q2 Financial results Q2 2011 Companies - NKT Cables -
Global House View: Market Outlook
 HSBC GLOBAL ASSET MANAGEMENT September 29 Global House View: Market Outlook Contents 1688/HSB1395a Market performance Macro-economic Picture Market Views: high level asset allocation Market Views: Equity
Global Economic Prospects
 Global Economic Prospects Back from the Brink? Andrew Burns World Bank Prospects Group April 12, 212 1 Amid some signs of improvement, global recovery remains fragile First quarter of 212 has been generally
Review of Registered Charites Compliance Rates with Annual Reporting Requirements 2016
 Review of Registered Charites Compliance Rates with Annual Reporting Requirements 2016 October 2017 The Charities Regulator, in accordance with the provisions of section 14 of the Charities Act 2009, carried
EVRY ASA Q PRESENTATION CEO BJÖRN IVROTH CFO HENRIK SCHIBLER
 1 EVRY ASA Q2 2018 PRESENTATION CEO BJÖRN IVROTH CFO HENRIK SCHIBLER Agenda Group highlights Business update focus on consulting in EVRY Financial highlights Business area performance Concluding remarks
THE ECONOMIC OUTLOOK FOR THE NORWEGIAN ECONOMY GOVERNOR ØYSTEIN OLSEN, 8 MAY 2015
 THE ECONOMIC OUTLOOK FOR THE NORWEGIAN ECONOMY GOVERNOR ØYSTEIN OLSEN, 8 MAY 5 Flexible inflation targeting Low and stable inflation Key policy rate in MPR /5 and MPR /,5% Stable developments in output
FINANCIAL RESULTS Q CEO Christian Rynning-Tønnesen CFO Irene Egset 25 October 2018
 FINANCIAL RESULTS Q3 2018 CEO Christian Rynning-Tønnesen CFO Irene Egset 25 October 2018 Health, safety and environment TRI-rate 1 7 6 5 4 3 2 1 0 2016 2017 2018 Health and safety - Two serious injuries
Q Presentation. Oslo May 16 th 2018 Hallvard Muri, CEO Simon Nyquist Martinsen, CFO
 Q1 218 Presentation Oslo May 16 th 218 Hallvard Muri, CEO Simon Nyquist Martinsen, CFO Agenda Highlights Financial performance Outlook Q&A Highlights Q1 218 by CEO Hallvard Muri Continued growth in order
HIPIOWA - IOWA COMPREHENSIVE HEALTH ASSOCIATION Unaudited Balance Sheet As of July 31
 Unaudited Balance Sheet As of July 31 Total Enrollment: 407 Assets: Cash $ 9,541,661 $ 1,237,950 Invested Cash 781,689 8,630,624 Premiums Receivable 16,445 299,134 Prepaid 32,930 34,403 Assessments Receivable
OTHER DEPOSITS FINANCIAL INSTITUTIONS DEPOSIT BARKAT SAVING ACCOUNT
 WEIGHTAGES JAN FEB MAR APR MAY JUN JUL AUG SEPT OCT NOV DEC ANNOUNCEMENT DATE 19.Dez.14 27.Jän.15 24.Feb.15 26.Mär.15 27.Apr.15 26.Mai.15 25.Jun.15 28.Jul.15 26.Aug.15 23.Sep.15 27.Okt.15 25.Nov.15 MUDARIB
HIPIOWA - IOWA COMPREHENSIVE HEALTH ASSOCIATION Unaudited Balance Sheet As of January 31
 Unaudited Balance Sheet As of January 31 Total Enrollment: 371 Assets: Cash $ 1,408,868 $ 1,375,117 Invested Cash 4,664,286 4,136,167 Premiums Receivable 94,152 91,261 Prepaid 32,270 33,421 Assessments
AUDITED RESULTS FOR THE YEAR ENDED 31 DECEMBER 2016
 AUDITED RESULTS FOR THE YEAR ENDED 31 DECEMBER 2016 AGENDA 2 1 Opening remarks / market update 2 Financial results 3 Operational review 4 Strategy update 5 Outlook 1 2 3 4 5 OPENING REMARKS / MARKET UPDATE
Credit Suisse Swiss Pension Fund Index Q1 2017
 Credit Suisse Swiss Pension Fund Index Q1 217 YTD 217: 2.76% Q1 217: 2.76% Credit Suisse Pension Fund Index starts year at all-time high Allocation to foreign equities at all-time high; allocation to Swiss
- Victor Haghani, Founder Elm. Watch the full talk here
 "After more than 20 years in finance, from the LSE to Salomon Brothers to LTCM, you d have thought that I d have figured out how to invest my family s savings. Well, it was 2002, I just turned 40, and
August 8, 2006 Authorized for Public Release 148 of 158. Appendix 1: Materials used by Mr. Kos
 August 8, 6 Authorized for Public Release 148 of 158 Appendix 1: Materials used by Mr. Kos Class II -- Restricted FR Page 1 of 4 Realized Volatility of MSCI Equity Indices 35 25 15 5 22 August 8, 6 Authorized
Yara International ASA. 21 October 2011
 Yara International ASA Third quarter results 211 21 October 211 1 Summary third quarter Strong results driven by improved margins Strong demand outside Europe, satisfactory sales in Europe Sluiskil urea
VINX 30 Index. More information about the Index can be found at
 VINX 30 Index The VINX 30 Index is the leading share index of the Nordic Exchanges and the Oslo exchange. The index consists of the 30 largest and most actively traded shares listed on NASDAQ OMX Nordic