Fourth Quarter 2010 Results
|
|
|
- Marian McCoy
- 6 years ago
- Views:
Transcription


1 Fourth Quarter 2010 Results 18 February
2 Highlights from the quarter include Improved Group performance: Revenues up 9% (local currencies) Gross margin 41%, up from 33% (or up from 35% adjusted for currencies and onetime costs in 2009) Operating profit before other items of 122 MNOK (29 MNOK in fourth quarter 2009) Cash flow from operations of 225 MNOK (235 MNOK in fourth quarter 2009) Signed option to acquire Odenberg, a Dublin based provider of food sorting technology Completed two acquisitions in USA: CBSI and RSI 2
3 Financial highlights profit and loss statement 4 th Quarter Full year Amounts in NOK million Adj* Adj* Revenues Collection Technology Material Handling Industrial Processing Technology Gross contribution Gross margin % % % % % % Operating expenses Operating profit before other items Operating margin % 29 3% 15 2% % 292 9% 235 7% Loss on sale of Presona AB EU penalty Operating profit Including onetime costs: in cost of goods sold in operating expenses *2009 actual restated at 2010 exchange rates, estimated 3 3
4 Financial highlights balance sheet, cash flow and capital structure Amounts in NOK million 31 Dec Dec 2009 ASSETS Intangible assets Leasing equipment Other fixed assets Inventory Shortterm receivables Cash and cash equivalents LIABILITIES AND EQUITY Equity Interest bearing liabilities Noninterest bearing liabilities Cash flow from operations 225 MNOK in 4Q 2010 versus 235 MNOK in 4Q 2009 Full year: 525 MNOK in 2010 versus 457 MNOK in 2009 Seasonality in material handling operations Cash flow from investments Investments of 135 MNOK in 4Q quarter 2010 (of which 77 MNOK related to acquisitions), versus 41 MNOK in 4Q2009 Interest bearing debt Decreased by 85 MNOK during 4 th quarter 500 MNOK 5 year revolving debt facility, established in January 2011, replacing previous 250 MNOK facility due to expire in October 2011 Strong financial position 55% equity 4
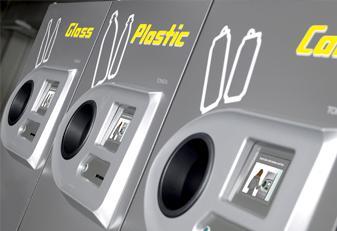


5 TOMRA Collection Technology
6 Highlights Collection Technology Overall Revenues up 10% measured in local currencies Gross margin was 47%, up from 38% last year (or 41% adjusted for onetime costs and currency) Operating expenses increased to 159 MNOK from 110 MNOK, mainly due to legal expenses in USA, acquisition costs and high activity within R&D and market initiatives Europe Europe Stronger than expected quarter with a significant number of installations in December, normally a slow sales month US Revenue increase of 17% in local currency (USD), due to higher throughput volumes and additional machine sales in New York and Connecticut CBSI In November 2010, Tomra acquired 100% of the assets in Can And Bottles Systems Inc Based in Portland, Oregon manufactures, sells and services RVMs, mainly for supermarkets in their home state Purchase price of USD 5.3 million, paid in cash In November 2010, US competitor Envipco filed complaint against Tomra for alleged antitrust violations. Tomra has accrued estimated pretrial expenses 6
7 Collection Technology financials 4 th Quarter Full year Amounts in NOK million Adj* Adj* Revenues Nordic Central Europe & UK Rest of Europe US East/Canada Rest of the world Gross contribution in % % % % % % % Operating expenses Operating profit** in % 91 17% 83 16% 73 15% % % % Including onetime costs: in cost of goods sold in operating expenses * 2009 actual restated at 2010 exchange rates, estimated ** Before other items 7
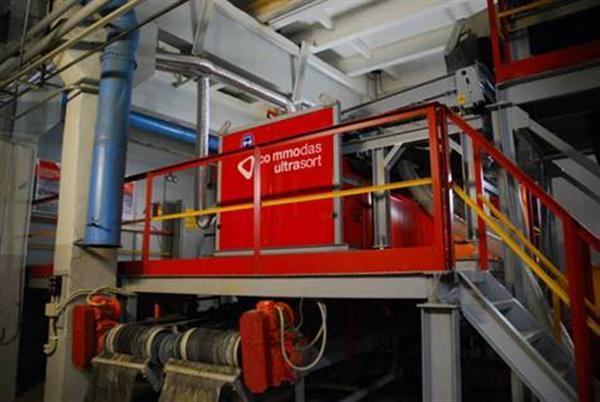


8 TOMRA Industrial Processing Technology
9 Highlights Industrial Processing Technology Revenue up 11%, adjusted for currency and divestment of Presona (sold in 2Q10) Order backlog at NOK 181 million (NOK 245 million including Odenberg), compared to NOK 130 million at the end of 4Q09 Positive momentum in all segments, particularly within mining though future quarterly development might be somewhat volatile due to little recurring revenues January 2011; Acquired Odenberg Leading provider of advanced sorting and processing technology to the international food processing industry 171 employees in Ireland, USA, Slovakia and The Netherlands Serves several of the world s top 10 food manufacturers More than 2,000 Odenberg optical sorting systems worldwide Important step towards realizing TOMRA s strategy of strengthening its market position and product offering within sensor based sorting Enterprise value of 55 MEUR + conditional payments of up to 2.5 MEUR based upon financial performance Purchase price settled in cash 9
10 NOK million Order backlog Odenberg 10
11 Industrial Processing Technology financials 4 th Quarter Full year Amounts in NOK million Adj* Adj* Revenues Nordic Central Europe & UK Rest of Europe US East/Canada US West Rest of the World Gross contribution in % 95 51% 96 48% 91 47% % % % Operating expenses Operating profit in % 30 16% 10 5% 7 4% % 0 (10) Including onetime costs: in cost of goods sold in operating expenses * 2009 actual restated at 2010 exchange rates, estimated ** Before other items 11 11
12 Formation of IPT division Revenue development for Industrial Processing Technology NOK million 994* Acquired for ~225 MNOK Acquired for ~110 MNOK Acquired for ~100 MNOK Acquired for ~160 MNOK Acquired for ~440 MNOK * Proforma figures, including Odenberg with 303 MNOK NOK million 12
13 Sorting and inspection business SEGMENT RECYCLING MINING FOOD SHARE OF REVENUE ~60% ~10% ~30% MATERIALS Plastics, paper, metals etc. Minerals, gems, coal, metal slag etc. Potatoes, tomatoes, carrots etc. CUSTOMERS Material recovery facilities, scrap dealers, metal shredder operators Mining companies Food growers, packers and processors INDUSTRY POSITION 1 1 Top
14 Sensor based technology portfolio Gammaradiation Xray Ultraviolett (UV) Visible light (VIS) Near Infrared (NIR) Infrarot (IR) Microwaves [m] Sensor/ Technology Material Property Segment RM (Radiometric) Natural Gamma Radiation Mining XRT (Xray transmission) Atomic Density Recycling, Mining, Food XRF COLOR (CCD Color Camera) PM (Photometric) NIR / MIR (Near/Medium Infrared Spectrometry) X ray fluorescence (Elemental Spectroscopy) Reflection, Absorption, Transmission Monochromatic Reflection /Absorption of Laser Light Reflection, Absorption (Molecular Spectroscopy) Recycling, Mining Recycling, Mining, Food Mining Recycling, Mining, Food Radio waves Alternating current (AC) LIBS EM (Electro Magnetic sensor) Laser induced breakdown spectroscopy Conductivity, permeability Recycling, Mining Recycling, Mining, Food 14
15 Installed base of optical sorters Installed or sold machines Recycling Units 2100 Mining Units 150 Food Units 2,700 Source: TOMRA analysis 15
16 Market size and potential ESTIMATES Total annual market size for different sensorbased sorting segments EUR million ~1,000 ~ Food Mining Metal recycling Waste recycling Source: TOMRA analysis 16
17 Our strategy Maintain technology leadership position Continue to invest heavily in R&D Further develop web of partners Expand geographically Aggressively target promising regions and markets Leverage market presence across entire portfolio Use M&A to consolidate market and enter new segments New verticals/segments in sensorbased sorting Increase footprint and scale through consolidation 17


18 TOMRA Material Handling
19 Highlights Material Handling Overall Solid growth in revenues Significant growth in gross margins East Coast/Canada Revenue up from 19.2 MUSD to 20.1 MUSD due to more water bottles being returned Effect somewhat offset by lower volumes from third party recyclers RSI In December 2010, TOMRA acquired 100 percent of the assets in Returnable Services Inc (RSI), a material pickup and processing provider in Maine The company provides collections at over 400 redemption centers and reverse vending locations throughout the state The purchase price was 7.5 MUSD in cash California Performance improvements driven by: Higher aluminum prices LME 4Q2009 => $2024/ton LME 4Q2010 => $2435/ton Positive EBIT impact of 1.0 MUSD in the quarter Handling fees reinstated Streamlined operations 19
20 Material Handling financials Amounts in USD million 4Q Q 2009 YTD 2010 YTD 2009 Revenues US East/Canada US West (California) Gross contribution in % % 1.1 3% % % Operating expenses Operating profit in % 0.8 2% (10.5) % (11.5) Including onetime costs: in cost of goods sold in operating expenses


21 Outlook 21
22 Outlook Collection Technology: 2011 is expected to report higher activity than in 2010, mainly due to the 70 MEUR order signed by a European retailer in 2010 for installation in 2011 and 2012 Industrial Processing Technology: Activity expected to increase in 2011, quarterly development might be somewhat volatile due to little recurring business in the segment. Overall performance linked to macro drivers, particularly commodity prices. Due to portfolio lead time before installation is expected to be somewhat higher in first quarter 2011 Odenberg expected to be consolidated from February The entity has some seasonality, with higher activity during the summer in the northern hemisphere In the Material Handling East Coast unit, growth will mainly come from the new entity in Maine (RSI), which is expected to contribute approximately 7 MUSD in revenues The West Coast operations within Material Handling are expected to continue to benefit from higher aluminium prices and efficiency gains Integration expenses for the three newly acquired entities (Odenberg, RSI and CBSI) will increase operating expenses slightly. Operating expenses in Collection Technology are expected to go somewhat down A stronger NOK relative to both EUR and USD will negatively impact performance in all segments going into
23 Capital Markets Day
24 CMD 2011 Preliminary agenda 07:4508:15 Registration Breakfast Place: Høyres Hus, Oslo Time: 20 May 08:15 13:00 08:1508:20 Introduction and agenda 08:2009:00 Repositioning of Tomra Stefan Ranstrand, CEO 09:0009:45 Collection technology Harald Henriksen, SVP Technology 09:4510:00 Break 10:0010:15 Sorting technology General introduction Rune Marthinussen, MD TITECH 10:15 10:45 Sorting technology Technology Dr Volker Rehrmann, Technical Director 10:4511:15 Sorting technology Waste and metal recycling Tom L. Eng, Global sales and marketing director 11:1511:30 Break 11:3012:00 Sorting technology Mining Hartmut Harbeck, Director sales mining 12:0012:30 Sorting technology Food Maurice Moynihan, MD Odenberg 12:3012:40 Financial targets Espen Gundersen, CFO 12:4013:00 Summary and final Q&A Stefan Ranstrand, CEO 13:0013:45 Lunch 24
25 Addendum slides
26 Major shareholders 1 Orkla ASA % 2 Folketrygdfondet % 3 The Northern Trust C Treaty Account % 4 JP Morgan Chase Bank Nordea Treaty Account % 5 Ferd AS Invest % 6 State Street Bank AN A/C Client Omnibus F % 7 Bank of New York MEL S/A Mellon Nominee % 8 Varma Mutual Pension Company % 9 Clearstream Banking % 10 The Hermes Focus FUN C/O The Northern Trust % SUBTOTAL % Other Shareholders % TOTAL (7,549 shareholders) % Total foreign ownership 55.2% 26
27 Shareholders by nationality 1 Norway 44.8% Great Britain 20.1% 61 3 USA 10.9% Luxembourg 6.6% 28 5 Finland 4.5% 22 6 France 3.9% 18 7 Belgium 2.1% 10 8 Denmark 1.2% 36 9 Holland 1.1% Switzerland 1.0% 14 TOTAL 96.2%
28 Copyright The material in this document, including photographs, drawings and images, remains the property of Tomra Systems ASA or third party contributors where appropriate. No part of this document may be reproduced or used in any form without express prior permission from Tomra Systems ASA and applicable acknowledgements. No trademark, copyright or other notice shall be altered or removed from any reproduction. Disclaimer This Presentation includes and is based, inter alia, on forwardlooking information and statements that are subject to risks and uncertainties that could cause actual results to differ. These statements and this Presentation are based on current expectations, estimates and projections about global economic conditions, the economic conditions of the regions and industries that are major markets for Tomra Systems ASA and Tomra Systems ASA s (including subsidiaries and affiliates) lines of business. These expectations, estimates and projections are generally identifiable by statements containing words such as expects, believes, estimates or similar expressions. Important factors that could cause actual results to differ materially from those expectations include, among others, economic and market conditions in the geographic areas and industries that are or will be major markets for Tomra Systems businesses, oil prices, market acceptance of new products and services, changes in governmental regulations, interest rates, fluctuations in currency exchange rates and such other factors as may be discussed from time to time in the Presentation. Although Tomra Systems ASA believes that its expectations and the Presentation are based upon reasonable assumptions, it can give no assurance that those expectations will be achieved or that the actual results will be as set out in the Presentation. Tomra Systems ASA does not guarantee the accuracy, reliability or completeness of the Presentation, and Tomra Systems ASA (including its directors, officers and employees) accepts no liability whatsoever for any direct or consequential loss arising from the use of this report or its contents. Tomra Systems consists of many legally independent entities, constituting their own separate identities. Tomra Systems is used as the common brand or trade mark for most of these entities. In this presentation we may sometimes use Tomra Systems, we or us when we refer to Tomra Systems companies in general or where no useful purpose is served by identifying any particular Tomra Systems company. 28
2 ND QUARTER 2013 RESULTS ANNOUNCEMENT
 2 ND QUARTER 2013 RESULTS ANNOUNCEMENT TOMRA SYSTEMS ASA 18th of July 2013 HIGHLIGHTS FROM THE QUARTER INCLUDE Revenues Gross margin Revenues of 1,177 MNOK (948 MNOK in second quarter 2012). Organic, currency
Financial highlights Profit and loss statement
 Third Quarter 2007 Financial highlights Profit and loss statement Figures in NOK million 3Q 2007 3Q 2006 YTD 2007 YTD 2006 Revenues 861 1068 2542 2911 Collection Technology, Deposit Solutions 426 645 1228
Financial highlights Profit and loss statement
 Second Quarter 2007 Financial highlights Profit and loss statement Figures in NOK million 2Q 2007 2Q 2006 YTD 2007 YTD 2006 Revenues 887 1020 1681 1843 Collection Technology, Deposit Solutions 430 656
Another strong quarter for TOMRA
 Another strong quarter for TOMRA Strong overall performance Revenues of 1,068 MNOK (+67 percent vs. 641 MNOK in third quarter 2005) Operating profit of 194 MNOK (71 MNOK in third quarter 2005) Cash flow
Third Quarter October 2008
 Third Quarter 2008 15 October 2008 Financial Highlights g Profit and loss statement Figures in NOK million 3Q 2008 3Q 2007 YTD 2008 YTD 2007 Revenues 881 861 2546 2542 Collection Technology, Deposit Solutions
Third Quarter
 Third Quarter 2005 0 Financial highlights NOK million 3Q 05 3Q 04 YTD 05 YTD 04 Revenues 701 665 1987 1849 RVM Technology 299 303 827 922 Collection & Materials Handling 247 237 647 632 Recycling Technology
Financial highlights Profit and loss statement
 First Quarter 2007 Financial highlights Profit and loss statement Figures in NOK million Revenues Collection Technology, Deposit Solutions Materials Handling Industrial Processing Technology Collection
SECOND QUARTER and FIRST HALF 2012
 SECOND QUARTER and FIRST HALF 2012 Highlights from second quarter 2012 include: Revenues of 948 MNOK (952 MNOK in second quarter 2011) Unchanged in local currencies +4% in Sorting Solutions - 2% in Collection
Checklist 2005 Q404 Q105 Q205 Q305
 FY 20 0 Checklist 20 To-do list 20 Status Q404 Q1 Q2 Q3 Integrate TiTech and Orwak Group into TOMRA Successfully complete pilots in the UK and Japan Execute on German opportunity Revitalize and achieve
Second Quarter
 Second Quarter 2005 0 Financial highlights NOK million 2Q 05 2Q 04 YTD 05 YTD 04 Revenue 687 591 1,286 1,184 RVM Technology 278 301 528 619 Collection & Materials Handling 213 206 400 395 Recycling Technology
4 TH QUARTER 2018 RESULTS ANNOUNCEMENT. TOMRA SYSTEMS ASA 4 th Quarter Results
 4 TH QUARTER 2018 RESULTS ANNOUNCEMENT TOMRA SYSTEMS ASA 4 th Quarter Results 21.02.2019 HIGHLIGHTS FROM 2018 Revenues Gross margin Operating expenses EBITA Cashflow Revenues of 8,596 MNOK (7,432 MNOK
THIRD QUARTER Strong performance in Collection Technology Deposit. Improved performance and outlook in Industrial Processing Technology
 THIRD QUARTER 2009 Highlights from third quarter 2009 include: Strong performance in Collection Technology Deposit Improved performance and outlook in Industrial Processing Technology California negatively
FOURTH QUARTER Solid performance in Collection Technology. Continued improved performance and order inflow in Industrial Processing Technology
 FOURTH QUARTER 2009 Highlights from fourth quarter 2009: Solid performance in Collection Continued improved performance and order inflow in Industrial Processing California adversely affected by reduced
2 ND QUARTER 2017 RESULTS ANNOUNCEMENT
 2 ND QUARTER 2017 RESULTS ANNOUNCEMENT TOMRA SYSTEMS ASA 2 nd Quarter Results 19.07.2017 HIGHLIGHTS FROM THE QUARTER Revenues Gross margin Operating expenses EBITA Cashflow TOMRA Collection TOMRA Sorting
FOURTH QUARTER Highlights from fourth quarter 2006 include: Strong cash flow from operations of 254 MNOK (131 MNOK in fourth quarter 2005)
") FOURTH QUARTER 2006 Highlights from fourth quarter 2006 include: Revenues of 1,054 MNOK (+56 percent relative to 675 MNOK in fourth quarter 2005) Operating profit of 135 MNOK (79 MNOK in fourth quarter
FOURTH QUARTER 2006 Highlights from fourth quarter 2006 include: Revenues of 1,054 MNOK (+56 percent relative to 675 MNOK in fourth quarter 2005) Operating profit of 135 MNOK (79 MNOK in fourth quarter
FOURTH QUARTER Highlights from fourth quarter 2008 include:
 FOURTH QUARTER 2008 Highlights from fourth quarter 2008 include: Revenues of 1076 MNOK (947 MNOK in fourth quarter 2007). Positive currency impact by 18% Operating profit of 136 MNOK (131 MNOK in fourth
THIRD QUARTER Highlights from third quarter 2005 include: Operating profit of 79 MNOK before restructuring charges (83 MNOK last year)
") THIRD QUARTER 2005 Highlights from third quarter 2005 include: Revenues of 701 MNOK (+5% percent relative to third quarter 2004) Operating profit of 79 MNOK before restructuring charges (83 MNOK last year)
THIRD QUARTER 2005 Highlights from third quarter 2005 include: Revenues of 701 MNOK (+5% percent relative to third quarter 2004) Operating profit of 79 MNOK before restructuring charges (83 MNOK last year)
3Q 2018 Fornebu, October 24, 2018 Luis Araujo and Svein Stoknes
 3Q 2018 Fornebu, October 24, 2018 Luis Araujo and Svein Stoknes Agenda 3Q 2018 Answers Questions Introduction Luis Araujo Chief Executive Officer Financials Svein Stoknes Chief Financial Officer Q&A Session
Financial highlights - 2nd quarter 2002
 Second Quarter 2002 Financial highlights - 2nd quarter 2002 Revenues from continuing operations 670 MNOK, up 4%! Europe 258 MNOK, up 14%! North America 323 MNOK, down 3%! South America 89 MNOK, up 3% 14%
4Q 2018 Fornebu, February 8, 2019 Luis Araujo and Svein Stoknes
 4Q 2018 Fornebu, February 8, 2019 Luis Araujo and Svein Stoknes Agenda 4Q 2018 Answers Questions Introduction Luis Araujo Chief Executive Officer Financials Svein Stoknes Chief Financial Officer Q&A Session
4Q16. Fornebu, February 9, 2017 Luis Araujo and Svein Stoknes Aker Solutions
 4Q16 Fornebu, February 9, 2017 Luis Araujo and Svein Stoknes Agenda Introduction Luis Araujo Chief Executive Officer Q&A Session Luis Araujo Svein Stoknes Financials Svein Stoknes Chief Financial Officer
1Q 2018 Fornebu, April 27, 2018 Luis Araujo and Svein Stoknes
 1Q 2018 Fornebu, April 27, 2018 Luis Araujo and Svein Stoknes Agenda 1Q 2018 Answers Questions Introduction Luis Araujo Chief Executive Officer Financials Svein Stoknes Chief Financial Officer Q&A Session
Q2 & 1H Results 2016 Kristian Røkke and Leif H. Borge Oslo July 14, 2016
 First Quarter Results 2017 Kristian Røkke and Leif Borge Oslo May 3, 2017 Webside endring Q2 & 1H Results 2016 Kristian Røkke and Leif H. Borge Oslo July 14, 2016 2016 Akastor First Quarter Results 2017
Third Quarter 2001 initials/subject/1
 Third Quarter 2001 Tomra Group 3rd Quarter 2001 NOKm Cont. Disc. Total Operating revenues 697 87 784 Cost of goods sold 408 99 507 Gross contribution 289 (12) 277 Operating expenses 176 4 180 Operating
Q4 & PRELIMINARY ANNUAL RESULTS 2015
 Q4 & PRELIMINARY ANNUAL RESULTS 2015 Kristian Røkke and Leif Borge Oslo February 17, 2016 Agenda FOURTH QUARTER HIGHLIGHTS Kristian Røkke CEO FINANCIALS Leif Borge CFO Q & A Kristian Røkke and Leif Borge
Q2 & 1H Results 2016 Kristian Røkke and Leif H. Borge Oslo July 14, 2016
 Third Quarter Results 2017 Kristian Røkke and Leif Borge Fornebu October 25, 2017 Webside endring Q2 & 1H Results 2016 Kristian Røkke and Leif H. Borge Oslo July 14, 2016 2017 Akastor First Quarter Results
Fourth-Quarter and Preliminary Results 2014
 Fourth-Quarter and Preliminary Results 2014 Frank O. Reite and Leif Borge Oslo 10 February 2015 2015 Akastor Agenda Introduction Frank O. Reite CEO Financials Leif Borge CFO Q&A Q&A Session Frank O. Reite
Second-Quarter Results 2014
 2Q Second-Quarter Results 214 Fornebu, July 17, 214 Øyvind Eriksen and Leif Borge 214 Aker Solutions Slide 1 July 17, 214 Second-quarter results 214 Agenda 2Q 214 Introduction Øyvind Eriksen Chairman Financials
HANDELSBANKEN MID/SMALL CAP SEMINAR
 HANDELSBANKEN MID/SMALL CAP SEMINAR President and CEO, Stefan Ranstrand 24th of May 2018 Stockholm, Sweden THE DAWN OF THE RESOURCE REVOLUTION THE CHALLENGE: THE OPPORTUNITY: 3 billion more middle-class
Eng US. 14 July 2017
 Eng US 14 July 2017 Presentation 2017 Eng US Disclaimer This presentation has been prepared by Duni AB (the Company ) solely for use at this investor presentation and is furnished to you solely for your
Q2 & 1H Results 2016 Kristian Røkke and Leif H. Borge Oslo July 14, 2016
 Second Quarter Results 2018 Karl Erik Kjelstad (CEO) and Leif Borge (CFO) Fornebu July 13, 2018 Webside endring Q2 & 1H Results 2016 Kristian Røkke and Leif H. Borge Oslo July 14, 2016 2018 Akastor First
Q4 Presentation February, 2013
 Q4 Presentation 2012 14 February, 2013 Disclaimer This presentation has been prepared by Duni AB (the Company ) solely for use at this investor presentation and is furnished to you solely for your information
Q2 & 1H Results 2016 Kristian Røkke and Leif H. Borge Oslo July 14, 2016
 First Quarter Results 2018 Karl Erik Kjelstad (CEO) and Leif Borge (CFO) Fornebu May 3, 2018 Webside endring Q2 & 1H Results 2016 Kristian Røkke and Leif H. Borge Oslo July 14, 2016 2018 Akastor First
Oslo, February 27 th, 2012 Trond Williksen, CEO Eirik Børve Monsen, CFO
 Q4 2012 Presentation ti Oslo, February 27 th, 2012 Trond Williksen, CEO Eirik Børve Monsen, CFO 1 Agenda Highlights Q4 2012 Trond Williksen, CEO Financial performance Q4 20122 Eirik Børve Monsen, CFO Statement
Second quarter Vestas Wind Systems A/S. Copenhagen, 18 August Classification: Public
 Second quarter Vestas Wind Systems A/S Copenhagen, 18 August Disclaimer and cautionary statement This presentation contains forward-looking statements concerning Vestas' financial condition, results of
PHOTOCURE ASA RESULTS FOR FIRST QUARTER MAY Kjetil Hestdal, MD, President & CEO Erik Dahl, CFO
 PHOTOCURE ASA RESULTS FOR FIRST QUARTER 2018 23 MAY 2018 Kjetil Hestdal, MD, President & CEO Erik Dahl, CFO DISCLAIMER The information included in this Presentation contains certain forward-looking statements
Norsk Gjenvinning Group 3rd Quarter 2017 Erik Osmundsen, CEO and Dean Zuzic, CFO
 Norsk Gjenvinning Group 3rd Quarter 2017 Erik Osmundsen, CEO and Dean Zuzic, CFO Disclaimer VV Holding AS is providing the following interim financial statements for Q3 2017 to holders of its NOK 2,235,000,000
Creating value through active ownership. Frank O. Reite and Leif Borge London 17 March 2015
 Creating value through active ownership Frank O. Reite and Leif Borge London 17 March 2015 Agenda THIS IS AKASTOR Frank O. Reite CEO FINANCIALS Leif Borge CFO March 17, 2015 Slide 2 Akastor is set up to
Q presentation. 5 February 2015
 Q4 2014 presentation 5 February 2015 Agenda Highlights Financial overview Market outlook Q4 Highlights Strong finish to a record year Revenue of NOK 7 549 million, up 10.3% EBITDA* of NOK 396 million,
ELECTROMAGNETIC GEOSERVICES ASA FIRST QUARTER 2014 RESULTS. CEO, Roar Bekker CFO, Svein Knudsen 8 May 2014
 ELECTROMAGNETIC GEOSERVICES ASA FIRST QUARTER 2014 RESULTS CEO, Roar Bekker CFO, Svein Knudsen 8 May 2014 DISCLAIMER This quarterly presentation includes and is based, inter alia, on forward-looking information
INTERIM REPORT JANUARY - SEPTEMBER 2017
 Interim report Q3 2017 January - September Troax Group AB (publ) Hillerstorp 6th of November, 2017 INTERIM REPORT JANUARY - SEPTEMBER 2017 JULY SEPTEMBER 2017 Order intake increased by 30 per cent to 35,3
TRANSFORMS ANNUAL REPORT 2011
 ANNUAL REPORT 2011 TRANSFORMS contents Key Figures 3 Chief Executive Officer s Review 4 Business Overview 8 Corporate Responsibility Report 10 Environmental Review 12 Social and Ethical Review 14 Corporate
Interim Jan-March 2007 results briefing Helsinki 26 April Jan Lång President and CEO
 Interim Jan-March 2007 results briefing Helsinki 26 April 2007 Jan Lång President and CEO Q1/2007: Positive market environment in Europe, decline in U.S. continues Lively demand for Uponor solutions Strong
Order intake increased by 31 per cent to 78,3 (59,6) MEUR. Adjusted for acquisition and
 MEUR. Adjusted for acquisition and") Interim report Q2 2017 January - June Troax Group AB (publ) Hillerstorp 16th August, 2017 INTERIM REPORT 2017 APRIL JUNE 2017 Order intake increased by 30 per cent to 39,8 (30,5) MEUR. Adjusted for acquisition
Interim report Q2 2017 January - June Troax Group AB (publ) Hillerstorp 16th August, 2017 INTERIM REPORT 2017 APRIL JUNE 2017 Order intake increased by 30 per cent to 39,8 (30,5) MEUR. Adjusted for acquisition
Third quarter results October 2018
 Third quarter results 2018 23 October 2018 Third quarter 2018 Highlights Johan Sverdrup P1 jacket delivered on time Johan Sverdrup ULQ topside reached Mechanical Complete milestone on time Additional work,
Norsk Gjenvinning Group 3rd Quarter 2017 Erik Osmundsen, CEO and Dean Zuzic, CFO
 Norsk Gjenvinning Group 3rd Quarter 2017 Erik Osmundsen, CEO and Dean Zuzic, CFO Disclaimer VV Holding AS is providing the following interim financial statements for Q3 2017 to holders of its NOK 2,235,000,000
Your Aquaculture Technology and Service Partner. Q Presentation Oslo - May 8 th, 2015 Trond Williksen, CEO Eirik Børve Monsen, CFO
 Q1 2015 Presentation Oslo - May 8 th, 2015 Trond Williksen, CEO Eirik Børve Monsen, CFO Agenda 1 Highlights 2 Financial performance 3 Outlook 4 Q&A Highlights Q1 2015 - by CEO Trond Williksen 3 On track
Q Presentation Oslo, October 28, Trond Williksen, CEO
 Q3 2011 Presentation Oslo, October 28, 2011 Trond Williksen, CEO 1 Agenda Highlights Q3 2011 Financials Q3 2011 Outlooks Q & A 2 Highlights 3 Increased profitability Operating revenues in Q3 was 226.7
Contents. Key Figures
 Annual Report 2007 Contents Key Figures INTRODUCTION 3 Key Figures 4 CEO Letter 6 Group Management 7 Group Structure BUSINESS BACKGROUND 8 Industry Perspective 10 Business Strategy & Goals 12 TOMRA in
Sparebank 1 Markets Energy Conference. Idar Eikrem, EVP & CFO 28 February 2018
 Sparebank 1 Markets Energy Conference Idar Eikrem, EVP & CFO 28 February 2018 1 Well positioned for future market opportunities 1) Leading contractor with proven track record 2) Competitive position strengthened
TGS EARNINGS RELEASE 1 st QUARTER RESULTS
 TGS EARNINGS RELEASE 25 APRIL 2013 TGS EARNINGS RELEASE 1 st QUARTER RESULTS 1 st QUARTER HIGHLIGHTS Consolidated net revenues were USD 211 million, an increase of 10% compared to Q1 2012. Net late sales
Eng US. Q1 Presentation April, 2015
 Eng US Presentation 2015 24 April, 2015 Eng US Disclaimer This presentation has been prepared by Duni AB (the Company ) solely for use at this investor presentation and is furnished to you solely for your
Aker Seafoods Second quarter 2010 Profits improved in high season
 Aker Seafoods Second quarter 21 Profits improved in high season CEO Liv Monica B Stubholt CFO Gunnar Aasbø-Skinderhaug Welcome Agenda Topic Speaker Operational Update Liv Monica Stubholt, CEO Group Harvesting
4 T H Q U A R T E R O s l o, 3 1 J a n u a r y
 4 TH QUARTER 28 Oslo, 3 January 29 Agenda Per A Sørlie, President & CEO Highlights Proposed dividend Business areas Strategic update Outlook Per Bjarne Lyngstad, CFO Financial performance 2 Highlights
Year-end Report 2016 January - December YEAR-END REPORT 2016 OCTOBER DECEMBER 2016 JANUARY DECEMBER 2016 TROAX GROUP FIGURES
 Year-end Report 2016 January - December Troax Group AB (publ) Hillerstorp 14th February, 2017 YEAR-END REPORT 2016 OCTOBER DECEMBER 2016 Order intake increased by 21 per cent, or 26 per cent adjusted for
Your Aquaculture Technology and Service Partner. Q Presentation Oslo - May 11 th, 2016 Trond Williksen, CEO Eirik Børve Monsen, CFO
 Q1 2016 Presentation Oslo - May 11 th, 2016 Trond Williksen, CEO Eirik Børve Monsen, CFO Agenda 1 Highlights 2 Financial performance 3 Outlook 4 Q&A Highlights Q1 2016 - by CEO Trond Williksen 3 MNOK On
Year-end report 2017 January - December YEAR-END REPORT 2017 OCTOBER DECEMBER 2017 JANUARY DECEMBER 2017
 Year-end report 2017 January - December Troax Group AB (publ) Hillerstorp 12th of February, 2018 YEAR-END REPORT 2017 OCTOBER DECEMBER 2017 Order intake increased by 17 per cent to 38,4 (32,8) MEUR. Adjusted
Q1 Presentation April, 2011
 Q1 Presentation 2011 28 April, 2011 Disclaimer This presentation has been prepared by Duni AB (the Company ) solely for use at this investor presentation and is furnished to you solely for your information
Q1 Presentation April, 2013
 Q1 Presentation 19 April, Disclaimer This presentation has been prepared by Duni AB (the Company ) solely for use at this investor presentation and is furnished to you solely for your information and may
SOLID FINANCIAL POSITION SUPPORTS OUR GROWTH AGENDA
 SOLID FINANCIAL POSITION SUPPORTS OUR GROWTH AGENDA Marco Wirén, CFO & Executive Vice President 1 Business model based on growth opportunities and flexibility Faster than global GDP growth Flexible cost
Preliminary Analysis of Beverage Container Recovery Costs in the BEAR Report 1 2
 Preliminary Analysis of Beverage Container Recovery Costs in the BEAR Report 1 2 Our review suggests that the costs of at least three of the five recovery programs analyzed in the BEAR report are inaccurate.
TGS EARNINGS RELEASE 10 February 2011
 TGS EARNINGS RELEASE 10 February 2011 4 th QUARTER 2010 RESULTS 4 th QUARTER HIGHLIGHTS Consolidated net revenues were USD 177.6 million, an increase of 13% compared to Q4 2009. Net late sales totaled
SOLON EIENDOM ASA Q Andreas Martinussen, CEO Scott Danielsen, CFO 9 November 2017
 SOLON EIENDOM ASA Q3 2017 Andreas Martinussen, CEO Scott Danielsen, CFO 9 November 2017 Agenda Highlights Operational update Financial update Market Summary Highlights Q3 Real estate segment revenue increased
Grieg Seafood ASA. griegseafood.com. Andreas Kvame CEO. Atle Harald Sandtorv CFO. 8 November 2017
 Grieg Seafood ASA Andreas Kvame CEO Atle Harald Sandtorv CFO 8 November 2017 1 Agenda Highlights This is Grieg Seafood Business Units (Regions) Financials Outlook 2 Highlights Q3 2017 Improved results
Contents Highlights 3 rd quarter Key figures... 3 A strong quarter despite weaker market conditions... 4 Financial review...
 Contents Highlights 3 rd quarter 2018... 3 Key figures... 3 A strong quarter despite weaker market conditions... 4 Financial review... 5 Group results... 5 Cash flow... 6 Financial position... 6 Segments...
Q Financial Results. Milan May 10th, 2016
 Q1 2016 Financial Results Milan May 10th, 2016 Agenda Q1 2016 Highlights o o o Group overview Results by business Outlook Financial results Appendix Q1 2016 Financial Results 2 Q1 2016 Highlights Organic
4 TH QUARTER RESULTS Kenneth Ragnvaldsen, CEO February 1, 2013, Oslo
 Q4 4 TH QUARTER RESULTS 2012 Kenneth Ragnvaldsen, CEO February 1, 2013, Oslo AGENDA Financial status Business update Outlook Q&A HIGHLIGHTS Profitability continues to improve High activity. Strong order
EVRY ASA Q PRESENTATION CEO BJÖRN IVROTH CFO HENRIK SCHIBLER
 1 EVRY ASA Q3 2018 PRESENTATION CEO BJÖRN IVROTH CFO HENRIK SCHIBLER Agenda Group highlights Business update Financial highlights Business area performance Concluding remarks Q&A 2 Group highlights Q3
HIGHLIGHTS INTERIM REPORT Q XXL ASA. YTD Growth. Q4 Growth
 INTERIM REPORT Q4 2017 XXL ASA HIGHLIGHTS Total revenues of NOK 2 525 million (NOK 2 151 million), up 17 per cent Like-for-like growth of 7 per cent EBITDA of NOK 332 million (NOK 286 million) Strong cash
FINANCIAL UPDATE. Marika Fredriksson Executive Vice President & CFO. Copenhagen, 29 November 2018
 FINANCIAL UPDATE Marika Fredriksson Executive Vice President & CFO Copenhagen, 29 November 2018 LONG-TERM FINANCIAL AMBITIONS Long-term ambitions reflect organic growth and profitability improvements Revenue
TGS EARNINGS RELEASE 1 st QUARTER RESULTS
 TGS EARNINGS RELEASE 24 APRIL 2014 TGS EARNINGS RELEASE 1 st QUARTER RESULTS 1 st QUARTER HIGHLIGHTS Consolidated net revenues were USD 222 million, compared to USD 211 million in Q1 2013. Net late sales
Interim Report. 1st quarter 2009
 Interim Report 1st quarter 2009 Nordic Semiconductor ASA 1st quarter 2008 Revenue in the first quarter was 71.5, an increase of 12% over Q1 2008. EBITDA was 8.3 MNOK in the first quarter compared to 0.7
PRELIMINARY RESULTS FOR THE YEAR ENDED DECEMBER 31, 2015 Annual General Meeting Date
 PRELIMINARY RESULTS FOR THE YEAR ENDED DECEMBER 31, 2015 Annual General Meeting Date (Salem, New Hampshire, March 15, 2016) ProPhotonix Limited (OTC: STKR, London Stock Exchange - AIM: PPIX), a high technology
Amer Sports Corporation Interim Report January March 2012
 1 (19) Amer Sports Corporation INTERIM REPORT April 27, at 1:00 pm Amer Sports Corporation Interim Report January March JANUARY MARCH Net sales EUR 489.8 million (January-March : EUR 449.1 million). In
EVRY ASA Q4/FY 2017 PRESENTATION. CEO Björn Ivroth CFO Henrik Schibler
 EVRY ASA Q4/FY 2017 PRESENTATION CEO Björn Ivroth CFO Henrik Schibler Agenda Q4/ Preliminary FY 2017 presentation Group highlights Business update & trends Financial highlights Business area performance
Third quarter Vestas Wind Systems A/S. Copenhagen, 9 November Classification: Public
 Third quarter Vestas Wind Systems A/S Copenhagen, 9 November Classification: Public Disclaimer and cautionary statement This document contains forward-looking statements concerning Vestas financial condition,
H & M HENNES & MAURITZ AB FULL YEAR RESULTS
 H & M HENNES & MAURITZ AB FULL YEAR RESULTS 1 December 2004 to 30 November 2005 Group turnover excluding VAT for the financial year amounted to SEK 61,262 M (53,695), an increase of 14 per cent compared
Strong financial performance delivered
 Strong financial performance delivered Marika Fredriksson, Executive Vice President & CFO London, 21 June 2016 Classification: Public Disclaimer and cautionary statement This presentation contains forward-looking
Your Aquaculture Technology and Service Partner. Q Presentation Oslo - August 17 th, 2016 Trond Williksen, CEO Eirik Børve Monsen, CFO
 Q2 2016 Presentation Oslo - August 17 th, 2016 Trond Williksen, CEO Eirik Børve Monsen, CFO Agenda 1 Highlights 2 Financial performance 3 Outlook 4 Q&A Highlights Q2 2016 - by CEO Trond Williksen 3 Improved
Your Aquaculture Technology and Service Partner. Q Presentation Oslo - February 19 th, 2016 Trond Williksen, CEO Eirik Børve Monsen, CFO
 Q4 2015 Presentation Oslo - February 19 th, 2016 Trond Williksen, CEO Eirik Børve Monsen, CFO Agenda 1 Highlights 2 Financial performance 3 Outlook 4 Q&A Highlights Q4 2015 - by CEO Trond Williksen 3 MNOK
Amer Sports Interim Report January-September 2018
 1 (32) Amer Sports Corporation INTERIM REPORT October 25, at 1:00 p.m. Amer Sports Interim Report January-September NET SALES AND EBIT JULY-SEPTEMBER On 5 th September, as part of the strategy update,
Viking Redningstjeneste Topco AS. Interim financial statements 4Q 2018
 Viking Redningstjeneste Topco AS Interim financial statements 4Q 2018 Quarterly report October December 2018 Viking Redningstjeneste Topco AS Fourth quarter 2018 Org no. 998 858 690 Quarterly report FOURTH
Third Quarter Results 2018
 Akastor ASA Third Quarter Results 2018 Karl Erik Kjelstad (CEO) & Leif Borge (CFO) Fornebu 31 October 2018 Akastor 2018 Akastor Q3 2018 highlights Revenue EBITDA Net Capital Employed Net Interest Bearing
Q results 24 April Henri de Sauvage-Nolting, President and CEO Danko Maras, CFO Jacob Broberg, SVP IR
 Q1 2018 results 24 April 2018 Henri de Sauvage-Nolting, President and CEO Danko Maras, CFO Jacob Broberg, SVP IR 2 Q1 highlights Good EBIT delivery and Easter sales Net sales amounted to SEK 1,562m (1,222).
ELKEM THIRD QUARTER RESULTS October 2018
 ELKEM THIRD QUARTER RESULTS 2018 24 October 2018 Agenda Helge Aasen, CEO - Highlights - Business update - Outlook Morten Viga, CFO - Financial performance and market update 2 A strong quarter despite weaker
Contents. Key figures. Key Figures Directors Report Financial Statements Notes Directors Responsibility Statement...
 Annual Report 2009 Contents Key figures 2009 2008 2007 2006 2005 Key Figures... 3 Directors Report... 4 Financial Statements... 16 Notes... 25 Directors Responsibility Statement... 40 Auditor s Report...
Second quarter results 2011
 Second quarter results 2011 Highlights for the second quarter 2011 General One fatality in the quarter Kvaerner listed on Oslo Børs 8 July 2011 Financing successfully completed Gudrun jacket delivered
Second quarter results July 2018
 Second quarter results 2018 11 July 2018 Second quarter 2018 Highlights Operations and results on track Contract for Sverdrup riser platform modification in JV with Aker Solutions Valhall Flank West start-up
PROFITS INTO PROGRESS
 PROFITS INTO PROGRESS ANNUAL REPORT 2016 2 TOMRA ANNUAL REPORT 2016 CONTENTS Key Figures 3 Chief Executive Officer s Review 4 Business Overview 6 Group Management 8 Corporate Responsibility Report 10 Environmental
Q4 results: Strong execution, resilient portfolio
 Q4 results: Strong execution, resilient portfolio Fast cost take-out keeps full-year EBIT margin well within target range 2-year savings program expanded to $3 billion Pace of base order decline year-on-year
Q4 Interim Financial Report
 b Q4 Interim Financial Report 2018 VV Holding AS Q4 Report 2018 Page 2 TABLE OF CONTENT DISCLAIMER... 3 PRESENTATION OF THE GROUP... 4 COMMENTS BY THE CEO... 6 KEY FINANCIAL FIGURES... 8 RESULTS OF OPERATIONS...
Fourth quarter results February 2018
 Fourth quarter results 2017 8 February 2018 Fourth quarter 2017 Highlights Strong performance and results Projects being completed New contracts secured: White Rose marine operations Yme support structure
Q2 Presentation July, 2011
 Q2 Presentation 2011 15 July, 2011 Disclaimer This presentation has been prepared by Duni AB (the Company ) solely for use at this investor presentation and is furnished to you solely for your information
Your Aquaculture Technology and Service Partner. Q Presentation Oslo - August 20 th, 2015 Trond Williksen, CEO Eirik Børve Monsen, CFO
 Q2 2015 Presentation Oslo - August 20 th, 2015 Trond Williksen, CEO Eirik Børve Monsen, CFO Agenda 1 Highlights 2 Financial performance 3 Outlook 4 Q&A Highlights Q2 2015 - by CEO Trond Williksen 3 Best
1 ST QUARTER RESULTS Kenneth Ragnvaldsen, CEO April 19, 2013, Oslo
 Q1 1 ST QUARTER RESULTS 2013 Kenneth Ragnvaldsen, CEO April 19, 2013, Oslo AGENDA Financial status Business update Outlook Q&A HIGHLIGHTS Profitability continues to improve. Positive development in Services.
Troax Group AB (publ) Hillerstorp 13th of February, 2019
 Hillerstorp 13th of February, 2019") Troax Group AB (publ) Hillerstorp 13th of February, 2019 INTERIM REPORT JANUARY - DECEMBER 2018 OCTOBER - DECEMBER Order intake increased by 9 per cent to 41,7 (38,4) MEUR. Adjusted for currency the increase
Troax Group AB (publ) Hillerstorp 13th of February, 2019 INTERIM REPORT JANUARY - DECEMBER 2018 OCTOBER - DECEMBER Order intake increased by 9 per cent to 41,7 (38,4) MEUR. Adjusted for currency the increase
Norwegian Finans Holding ASA
 Norwegian Finans Holding ASA Fourth quarter 2017 results presentation Tine Wollebekk, CEO February 28, 2018 Pål Svenkerud, CFO Agenda 1. Performance and events 2. Fourth quarter 2017 results 3. Market
Norsk Gjenvinning Group 3rd Quarter 2018 Erik Osmundsen, CEO and Dean Zuzic, CFO
 Norsk Gjenvinning Group 3rd Quarter 2018 Erik Osmundsen, CEO and Dean Zuzic, CFO Disclaimer VV Holding AS is providing the following interim financial statements for Q3 2018 to holders of its NOK 2,126,000,000
Second quarter Vestas Wind Systems A/S. Aarhus, 20 August 2014
 Second quarter Vestas Wind Systems A/S Aarhus, 20 August Disclaimer and cautionary statement This presentation contains forward-looking statements concerning Vestas' financial condition, results of operations
First half and second quarter 2011
 First half and second quarter 2011 Fierce competition in a very fragile world 7 August 2011 The London Marriott West India Quay Hotel London 17 August 2011 The London Marriott West India Quay Hotel London