Financial highlights - 2nd quarter 2002
|
|
|
- Reynold Armstrong
- 5 years ago
- Views:
Transcription

1 Second Quarter 2002
2 Financial highlights - 2nd quarter 2002 Revenues from continuing operations 670 MNOK, up 4%! Europe 258 MNOK, up 14%! North America 323 MNOK, down 3%! South America 89 MNOK, up 3% 14% revenue growth adjusted for currency impact Operating profit 91 MNOK, down 19% ~(18) MNOK currency impact during 2Q02 Pre-tax profit 110, down 28% Total assets 3,231 MNOK, down 7% from 1Q02
3 1st half-year revenue (Continuing operations) MNOK % % % %
4 (66) MNOK currency impact on revenue Currency impact on revenues, 2Q02 vs. 2Q01 (figures in mill.) 2Q02 sales in 2Q01 2Q02 2Q02 vs. 2Q01 Currency currency Rate NOK Rate NOK deviation USD 47,0 9,19 431,5 8,20 384,9 (46,6) CAD 5,0 5,97 30,0 5,27 26,5 (3,5) EUR 13,6 8,03 109,4 7,52 102,5 (6,9) DKK 95,2 1,08 102,6 1,01 96,3 (6,3) SEK 39,9 0,88 35,2 0,82 32,7 (2,5) Total impact in MNOK (65,8)
5 Revenues by activity (Continuing operations) Europe North America South America 6m02 6m01 Sales, Lease Service Recycl.Centers - - Adm. & Prom. 7 8 Mat. Handling - - Total m02 6m01 6m02 4m
6 Business activities revenue split (Continuing operations) 100 % 80 % 60 % 5,7 9,0 23,3 18,9 4,9 10,3 34,5 4,4 16,4 33,2 3,3 16,5 32,7 40 % 16,5 16,5 15,4 20 % 43,0 33,7 29,6 32,1 0 % m02 Sale/Lease Service Mat. Hand Recycl. Ctrs Adm.&Prom.
7 Operating profit (Continuing operations) MNOK m99 +43% 6m00 +16% 6m01 0% 6m02-28%
8 Total assets MNOK ,348 3,272 3,493 3, Q 2002 Cash Curr. assets Lease equipm. Intangibles Fixed assets 673
9 Major shareholders* Shares Ownership 1. JP Morgan Chase Bank Clients Treaty Account 11,197, % 2. Folketrygdfondet 10,650, % 3. State Street Bank & Client Omnibus D. 9,604, % 4. CDC Ixis c/o Sparebanken NOR 5,790, % 5. ABN Amro Bank - Danish Clients 4,090, % 6. Euroclear Bank S.A. 3,629, % 7. J.P. Morgan Bank Lux S/A Carnegie s FCP s 3,509, % 8. Storebrand Livsforsikring P980, Aksjefondet 3,269, % 9. Deutsche Bank AG Kundendepot 3,135, % 10. Danske Bank A/S 3887 Operations Sec. 3,031, % TOTAL 57,908, % Other shareholders 120,578, % Total (10,977 shareholders) 178,486, % Total foreign ownership 60.15% * Registered
10 Shares & shareholders* Number of Country Shares Ownership shareholders 1. Norway 71,122, , Great Britain 21,093, USA 20,656, Luxembourg 13,856, Denmark 13,655, France 7,436, Sweden 5,538, Belgium 5,483, Switzerland 4,712, Germany 4,650, TOTAL 168,204, ,977 * Registered

11 BU Europe
12 BU Europe - Highlights Revenue 482 MNOK, up 15% Key growth drivers: Denmark, Sweden and Austria Solid base business performance on margins and profitability
13 BU Europe - Sales by market Growth in local Figures in MNOK 6m02 6m01 currency Norway (45%) Sweden % Finland % Denmark % The Netherlands (59%) Germany % Austria % Switzerland Belgium Others Total BU Europe
14 BU Europe - Highlights Revenue 482 MNOK, up 15% Key growth drivers: Denmark, Sweden and Austria Solid base business performance on margins and profitability Deposit in Germany on non-refillable containers for beer, mineral water and carbonated drinks to be implemented as of 1 January 2003 Refillable statistics for 1998 confirmation period announced
15 Highlights - Germany On 27 June the Constitutional Court in Karlsruhe rejected industry s plea to stop deposit on nonrefillable containers On 2 July MoE published refillable statistics Deposit to be implemented as of 1 January 2003 on beer, mineral water and soft drinks Deposit infrastructure and system specification discussions key to successful deposit implementation in Germany TOMRA is facilitating blue print for deposit model TOMRA to maintain & gradually increase capacity related to Germany
16 German refillable statistics Beer Carbonated soft drinks Wine Non-carb. soft drinks Mineral water Total 1998 Confirmation Period Confirmation Period Drink category

17
18 Deposit system alternatives Manual handling Semi-manual handling: hand-held scanners RVM based, fully automated & integrated system Recognition of deposit containers Cancellation & compaction of containers Reconciliation of cash flow & material flow Built-in security measures Integration towards back-end logistics Cost / payback
19 The Ideal Deposit Model Open, standardized and national system Central organization with all stakeholders to establish standards & monitor compliance define security standards perform clearinghouse services negotiate contracts with service providers administrate fees and payments Minimize system costs
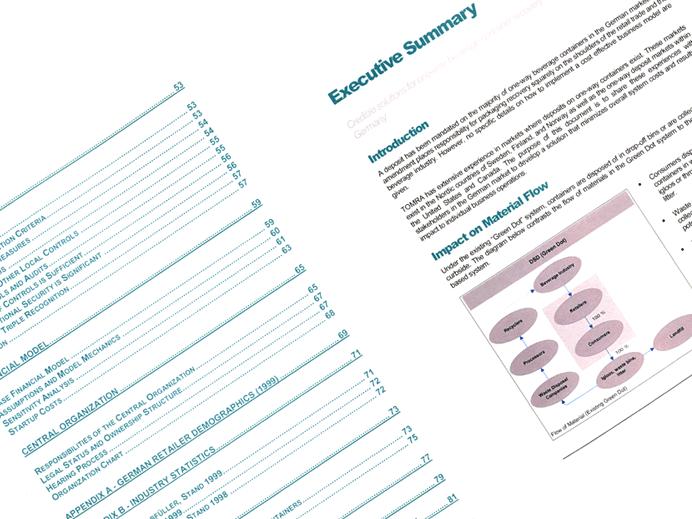
20 Deposit model for non-refillable containers Other raw materials Other applications Cleaning / Recycling R% Depot (Resirk) Container raw material h1 S h2 Container producer (-Importer) Clearing house (Deposit)Y%+A (Pant)R%+H (Deposit)X%+A Filler / Brewery X% Distribution Importer Y% X% R% Pick-up/ Depot Return Store Sales 100% (Deposit)R% Consumer (Deposit)100% Cash flow Material flow A: Adm. fee (fixed per unit) H: Handling fee Retail store h1: Handling fee Depot h2: Handling fee Pick up depot S: Scrap value R% Return rate X% Percentage Import Y% Percentage National Production (X%+Y%=100%)
21

22

23

24

25
26 BU Europe - Highlights Revenue 482 MNOK, up 15% Key growth drivers: Denmark, Sweden and Austria Solid base business performance on margins and profitability Deposit in Germany on non-refillable containers for beer, mineral water and carbonated drinks to implemented as of 1 January 2003 Refillable statistics for 1998 confirmation period announced 428% revenue increase in Denmark based on installation for deposit start-up
27 Highlights - Denmark Deposit system start-up pushed back to 24 august 2002 ~1,000 machines installed / upgraded during 2Q02 Orders handled directly between TOMRA and retailers, final DRS approval expected shortly Continued high activity level expected during 2H02

28

29 BU North America
30 BU North America - Highlights Revenues of 632 MNOK (-5%) + 1% measured in USD
31 BU North America - Sales by market (Continuing operations) Figures in MNOK 6m02 6m01 New York Connecticut Massachusetts Michigan California Canada Others 3 3 Total BU North America
32 BU North America - Highlights Revenues of 632 MNOK (-5%) +1% measured in USD California performance better than planned
33 California status Operating profit in 2Q02 equal to 2.9 MNOK vs. forecasted profit of 0.4 MNOK! 3% higher LME price than assumed in plan! 6% increase in recycling center volumes in 1H02! Lower commercial volumes TOMRA anticipates improved profitability in California during 3Q02 DoC initiatives continue as planned
34 California financials 3Q01 4Q01 1Q02 2Q02 2Q02 (in NOK mill.) Actual Actual Actual Projections Actual - CZ operations 56,0 46,0 53,3 53,2 59,8 - Commercial 45,0 34,0 30,6 37,3 21,3 Total revenues 101,0 80,0 84,0 90,5 81,1 Gross Contribution 72,2 62,4 61,1 70,7 67,2 Contribution margin 71,5 % 78,0 % 72,7 % 78,1 % 82,9 % Processing cost 10,3 9,7 6,3 8,5 7,1 Transportation cost 14,8 19,5 11,7 12,7 12,4 Collection cost 31,9 34,2 31,1 28,5 27,7 Total direct cost 57,0 63,4 49,1 49,7 47,2 G&A 24,8 31,1 21,0 20,6 17,1 - Depreciation 7,1 7,1 0,0 0,0 0,0 Operating profit/(loss) (9,6) (32,1) (9,1) 0,4 2,9
35 BU North America - Highlights Revenues of 632 MNOK (-5%) California performance better than planned Successful roll-out of TOMRA 83 HCp! ~100 installations during 2Q02! Additional 400+ during 2H02 Agreement with QSDA signed in April Stronger growth anticipated during 2H02 in Canada Roll-out of two Walmart replanet test sites in June
36 Walmart status

37 BU South America
38 BU South America - Highlights Revenues of 186 MNOK, up 69 MNOK Tomra Latasa (TL) acquired Imco Recycling Inc s collection centers in Brazil replanet / RVM concepts being discussed with leading retailers
39 Imco transaction Tomra Latasa recently acquired 10 collection centers from Imco TL now owns and operates 15 centers Increased market share from ~25% to ~37% Expanded geographic market presence Processing partnership agreement with Imco MNOK impact on revenue in 2H02
40
Third Quarter 2001 initials/subject/1
 Third Quarter 2001 Tomra Group 3rd Quarter 2001 NOKm Cont. Disc. Total Operating revenues 697 87 784 Cost of goods sold 408 99 507 Gross contribution 289 (12) 277 Operating expenses 176 4 180 Operating
Financial highlights Profit and loss statement
 Third Quarter 2007 Financial highlights Profit and loss statement Figures in NOK million 3Q 2007 3Q 2006 YTD 2007 YTD 2006 Revenues 861 1068 2542 2911 Collection Technology, Deposit Solutions 426 645 1228
Checklist 2005 Q404 Q105 Q205 Q305
 FY 20 0 Checklist 20 To-do list 20 Status Q404 Q1 Q2 Q3 Integrate TiTech and Orwak Group into TOMRA Successfully complete pilots in the UK and Japan Execute on German opportunity Revitalize and achieve
Second Quarter
 Second Quarter 2005 0 Financial highlights NOK million 2Q 05 2Q 04 YTD 05 YTD 04 Revenue 687 591 1,286 1,184 RVM Technology 278 301 528 619 Collection & Materials Handling 213 206 400 395 Recycling Technology
Another strong quarter for TOMRA
 Another strong quarter for TOMRA Strong overall performance Revenues of 1,068 MNOK (+67 percent vs. 641 MNOK in third quarter 2005) Operating profit of 194 MNOK (71 MNOK in third quarter 2005) Cash flow
Financial highlights Profit and loss statement
 First Quarter 2007 Financial highlights Profit and loss statement Figures in NOK million Revenues Collection Technology, Deposit Solutions Materials Handling Industrial Processing Technology Collection
Third Quarter
 Third Quarter 2005 0 Financial highlights NOK million 3Q 05 3Q 04 YTD 05 YTD 04 Revenues 701 665 1987 1849 RVM Technology 299 303 827 922 Collection & Materials Handling 247 237 647 632 Recycling Technology
Financial highlights Profit and loss statement
 Second Quarter 2007 Financial highlights Profit and loss statement Figures in NOK million 2Q 2007 2Q 2006 YTD 2007 YTD 2006 Revenues 887 1020 1681 1843 Collection Technology, Deposit Solutions 430 656
Third Quarter October 2008
 Third Quarter 2008 15 October 2008 Financial Highlights g Profit and loss statement Figures in NOK million 3Q 2008 3Q 2007 YTD 2008 YTD 2007 Revenues 881 861 2546 2542 Collection Technology, Deposit Solutions
FOURTH QUARTER Highlights from fourth quarter 2006 include: Strong cash flow from operations of 254 MNOK (131 MNOK in fourth quarter 2005)
") FOURTH QUARTER 2006 Highlights from fourth quarter 2006 include: Revenues of 1,054 MNOK (+56 percent relative to 675 MNOK in fourth quarter 2005) Operating profit of 135 MNOK (79 MNOK in fourth quarter
FOURTH QUARTER 2006 Highlights from fourth quarter 2006 include: Revenues of 1,054 MNOK (+56 percent relative to 675 MNOK in fourth quarter 2005) Operating profit of 135 MNOK (79 MNOK in fourth quarter
2 ND QUARTER 2013 RESULTS ANNOUNCEMENT
 2 ND QUARTER 2013 RESULTS ANNOUNCEMENT TOMRA SYSTEMS ASA 18th of July 2013 HIGHLIGHTS FROM THE QUARTER INCLUDE Revenues Gross margin Revenues of 1,177 MNOK (948 MNOK in second quarter 2012). Organic, currency
THIRD QUARTER Strong performance in Collection Technology Deposit. Improved performance and outlook in Industrial Processing Technology
 THIRD QUARTER 2009 Highlights from third quarter 2009 include: Strong performance in Collection Technology Deposit Improved performance and outlook in Industrial Processing Technology California negatively
Costs related to Equity Trading
 Costs related to Equity Trading 1. Overview of costs When you buy or sell shares you pay a fee to DNB. The fee is a transaction cost paid when the trade is settled. 1.1 Brokerage fee for Norwegian Shares
FOURTH QUARTER Solid performance in Collection Technology. Continued improved performance and order inflow in Industrial Processing Technology
 FOURTH QUARTER 2009 Highlights from fourth quarter 2009: Solid performance in Collection Continued improved performance and order inflow in Industrial Processing California adversely affected by reduced
INTERIM REPORT 1 December August 2001
 INTERIM REPORT 1 December 2000-31 August 2001 H&M s Group turnover amounted to SEK 32,356 M, an increase of 27 per cent. In comparable currency rates the increase was 18 per cent. Turnover for the third
Global Environment Facility
 Global Environment Facility LDCF/SCCF Council Meeting November 16, 2007 GEF/LDCF.SCCF.3/Inf.2 November 9, 2007 STATUS REPORT ON THE CLIMATE CHANGE FUNDS AS OF SEPTEMBER 30, 2007 (Prepared by the Trustee)
FUNDS TRANSFER REQUEST FORM (for non-payroll payments) (Please type or print)
 (Please type or print)") UNITED NATIONS NATIONS UNIES FUNDS TRANSFER REQUEST FORM (for non-payroll payments) (Please type or print) Before completing, please read the attached instructions carefully. This form must be completed
UNITED NATIONS NATIONS UNIES FUNDS TRANSFER REQUEST FORM (for non-payroll payments) (Please type or print) Before completing, please read the attached instructions carefully. This form must be completed
Global Environment Facility
 Global Environment Facility LDCF/SCCF Council Meeting November 13, 2008 GEF/LDCF.SCCF.5/Inf.2 November 7, 2008 STATUS REPORT ON THE CLIMATE CHANGE FUNDS OCTOBER 2008 (Report from the Trustee) Status of
THIRD QUARTER Highlights from third quarter 2005 include: Operating profit of 79 MNOK before restructuring charges (83 MNOK last year)
") THIRD QUARTER 2005 Highlights from third quarter 2005 include: Revenues of 701 MNOK (+5% percent relative to third quarter 2004) Operating profit of 79 MNOK before restructuring charges (83 MNOK last year)
THIRD QUARTER 2005 Highlights from third quarter 2005 include: Revenues of 701 MNOK (+5% percent relative to third quarter 2004) Operating profit of 79 MNOK before restructuring charges (83 MNOK last year)
SECOND QUARTER and FIRST HALF 2012
 SECOND QUARTER and FIRST HALF 2012 Highlights from second quarter 2012 include: Revenues of 948 MNOK (952 MNOK in second quarter 2011) Unchanged in local currencies +4% in Sorting Solutions - 2% in Collection
FOURTH QUARTER Highlights from fourth quarter 2008 include:
 FOURTH QUARTER 2008 Highlights from fourth quarter 2008 include: Revenues of 1076 MNOK (947 MNOK in fourth quarter 2007). Positive currency impact by 18% Operating profit of 136 MNOK (131 MNOK in fourth
Fourth Quarter 2010 Results
 Fourth Quarter 2010 Results 18 February 2011 1 Highlights from the quarter include Improved Group performance: Revenues up 9% (local currencies) Gross margin 41%, up from 33% (or up from 35% adjusted for
ILLUSTRATIVE SCENARIOS FOR GEF-5 CONTRIBUTIONS
 Fifth Meeting for the Fifth Replenishment of the GEF Trust Fund March 9-10, 2010 Rome, Italy GEF/R.5/27 February 16, 2010 ILLUSTRATIVE SCENARIOS FOR GEF-5 CONTRIBUTIONS (PREPARED BY THE WORLD BANK AS TRUSTEE)
Investor Presentation Q Results. 8 November 2017
 Investor Presentation Q3 2017 Results 8 November 2017 Forward-looking statements This presentation contains forward-looking statements, including, but not limited to, the statements and expectations contained
Green Climate Fund Trust Fund Financial Report as of 31 December 2015
 Meeting of the Board 8 10 March 2016 Songdo, Incheon, Republic of Korea Provisional agenda item 25 GCF/B.12/Inf.09 4 March 2016 Green Climate Fund Financial Report as of 31 December 2015 Summary The financial
Presentation of Annual Report Klaus Holse, CEO, SimCorp A/S Thomas Johansen, CFO, SimCorp A/S
 Presentation of Annual Report 2014 Klaus Holse, CEO, SimCorp A/S Thomas Johansen, CFO, SimCorp A/S Disclaimer This presentation contains certain forward-looking statements and expectations in respect of
European Investment Fund Venture Capital Portfolio. Performance EIF own resources Vintage and Team Location As at 30/06/17
 European Investment Fund Venture Capital Portfolio Performance EIF own resources Vintage and Team Location As at 30/06/17 Context All data provided comprise the performance of investments made using EIF
Basic information. Tax-to-GDP ratio Date: 24 October 2012
 Federal Department of Finance FDF Federal Finance Administration FFA Basic information Date: 24 October 2012 Tax-to-GDP ratio 2011 The tax-to-gdp ratio is the sum of all taxes and social security levies
Cover Pool ( mn.) 13, , , , , ,465.0 of which derivatives ( mn.)
 13, , , , , ,465.0 of which derivatives ( mn.)") Landesbank Baden-Wuerttemberg Am Hauptbahnhof 2 D-70173 Stuttgart, Germany Phone: +49 711 127-0 Fax: +49 711 127-43544 e-m: kontakt@lbbw.de Internet: www.lbbw.de Publication according to section 28 para.
Landesbank Baden-Wuerttemberg Am Hauptbahnhof 2 D-70173 Stuttgart, Germany Phone: +49 711 127-0 Fax: +49 711 127-43544 e-m: kontakt@lbbw.de Internet: www.lbbw.de Publication according to section 28 para.
Transparency Template
 Luxembourg NORD/LB Luxembourg S.A. Covered Bond Bank Reporting Date: 30/09/18 Cut-off Date: 30/09/18 Index 1. Basic Information 2. Public Sector Assets 3. Glossary 4. Optional ECB Repo Disclosure 5. Outstanding
Investor Presentation Q Results. 16 August 2016
 Investor Presentation Q2 2016 Results 16 August 2016 Forward-looking statements This presentation contains forward-looking statements, including, but not limited to, the statements and expectations contained
2 ND QUARTER 2017 RESULTS ANNOUNCEMENT
 2 ND QUARTER 2017 RESULTS ANNOUNCEMENT TOMRA SYSTEMS ASA 2 nd Quarter Results 19.07.2017 HIGHLIGHTS FROM THE QUARTER Revenues Gross margin Operating expenses EBITA Cashflow TOMRA Collection TOMRA Sorting
Cover Pool ( mn.) 3, , , , , ,217.0 of which derivatives ( mn.)
 3, , , , , ,217.0 of which derivatives ( mn.)") Westdeutsche ImmobilienBank AG Grosse Bleiche 46 D-55116 Mainz, Germany Phone: +49 6131 9280-0 Fax: +49 6131 9280-7200 e-m: info@westimmobank.com Internet: www.westimmo.com Publication according to section
Westdeutsche ImmobilienBank AG Grosse Bleiche 46 D-55116 Mainz, Germany Phone: +49 6131 9280-0 Fax: +49 6131 9280-7200 e-m: info@westimmobank.com Internet: www.westimmo.com Publication according to section
Årsredovisning för Sveriges riksbank 2017
 Redogörelse till riksdagen 2017/18:RB1 Årsredovisning för Sveriges riksbank 2017 Gold and foreign currency reserve The gold and foreign currency reserve is primarily to be managed so that the Riksbank
BANQUE CARNEGIE FUND SICAV Société d'investissement à Capital Variable
 Société d'investissement à Capital Variable UNAUDITED SEMI-ANNUAL REPORT 30 June 2014 R.C.S. Luxembourg B 109 660 Subscriptions are only valid if made on the basis of the current prospectus accompanied
INTERIM REPORT - NINE MONTHS 1 December August 2003
 INTERIM REPORT - NINE MONTHS 1 December 2002-31 August 2003 H&M s Group turnover amounted to SEK 40,235 (37,369) M, an increase of 8 per cent. In comparable currency rates the increase was 10 per cent.
Statement of Assets and Liabilities Incorporating an estimate of the value of assets as at 30 June 2012 and a computation of liabilities
 Glitnir hf. Statement of Assets and Liabilities Incorporating an estimate of the of assets as at 30 June 2012 and a computation of liabilities 19 September 2012 1 Disclaimer This document includes a Statement
The Luxembourg Fund industry Facts and Figures. 7 October, 2009
 The Luxembourg Fund industry Facts and Figures 7 October, 2009 AGENDA 1. Worldwide Fund industry 2. European landscape 3. Luxembourg market 4. Luxembourg : hub for cross border distribution Agenda 1. Worldwide
Q PRESENTATION 7 FEBRUARY 2018
 Q4 2017 PRESENTATION 7 FEBRUARY 2018 Highlights Q4 2017 Record high revenue, operating profit, and cash flow from operations REVENUE of NOK 10.0 billion (up 10.1%) Change in currency rates positively impacts
Offshore fee schedule
 Online Country Exchange name Commission bps (cents) Min commission Austria Wiener Borse Stock Exchange 25 15 EUR Belgium Euronext Brussels 25 15 EUR Denmark OMX Nordic Stock Exchange Copenhagen 25 39 DKK
CONDITIONS FOR PRIVATE BANKING AND TREASURY SALES. Valid Since
 CONDITIONS FOR PRIVATE BANKING AND TREASURY SALES Valid Since 02.01.2018 Private Banking Version 8 This list of fees is a supplement to the published general list of fees of DenizBank AG. The general list
Approved by Management committee of Danske Bank A/S Latvia branch (Meeting No 17/2017 from 24 April 2017) Effective from 1 of July 2017
 Effective from 1 of July 2017") Approved by Management committee of Danske Bank A/S Latvia branch (Meeting No 7/207 from 24 April 207) Effective from of July 207 DANSKE BANK A/S LATVIA BRANCH PRICELIST - FOR PRIVATE CUSTOMERS. Account...
Approved by Management committee of Danske Bank A/S Latvia branch (Meeting No 7/207 from 24 April 207) Effective from of July 207 DANSKE BANK A/S LATVIA BRANCH PRICELIST - FOR PRIVATE CUSTOMERS. Account...
Fourth quarter results 2017
 Fourth quarter results 2017 Kenneth Hamnes, Group CEO Sigmund Toth, CFO 20 February 2018 Q4: Highlights Q4 revenue: 831.1 MNOK, +2.4 % vs Q4 16 Growth for all three business segments Q4 EBITDA (adj.):
Harmonised Transparency Template
 Harmonised Transparency Template SWEDEN Swedbank Mortgage AB Reporting Date: [30/06/17] Cut-off Date: [30/06/17] Index Worksheet A: HTT General Worksheet B1: HTT Mortgage Assets Worksheet B2: HTT Public
Harmonised Transparency Template
 Harmonised Transparency Template SWEDEN Swedbank Mortgage AB Reporting Date: [30/09/18] Cut-off Date: [30/09/18] Index Worksheet A: HTT General Worksheet B1: HTT Mortgage Assets Worksheet B2: HTT Public
Copenhagen Winter Seminar
 Copenhagen Winter Seminar Tonny Thierry Andersen Executive Board member Global Head of Personal Banking 2 December 2015 Well on track to deliver on all of our ambitions for 2015 Target Status after Q3
H & M HENNES & MAURITZ AB NINE-MONTH REPORT
 NINE-MONTH REPORT 2010 H & M HENNES & MAURITZ AB NINE-MONTH REPORT 1 December 2009 31 August 2010 NINE MONTHS The H&M Group s sales excluding VAT during the first nine months of the financial year amounted
Revision of the Weights for Calculation of Danmarks Nationalbank s Effective Krone- Rate Index
 77 Revision of the Weights for Calculation of Danmarks Nationalbank s Effective Krone- Rate Index Erik Haller Pedersen, Economics Introduction Danmarks Nationalbank publishes the effective krone-rate index
TAXATION OF TRUSTS IN ISRAEL. An Opportunity For Foreign Residents. Dr. Avi Nov
 TAXATION OF TRUSTS IN ISRAEL An Opportunity For Foreign Residents Dr. Avi Nov Short Bio Dr. Avi Nov is an Israeli lawyer who represents taxpayers, individuals and entities. Areas of Practice: Tax Law,
Third quarter results 2018
 Third quarter results 2018 Kenneth Hamnes, Group CEO Sigmund Toth, CFO 16 November 2018 : Continued revenue growth for Wine and Distribution Amounts in NOK million 2017 2018 Operating Revenues EBITDA (adj.)
Green Climate Fund Trust Fund Financial Report Status as at 31 March
 Green Climate Fund Trust Fund Financial Report Status as at 31 March 2014 1 GCF/B.07/Inf.04 01 May 2014 Meeting of the Board 18-21 May 2014 Songdo, Republic of Korea Agenda item 13 1 Reproduced as received
Interim Report January September 2018
 Interim Report January September 2018 2 July September 2018 Revenue SEK 4,918 million (4,246). Real growth 8 percent (5) and organic growth 2 percent (3). Operating income (EBITA) 1) SEK 626 million (570)
Past performance is not a guarantee of future results. Indices are not available for direct investment. Index performance does not reflect the
 Q1 Past performance is not a guarantee of future results. Indices are not available for direct investment. Index performance does not reflect the expenses associated with the management of an actual portfolio.
OPTIMTRADER COMMISSIONS
 OPTIMTRADER COMMISSIONS Package BASIC OPTIMUM PREMIUM MINIMUM DEPOSIT 5.000 USD or another currency equivalent 10.000 USD another currency equivalent According to the MONTHLY TRADING VOLUME OptimTrader
Interim Report Investeringsforeningen Jyske Invest International
 Interim Report 2018 Investeringsforeningen Jyske Invest International Table of contents Association details... 3 Reading instructions... 4 Performance in first half of 2018... 5 Interim financial statements
European Central Bank TARGET 2 SECURITIES - Funds Workshop Luxembourg, April 27th, Cross-Border Funds and T2S. A Luxembourg TA Perspective
 European Central Bank TARGET 2 SECURITIES - Funds Workshop Luxembourg, April 27th, 2010 Cross-Border Funds and T2S A Luxembourg TA Perspective 1 Agenda I. Introduction II. The Transfer Agent and Settlement
SKAGEN Tellus Status Report February 2017
 SKAGEN Tellus Status Report February 2017 Key numbers as of 28 February 2017 EUR, net of fees February QTD 2016 1 years 3 years 5 years Since inception* SKAGEN Tellus 1,6% 0,7% 5,7% 5,5% 5,9% 4,7% 5,4%
Selecta Group B.V. and its subsidiaries, Amsterdam (The Netherlands)
") Selecta Group B.V. and its subsidiaries, Amsterdam (The Netherlands) Condensed consolidated interim financial statements for the 3 months ended (unaudited) Table of Contents Operating and financial review
Selecta Group B.V. and its subsidiaries, Amsterdam (The Netherlands) Condensed consolidated interim financial statements for the 3 months ended (unaudited) Table of Contents Operating and financial review
STATUS REPORT FOR THE LEAST DEVELOPED COUNTRIES FUND
 23rd /SCCF Council Meeting November 30, 2017 Washington DC GEF/.SCCF.23/Inf.02 November 9, 2017 STATUS REPORT FOR THE LEAST DEVELOPED COUNTRIES FUND (Financial Report prepared by the Trustee) Least Developed
Axioma Risk Monitor Developed Europe 2 May 2018
 Axioma Risk Monitor Developed Europe 2 May 2018 1. Global volatility hotspots 2. Global correlation hotspots www.axioma.com Greater than 1% rise over last week Greater than 1% fall over last week Greater
STATUS REPORT FOR THE LEAST DEVELOPED COUNTRIES FUND
 25th /SCCF Council Meeting December 20, 2018 Washington DC GEF/.SCCF.25/Inf.02 November 29, 2018 STATUS REPORT FOR THE LEAST DEVELOPED COUNTRIES FUND (Financial Report prepared by the Trustee) Least Developed
Axioma Risk Monitor Developed Europe 4 July 2018
 Axioma Risk Monitor Developed Europe 4 July 2018 1. Global volatility hotspots 2. Global correlation hotspots www.axioma.com Greater than 1% rise over last week Greater than 1% fall over last week Greater
2016 European Pay-for- Performance Methodology
 2016 European Pay-for- Performance Methodology Frequently Asked Questions Effective for Meetings on or after February 1, 2016 www.issgovernance.com 2016 ISS Institutional Shareholder Services Table of
contents Design & layout Cox Design
 2003 Annual Report Design & layout Cox Design Main photographer Damian Heinisch Others Annual Report Page 6-7: Terje Heiestad, Cox foto Page 8: Pow-Wow Studios, Christian Hatt & Rune Mæhre Page 9: Al Ferreira,
Q presentation. 5 February 2015
 Q4 2014 presentation 5 February 2015 Agenda Highlights Financial overview Market outlook Q4 Highlights Strong finish to a record year Revenue of NOK 7 549 million, up 10.3% EBITDA* of NOK 396 million,
Revised ADF-12 Replenishment and Resource Allocation Scenarios
 Revised ADF-12 Replenishment and Resource Allocation Scenarios ADF-12 Replenishment, Fourth Meeting September 2010 Tunis, Tunisia AFRICAN DEVELOPMENT FUND 1. ADF-12 Replenishment Scenarios Three replenishments
Preliminary Analysis of Beverage Container Recovery Costs in the BEAR Report 1 2
 Preliminary Analysis of Beverage Container Recovery Costs in the BEAR Report 1 2 Our review suggests that the costs of at least three of the five recovery programs analyzed in the BEAR report are inaccurate.
Financial Report Prepared by the Interim Trustee (The World Bank)
") Green Climate Fund Financial Report Prepared by the Interim Trustee (The World Bank) As of December 31, 2013 Green Climate Fund Summary as of December 31, 2013 This report covers the financial status of
Green Climate Fund Financial Report Prepared by the Interim Trustee (The World Bank) As of December 31, 2013 Green Climate Fund Summary as of December 31, 2013 This report covers the financial status of
STATUS REPORT FOR THE LEAST DEVELOPED COUNTRIES FUND
 21 st /SCCF Council Meeting October 27, 2016 Washington DC GEF/.SCCF.21/Inf.02 October 14, 2016 STATUS REPORT FOR THE LEAST DEVELOPED COUNTRIES FUND (Financial Report prepared by the Trustee) Least Developed
FY MARCH 2011 TELECONFERENCE PRESENTATION
 FY 2010 TELECONFERENCE PRESENTATION 15 MARCH 2011 1 4 APRIL 2011 DISCLAIMER This presentation contains forward-looking statements that reflect PANDORA s expectations with respect to certain future events
DPD CLASSIC (Slovenia) Slovenia 6,00 7,00 10,00 11,00 12,00 13,00 14,00 16,00 18,00 DPD CLASSIC - PARCEL DELIVERY TO THE EU
 Slovenia 6,00 7,00 10,00 11,00 12,00 13,00 14,00 16,00 18,00 DPD CLASSIC - PARCEL DELIVERY TO THE EU") Parcel delivery in Slovenia DPD CLASSIC (Slovenia) Area up to up to up to up to 1 up to up to 2 up to 31. up to 40 kg up to 50 kg Slovenia 6,00 7,00 10,00 11,00 12,00 13,00 14,00 18,00 Prices are in EUR
Parcel delivery in Slovenia DPD CLASSIC (Slovenia) Area up to up to up to up to 1 up to up to 2 up to 31. up to 40 kg up to 50 kg Slovenia 6,00 7,00 10,00 11,00 12,00 13,00 14,00 18,00 Prices are in EUR
Scania Interim Report January June 2017
 28 July 2017 Scania Interim Report January June 2017 Summary of the first six months of 2017 Operating income rose to SEK 6,464 m. (1,316) Operating income, excluding items affecting comparability, amounts
H & M HENNES & MAURITZ AB THREE-MONTH REPORT
 H & M HENNES & MAURITZ AB THREE-MONTH REPORT 1 December 2007 29 February 2008 Sales excluding VAT for the H&M Group for the first three months of the financial year amounted to SEK 19,742 m (16,772), an
Q presentation. 15 July 2015
 Q2 2015 presentation 15 July 2015 Q2 Highlights Revenue of NOK 6 842 million, up 14.4% EBITDA* of NOK 157 million, down 11.2% Large variance in performance across countries, with strong results in Sweden,
INTERNATIONAL CAMPAIGN TO BAN LANDMINES
 FINANCIAL STATEMENTS INTERNATIONAL CAMPAIGN TO BAN LANDMINES FOR THE YEARS ENDED DECEMBER 31, 2009 AND 2008 CONTENTS PAGE NO. INDEPENDENT AUDITORS' REPORT 2 EXHIBIT A - Statements of Financial Position,
High quality growth in Nordic Life and Pensions
 High quality growth in Nordic Life and Pensions 2 December 2010 Berenberg European Conference 2010 Storebrand Odd Arild Grefstad Group CFO Important information: This document may contain forward-looking
Quarterly Report Q4 2017
 Quarterly Report Q4 2017 Arcus ASA 2 Contents Message from the CEO... 3 Key figures Q4 2017... 3 Highlights Q4 2017... 4 Wine: Improved margins despite strong EUR... 5 Spirits: Soft sales, improved margins...
INTERIM REPORT - NINE MONTHS 1 December August 2004
 INTERIM REPORT - NINE MONTHS 1 December 2003-31 August 2004 H&M s Group turnover excluding VAT amounted to SEK 37,821 M (34,315), an increase of 10 per cent. In comparable currency rates the increase was
Market consultations regarding the operation of a deposit return system in Denmark held by the Danish Environmental Protection Agency
 Market consultations regarding the operation of a deposit return system in Denmark held by the Danish Environmental Protection Agency 1. INTRODUCTION Through market consultations with potential operators
International Statistical Release
 International Statistical Release This release and additional tables of international statistics are available on efama s website (www.efama.org). Worldwide Investment Fund Assets and Flows Trends in the
Special Climate Change Fund (SCCF)
") Special Climate Change Fund () Financial Report Prepared by the Trustee As of March 31, 2013 Table of Contents Table of Contents Introduction... 3 Financial Summary as of March 31, 2013... 4 1. Summary
Special Climate Change Fund () Financial Report Prepared by the Trustee As of March 31, 2013 Table of Contents Table of Contents Introduction... 3 Financial Summary as of March 31, 2013... 4 1. Summary
Corporate Governance and Investment Performance: An International Comparison. B. Burçin Yurtoglu University of Vienna Department of Economics
 Corporate Governance and Investment Performance: An International Comparison B. Burçin Yurtoglu University of Vienna Department of Economics 1 Joint Research with Klaus Gugler and Dennis Mueller http://homepage.univie.ac.at/besim.yurtoglu/unece/unece.htm
Schoeller Allibert Group B.V. Nine months ended 30 September 2016
 Schoeller Allibert Group B.V. Nine months ended 30 September 2016 Schoeller Allibert B.V. Nine months ended 30 September 2016 Condensed consolidated interim financial statements Table of Contents Schoeller
Investor Presentation Q Results. 21 May 2015
 Investor Presentation 2015 Results 21 May 2015 1 Forward-looking statements This presentation contains forward-looking statements, including, but not limited to, the statements and expectations contained
Swedish portfolio holdings. Foreign equity securities and debt securities
 Swedish portfolio holdings Foreign equity securities and debt securities 2007 Swedish portfolio holdings Foreign equity securities and debt securities 2007 Statistiska centralbyrån 2008 Swedish portfolio
Publication in accordance with Sec 28 PfandBG
 Publication in accordance with Sec 28 PfandBG 30 Agenda 1 Pfandbriefe and Cover Pool 2 Maturity structure 3 Volume of claims Mortgage Pfandbriefe 4 Volume of claims Public Pfandbriefe 5 Further Cover Assets
LENDING FACILITIES Hire Purchase (HP) 1% % on a case by case basis (fee set by AgriFinance Ltd)
 1% % on a case by case basis (fee set by AgriFinance Ltd)") Our Charges This brochure gives a brief description of tariffs as charged by AgriBank plc on some of its products and services. For tariffs on products or services which are not listed in this brochure,
Our Charges This brochure gives a brief description of tariffs as charged by AgriBank plc on some of its products and services. For tariffs on products or services which are not listed in this brochure,
10 th Meeting of the Consultative group
 10 th Meeting of the Consultative group May 9 th, 2011 Geneva, Switzerland GFDRR Resource Management & Mobilization By: Saroj Kumar Jha, GFDRR Manager GFDRR is able to help developing countries reduce
Trends and opportunities within Nordic Life and Pension
 Trends and opportunities within Nordic Life and Pension 2 September 2010 UBS Nordic Financial Services Conference Storebrand Odd Arild Grefstad Group CFO Important Notice This document may contain forward-looking
Cover Pool ( mn.) 346,1 232,0 372,0 247,6 344,4 238,9 of which derivatives ( mn.)
 346,1 232,0 372,0 247,6 344,4 238,9 of which derivatives ( mn.)") DekaBank Deutsche Girozentrale Mainzer Landstrasse 16 D-60325 Frankfurt am Main, Germany Phone: +49 69 7147-652 Fax: +49 69 7147-1376 e-m: service@deka.de Internet: www.deka.de Publication according to
DekaBank Deutsche Girozentrale Mainzer Landstrasse 16 D-60325 Frankfurt am Main, Germany Phone: +49 69 7147-652 Fax: +49 69 7147-1376 e-m: service@deka.de Internet: www.deka.de Publication according to
THE FUTURE OF CASH AND PAYMENTS
 THE FUTURE OF CASH AND PAYMENTS Retail Banking Research January 2010 CONFIDENTIALITY AND COPYRIGHT This report is published by Retail Banking Research Ltd (RBR). The information and data within this report
Global Environment Facility
 Global Environment Facility GEF Council November 17-19, 2004 GEF/C.24/Inf.3 October 20, 2004 TRUSTEE REPORT (Prepared by Trustee) World Bank I. Introduction Trustee of The Global Environment Facility (GEF)Trust
Retail customers Main banking fees as of 1 July, 2018
 Retail customers Main banking as of 1 July, 2018 Table of content 1. Current accounts... 4 2. Payments... 5 2.1. Credit transfers - Outgoing... 5 2.2. Credit transfers - Incoming... 5 2.3. Value dates
SKAGEN Tellus Status Report December 2015
 Torgeir Høien Lead Manager Jane Tvedt Co-manager SKAGEN Tellus Status Report December 2015 Key numbers as of 31.12.2015 SKAGEN Tellus was down 2.5% in EUR in December. The benchmark dropped 2%. Since inception
The workshop was held at the Danish Environmental Protection Agency in Copenhagen on 30th March The final list of attendees was as follows:
 1.0 Copenhagen 1.1 Introduction The workshop was held at the Danish Environmental Protection Agency in Copenhagen on 30th March 2011. The final list of attendees was as follows: Name Allan Andersen Anders
H & M HENNES & MAURITZ AB THREE-MONTH REPORT
 THREE-MONTH REPORT 2010 H & M HENNES & MAURITZ AB THREE-MONTH REPORT 1 December 2009 28 February 2010 THE FIRST QUARTER The H&M Group s sales excluding VAT amounted to SEK 24,846 m (23,299), an increase
Financial results briefing Q3/2012
 Financial results briefing Q3/2012 Jyri Luomakoski President and CEO Uponor Corporation NCC Uponor s new head office, which will be taken into use 1 Jan 2013, will showcase sustainable and innovative Uponor
Retail customers Main banking fees as of 1 January, 2018
 Retail customers Main banking fees as of 1 January, 2018 Table of content 1. Current accounts... 4 2. Payments... 5 2.1. Outgoing payments... 5 2.2. Incoming payments... 5 2.3. Value dates and execution
Downstream natural gas in Europe the role of upstream oil and gas companies
 Downstream natural gas in Europe the role of upstream oil and gas companies Presentation at PETROPOL research conference on natural gas Opportunities for Norway in the future European natural gas market
SKAGEN Tellus Statusrapport maj 2017
 SKAGEN Tellus Statusrapport maj 2017 Key numbers as of 31 May 2017 SEK, net of fees May QTD YTD 1 years 3 years 5 years Since inception* SKAGEN Tellus 0,37 % -1,9% 0,61 % 7,46 % 5,66 % 5,71 % 5,54 % JPM