Q PRESENTATION 7 FEBRUARY 2018
|
|
|
- Marilynn Stevens
- 6 years ago
- Views:
Transcription
1 Q PRESENTATION 7 FEBRUARY 2018
 EBIT margin of 3.9% Operating cash flow of NOK 1,765 million Positive net cash balance of MNOK 102 at year end Proposed dividend of NOK 6.")
2 Highlights Q Record high revenue, operating profit, and cash flow from operations REVENUE of NOK 10.0 billion (up 10.1%) Change in currency rates positively impacts revenue growth by 3.4% EBIT of NOK 392 million (up 9.6%) EBIT margin of 3.9% Operating cash flow of NOK 1,765 million Positive net cash balance of MNOK 102 at year end Proposed dividend of NOK 6.50 per share To be paid in two equal installments in May and November 2018
3 Financial summary Strong growth in EBIT, as revenue grows faster than operating expenses CURRENCY: MNOK Q4 17 Q4 16 Growth Revenue 10,015 9, % Gross profit 2,128 1, % % margin 21.2% 21.6% -0.4% Operating expense 1,736 1, % EBIT % % margin 3.9% 3.9% 0.0% Solid revenue growth across all lines of business Reduced GM% due to growth in sales of lower margin software Opex growth driven by higher G&A expenses (marketing, IT) Note: Currency exchange rates have a positive impact on revenue growth rates of 3.4% in the fourth quarter of Operating expenses include personnel costs, other opex, depreciation and amortization costs.
4 NOK in million NOK in million Norway Rapid EBIT growth, based on higher revenue and lower personnel costs R E V E N U E % E B I T % 2, Product revenue +14.5% 2, Service revenue +6.0% Gross profit +6.0% Operating expenses +1.5% Q4 16 Q4 17 Q4 16 Q4 17
5 SEK in million SEK in million Sweden Very strong growth in revenue, gross profit and EBIT R E V E N U E % E B I T % 3,417 3, Product revenue +13.1% Service revenue +8.8% Gross profit +12.4% Operating expenses +11.5% Q4 16 Q4 17 Q4 16 Q4 17
6 DKK in million DKK in million Denmark Lower revenue partly offset by reduced personnel expenses R E V E N U E % E B I T % 2,108 1, Product revenue -9.0% Service revenue -4.6% Gross profit -8.5% Operating expenses -4.5% Q4 16 Q4 17 Q4 16 Q4 17
7 EUR in million EUR in million Finland Solid revenue growth, improved gross margins and lower operating expenses R E V E N U E % E B I T % Product revenue +5.0% Service revenue +5.3% 0.8 Gross profit Operating expenses +10.6% -2.9% Q4 16 Q4 17 Q4 16 Q4 17
8 EUR in million EUR in million Baltics Revenue growth accelerates based on large projects and contracted services R E V E N U E % E B I T % Product revenue +12.1% Service revenue +27.0% Gross profit +12.3% Operating expenses +12.3% Q4 16 Q4 17 Q4 16 Q4 17
9 NOK in million Cash flow from operations Cash flow from operations of MNOK 1,765, as working capital metrics improve 1,765 1,765 Cash flow from operations is concentrated in Q4, based on seasonal movements in net working capital 189 Positive net cash balance of MNOK 102 at year end Q4 16 Q1 17 Q2 17 Q3 17 Q4 17 CF Operations Changes in WC

10 Summary Q Record high revenue, operating profit and operating cash flow REVENUE Revenue of NOK 10.0 billion, up 10.1% EBITDA EBITDA of NOK 488 million, up 7.6% EBIT EBIT of NOK 392 million, up 9.6% CASH FLOW Cash flow from operations of NOK 1,765 million, which is the same level as last year * Currency exchange rates have a positive impact on revenue growth rates of 3.4% in the fourth quarter of 2017
11 Full Year 2017 financial performance Revenue of NOK 32.4 billion (up 4.0% from 2016) and EBIT of NOK 799 million (up 17.9% from 2016) Revenue (MNOK) 35,000 EBIT (MNOK) ,000 32, Revenue growth of 10.1% per year since reorganization in start ,000 20,000 22, EBIT growth of 22.5% per year during same period 15, , Revenue EBIT 200 * Organic growth rate of 6.4%, plus acquisitions and currency effects
12 Performance targets and results Financial Objective Organic growth in excess of market Achieve 20%+ market share through organic growth and selective acquisitions 2017 Results Growth of 4.4% in constant currency, in line with market growth* Estimated market share of 18% Growth in profit margin EBIT % margin up to 2.5%, from 2.2% in 2016 Strong cash conversion Free cash flow of MNOK 976** High annual dividend payout, based on cash flow generation Cash dividend of NOK 6.50 to be proposed in 2018 * Pro forma growth adjusted for acquisitions and currency effects. Market growth based on preliminary IDC estimate of 4.6% (2017 full year). ** Free Cash Flow defined as Cash Flow from Operations, minus capex. Capital expenditures include assets acquired through financial leases.
13 Strategic initiatives to improve profitability LEVERAGE GROUP FUNCTIONS TO REDUCE OPERATING COST STRENGTHEN CAPABILITIES IN HIGHER VALUE ADDED PRODUCTS AND SERVICES COUNTRY INITIATIVES TO IMPROVE MARGINS AND PRODUCTIVITY Supply chain Nearshoring Group IT Security Hybrid cloud Business intelligence Internet of things Networking Service growth Service efficiency Solution selling Operating expenses

14


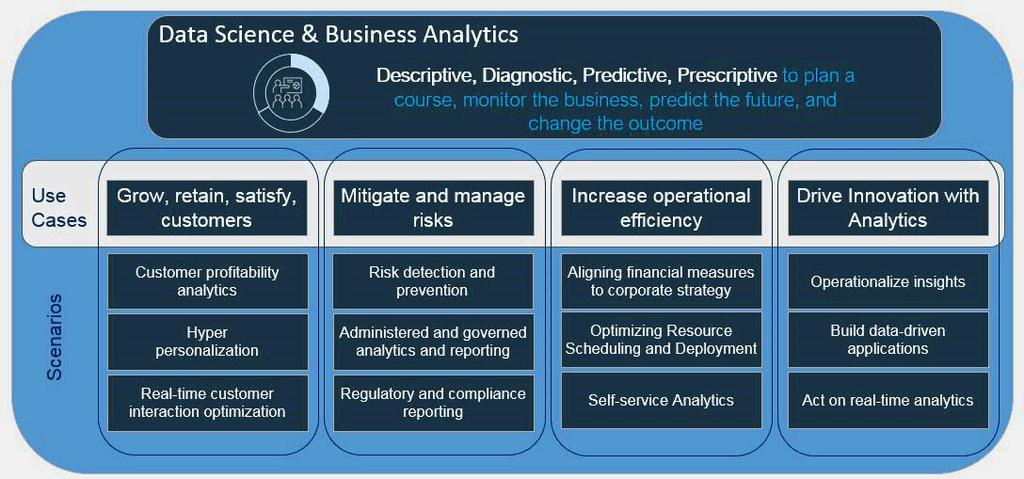
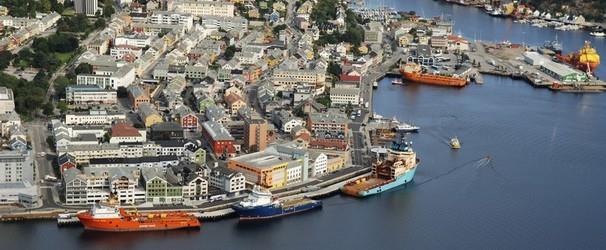
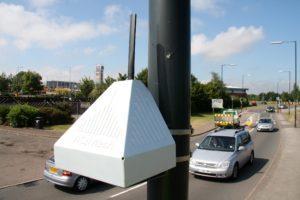
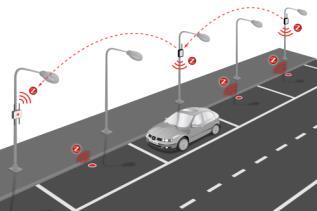
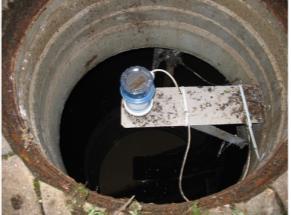
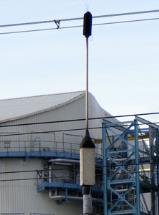
15 Strategic initiatives to strengthen capabilities Analytics AI Atea deliver the entire value chain for big data, analytics, AI and IoT. From collecting data storing data processing data securing data analyzing data to presenting the data We have developed big data and analytics concepts based on IBM and Microsoft technology to address needs like data driven decision support, enhanced competitive ability, new business opportunities and business models In the IoT space Atea has built a partner eco-system based on a Hybrid IoT platform and competence to integrate the pieces into complete solutions, for example for Smart City solutions, Smart buildings and Smart welfare
16 Analytics


17 Visualization Atea digital platform Atea Cloud IBM Cloud / Azure Fog Computing Secure communication IoT platform Big Data and Analytics Welfare City Buildings Integrations Smart municipalities Atea hosted cloud


18 Use cases
19 A DIGITAL PLATFORM FOR SUBSCRIPTION AND CONSUMPTION BASED ENABLEMENT

20 WHAT APPXITE IS HELPING TO ACHIEVE AppXite wants to become a leader in enabling ISV s and resellers to grow through subscription and consumption based models The solution, that is continuously being developed, aims to solve the major challenges faced by these companies when enabling their business for automated transactions and selling in the cloud In order for the companies to grow, they require a number of supporting services, which AppXite intends to deliver as offerings together with the solution Services which are ensuring that the offerings developed by the companies can be scaled technically and provisioned automatically to the highest degree possible
21
22 Q FACT PACK
23 Highlights - Group Q4 Q4 Full year Full year NOK in million Group revenue 10,015 9,096 32,438 31,188 Gross margin (%) 21.2% 21.6% 22.3% 22.2% EBIT EBIT margin (%) 3.9% 3.9% 2.5% 2.2% Net profit Earnings per share (NOK) Diluted earnings per share (NOK) Cash flow from operations 1,765 1,765 1,238 1,404 Free cash flow 1,696 1, , Jun Jun Dec Dec 2016 Net financial position Liquidity reserve 3, ,362 3,040 2,362 Working capital -1,692-1,385-1,692-1,385 Working capital in relation to annualized revenue (%) -4.2% -3.8% -5.2% -4.4% Equity ratio (%) 22.6% 23.8% 22.6% 23.8% Number of full-time employees 6,904 6,882 6,904 6,882
24 Consolidated statement of financial position - Group NOK in million 31 Dec Dec 2016 ASSETS Property, plant and equipment Deferred tax assets Goodwill 3,845 3,658 Other intangible assets Investment in associated companies 12 0 Other long-term receivables 6 7 Non-current assets 5,252 5,205 Inventories Trade receivables 6,886 5,975 Other receivables 1, Cash and cash equivalents 1, Current assets 9,663 8,251 Total assets 14,915 13,456 EQUITY AND LIABILITIES Equity 3,373 3,200 Interest-bearing long-term liabilities 120 1,079 Other long-term liabilities Deferred tax liabilities Non-current liabilities 408 1,348 Trade payables 6,755 5,835 Interest-bearing current liabilities Other current liabilities 3,476 2,921 Current liabilities 11,133 8,908 Total liabilities 11,541 10,256 Total equity and liabilities 14,915 13,456
25 Full-time employees - Group FTEs, end of period 31 Dec Dec 2016 Norway 1,573 1,558 Sweden 2,248 2,077 Denmark 1,475 1,580 Finland Baltics Logistics Atea Global Services Atea ASA 9 9 Atea Group 6,904 6,882
26 Financial performance actual Segment NOK in million Q1 16 Q2 16 Q3 16 Q4 16 Q1 17 Q2 17 Q3 17 Q4 17 Norway 1, , , , , , , ,762.4 Sweden 2, , , , , , , ,758.6 Denmark 1, , , , , , , ,490.4 Finland The Baltics Group Shared Services 1, , , , , , , ,416.4 Eliminations -1, , , , , , , ,460.3 Other income Operating revenues group total 7, , , , , , , ,015.5 Norway Sweden Denmark Finland The Baltics Group Shared Services Operating profit before group cost (EBIT) Group cost Operating profit (EBIT) Financial income Financial expenses Net finance Profit before taxes (EBT) Tax Profit for the period
27 Income statement actual - Group (NOK million) NOK in million Q1 16 Q2 16 Q3 16 Q4 16 Q1 17 Q2 17 Q3 17 Q4 17 Hardware revenue 4, , , , , , , ,840.1 Software revenue 1, , , , , , ,431.0 Products revenue 5, , , , , , , ,271.1 Total services revenue 1, , , , , , , ,743.9 Other income Revenue 7, , , , , , , ,015.5 Margin 1, , , , , , , ,127.9 Hardware margin (%) 13.5% 13.5% 12.7% 12.8% 13.5% 13.6% 12.7% 13.4% Software margin (%) 9.6% 6.6% 13.5% 9.1% 8.9% 6.8% 12.1% 8.4% Product margin (%) 12.3% 10.8% 12.9% 11.8% 12.1% 10.9% 12.6% 11.9% Total services margin (%) 67.2% 66.7% 63.5% 67.0% 66.8% 67.7% 65.8% 65.6% Total products and services margin (%) 23.4% 21.0% 23.5% 21.6% 23.0% 21.2% 24.2% 21.2% Personnel costs 1, , , , , , , ,350.1 Other operating expenses EBITDA (adjusted) EBITDA (adjusted) (%) 2.9% 2.5% 3.8% 5.0% 2.9% 2.7% 4.1% 5.0% Expenses/income related to acquisitions Share based compensation EBITDA Depreciation Amortization related to acquisitions Operating profit (EBIT)
28 Income statement actual Norway (NOK million) NOK in million Q1 16 Q2 16 Q3 16 Q4 16 Q1 17 Q2 17 Q3 17 Q4 17 Hardware revenue , , , , , ,745.9 Software revenue Products revenue 1, , , , , , , ,262.6 Total services revenue Other income Revenue 1, , , , , , , ,762.4 Margin Product margin (%) 14.2% 13.5% 13.2% 12.5% 15.4% 13.1% 12.5% 12.6% Total services margin (%) 62.2% 61.0% 61.1% 67.1% 64.9% 64.4% 63.4% 62.5% Total products and services margin (%) 26.3% 24.7% 24.2% 23.0% 28.1% 25.2% 24.4% 21.6% Personnel costs Other operating expenses EBITDA (adjusted) EBITDA (adjusted) (%) 2.3% 2.9% 3.5% 4.6% 3.3% 3.6% 4.3% 5.0% Expenses/income related to acquisitions Share based compensation EBITDA Depreciation Amortization related to acquisitions Operating profit (EBIT)
29 Income statement actual Denmark (DKK million) DKK in million Q1 16 Q2 16 Q3 16 Q4 16 Q1 17 Q2 17 Q3 17 Q4 17 Hardware revenue , ,105.4 Software revenue Products revenue 1, , , , , , ,509.4 Total services revenue Other income Revenue 1, , , , , , , ,937.7 Margin Product margin (%) 10.8% 7.5% 10.5% 10.1% 8.8% 7.9% 9.8% 10.2% Total services margin (%) 68.3% 67.4% 65.1% 63.9% 63.8% 65.2% 62.1% 61.4% Total products and services margin (%) 25.3% 19.4% 24.4% 21.6% 21.4% 19.7% 24.5% 21.5% Personnel costs Other operating expenses EBITDA (adjusted) EBITDA (adjusted) (%) 4.1% 2.4% 4.5% 7.3% 2.9% 1.5% 4.4% 6.3% Expenses/income related to acquisitions Share based compensation EBITDA Depreciation Amortization related to acquisitions Operating profit (EBIT)
30 Income statement actual Denmark (NOK million) NOK in million Q1 16 Q2 16 Q3 16 Q4 16 Q1 17 Q2 17 Q3 17 Q4 17 Hardware revenue 1, , , , , ,418.0 Software revenue Products revenue 1, , , , , , , ,939.2 Total services revenue Other income Revenue 1, , , , , , , ,490.4 Margin Product margin (%) 10.8% 7.4% 10.6% 10.1% 8.8% 7.9% 9.7% 10.1% Total services margin (%) 68.3% 67.4% 65.1% 63.8% 63.8% 65.2% 62.1% 61.4% Total products and services margin (%) 25.3% 19.4% 24.4% 21.5% 21.4% 19.7% 24.4% 21.5% Personnel costs Other operating expenses EBITDA (adjusted) EBITDA (adjusted) (%) 4.1% 2.4% 4.5% 7.3% 2.9% 1.5% 4.3% 6.2% Expenses/income related to acquisitions Share based compensation EBITDA Depreciation Amortization related to acquisitions Operating profit (EBIT)
31 Income statement actual Sweden (SEK million) SEK in million Q1 16 Q2 16 Q3 16 Q4 16 Q1 17 Q2 17 Q3 17 Q4 17 Hardware revenue 1, , , , , , , ,057.9 Software revenue , , , ,193.6 Products revenue 2, , , , , , , ,251.5 Total services revenue Other income Revenue 2, , , , , , , ,842.2 Margin Product margin (%) 12.2% 10.8% 12.8% 11.5% 12.8% 10.9% 13.2% 11.5% Total services margin (%) 63.4% 63.9% 65.2% 65.5% 66.6% 68.0% 67.1% 67.2% Total products and services margin (%) 21.0% 18.9% 21.8% 20.1% 22.4% 19.6% 23.0% 20.1% Personnel costs Other operating expenses EBITDA (adjusted) EBITDA (adjusted) (%) 2.9% 2.8% 3.6% 4.1% 3.3% 3.2% 4.0% 4.1% Expenses/income related to acquisitions Share based compensation EBITDA Depreciation Amortization related to acquisitions Operating profit (EBIT)
32 Income statement actual Sweden (NOK million) NOK in million Q1 16 Q2 16 Q3 16 Q4 16 Q1 17 Q2 17 Q3 17 Q4 17 Hardware revenue 1, , , , , , , ,012.9 Software revenue , , ,167.2 Products revenue 2, , , , , , , ,180.1 Total services revenue Other income Revenue 2, , , , , , , ,758.6 Margin Product margin (%) 12.2% 10.8% 12.9% 11.5% 12.8% 11.0% 13.2% 11.5% Total services margin (%) 63.4% 63.9% 65.2% 65.5% 66.6% 67.9% 67.1% 67.2% Total products and services margin (%) 21.0% 18.8% 21.9% 20.1% 22.4% 19.6% 22.9% 20.1% Personnel costs Other operating expenses EBITDA (adjusted) EBITDA (adjusted) (%) 2.9% 2.8% 3.6% 4.1% 3.3% 3.2% 4.0% 4.1% Expenses/income related to acquisitions Share based compensation EBITDA Depreciation Amortization related to acquisitions Operating profit (EBIT)
33 Income statement actual Finland (EUR million) EUR in million Q1 16 Q2 16 Q3 16 Q4 16 Q1 17 Q2 17 Q3 17 Q4 17 Hardware revenue Software revenue Products revenue Total services revenue Other income Revenue Margin Product margin (%) 8.4% 10.1% 12.1% 10.3% 7.8% 9.2% 11.4% 11.5% Total services margin (%) 60.2% 57.8% 56.3% 59.6% 61.1% 61.5% 60.3% 57.8% Total products and services margin (%) 12.7% 15.9% 18.1% 15.9% 11.9% 14.7% 19.0% 16.8% Personnel costs Other operating expenses EBITDA (adjusted) EBITDA (adjusted) (%) 1.5% 1.3% -0.1% 1.9% 1.5% 2.0% 1.4% 3.8% Expenses/income related to acquisitions Share based compensation EBITDA Depreciation Amortization related to acquisitions Operating profit (EBIT)
34 Income statement actual Finland (NOK million) NOK in million Q1 16 Q2 16 Q3 16 Q4 16 Q1 17 Q2 17 Q3 17 Q4 17 Hardware revenue Software revenue Products revenue Total services revenue Other income Revenue Margin Product margin (%) 8.4% 10.1% 12.2% 10.3% 7.8% 9.2% 11.4% 11.4% Total services margin (%) 60.2% 57.8% 56.3% 59.7% 61.1% 61.5% 60.4% 57.9% Total products and services margin (%) 12.7% 15.9% 18.2% 16.0% 11.9% 14.6% 18.9% 16.7% Personnel costs Other operating expenses EBITDA (adjusted) EBITDA (adjusted) (%) 1.5% 1.3% -0.1% 1.9% 1.5% 2.0% 1.4% 3.7% Expenses/income related to acquisitions Share based compensation EBITDA Depreciation Amortization related to acquisitions Operating profit (EBIT)
35 Income statement actual Baltics (EUR million) EUR in million Q1 16 Q2 16 Q3 16 Q4 16 Q1 17 Q2 17 Q3 17 Q4 17 Hardware revenue Software revenue Products revenue Total services revenue Other income Revenue Margin Product margin (%) 10.6% 13.6% 13.0% 12.2% 13.1% 11.6% 12.7% 10.0% Total services margin (%) 64.1% 60.6% 52.0% 56.4% 61.3% 59.4% 55.9% 58.7% Total products and services margin (%) 24.4% 26.7% 26.0% 20.1% 28.3% 25.6% 26.1% 19.7% Personnel costs Other operating expenses EBITDA (adjusted) EBITDA (adjusted) (%) 5.7% 6.2% 7.8% 4.9% 4.9% 5.1% 6.2% 6.0% Expenses/income related to acquisitions Share based compensation EBITDA Depreciation Amortization related to acquisitions Operating profit (EBIT)
36 Income statement actual Baltics (NOK million) NOK in million Q1 16 Q2 16 Q3 16 Q4 16 Q1 17 Q2 17 Q3 17 Q4 17 Hardware revenue Software revenue Products revenue Total services revenue Other income Revenue Margin Product margin (%) 10.6% 13.7% 13.0% 12.2% 13.1% 11.6% 12.7% 10.1% Total services margin (%) 64.1% 60.5% 52.0% 56.3% 61.3% 59.4% 56.0% 58.7% Total products and services margin (%) 24.4% 26.7% 26.0% 20.0% 28.3% 25.6% 26.1% 19.8% Personnel costs Other operating expenses EBITDA (adjusted) EBITDA (adjusted) (%) 5.7% 6.2% 7.8% 4.9% 4.9% 5.1% 6.2% 6.0% Expenses/income related to acquisitions Share based compensation EBITDA Depreciation Amortization related to acquisitions Operating profit (EBIT)
37 Income statement actual Shared services (NOK million) NOK in million Q1 16 Q2 16 Q3 16 Q4 16 Q1 17 Q2 17 Q3 17 Q4 17 Hardware revenue 1, , , , , , ,349.0 Software revenue Products revenue 1, , , , , , ,351.5 Total services revenue Other income Revenue 1, , , , , , , ,416.6 Margin Product margin (%) 2.2% 2.5% 2.4% 2.5% 2.3% 2.5% 2.3% 2.8% Total services margin (%) 85.8% 85.0% 84.2% 84.9% 83.6% 90.9% 86.6% 86.7% Total products and services margin (%) 6.1% 6.4% 6.2% 6.1% 6.6% 6.9% 6.3% 6.7% Personnel costs Other operating expenses EBITDA (adjusted) EBITDA (adjusted) (%) 0.0% 0.3% 1.1% 1.0% 0.1% 0.7% 1.0% 0.9% Expenses/income related to acquisitions Share based compensation EBITDA Depreciation Amortization related to acquisitions Operating profit (EBIT) * Atea Logistics and Atea Global Services
38
Q presentation. 5 February 2015
 Q4 2014 presentation 5 February 2015 Agenda Highlights Financial overview Market outlook Q4 Highlights Strong finish to a record year Revenue of NOK 7 549 million, up 10.3% EBITDA* of NOK 396 million,
Q PRESENTATION 13 JULY 2018
 Q2 2018 PRESENTATION 13 JULY 2018 Group Highlights Q2 2018 Strong growth in revenue and improved operating profit despite challenges in Danish subsidiary. Excellent performance in Norway, Sweden, Finland
Q presentation. 15 July 2015
 Q2 2015 presentation 15 July 2015 Q2 Highlights Revenue of NOK 6 842 million, up 14.4% EBITDA* of NOK 157 million, down 11.2% Large variance in performance across countries, with strong results in Sweden,
Cash flow from operations of NOK 2,284 million, up from NOK 1,765 million last year. Revenue of NOK 10,172 million, up 1.6% y-o-y
 Q4 2018 INTERIM REPORT Revenue of NOK 10,172 million, up 1.6% y-o-y Cash flow from operations of NOK 2,284 million, up from NOK 1,765 million last year EBIT of NOK 309 million, down 21.2% y-o-y Free cash
September 2016 Group Finance Manager, Chris Sørum
 September 2016 Group Finance Manager, Chris Sørum Highlights Q2 2016 Revenue of NOK 8,442 million, up 23.4% EBITDA* of NOK 215 million, up 36.9% Higher sales across all three lines of business Improved
Q Interim Report
 Q2 2017 Interim Report Atea had rapid growth in operating profit during the second quarter, based on higher gross margin and cost control. EBIT increased by 24% from last year. Steinar Sønsteby CEO of
Q Interim Report
 Q4 217 Interim Report Atea had record high revenue, operating profit and cash flow from operations in the fourth quarter of 217. Financial performance was driven by an acceleration in sales growth. Steinar
Q Interim Report
 Q3 218 Interim Report I am very pleased with Atea s continued strong growth in revenue and operating profit in all geographies outside of Denmark. In Denmark, we look forward to returning to normal operations
INTERIM REPORT FIRST QUARTER 2017 CEO ARNE MJØS CFO BENT HAMMER OSLO, 27 APRIL 2017
 INTERIM REPORT FIRST QUARTER 2017 CEO ARNE MJØS CFO BENT HAMMER OSLO, 27 APRIL 2017 1 HIGHLIGHTS OF THE FIRST QUARTER Revenue NOK 119 (106) million Growth of 12% y-o-y EBITDA EBITDA of NOK 16.1 (10.4)
HIGHLIGHTS Q1 KEY FIGURES JANUARY MARCH 2018 ACTIVITIES AND SIGNIFICANT EVENTS DURING THE FIRST QUARTER
 HIGHLIGHTS Q1 JANUARY MARCH 2018 Operating revenue NOK 131.2 million (NOK 118.6 million), representing growth of 11% EBITDA NOK 15.2 million (NOK 16.1 million) and an EBITDA margin of 11.6% (13.6%) EBIT
EVRY ASA Q4/FY 2017 PRESENTATION. CEO Björn Ivroth CFO Henrik Schibler
 EVRY ASA Q4/FY 2017 PRESENTATION CEO Björn Ivroth CFO Henrik Schibler Agenda Q4/ Preliminary FY 2017 presentation Group highlights Business update & trends Financial highlights Business area performance
Q Interim Report
 Q1 2016 Interim Report Atea had rapid growth in revenue during the first quarter of 2016, with significantly improved sales across all three business areas. EBITDA also increased from last year, based
Revenue 1,716 million (7% y/y) EBITA 150 million (11% y/y) EBITA margin 8,8 %
 EBITA 150 million (11% y/y) EBITA margin 8,8 %") Q3 HIGHLIGHTS GROUP Revenue 1,716 million (7% y/y) EBITA 150 million (11% y/y) EBITA margin 8,8 % Gaining share in Bank & Finance; +6% y/y Change in pension scheme implemented Significant restructuring
Q3 HIGHLIGHTS GROUP Revenue 1,716 million (7% y/y) EBITA 150 million (11% y/y) EBITA margin 8,8 % Gaining share in Bank & Finance; +6% y/y Change in pension scheme implemented Significant restructuring
change change 2016 All figures in NOK million % 1-12
 Q1 HIGHLIGHTS JANUARY MARCH 2017 Operating revenue NOK 118.6 million (105.6), representing growth of 12% EBITDA NOK 16.1 million (10.4) and an EBITDA margin of 13.6% (9.8%) EBIT NOK 11.3 million (3.8)
INTERIM REPORT 2016 B Y
 INTERIM REPORT 2016 BY ALSO GROUP INCREASES NET PROFIT BY 14 PERCENT IN THE 1st HALF YEAR ALSO Group concludes the first six month of 2016 with Group net profit of 27.8 million euros and thus increases
Annual report 2017 CREATING TOMORROW S DIGITAL SOLUTIONS
 Annual report 2017 CREATING TOMORROW S DIGITAL SOLUTIONS Content The Business Board of Directors' Report The Board Shareholder Info Atea Group accounts Atea ASA accounts Corporate Governance Content Key
EDB Business Partner ASA REPORT FOR THE THIRD QUARTER OF 2007
 - 1 - EDB Business Partner ASA REPORT FOR THE THIRD QUARTER OF 2007 Revenues of NOK 1,465 million, 7% y/y growth Improved EBITA margin to 9.3% compared to 8.9% in 2006 Solutions and Application Services
Press Release December 15, 2017
 ISRA VISION AG: 2016 / 2017 financial year Revenues and EBT +11 %, cash flow significantly stronger ISRA again matches full year guidance: Heading for the next revenue level with double-digit growth rates
HIGHLIGHTS Q2 AND H1 2018
 HIGHLIGHTS Q2 AND H1 2018 APRIL JUNE 2018 Operating revenue NOK 137.6 million (NOK 113.5 million), representing growth of 21% EBITDA NOK 14.7 million (NOK 12.9 million) and an EBITDA margin of 10.7% (11.4%)
Third quarter of 2010
 Third quarter of 2010 Main features of the third quarter of 2010 Merger with ErgoGroup completed with effect from 30 September 2010 Operating revenue NOK 1,679 million (NOK 1,716 million) EBITA NOK 70
FINANCIAL REPORT January June 2018
 FINANCIAL REPORT January June Strategy We are constantly working according to our established strategy, in order to meet the company s objectives and financial targets. The strategy is based on the following
RESULTS 1 st QUARTER 2018 (IFRS, UNAUDITED)
") RESULTS 1 st QUARTER (IFRS, UNAUDITED) April 19, SAFE HARBOR This presentation includes forward-looking statements based on the beliefs of Software AG management. Such statements reflect current views
RESULTS 1 st QUARTER (IFRS, UNAUDITED) April 19, SAFE HARBOR This presentation includes forward-looking statements based on the beliefs of Software AG management. Such statements reflect current views
Bottomline Technologies Reconciliation to Non GAAP Measures Three Months Ended June 30, 2013
 Reconciliation to Measures Three Months Ended June 30, 2013 Non Cash Amortization of Equity Based Integration Restructuring Interest GAAP Intangible Assets Compensation Related Expenses Expenses Expense
HIGHLIGHTS Q3 KEY FIGURES JULY SEPTEMBER 2018 ACTIVITIES AND SIGNIFICANT EVENTS DURING THE THIRD QUARTER
 HIGHLIGHTS Q3 JULY SEPTEMBER 2018 Operating revenue NOK 121.3 million (NOK 108.0 million), representing growth of 12% EBITDA NOK 11.8 million (NOK 11.5 million) and an EBITDA margin of 9.7% (10.7%) EBIT
Highlights fourth quarter 2016
 LINK Mobility Group ASA Financial Results Fourth quarter 2016 Highlights fourth quarter 2016 Continued strong growth in all main markets 115 per cent revenue growth. Organic growth of 40 per cent in mobile
HIGHLIGHTS INTERIM REPORT Q XXL ASA. Q3 Growth
 INTERIM REPORT Q3 2017 XXL ASA HIGHLIGHTS Total revenues of NOK 2 417 million (NOK 2 080 million), up 16 per cent Like-for-like growth of 6 per cent EBITDA of NOK 252 million (NOK 214 million) Solid results
change change 2016 All figures in NOK million % % 1-12
 HIGHLIGHTS Q3 JULY SEPTEMBER 2017 Operating revenue NOK 108.0 million (NOK 91.8 million), representing growth of 18% EBITDA NOK 11.5 million (NOK 11.0 million) and an EBITDA margin of 10.7% (12.0%) EBIT
Fourth quarter of 2010
 Fourth quarter of 2010 Main features of the fourth quarter of 2010 Operating revenue NOK 3,363 million, 2% organic growth EBITA before synergy costs NOK 171 million (NOK 283 million) Revenue growth and
HIGHLIGHTS INTERIM REPORT Q XXL ASA. YTD Growth. Q4 Growth
 INTERIM REPORT Q4 2017 XXL ASA HIGHLIGHTS Total revenues of NOK 2 525 million (NOK 2 151 million), up 17 per cent Like-for-like growth of 7 per cent EBITDA of NOK 332 million (NOK 286 million) Strong cash
Q Interim Report January-September 2012
 Q3-2012 Interim Report January-September 2012 1 We have continued our aggressive approach to the market in Q3 and our revenue has grown at more than twice the market rate. This aggressive approach has
change change All figures in NOK million % %
 HIGHLIGHTS Q4 AND 2017 OCTOBER - DECEMBER 2017 Operating revenue NOK 135.0 million (NOK 117.3 million), representing growth of 15% EBITDA NOK 19.0 million (NOK 18.5 million) and an EBITDA margin of 14.1%
OSLO BØRS TICKER: EVRY
 OSLO BØRS TICKER: EVRY Interim Report for Q4 2017 and preliminary full year 2017 Contents Financial Highlights 5 Key Figures and Financial Ratios 6 Group Performance 7 Business Area Performance 10 Condensed
Q presentation. 19 November 2015
 Q3 2015 presentation 19 November 2015 1 Today s presenters Axel Hjärne Chief Executive Officer Gert Sköld Chief Financial Officer 2 Eltel in brief Q3 2015 business performance Q3 2015 financials Market
Press Release February 28, 2018
 ISRA VISION AG: First quarter 2017 / 2018 revenues grow by approx. +10 %, EBT by +11 % ISRA starts dynamically into the new financial year: Guidance again double-digit Revenues at 31.2 million euros, plus
Interim report January December 2018
 Interim report January December 2018 PERIOD OCTOBER 1 DECEMBER 31, 2018 PERIOD JANUARY 1 DECEMBER 31, 2018 Net sales decreased by 1 % to SEK 109.6 m Net sales increased by 4 % to SEK 406.4 m (SEK 390.2
FY2017 Result Presentation. 21 August 2017
 FY2017 Result Presentation 21 August 2017 The Hansen journey growing and diversifying by geography, industry, propriety products and customer Early 1990 s Today Revenue by geography Industry verticals
Welcome. ALSO Holding AG Annual Results Media Conference 2014
 Welcome ALSO Holding AG Annual Results Media Conference 2014 1 Disclaimer This presentation contains forward-looking statements or opinions which are based on current assumptions and forecasts of the ALSO
Report Third quarter evry.com
 Report Third quarter 2012 evry.com About EVRY EVRY is one of the leading IT companies in the Nordic countries, with a strong local and regional presence in 50 Nordic towns and cities. Through its knowledge,
4th quarter. Year Continuing operations (NOK in millions) Actual Actual Growth Actual Actual Growth Actual
 Actual Actual Growth Actual Actual Growth Actual") 2 4th quarter Year Year Continuing operations 2017 2016 2017 2016 2016 (NOK in millions) Actual Actual Growth Actual Actual Growth Actual Revenue 2 809 2 120 32,5 % 9 346 7 855 19,0 % 7 855 EBITDA 615
2 4th quarter Year Year Continuing operations 2017 2016 2017 2016 2016 (NOK in millions) Actual Actual Growth Actual Actual Growth Actual Revenue 2 809 2 120 32,5 % 9 346 7 855 19,0 % 7 855 EBITDA 615
Q Interim Report January-March 2012
 Q1-2012 Interim Report January-March 2012 1 The tougher market conditions which we saw in the second half of 2011 and in Q4 in particular, have continued into 2012. I am therefore very pleased to see that
Norwegian Finans Holding ASA. Investor Presentation for Contemplated Private Placement April 2016
 Norwegian Finans Holding ASA Investor Presentation for Contemplated Private Placement April 2016 Disclaimer THIS PRESENTATION (HEREINAFTER REFERRED TO AS THE PRESENTATION ) HAS BEEN PREPARED BY NORWEGIAN
First Quarter 2017 April 19, qlirogroup.com
 First Quarter 2017 April 19, 2017 BUSINESS UPDATE Marcus Lindqvist, CEO 2 Increased Gross Profit and Credit Market Licence Highlights Strategy Focus 1. E-commerce gross profit increased 15 per cent to
CEO Terje Mjøs. Oslo, 17 July Q Presentation
 CEO Terje Mjøs Oslo, 17 July 1 Q 1 Presentation Q 1 Highlights Profitable and strong organic growth in Sweden +1% YoY o Flat in Norway, +3% in total EBITA NOK 15 million (+9% YoY*) o Including synergy
Annual Report N.B. The English text is an in-house translation. For any difference in the translation the Swedish version will prevail.
 Annual Report 2016 N.B. The English text is an in-house translation. For any difference in the translation the Swedish version will prevail. The Board of Directors and CEO of Hitech & Development Wireless
HIGHLIGHTS Q2 AND H1 2017
 HIGHLIGHTS Q2 AND H1 2017 APRIL JUNE 2017 Operating revenue NOK 113.5 million (110.0), representing growth of 3% EBITDA NOK 12.9 million (15.6) and an EBITDA margin of 11.4% (14.2%) EBIT NOK 7.8 million
Visual Management 2Q02
 Visual Management 2Q02 Consensus Q2 (Carnegie, Deutche, Enskilda, ABN, ABG, Handelsbanken, DnB, Danske, Fonds) Min Max Consensus Actual Net sales 274 306 292 EBITDA 34 37 35 EPS 0,40 1,10 0,60 Cost base
HIGHLIGHTS INTERIM REPORT Q XXL ASA. Q1 Growth
 INTERIM REPORT Q1 2018 XXL ASA HIGHLIGHTS Total revenues of NOK 2 070 million (NOK 1 713 million), up 21 per cent E-commerce growth of 42 per cent EBITDA of NOK 51 million (NOK 34 million) Solid cash flow
FOURTH QUARTER Highlights from fourth quarter 2008 include:
 FOURTH QUARTER 2008 Highlights from fourth quarter 2008 include: Revenues of 1076 MNOK (947 MNOK in fourth quarter 2007). Positive currency impact by 18% Operating profit of 136 MNOK (131 MNOK in fourth
RECORD SALES, EBITA AND CASH FLOW ACCELERATED ORGANIC GROWTH TO 19 %
 RECORD SALES, EBITA AND CASH FLOW ACCELERATED ORGANIC GROWTH TO 19 % Bygghemma Group First AB (publ) 1 Today s presenters Mikael Olander President and CEO Martin Edblad CFO Bygghemma Group since 2012 CEO
Favourable trend in core operations amid a challenging market
 THIRD QUARTER MARCH 1, 2015 MAY 31, 2015 Favourable trend in core operations amid a challenging market Summary of third quarter of 20 Third quarter Net sales for the quarter increased 0.9 per cent to SEK
Q INTERIM FINANCIAL REPORT. Crayon Group
 Q3 2017 INTERIM FINANCIAL REPORT Crayon Group This document contains the un-audited consolidated quarterly financial statements and notes for Crayon Group Holding ASA. The below commentary should be read
Full year results for the year ended 31 December 2018
 Full year results for the year ended 31 December 2018 April 2019 1 What We Do Raw Intern et Real-time DDoS Mitigation product optimised for Service Providers and Cloud/Hosting Providers Available for rapid
Q2 FY 18 Investor Presentation. February 26, 2018
 Q2 FY 18 Investor Presentation February 26, 2018 Safe harbor This presentation contains forward-looking statements within the meaning of Section 27A of the Securities Act and Section 21E of the Exchange
Q Crayon Group Interim financial report
 Q2 2018 Crayon Group Interim financial report Content Highlights and key figures Business review Financial review Financial statements and notes This document contains the un-audited consolidated quarterly
Year-end report Jan-Dec February, 2018
 1 Year-end report Jan-Dec 2017 1 February, 2018 Executive summary on development We follow our strategic plan Good sales growth continues Supply chain back on track Efficiency improvements according to
Interim report January March 2018
 Interim report January March 2018 PERIOD JANUARY 1 MARCH 31, 2018 Net sales increased by 7 % to SEK 101.2 m (SEK 94.7 m) Software revenues increased by 9 % to SEK 66.2 m (SEK 61.0 m) Recurring revenue
New Revenue Rules ASC 606. September 5, 2017
 New Revenue Rules ASC 606 September 5, 2017 2 Welcome Safe Harbor Non-GAAP Financial Measures and Other Key Performance Measures To supplement our condensed consolidated financial statements, which are
A leading European learning and media company
 A leading European learning and media company Markus Holm, CFO & COO SEB Nordic Seminar 2019 SANOMA AS AN INVESTMENT: A leading European learning and media company Growing dividends Strong and balanced
21Vianet Group, Inc. Reports Fourth Quarter and Full Year 2016 Unaudited Financial Results
 March 8, 2017 21Vianet Group, Inc. Reports Fourth Quarter and Full Year 2016 Unaudited Financial Results BEIJING, March 08, 2017 (GLOBE NEWSWIRE) -- 21Vianet Group, Inc. (Nasdaq:VNET) ("21Vianet" or the
Q Interim Report January June
 Q2 Interim Report January June Growth of 5% profit improvement continues Group sales growing by 5% driven by 12% growth in software-based Industry Products Adjusted operating margin improves to above 9%
EVRY ASA Q PRESENTATION CEO BJÖRN IVROTH CFO HENRIK SCHIBLER
 1 EVRY ASA Q1 2018 PRESENTATION CEO BJÖRN IVROTH CFO HENRIK SCHIBLER Agenda Group highlights Business update Financial highlights Business area performance Targets and Concluding remarks Q&A 2 Group highlights
Net profit of DKK 151m in 9M 2018 compared to DKK 126m in 9M Free cash flow for 9M 2018 was DKK 116m compared to negative DKK 14m in 9M 2017
 Company announcement 10/2018 October 25, 2018 Financial report for the first nine months of 2018 NNIT delivers revenue growth of 5.4% and an operating profit margin of 9.2% in 9M 2018 supporting the recent
RESULTS 2 nd QUARTER 2018
 RESULTS 2 nd QUARTER (IFRS, UNAUDITED) July 18, Software AG. All rights reserved. SAFE HARBOR This presentation includes forward-looking statements based on the beliefs of Software AG management. Such
Quarterly Report Q1 2018
 Quarterly Report Q1 2018 26 April 2018 The global leader in door opening solutions A good start to the year First quarter Net sales increased by 2% to SEK 18,550 M (18,142), with organic growth of 4% (6)
H1/2018 Results u-blox Holding AG
 H1/2018 Results August 24, 2018 Thomas Seiler, CEO Roland Jud, CFO Disclaimer This presentation contains certain forward-looking statements. Such forward-looking statements reflect the current views of
Magic Software Reports Financial Results for Q1 2008
 PRESS RELEASE Magic Software Reports Financial Results for Q1 2008 -- Sharp Rise in Cash & Equivalents to $32 million; 9% Revenue Growth with Continued Strong Gross Margin -- Or Yehuda, Israel, May 21,
QUANT INTERIM REPORT JANUARY JUNE 2018 INTERIM REPORT
 INTERIM REPORT January June 1 April June Revenue for the period remained flat against prior year in local currency. Revenue decreased to EUR 44.8 million from EUR 46.7 million prior year, including currency
MAISONS DU MONDE: FULL-YEAR 2018 RESULTS
 PRESS RELEASE MAISONS DU MONDE: FULL-YEAR 2018 RESULTS Strong performance in line with targets Continued solid momentum in online and international sales Focus on strategic pillars to deliver further profitable
Very strong license sales
 Interim Report JANUARY MARCH 214 Very strong license sales License revenue for January-March increased with 27 percent to SEK 53.4 (42.) million Sales for January-March increased with 9 percent to SEK
Q INTERIM FINANCIAL REPORT. Crayon Group
 Q4 2017 INTERIM FINANCIAL REPORT Crayon Group This document contains the un-audited consolidated quarterly financial statements and notes for Crayon Group Holding ASA. The below commentary should be read
Investor Presentation Q Results. 16 August 2016
 Investor Presentation Q2 2016 Results 16 August 2016 Forward-looking statements This presentation contains forward-looking statements, including, but not limited to, the statements and expectations contained
Interim report January June 2018
 Interim report January June 2018 PERIOD APRIL 1 JUNE 30, 2018 Net sales increased by 3 % to SEK 100.0 m (SEK 97.1 m) Software revenues increased by 6 % to SEK 66.1 m (SEK 62.3 m) Recurring revenue amounted
Q Quarterly Report
 Q4 2009 Quarterly Report Record revenue and positive net results for 2009 24SevenOffice ASA had a record revenue of MNOK 20.2 for 4Q09, and record yearly revenue of MNOK 74.7 for 2009, up 47 % compared
Innofactor Plc Financial Statement 2015 (IFRS)
") FINANCIAL STATEMENT 2015 1 (46) Financial Statement March 1, 2016, at 8:30 Finnish time Financial Statement 2015 (IFRS) Summary Quarter 10 12/2015: Growth of net sales was 2.9%, which we estimate to exceed
FINANCIAL STATEMENT 2015 1 (46) Financial Statement March 1, 2016, at 8:30 Finnish time Financial Statement 2015 (IFRS) Summary Quarter 10 12/2015: Growth of net sales was 2.9%, which we estimate to exceed
Interim report Q3, July September 2017 Stockholm, 25 October 2017
 Interim report Q3, July September Stockholm, 25 October As of the second quarter of, Cloetta Italia S.r.l. is accounted for as discontinued operation. The comparative figures in the consolidated profit
PHOTOCURE ASA RESULTS FOR FIRST QUARTER MAY Kjetil Hestdal, MD, President & CEO Erik Dahl, CFO
 PHOTOCURE ASA RESULTS FOR FIRST QUARTER 2018 23 MAY 2018 Kjetil Hestdal, MD, President & CEO Erik Dahl, CFO DISCLAIMER The information included in this Presentation contains certain forward-looking statements
Interim Report Q Self Storage Group ASA
 Interim Report Q2 2018 Self Storage Group ASA Contents Highlights 2 Key Figures 2 Subsequent events 2 Financial development 3 Strategy 6 Corporate developments 8 Risks and uncertainty factors 8 Outlook
Func Food Group Interim Report Q3 2015
 Func Food Group Interim Report Q3 2015 Summary Func Food Group Oy ( FFG ) is a Nordic wellness company, which markets and distributes FAST, CocoVi, FitFarm, Celsius and Freddy brands in Finland and Sweden.
Fourth quarter and full year 2017 results
 Fourth quarter and full year 207 results FINANCIAL AND OPERATIONAL HIGHLIGHTS Financial summary Q4 '7 Revenue of 220 million (Q4 '6: 266 million) Gross margin of 59% (Q4 '6: 58%) EBITDA of 37 million (Q4
Interim Report H1/2018
 Interim Report H1/2018 Columbus A/S CVR.: 13 22 83 45 Columbus, Lautrupvang 6, DK-2750 Ballerup Phone: +45 70 20 50 00, Fax: +45 70 25 07 01 www.columbusglobal.com, CVR.: 13 22 83 45 2 Financial Statements
P R E S S R E L E A S E
 P R E S S R E L E A S E from ASSA ABLOY AB (publ) 2 November 2004 No. 12/04 ASSA ABLOY: CONTINUED STRONG ORGANIC GROWTH IN THE THIRD QUARTER Sales in the third quarter increased organically by 6% to SEK
Nemetschek Group. Financial Highlights Second Quarter / Half Year 2018 July 27, 2018
 Nemetschek Group Financial Highlights Second Quarter / Half Year 2018 July 27, 2018 Top key figures Q2 2018: Accelerated growth with high profitability Revenues m Recurring revenues m EBITDA m EPS 97,7
EVRY ASA Q PRESENTATION CEO BJÖRN IVROTH CFO HENRIK SCHIBLER
 1 EVRY ASA Q3 2018 PRESENTATION CEO BJÖRN IVROTH CFO HENRIK SCHIBLER Agenda Group highlights Business update Financial highlights Business area performance Concluding remarks Q&A 2 Group highlights Q3
SOFTWARE AG THE NEW GROWTH DRIVER KEPLER CHEUVREUX ROADSHOW HELSINKI / STOCKHOLM MAY 3-4, Software AG. All rights reserved.
 IOT @ SOFTWARE AG THE NEW GROWTH DRIVER KEPLER CHEUVREUX ROADSHOW HELSINKI / STOCKHOLM MAY 3-4, 2018 SAFE-HARBOR-STATEMENT This presentation includes forward-looking statements based on the beliefs of
Quarterly Report Q4 2017
 Quarterly Report Q4 2017 Arcus ASA 2 Contents Message from the CEO... 3 Key figures Q4 2017... 3 Highlights Q4 2017... 4 Wine: Improved margins despite strong EUR... 5 Spirits: Soft sales, improved margins...
Fourth quarter and full-year report 2018
 Fourth quarter and full-year report Stockholm, January 25, 2019 Fourth quarter highlights Sales as reported increased by 10% YoY and sales adjusted for comparable units and currency increased by 4%. Networks
Interim Management Statement Q3 YTD 2018
 Interim Management Statement Q3 YTD 2018 November 7, 2018 Release no. 20/2018 Columbus delivers 52% growth in revenue In the first three quarters of 2018 Columbus delivers revenue growth of 52% and increases
Telio Holding ASA Q presentation. Eirik Lunde, CEO Oslo, 29 April 2010
 Telio Holding ASA 2010 presentation Eirik Lunde, CEO Oslo, 29 April 2010 1 Telio Holding ASA Leading European access independent broadband telephony provider Committed to improving user experience and
Q results. April 27, 2018
 Q1 2018 results April 27, 2018 Consolidated financial statements as of March 31, 2018 were authorized for issue by the Board of Directors held on April 26, 2018. Q118 KEY HIGHLIGHTS Q1 2018 in line with
AFFECTO PLC INTERIM REPORT 4 AUGUST 2009 at 9.30 MEUR 4-6/09 4-6/08 1-6/09 1-6/
 1 INTERIM REPORT 1-6/2009 AFFECTO PLC INTERIM REPORT 4 AUGUST 2009 at 9.30 AFFECTO PLC'S INTERIM REPORT 1-6/2009 GROUP KEY FIGURES MEUR 4-6/09 4-6/08 1-6/09 1-6/08 2008 Net sales 26.2 36.2 53.7 69.8 131.6
Accounting FAQ LAST UPDATED FISCAL 2018 Q4
 Accounting FAQ LAST UPDATED FISCAL 2018 Q4 About this document The purpose of this document is to clarify accounting topics specific to Electronic Arts and the videogame industry. We also highlight how
Q presentation Carn 20 F egie ebru and ary DNB Mark 2018 ets
 Q4 presentation Carnegie 2 February and 218 DNB Markets (Joint Global Coordinators) 1 Disclaimer These materials may contain statements about future events and expectations that are forward-looking statements.
CEO Terje Mjøs. Oslo, 8 February Q Presentation
 CEO Terje Mjøs Oslo, 8 February 213 2 Presentation Part I ` Report o Group o Segments Part II Cost improvements o Revenue and margin analysis o Future proof Part III Outlook o Market o Company Summary
Year-end report January - December January 24, 2017 Mattias Ankarberg and Pernilla Walfridsson
 Year-end report January - January 24, 2017 Mattias Ankarberg and Pernilla Walfridsson Summary Q4 2016 Net sales increased +16.2 percent, compared with pro forma unchanged (0.0%). Net sales for comparable
Q Quarterly Report
 Q1 2010 Quarterly Report Record quarterly revenue and record EBITDA Q1 2010 24SevenOffice ASA had a record revenue of MNOK 24.4 for 1Q10, up 28% compared to 1Q09 and a positive operating profit before
NetDragon Announces 2016 Third Quarter Financial Results
 NetDragon Announces 2016 Third Quarter Financial Results Games business continues year-over-year growth momentum, poised for strong growth in 2017 with a robust pipeline Laying solid foundation for education
TELENOR GROUP Third quarter Sigve Brekke, CEO
 TELENOR GROUP Third quarter 2018 Sigve Brekke, CEO 1 Disclaimer The following presentation is being made only to, and is only directed at, persons to whom such presentation may lawfully be communicated
NEMETSCHEK GROUP Company Presentation. January 2016
 NEMETSCHEK GROUP Company Presentation January 2016 1 Agenda NEMETSCHEK GROUP: In Brief.......3 Strategy... 8 Financials: 9 Months 2015.........12 NEMETSCHEK Share..........22 Outlook.....26 Contact......28
Interim Report Q1 FY 18
 Interim Report Q1 FY 18 Quarter 1 / Fiscal Year 2018 Continued positive development extends into the new fiscal year Sivantos delivered 3.5% organic growth 1) in Q1 2018 with negative Fx translation effects
ORACLE CORPORATION. Q4 FISCAL 2013 FINANCIAL RESULTS CONDENSED CONSOLIDATED STATEMENTS OF OPERATIONS ($ in millions, except per share data)
") Q4 FISCAL 2013 FINANCIAL RESULTS CONDENSED CONSOLIDATED STATEMENTS OF OPERATIONS ( in millions, except per share data) REVENUES Software Revenues Hardware systems support Hardware Systems Revenues Services
Q4 FISCAL 2013 FINANCIAL RESULTS CONDENSED CONSOLIDATED STATEMENTS OF OPERATIONS ( in millions, except per share data) REVENUES Software Revenues Hardware systems support Hardware Systems Revenues Services