Checklist 2005 Q404 Q105 Q205 Q305
|
|
|
- Clifton Campbell
- 6 years ago
- Views:
Transcription
1 FY 20 0
2 Checklist 20 To-do list 20 Status Q404 Q1 Q2 Q3 Integrate TiTech and Orwak Group into TOMRA Successfully complete pilots in the UK and Japan Execute on German opportunity Revitalize and achieve profitable growth Improve TiTech/Orwak performance Secure permanent installations in Tokyo Conclude partnership agreement with Sumitomo New organizational structure to increase focus/create momentum Ensure 80 MNOK in cost savings, restructuring charges of ~50 MNOK Write-down of assets estimated to 114 Divest Brazilian operations Finalize product portfolio harmonization Strengthen California business model Achieve 50-70% market share in Germany Decide on future of UK project 1H /2007 1Q
3 Back to sustainable profitable growth... Operating revenues 12 month rolling average NOK million Gross Margin 12 month rolling average Percent 2, % 2,650 2, % 37.0% 36.5% 2, % 2, % 2,450 2,400 Jan- Feb- Mar- Apr- May- Jun- Jul- Aug- Sep- Oct- Nov- Dec- 35.0% 34.5% 34.0% Jan- Feb- Mar- Apr- May- Jun- Jul- Aug- Sep- Oct- Nov- Dec- Operating expenses 12 month rolling average NOK million Operating profit 12 month rolling average NOK million Jan- Feb- Mar- Apr- May- Jun- Jul- Aug- Sep- Oct- Nov- Dec- 0 Jan- Feb- Mar- Apr- May- Jun- Jul- Aug- Sep- Oct- Nov- Dec- NOTE: One-time effects of -159 MNOK not included in the charts 2
4 Financial highlights (IFRS, continued and discontinued operations) NOK million 4Q 4Q 04 FY 20 FY 2004 Revenues RVM Technology Collection & Materials Handling Recycling Technology Other non-deposit activities Operating profit excluding restructuring charges Operating profit including restructuring charges Cash flow (from cont. ops.) Total assets (from cont. ops.) EPS (from cont. ops.) in NOK , ,


5 SEGMENT: RVM Technology 4
6 RVM Technology Financials NOK million 4Q 4Q 04 FY 20 FY 2004 Revenues Nordic Central Europe & UK Rest of Europe US East/Canada Gross contribution (in %) 159 (45%) 166 (51%) 541 c) (46%) 635 (51%) Operating expenses 93 a) 107 b) 424 d) 416 e) Operating profit (in %) 66 (19%) 59 (18%) 117 (10%) 219 (18%) a) Including restructuring charges of 6 MNOK b) Including restructuring charges of 12 MNOK c) Including inventory write-downs of 12 MNOK in 2Q d) Including total restructuring charges of 46 MNOK e) Including total restructuring charges of 19 MNOK 5
7 RVM Technology Highlights Europe North America Revenues of 810 MNOK, 9% decline versus last year; adjusted for currency effects revenues decreased by 5% Market share maintained Declining sales in Sweden, Finland and refillable markets in Central Europe Strong performance in second half Strong year in Holland driven by upgrades of old machines due to introduction of new deposit legislation Orders for ~4,000 RVMs received from Germany during 20, 4,000 additional RVMs ordered in January 2006 minimal impact on 4Q figures Revenues of 373 MNOK, 2% increase versus 2004; measured in USD revenues increased 7% to 57.9 MUSD Strong HCp sales in core Northeast markets primary driver for improvement Contract with largest lease customer renewed 1,270 RVMs placed during MNOK replacement contract in Michigan signed in January
8 RVM Technology Order situation in Germany Number of machines Contract value (ex. service) NOK billion ESTIMATES 30,000-40,000 Our expectations remain unchanged ~12,000? ~4,000? ~8,000 Others TOMRA ~1.7? ~0.5? ~1.2 Others TOMRA Total market potential Ordered so far Total market potential Ordered so far TOMRA is on the right track towards delivering on the 50% - 70% market share ambition in Germany 7
9 RVM Technology Timing of German orders to P&L Estimated number of machines taken to P&L in Germany ROUGH ESTIMATES 4Q 1Q06 ~ 80 ~ 1,000* Exact timing of installations and upgrades still partly a moving target 2Q06 3Q06 ~ 2,500* ~ 2,500 Majority of current order backlog expected to be taken to P&L during 2Q and 3Q this year 4Q06 TOTAL (so far) ~ 2,000 ~ 8,000 Available production capacity in second half of 2006 * Includes several upgrades of refillable RVMs 8
 Low cost machine produced in Poland and sold for ~4,000-5,000 EURO plus installation fee Target markets are the Nordic countries, Germany and Estonia Orders for ~260 UNO machines received in 20 and")

10 RVM Technology UNO and T-820 status Product targeting small retail stores, gas stations and convenience stores (potentially also schools, large corporate cantinas etc.) Low cost machine produced in Poland and sold for ~4,000-5,000 EURO plus installation fee Target markets are the Nordic countries, Germany and Estonia Orders for ~260 UNO machines received in 20 and orders for ~200 additional machines received so far 2006 Ongoing tests with several customers (25+) including gas station chains and retailers with several thousand outlets Product targeting high volume retail stores High-end machine with new recognition technology and new user interface for easy, accurate and fast operations Important machine for accelerating replacement of old equipment Commercial deliveries started early 2006, orders received in Norway and Austria 9
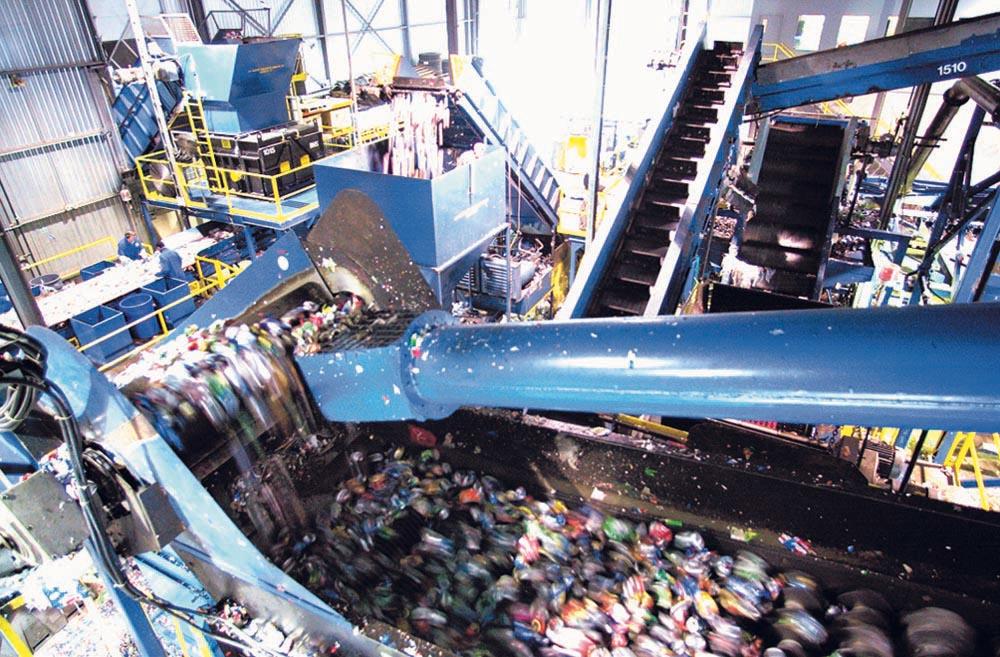

11 SEGMENT: Collection and Materials Handling
12 Collection & Materials Handling Financials NOK million 4Q 4Q 04 FY 20 FY 2004 Revenues US East/Canada US West Gross contribution (in %) 43 (21%) 41 (22%) 196 (23%) 184 (22%) Operating expenses 38* * 134 Operating profit (in %) 5 (2%) 4 (2%) 65 (8%) 50 (6%) * Including 6 MNOK in restructuring charges 11
13 Collection & Materials Handling Highlights US East/ Canada Revenues of 469 MNOK, down 3% versus 2004; measured in USD revenues increased 1% to 72.8 MUSD Record profitability due to further streamlining of transportation and processing activities Consolidation of processing plants in 20 will yield further cost savings in 2006 US West/ California) Revenues of 379 MNOK, up 12% versus 2004; measured in USD revenues increased 18% to 58.9 MUSD due to strong volume growth and attractive commodity pricing Total container volumes grew by 15% over the prior year and the total site count grew by 10% to 433 Work related claims in California reduced by 24% over prior year will impact insurance rates positively in the long term 20 was a record year in terms of profitability, and TOMRA anticipates positive trend to continue in 2006 due to commodity pricing and volume/new site growth 12
14 Collection in California Commodity prices Aluminum price development (London Metal Exchange Cash prices) USD/metric tonne In California, where TOMRA takes ownership of collected materials, the aluminum price increase is positively impacting revenues and profits As a general rule of thumb, a 100 USD/ton increase in the LME increases TOMRA s operating profit by approximately 1 MUSD Jan- Feb- Mar- Apr- May- Jun- Jul- Aug- Sep- Oct- Nov- Dec- Jan-06 Feb-06 13

15 SEGMENT: Recycling Technology 14
16 Recycling Technology Financials NOK million 4Q 4Q 04 FY 20 FY 2004 Revenues Nordic Central Europe & UK Rest of Europe US/Canada Rest of World Gross contribution (in %) 53 (45%) 27 (61%) 174 (46%) 43 (63%) Operating expenses 34* ** 23 Operating profit (in %) 19 (16%) 15 (34%) 37 (10%) 20 (29%) * Including restructuring charges of 2 MNOK ** Including total restructuring charges of 5 MNOK 15
17 Recycling Technology Highlights TiTech 3rd consequtive year of record revenues and profits driven by strong sales in Germany and the US Market share of ~70% maintained New markets entered in 20 include Korea, Australia and Norway Cooperation with TOMRA in materials handling in North America Several technology innovations in 20 ensured TiTech s position as the industry leader in optical sorting Orwak Group Stable revenue development versus previous year; Presona continued to perform well, AB Orwak faced certain challenges and Morinders had weak sales 2Q-4Q performance according to expectations after weak 1Q Market share of 20-25% maintained 20 cost reduction efforts have created a platform from which Orwak Group can grow profitably Potential cooperation with TOMRA regarding depots for handling of uncompacted deposit containers in Germany in
18 Recycling Technology - Order book Order book value NOK million Q02 1Q03 2Q03 3Q03 4Q03 1Q04 2Q04 3Q04 4Q04 1Q 2Q 3Q 4Q Timing Although first quarter is generally weak, 1Q 2006 should be significantly better than 1Q 20 based on value of order book entering


19 SEGMENT: Other non-deposit activities 18
20 Other non-deposit activities - Financials NOK million 4Q 4Q 04 FY 20 FY 2004 Revenues Gross contribution (in %) - 10 (10%) 39 (15%) 49 (13%) Operating expenses * 1 Operating profit (8) (16) (132) (56) * Including total restructuring charges of 86 MNOK in 2Q 19
21 Other non-deposit activities Highlights Brazil Brazilian operations defined as non-core during second quarter due to limited technology content TOMRA s two subsidiaries sold to Aleris in August 20 for 122 MNOK in cash UK 5 TRCs installed during 20, bringing the total number of centers to 6 Feedback from consumers and TESCO is positive, and the business model is becoming more attractive as the gap between required and actual collection volumes is narrowed TOMRA is discussing an expansion of the TRC program with TESCO, conclusion expected during 1Q 2006 Japan Test program in Tokyo/Yokohama successfully completed early 20 with Sumitomo as TOMRA s partner First 10 permanent collection centers sold to wards in Tokyo TOMRA is currently in discussions with several wards in Tokyo for deliveries of additional centers in 2006 The discussions with Sumitomo regarding future structure of partnership and business model will be concluded during first half
22 UK collection volumes Approaching break-even Number of units collected per center per month Thousand units ROUGH ESTIMATES Start-up period (Nov 04 Mar ) Mid-term period (Apr -Oct ) Current (Nov -Feb 06) Assumed break-even volume Actual volume per center (average) Assumed break-even volume Actual volume per center (average) Assumed break-even volume Actual volume per center (average) 21
23 Proposed dividend for 20 At the Annual General Assembly in May, The Board will Recommend a 20 dividend of NOK 0.35 per share Ask for a cancellation of the 4,498,000 treasury shares acquired in connection with the share buy-back program in 20 Ask for a new authorization to buy back 10 million additional shares (on top of the 10 million authorized in 20) with the purpose of cancelling them. In 2006, TOMRA will replace its option program with a cash-based 3-5 years bonus system linked to extraordinary financial performance in the Tomra Group 22


24 TOMRA focus areas in 2006 RVM Technology Collection & Materials Handling Maximize value of German opportunity Accelerate Nordic and US replacement sales Roll out UNO & T-820 Reduce COGS through continued production/ sourcing improvements Capitalize on Holland opportunity Consolidate sorting plant operations Outsource certain laborintensive activities Maximize commodity pricing opportunities Recycling Technology Development initiatives New segments and markets for TiTech Focused sales and marketing efforts in Orwak Group Selected M&A Sign agreement with Sumitomo during 1H 2006 Obtain TESCO decision on expansion of TRC program during 1Q 2006 Invest in selected new initiatives - several new projects under evaluation 23
25 24
26 Addendum slides
27 Major shareholders* Shares Ownership 1. Folketrygdfondet ,1% 2. Orkla ASA ,1% 3. State Street Bank & Client Omnibus D ,8% 4. JP Morgan Chase Bank Clients Treaty Account ,0% 5. Tomra Systems ASA ,5% 6. Danske Bank A/S 3887 Operations Sec ,5% 7. Vital Forsikring ASA DnB NOR Kapitalforvaltning ,1% 8. Clearstream Banking CID Dept, Frankfurt ,0% 9. DnB NOR Norge (IV) VPF ,6% 10. Deutsche Bank AG LON ,4% SUB-TOTAL ,1% Other shareholders ,9% TOTAL (15,003 shareholders) 178,486, % Total foreign ownership ,6% *Registered 31 December 20 26
28 Shares & shareholders* Country Shares Ownership Number of shareholders 1. Norway % Great Britain % USA % Denmark % Luxembourg % Switzerland % Sweden % Ireland % Finland % Germany % 97 TOTAL 97.7% 14 8 *Registered 31 December 20 27
Third Quarter
 Third Quarter 2005 0 Financial highlights NOK million 3Q 05 3Q 04 YTD 05 YTD 04 Revenues 701 665 1987 1849 RVM Technology 299 303 827 922 Collection & Materials Handling 247 237 647 632 Recycling Technology
Second Quarter
 Second Quarter 2005 0 Financial highlights NOK million 2Q 05 2Q 04 YTD 05 YTD 04 Revenue 687 591 1,286 1,184 RVM Technology 278 301 528 619 Collection & Materials Handling 213 206 400 395 Recycling Technology
Financial highlights Profit and loss statement
 Third Quarter 2007 Financial highlights Profit and loss statement Figures in NOK million 3Q 2007 3Q 2006 YTD 2007 YTD 2006 Revenues 861 1068 2542 2911 Collection Technology, Deposit Solutions 426 645 1228
Financial highlights Profit and loss statement
 First Quarter 2007 Financial highlights Profit and loss statement Figures in NOK million Revenues Collection Technology, Deposit Solutions Materials Handling Industrial Processing Technology Collection
Third Quarter October 2008
 Third Quarter 2008 15 October 2008 Financial Highlights g Profit and loss statement Figures in NOK million 3Q 2008 3Q 2007 YTD 2008 YTD 2007 Revenues 881 861 2546 2542 Collection Technology, Deposit Solutions
Financial highlights Profit and loss statement
 Second Quarter 2007 Financial highlights Profit and loss statement Figures in NOK million 2Q 2007 2Q 2006 YTD 2007 YTD 2006 Revenues 887 1020 1681 1843 Collection Technology, Deposit Solutions 430 656
Another strong quarter for TOMRA
 Another strong quarter for TOMRA Strong overall performance Revenues of 1,068 MNOK (+67 percent vs. 641 MNOK in third quarter 2005) Operating profit of 194 MNOK (71 MNOK in third quarter 2005) Cash flow
THIRD QUARTER Highlights from third quarter 2005 include: Operating profit of 79 MNOK before restructuring charges (83 MNOK last year)
") THIRD QUARTER 2005 Highlights from third quarter 2005 include: Revenues of 701 MNOK (+5% percent relative to third quarter 2004) Operating profit of 79 MNOK before restructuring charges (83 MNOK last year)
THIRD QUARTER 2005 Highlights from third quarter 2005 include: Revenues of 701 MNOK (+5% percent relative to third quarter 2004) Operating profit of 79 MNOK before restructuring charges (83 MNOK last year)
FOURTH QUARTER Highlights from fourth quarter 2006 include: Strong cash flow from operations of 254 MNOK (131 MNOK in fourth quarter 2005)
") FOURTH QUARTER 2006 Highlights from fourth quarter 2006 include: Revenues of 1,054 MNOK (+56 percent relative to 675 MNOK in fourth quarter 2005) Operating profit of 135 MNOK (79 MNOK in fourth quarter
FOURTH QUARTER 2006 Highlights from fourth quarter 2006 include: Revenues of 1,054 MNOK (+56 percent relative to 675 MNOK in fourth quarter 2005) Operating profit of 135 MNOK (79 MNOK in fourth quarter
2 ND QUARTER 2013 RESULTS ANNOUNCEMENT
 2 ND QUARTER 2013 RESULTS ANNOUNCEMENT TOMRA SYSTEMS ASA 18th of July 2013 HIGHLIGHTS FROM THE QUARTER INCLUDE Revenues Gross margin Revenues of 1,177 MNOK (948 MNOK in second quarter 2012). Organic, currency
THIRD QUARTER Strong performance in Collection Technology Deposit. Improved performance and outlook in Industrial Processing Technology
 THIRD QUARTER 2009 Highlights from third quarter 2009 include: Strong performance in Collection Technology Deposit Improved performance and outlook in Industrial Processing Technology California negatively
FOURTH QUARTER Highlights from fourth quarter 2008 include:
 FOURTH QUARTER 2008 Highlights from fourth quarter 2008 include: Revenues of 1076 MNOK (947 MNOK in fourth quarter 2007). Positive currency impact by 18% Operating profit of 136 MNOK (131 MNOK in fourth
Financial highlights - 2nd quarter 2002
 Second Quarter 2002 Financial highlights - 2nd quarter 2002 Revenues from continuing operations 670 MNOK, up 4%! Europe 258 MNOK, up 14%! North America 323 MNOK, down 3%! South America 89 MNOK, up 3% 14%
FOURTH QUARTER Solid performance in Collection Technology. Continued improved performance and order inflow in Industrial Processing Technology
 FOURTH QUARTER 2009 Highlights from fourth quarter 2009: Solid performance in Collection Continued improved performance and order inflow in Industrial Processing California adversely affected by reduced
Fourth Quarter 2010 Results
 Fourth Quarter 2010 Results 18 February 2011 1 Highlights from the quarter include Improved Group performance: Revenues up 9% (local currencies) Gross margin 41%, up from 33% (or up from 35% adjusted for
Third Quarter 2001 initials/subject/1
 Third Quarter 2001 Tomra Group 3rd Quarter 2001 NOKm Cont. Disc. Total Operating revenues 697 87 784 Cost of goods sold 408 99 507 Gross contribution 289 (12) 277 Operating expenses 176 4 180 Operating
Six good reasons for choosing DNB in the new banking environment
 Six good reasons for choosing DNB in the new banking environment Bank of America Merrill Lynch, 18th Annual Banking & Insurance CEO Conference 2013 24 September, London Rune Bjerke, CEO of DNB 1 Reason
SECOND QUARTER and FIRST HALF 2012
 SECOND QUARTER and FIRST HALF 2012 Highlights from second quarter 2012 include: Revenues of 948 MNOK (952 MNOK in second quarter 2011) Unchanged in local currencies +4% in Sorting Solutions - 2% in Collection
Shareholder information
 SHAREHOLDER INFORMATION Index 89 06: Shareholder information Share price development in 2009 NOK NOK 60 50 40 30 20 10 0 Jan. Feb. Mar. Apr. May Jun. Jul. Aug. Sept. Oct. Nov. Dec. Introduction p.90 Dividend
Your Aquaculture Technology and Service Partner. Q Presentation Oslo - August 17 th, 2016 Trond Williksen, CEO Eirik Børve Monsen, CFO
 Q2 2016 Presentation Oslo - August 17 th, 2016 Trond Williksen, CEO Eirik Børve Monsen, CFO Agenda 1 Highlights 2 Financial performance 3 Outlook 4 Q&A Highlights Q2 2016 - by CEO Trond Williksen 3 Improved
1Q 2017 EARNINGS PRESENTATION MAY 10, 2017
 1Q 2017 EARNINGS PRESENTATION MAY 10, 2017 Real Industry, Inc. 17 State Street, Suite 3811, New York, NY 10004 www.realindustryinc.com Real Alloy, Inc. 3700 Park East Dr., Suite 300, Beachwood, OH 44122
Executive Board meeting. 14 December 2011
 Executive Board meeting December EU measures ECB Key policy rate has been reduced to. percent Measures: Liquidity operation with a maturity of months Reserve requirements reduced from to per cent Reduced
Shareholder information
 SHAREHOLDER INFORMATION Index 107 07: Shareholder information Share price development in 2010 NOK 65 60 55 50 45 40 35 30 25 Jan. Feb. Mar. Apr. May Jun. Jul. Aug. Sept. Oct. Nov. Dec. Hydro Oslo Børs
Shareholder information
 SHAREHOLDER INFORMATION Index 115 05: Shareholder information Share price development in 2011 NOK 55 50 45 40 35 30 25 20 Jan. Feb. Mar. Apr. May Jun. Jul. Aug. Sept. Oct. Nov. Dec. Introduction p.116
Interim results briefing. Jyri Luomakoski President and CEO Riitta Palomäki CFO 1 9 / 2016
 Interim results briefing Jyri Luomakoski President and CEO Riitta Palomäki CFO 1 9 / 2016 Q3/2016: Performance in Europe improved, supply issues impacted North American business July - September, M Net
FTSE Global Equity Index Series
 FTSE Global Equity Index Series THE FTSE GLOBAL EQUITY INDEX SERIES With an unparalleled record of flexibility, transparency, consistent accuracy and the ability to meet any mandate, FTSE indices are already
Chapter 1 International economy
 Chapter International economy. Main points from the OECD's Economic Outlook A broad-based recovery has taken hold Asia, the US and the UK have taken the lead. Continental Europe will follow Investment
Your Aquaculture Technology and Service Partner. Q Presentation Oslo - February 19 th, 2016 Trond Williksen, CEO Eirik Børve Monsen, CFO
 Q4 2015 Presentation Oslo - February 19 th, 2016 Trond Williksen, CEO Eirik Børve Monsen, CFO Agenda 1 Highlights 2 Financial performance 3 Outlook 4 Q&A Highlights Q4 2015 - by CEO Trond Williksen 3 MNOK
2 ND QUARTER 2017 RESULTS ANNOUNCEMENT
 2 ND QUARTER 2017 RESULTS ANNOUNCEMENT TOMRA SYSTEMS ASA 2 nd Quarter Results 19.07.2017 HIGHLIGHTS FROM THE QUARTER Revenues Gross margin Operating expenses EBITA Cashflow TOMRA Collection TOMRA Sorting
Annual Accounts Annika Falkengren President & CEO
 Annual Accounts 2014 Annika Falkengren President & CEO Unique economic environment Key Interest rates % 2.00 1.80 1.60 1.40 1.20 1.00 0.80 0.60 0.40 0.20 0.00 Jan-14 Sweden Norway Eurozone Feb-14 Mar-14
Multi Asset Indices Selection and Rebalance Dates
 29 January 2015 DBIQ Index Selection Report Multi Asset Indices Selection and Rebalance Dates The report is designed to provide the details of future dates of selection and rebalance of various Multi-Asset
Table Lamp & Reading Light Produced by IAR Team Focus Technology Co., Ltd
 Table Lamp & Reading Light 2012.12 Produced by IAR Team Focus Technology Co., Ltd Contents 1. Chinese Table Lamps & Reading Lights Industry Export from Jan. to Nov. in 2012... 3 1.1. Export Quantity &
THE NASDAQ OMX CLEARING MODEL 27 NOVEMBER 2013
 THE CLEARING MODEL 27 NOVEMBER 2013 THE CLEARING MODEL AGENDA Introduction + Regulations + Roadmap 2013 + EMIR License Clearing model + Account structure + Segregation + Portability Legal certainty 2 Introduction
Outlook for the Norwegian economy
 .9.9 Outlook for the Norwegian economy Governor Svein Gjedrem, Norges Bank, September 9 Indicator for world trade -month change. Per cent. January July 9 Manufacturing production Growth in past months.
XML Publisher Balance Sheet Vision Operations (USA) Feb-02
 Feb-02") Page:1 Apr-01 May-01 Jun-01 Jul-01 ASSETS Current Assets Cash and Short Term Investments 15,862,304 51,998,607 9,198,226 Accounts Receivable - Net of Allowance 2,560,786
Page:1 Apr-01 May-01 Jun-01 Jul-01 ASSETS Current Assets Cash and Short Term Investments 15,862,304 51,998,607 9,198,226 Accounts Receivable - Net of Allowance 2,560,786
Fourth quarter results 2015
 1 Fourth quarter results 2015 11 February 2016 Peter A. Ruzicka, President & CEO Continued growth in the fourth quarter 4.1% organic growth 1 17% EBIT (adj.) 2 growth in BCG Full-year EPS doubled to NOK
First estimate for 2011 Euro area external trade deficit 7.7 bn euro bn euro deficit for EU27
 27/2012-15 February 2012 First estimate for 2011 Euro area external trade deficit 7.7 152.8 deficit for EU27 The first estimate for the euro area 1 (EA17) trade in goods balance with the rest of the world
Multi Asset Indices Selection and Rebalance Dates
 30 Jan 2017 DBIQ Index Selection Report Multi Asset Indices Selection and Rebalance Dates The report is designed to provide the details of future selection and rebalance dates of various Multi-Asset Indices
August 2012 Euro area international trade in goods surplus of 6.6 bn euro 12.6 bn euro deficit for EU27
 146/2012-16 October 2012 August 2012 Euro area international trade in goods surplus of 6.6 12.6 deficit for EU27 The first estimate for the euro area 1 (EA17) trade in goods balance with the rest of the
The Cyprus Economy: from Recovery to Sustainable Growth. Vincenzo Guzzo Resident Representative in Cyprus
 The Economy: from Recovery to Sustainable Growth Vincenzo Guzzo Resident Representative in Growth momentum remains strong 18 : Real GDP ( billion) 1 Deviation from Pre-Crisis Level and Trend (Percent)
Huhtamaki roadshow presentation. Investor Relations Copenhagen Jan 8, 2010
 Huhtamaki roadshow presentation Investor Relations Copenhagen Jan 8, 2010 Huhtamaki in brief A leading manufacturer of consumer and specialty packaging with head office in Espoo, Finland Net sales EUR
June 2012 Euro area international trade in goods surplus of 14.9 bn euro 0.4 bn euro surplus for EU27
 121/2012-17 August 2012 June 2012 Euro area international trade in goods surplus of 14.9 0.4 surplus for EU27 The first estimate for the euro area 1 (EA17) trade in goods balance with the rest of the world
INVESTMENT MARKET UPDATE UBC FACULTY PENSION PLAN
 INVESTMENT MARKET UPDATE UBC FACULTY PENSION PLAN MIKE LESLIE, FACULTY PENSION PLAN NEIL WATSON, LEITH WHEELER FEBRUARY 12, 2014 Presenters Mike Leslie Executive Director, Investments Faculty Pension Plan
Please scroll to find the 2018 and 2019 global fund holiday calendars.
 Please scroll to find the 2018 and 2019 global fund holiday calendars. 2018 Exchange-Traded fund holiday Vanguard Ireland-domiciled ETFs Jan Feb Mar Apr May Jun 1 2 5 12 15 25 9 12 14 15 16 19 28 20 29
Your Aquaculture Technology and Service Partner. Q Presentation Oslo - May 11 th, 2016 Trond Williksen, CEO Eirik Børve Monsen, CFO
 Q1 2016 Presentation Oslo - May 11 th, 2016 Trond Williksen, CEO Eirik Børve Monsen, CFO Agenda 1 Highlights 2 Financial performance 3 Outlook 4 Q&A Highlights Q1 2016 - by CEO Trond Williksen 3 MNOK On
Chart pack to council for cooperation on macroprudential policy
 Chart pack to council for cooperation on macroprudential policy Contents List of charts... 3 Macro and macro-financial setting... 5 Swedish macroeconomic setting... 5 Foreign macroeconomic setting... Macro-financial
Investor Information. Performance of Bayer Stock in 2012 [Graphic 2.1] Jan Feb Mar Apr May June July Aug Sept Oct Nov Dec
![Investor Information. Performance of Bayer Stock in 2012 [Graphic 2.1] Jan Feb Mar Apr May June July Aug Sept Oct Nov Dec](/thumbs/78/78106097.jpg "Investor Information. Performance of Bayer Stock in 2012 [Graphic 2.1] Jan Feb Mar Apr May June July Aug Sept Oct Nov Dec") 46 Performance of Bayer Stock in 2012 [Graphic 2.1] (indexed; 100 = Xetra closing price on December 31, 2011; source: Bloomberg) 160 150 140 130 120 110 100 90 80 Jan Feb Mar Apr May June July Aug Sept
46 Performance of Bayer Stock in 2012 [Graphic 2.1] (indexed; 100 = Xetra closing price on December 31, 2011; source: Bloomberg) 160 150 140 130 120 110 100 90 80 Jan Feb Mar Apr May June July Aug Sept
EMGS ASA FIRST QUARTER PRESENTATION 2012
 EMGS ASA FIRST QUARTER PRESENTATION 2012 CEO, Roar Bekker CFO, Svein Knudsen Hotel Continental, 16 May 2012 DISCLAIMER This quarterly presentation includes and is based, inter alia, on forward-looking
4 TH QUARTER 2018 RESULTS ANNOUNCEMENT. TOMRA SYSTEMS ASA 4 th Quarter Results
 4 TH QUARTER 2018 RESULTS ANNOUNCEMENT TOMRA SYSTEMS ASA 4 th Quarter Results 21.02.2019 HIGHLIGHTS FROM 2018 Revenues Gross margin Operating expenses EBITA Cashflow Revenues of 8,596 MNOK (7,432 MNOK
Interim Results for the 6 months to 30 September NOVEMBER 2010
 Interim Results for the 6 months to 30 September 2010 8 NOVEMBER 2010 Nick Robertson Introduction Strong H1 Retail sales up 50%, group revenues up 45% Strong UK and international retail sales, up 26% and
First Quarter 2017 April 19, qlirogroup.com
 First Quarter 2017 April 19, 2017 BUSINESS UPDATE Marcus Lindqvist, CEO 2 Increased Gross Profit and Credit Market Licence Highlights Strategy Focus 1. E-commerce gross profit increased 15 per cent to
FINANCIAL RESULTS AND COMPANY OVERVIEW Second-Quarter Performance
 FINANCIAL RESULTS AND COMPANY OVERVIEW 08 Second-Quarter Performance September 5 th, 08 Disclaimer Forward-Looking Statements and Preliminary Results This presentation includes forward-looking statements
Second estimate for the third quarter of 2008 EU27 current account deficit 39.5 bn euro 19.3 bn euro surplus on trade in services
 STAT/09/12 22 January 2009 Second estimate for the third quarter of 20 EU27 current account deficit 39.5 bn euro 19.3 bn euro surplus on trade in According to the latest revisions1, the EU272 external
Market and Economic Charts. Retail Fund Management Team Investec Asset Management
 Market and Economic Charts Retail Fund Management Team Investec Asset Management 30 April 2010 Looking at Markets Global SA Economics Major Index Performance Major Index Performance Market Drivers Inflation
Bayer Annual Report To our Stockholders Investor Information. Jan Feb Mar Apr May June July Aug Sep Oct Nov Dec
 Bayer Annual Report 2015 39 Performance of Bayer Stock in 2015 [Graphic 2.1] (Indexed; 100 = Xetra closing price on December 31, 2014; source: Bloomberg) 130 120 110 100 90 80 Jan Feb Mar Apr May June
DNB SICAV High Yield. Monthly report - March 2018
 Monthly report - March 2018 140 120 100 80 60 40 20 0 (Net) BCGAXJPXC9 (Gross) Nov-15 May-16 Nov-16 May-17 Nov-17 Key figures Fund Index YTM 5.8 1.8 Effective duration 0.9 6.7 Credit duration 3.2 1.5 Volatility
May 2012 Euro area international trade in goods surplus of 6.9 bn euro 3.8 bn euro deficit for EU27
 108/2012-16 July 2012 May 2012 Euro area international trade in goods surplus of 6.9 3.8 deficit for EU27 The first estimate for the euro area 1 (EA17) trade in goods balance with the rest of the world
Lindab Group presentation Q3 2010
 lindab group presentation Lindab Group presentation Q3 2010 David Brodetsky, CEO Nils-Johan Andersson, CFO Agenda Highlights Group Business Areas Strategy Trends and outlook Q & A 2 Lindab Group Highlights
January 2005 Euro-zone external trade deficit 2.2 bn euro 14.0 bn euro deficit for EU25
 42/2005-23 March 2005 January 2005 Euro-zone external trade deficit 2.2 14.0 deficit for EU25 The first estimate for euro-zone 1 trade with the rest of the world in January 2005 was a 2.2 billion euro
AUDITED RESULTS FOR THE YEAR ENDED 31 DECEMBER 2016
 AUDITED RESULTS FOR THE YEAR ENDED 31 DECEMBER 2016 AGENDA 2 1 Opening remarks / market update 2 Financial results 3 Operational review 4 Strategy update 5 Outlook 1 2 3 4 5 OPENING REMARKS / MARKET UPDATE
March 2005 Euro-zone external trade surplus 4.2 bn euro 6.5 bn euro deficit for EU25
 STAT/05/67 24 May 2005 March 2005 Euro-zone external trade surplus 4.2 6.5 deficit for EU25 The first estimate for euro-zone 1 trade with the rest of the world in March 2005 was a 4.2 billion euro surplus,
H & M HENNES & MAURITZ AB NINE-MONTH REPORT
 H & M HENNES & MAURITZ AB NINE-MONTH REPORT 1 December 2007 31 August 2008 Sales excluding VAT for the H&M Group for the first nine months of the financial year amounted to SEK 62,222 m (55,529), an increase
Q Presentation. Oslo November 2 nd 2018 Hallvard Muri, CEO Simon Nyquist Martinsen, CFO
 Q3 218 Presentation Oslo November 2 nd 218 Hallvard Muri, CEO Simon Nyquist Martinsen, CFO Agenda Highlights Financial performance Outlook Q&A Highlights Q3 218 by CEO Hallvard Muri Order Intake development
ENIRO Q3 REPORT Johan Lindgren, CEO Mattias Lundqvist, CFO Cecilia Lannebo, Head of IR
 ENIRO Q3 REPORT 2012-10-25 Johan Lindgren, CEO Mattias Lundqvist, CFO Cecilia Lannebo, Head of IR CEO INTRODUCTION & SUMMARY A digital media company with 74 percent of revenues being digital the transformation
INVESTMENT MARKET UPDATE UBC FACULTY PENSION PLAN
 INVESTMENT MARKET UPDATE UBC FACULTY PENSION PLAN MIKE LESLIE, FACULTY PENSION PLAN NEIL WATSON, LEITH WHEELER FEBRUARY 11, 2015 Presenters Mike Leslie Executive Director, Investments Faculty Pension Plan
Spheria Australian Smaller Companies Fund
 29-Jun-18 $ 2.7686 $ 2.7603 $ 2.7520 28-Jun-18 $ 2.7764 $ 2.7681 $ 2.7598 27-Jun-18 $ 2.7804 $ 2.7721 $ 2.7638 26-Jun-18 $ 2.7857 $ 2.7774 $ 2.7690 25-Jun-18 $ 2.7931 $ 2.7848 $ 2.7764 22-Jun-18 $ 2.7771
Hurtling Towards Financial Armageddon. Veneroso Associates April 18, 2018
 Hurtling Towards Financial Armageddon Veneroso Associates April 18, 2018 SocGen shows a doubling in net debt for the S&P 1500 ex financials Figure 1: US Corporate Net Debt Has Exploded and Exceeds Earnings
Annika Falkengren. President and CEO. Result presentation. January September 2010
 Annika Falkengren President and CEO Result presentation January September 2010 Highlights Income Seasonally slow quarter supported by diversified earnings Further improved asset quality Baltics back in
H & M HENNES & MAURITZ AB NINE-MONTH REPORT
 NINE-MONTH REPORT 2010 H & M HENNES & MAURITZ AB NINE-MONTH REPORT 1 December 2009 31 August 2010 NINE MONTHS The H&M Group s sales excluding VAT during the first nine months of the financial year amounted
August 8, 2006 Authorized for Public Release 148 of 158. Appendix 1: Materials used by Mr. Kos
 August 8, 6 Authorized for Public Release 148 of 158 Appendix 1: Materials used by Mr. Kos Class II -- Restricted FR Page 1 of 4 Realized Volatility of MSCI Equity Indices 35 25 15 5 22 August 8, 6 Authorized
Financial results briefing Q3/2015
 Financial results briefing Q3/2015 Jyri Luomakoski President and CEO Uponor Corporation Uponor, Inc. factory, Apple Valley, Minnesota, USA Q3/2015 market overview Nordics Construction activity in Sweden
Euro GC Pooling. Continues Dynamic Growth. Frankfurt, February 29, 2008
 Continues Dynamic Growth Frankfurt, February 29, 2008 Agenda Introduction Eurex Repo: Latest Development Euro GC Pooling: Overview and latest Development Outlook Page 2 Eurex Repo Development of Outstanding
Financial & Business Highlights For the Year Ended June 30, 2017
 Financial & Business Highlights For the Year Ended June, 17 17 16 15 14 13 12 Profit and Loss Account Operating Revenue 858 590 648 415 172 174 Investment gains net 5 162 909 825 322 516 Other 262 146
FINANCIAL RESULTS Q CFO Irene Egset 4 th May 2017
 FINANCIAL RESULTS Q1 2017 CFO Irene Egset 4 th May 2017 Health, safety and environment TRI-rate 1 10 8 6 4 2 0 2014 2015 2016 2017 Health and safety - Quarterly injuries rate is down in Q1 - Continuously
January 2014 Euro area international trade in goods surplus 0.9 bn euro 13.0 bn euro deficit for EU28
 STAT/14/41 18 March 2014 January 2014 Euro area international trade in goods surplus 0.9 13.0 deficit for EU28 The first estimate for the euro area 1 (EA18) trade in goods balance with the rest of the
Communication on the future of the CAP
 Communication on the future of the CAP The CAP towards 2020: meeting the food, natural resources and territorial challenges of the future Tassos Haniotis, Director Agricultural Policy Analysis and Perspectives
Huhtamaki roadshow presentation. Investor Relations Q1 2009
 Huhtamaki roadshow presentation Investor Relations 2009 Huhtamaki in brief A leading manufacturer of consumer and specialty packaging with head office in Espoo, Finland Net sales EUR 2.3 billion in 65
Electrocomponents 2017 half-year financial results. 18 November 2016
 Electrocomponents 2017 half-year financial results 18 November 2016 Agenda Overview of results Lindsley Ruth Financial results and performance update David Egan Performance Improvement Plan Lindsley Ruth
Outlook 2015: Europe & Germany
 Part of the M&G Group Outlook 215: Europe & Germany Research presentation 27 th November 214 European Economic Fundamentals Update & Outlook 2 Economic recovery broadening GDP growth by country Q3 214
Economic outlook. Address by Central Bank Governor Svein Gjedrem to invited foreign embassy representatives. Norges Bank 18 March 2004
 Economic outlook Address by Central Bank Governor Svein Gjedrem to invited foreign embassy representatives Norges Bank 1 March SG Diplomat 1.. Long-term interest rates Per cent 15 1 9 Norway US Germany
DnB NOR Group 1st half and 2nd quarter 2010 results. Bjørn Erik Næss, chief financial officer
 DnB NOR Group 1st half and 2nd quarter 2010 results Rune Bjerke, group chief executive Rune Bjerke, group chief executive Bjørn Erik Næss, chief financial officer 1st half and 2nd quarter 2010 Rising credit
Performance Summary. Copyright 2018 Harmonic Drive Systems Inc.
 Performance Summary 2 1st-half consolidated results (versus original forecasts for the period) Original forecasts (announced May 11) 1st-half FY ending Mar.31,2019 Vs. original forecasts for the period
January 2009 Euro area external trade deficit 10.5 bn euro 26.3 bn euro deficit for EU27
 STAT/09/40 23 March 2009 January 2009 Euro area external trade deficit 10.5 26.3 deficit for EU27 The first estimate for the euro area 1 (EA16) trade balance with the rest of the world in January 2009
Citi 2016 Global Energy & Utilities Conference, Boston
 Citi 2016 Global Energy & Utilities Conference, Boston Will Ashby VP HR & Communication May 11 th, 2016 Forward-Looking Statements All statements in this presentation other than statements of historical
Q presentation. 19 November 2015
 Q3 2015 presentation 19 November 2015 1 Today s presenters Axel Hjärne Chief Executive Officer Gert Sköld Chief Financial Officer 2 Eltel in brief Q3 2015 business performance Q3 2015 financials Market
Holdings Report. Fund Name:- Northern Trust Global Funds plc - The Dollar Fund Reporting Currency:- USD Statement Date: - 22-NOV-2017
 Fund Name:- Northern Trust Global Funds plc - The Dollar Fund Reporting Currency:- USD Statement Date: - 22-NOV-2017 Holdings Report Security Description Security Type Settlement Date Maturity Date Current
2018 MACRO OVERVIEW. More of the Same, Yet Less of the Same. March 9, 2018
 2018 MACRO OVERVIEW More of the Same, Yet Less of the Same March 9, 2018 RICHARD FARR MERION CAPITAL GROUP 484-436-4764 rfarr@merioncapitalgroup.com Jan-04 Oct-04 Jul-05 Apr-06 Jan-07 Oct-07 Jul-08 Apr-09
FY2018 Third Quarter Results
 FY Third Quarter Results Yushin Soga Director and Executive Officer November 14, * Please be reminded that the figures shown in this presentation may be different from those shown in the financial statements
DnB NOR Norway and beyond
 DnB NOR 2008-2010 Norway and beyond Presentation by Rune Bjerke, group chief executive Capital Markets Day, 9 October 2007 DnB NOR has a strong track record Development in pre-tax operating profit before
Business & Financial Services December 2017
 Business & Financial Services December 217 Completed Procurement Transactions by Month 2 4 175 15 125 1 75 5 2 1 Business Days to Complete 25 Jan Feb Mar Apr May Jun Jul Aug Sep Oct Nov Dec 217 Procurement
Performance Report October 2018
 Structured Investments Indicative Report October 2018 This report illustrates the indicative performance of all Structured Investment Strategies from inception to 31 October 2018 Matured Investment Strategies
Fourth Quarter 2017 Earnings Conference Call. November 7, 2017
 Fourth Quarter 2017 Earnings Conference Call November 7, 2017 Safe Harbor Statement Our commentary and responses to your questions may contain forward-looking statements, including our outlook for the
Travel Insurance and Assistance
 Travel Insurance and Assistance Worldwide research covering over 40 countries Series Prospectus Finaccord 1 Prospectus contents Page What is the research? Which countries are covered What methodology has
VINX 30 Index. More information about the Index can be found at
 VINX 30 Index The VINX 30 Index is the leading share index of the Nordic Exchanges and the Oslo exchange. The index consists of the 30 largest and most actively traded shares listed on NASDAQ OMX Nordic
June 2014 Euro area international trade in goods surplus 16.8 bn 2.9 bn surplus for EU28
 127/2014-18 August 2014 June 2014 Euro area international trade in goods surplus 16.8 bn 2.9 bn surplus for EU28 The first estimate for the euro area 1 (EA18) trade in goods balance with the rest of the
GLOBAL MARKET OUTLOOK
 GLOBAL MARKET OUTLOOK Max Darnell, Managing Partner, Chief Investment Officer All material has been obtained from sources believed to be reliable, but its accuracy is not guaranteed. performance is no
NASDAQ Global Index. More information about the Index can be found at
 NASDAQ Global Index The NASDAQ Global Index is a float adjusted market capitalization-weighted index designed to track the performance of global equities covering over 98% of the entire listed market capitalization
August 2005 Euro-zone external trade deficit 2.6 bn euro 14.2 bn euro deficit for EU25
 STAT/05/132 20 October 2005 August 2005 Euro-zone external trade deficit 2.6 14.2 deficit for EU25 The first estimate for euro-zone 1 trade with the rest of the world in August 2005 was a 2.6 billion euro
MULTI-ASSET CLASS 1 EQUITIES: DEVELOPED COUNTRIES 1 EQUITY EMERGING COUNTRIES 2
 10 2 3 6 8 9 13 14 MULTI-ASSET CLASS 1 EQUITIES: DEVELOPED COUNTRIES 1 EQUITY EMERGING COUNTRIES 2 Alpha Current Previous Alpha Current Previous Alpha Current Previous weight weight weight weight weight
Investor Presentation. Result presentation. January September 2010
 Investor Presentation Result presentation January September 2010 Highlights Income Seasonally slow quarter supported by diversified earnings Further improved asset quality Baltics back in black Profit