Another strong quarter for TOMRA
|
|
|
- Edwin Marshall
- 5 years ago
- Views:
Transcription
1
2 Another strong quarter for TOMRA Strong overall performance Revenues of 1,068 MNOK (+67 percent vs. 641 MNOK in third quarter 2005) Operating profit of 194 MNOK (71 MNOK in third quarter 2005) Cash flow from operations of 121 MNOK (66 MNOK in second quarter 2005) Performance in TOMRA excluding Germany is very good 12 percent growth in revenues versus third quarter last year, 14 percent YTD Gross margin remains stable Opex has decreased versus last year despite several new initiatives Change in capital structure Bank loan agreement for 500 MNOK 3.5 million shares acquired under current buyback program (3.0 million in 3Q) Extraordinary General Meeting to obtain authorization to buy back another 10 million shares when current program has been completed 1
3 Financial highlights Profit and loss statement (IFRS continued operations*) Figures in NOK million 3Q Q 2005 YTD 2006 YTD 2005 Revenues Collection Technology Materials Handling Industrial Processing Technology Development initiatives Gross contribution Gross margin % Operating expenses Operating profit Operating margin % % 71 11% % % % 54 3% Excluding 2005 restructuring charges Gross contribution Gross contribution margin Operating expenses Operating profit Operating profit margin % % % % % % % % * Brazilian operations discontinued in August
4 Financial highlights - Balance sheet and capital structure Figures in NOK million 30 Sep 2006 ASSETS 3,269 Intangible assets Leasing equipment Sep 2005 Other fixed assets Inventory Short-term receivables Cash and cash equivalents 3, , Working capital still high due to high inventory of finished goods and significant short-term receivables in Germany Cash balance negatively impacted by 123 MNOK in share buybacks during third quarter TOMRA will take on a 500 MNOK bank loan in order to change the capital structure of the company TOMRA currently has a buyback program in place to acquire 10 million shares, 3.5 million shares have already been acquired When 10 million shares have been acquired, TOMRA will ask the AGM for a new authorization to buy back another 10 million shares The shares acquired under the new proxy will be deleted at a later stage if not used in connection with M&A 3
5 4
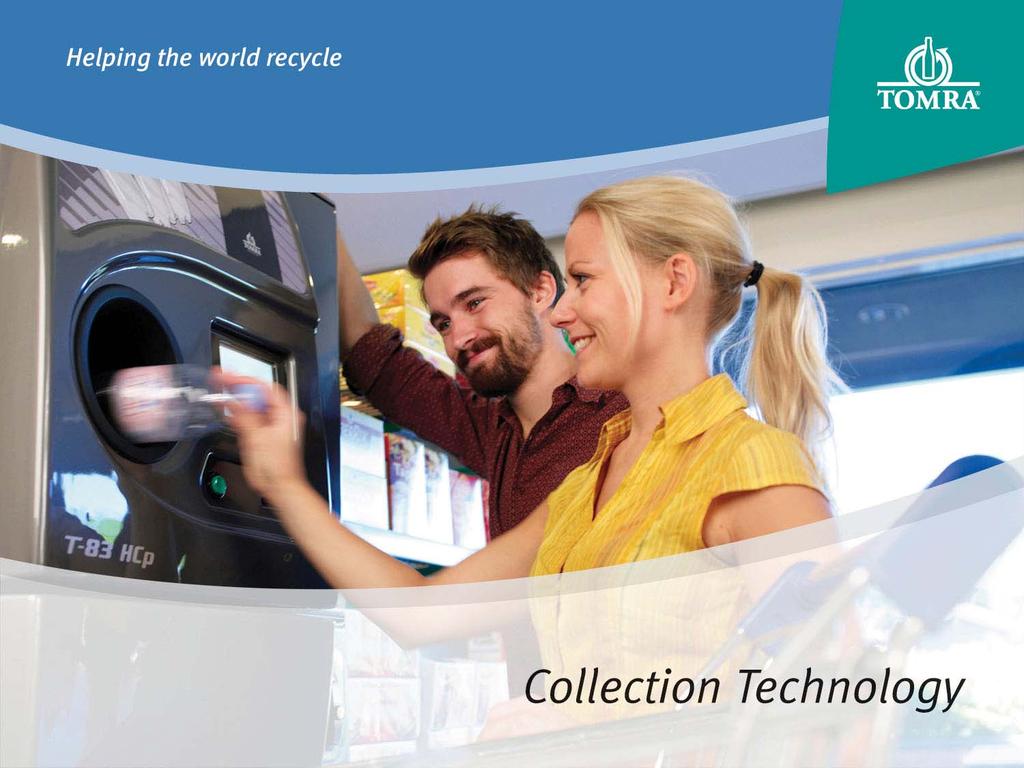
6 Collection Technology Financials Figures in NOK million 3Q Q 2005 YTD 2006 YTD 2005 Revenues Nordic Central Europe & UK US East/Canada Gross contribution in % % % % % Operating expenses Operating profit in % % 40 13% % 51 6% Excluding 2005 restructuring charges Gross contribution Gross contribution margin Operating expenses Operating profit Operating profit margin % % % % % % % % 5
7 Collection Technology Highlights Europe North America Revenues of 541 MNOK in 3Q 2006, up 169% versus last year ~2,150 machines sold and ~150 machines upgraded in Germany Europe ex. Germany down ~2% versus last year (strong sales in Denmark and Holland last year) Orders for ~200 RVMs received in Germany during 3Q 2006 Single order for 80 new machines in Norway, 60 to be delivered in 4Q06/1Q07 Service revenues from mature markets up versus last year, e.g., 7% YTD in the Nordic region and 15% in Western Europe Revenues of 16.4 MUSD in third quarter, up 9% versus last year; YTD revenues up 4% measured in USD, 5% measured in NOK Revenues are up versus last year due to favorable machine placements and mix effects, partly offset by a 7% decline in container volumes due to a shift in consumption from deposit containers (beer/carbonated soft drinks) to non-deposit containers (bottled water) Dialogue & legislative debate for potential expansion to include noncarbonated drinks in the bottle bills in New York and Connecticut 6
8 Order situation in Germany Order situation in Germany Number of machines ordered 9, ,800 7,200 17,000 ESTIMATES Orders for 8,200 new machines and 1,600 upgrades have been placed with TOMRA so far Some new orders in 3Q, e.g., TOOM and other REWE stores Acc. TOMRA order intake per 2Q 2006 Tomra order intake in 3Q 2006 Acc. TOMRA order intake per 3Q 2006 Acc. order intake by competitors* Total orders from Germany Accumulated orders to competitors have increased versus 2Q as Sielaff and Trautwein installations are now also included in figures Ongoing discussions with big retail groups for new orders machine deliveries most likely in 2007 * Based on publicly announced orders and TOMRA estimates 7
9 Recognition of revenues from Germany Revenue recognition of TOMRA s orders Number of machines 4Q05 ~ 100 ESTIMATES 2,150 new machines installed and 150 existing machines upgraded in 3Q 1Q06 2Q06 3Q06 4Q06 ~ 2,000 ~ 3,000 ~ 2,300 ~ 1, installations scheduled for 4Q 2006 will be pushed into 2007 on the request of customers, not as a result of capacity problems in TOMRA 2007 ~ 1,100 TOTAL ~ 9,800 Of the 2,400 machines yet to be installed, ~350 are upgrades 8
10 PET opportunity in Finland Special tax/levy on non-refillable plastic bottles will disappear from 1 january 2008 The requirement is that a proper take-back system for these containers is established, e.g., that the containers are included in the deposit system TOMRA foresees several opportunities related to this change if PET becomes a part of the Finnish deposit system: Replacement of old machines with vertical infeed (~1,000) Replacement and upgrades of T-6x0 machines (~1,000) New backroom solutions 9
11 10
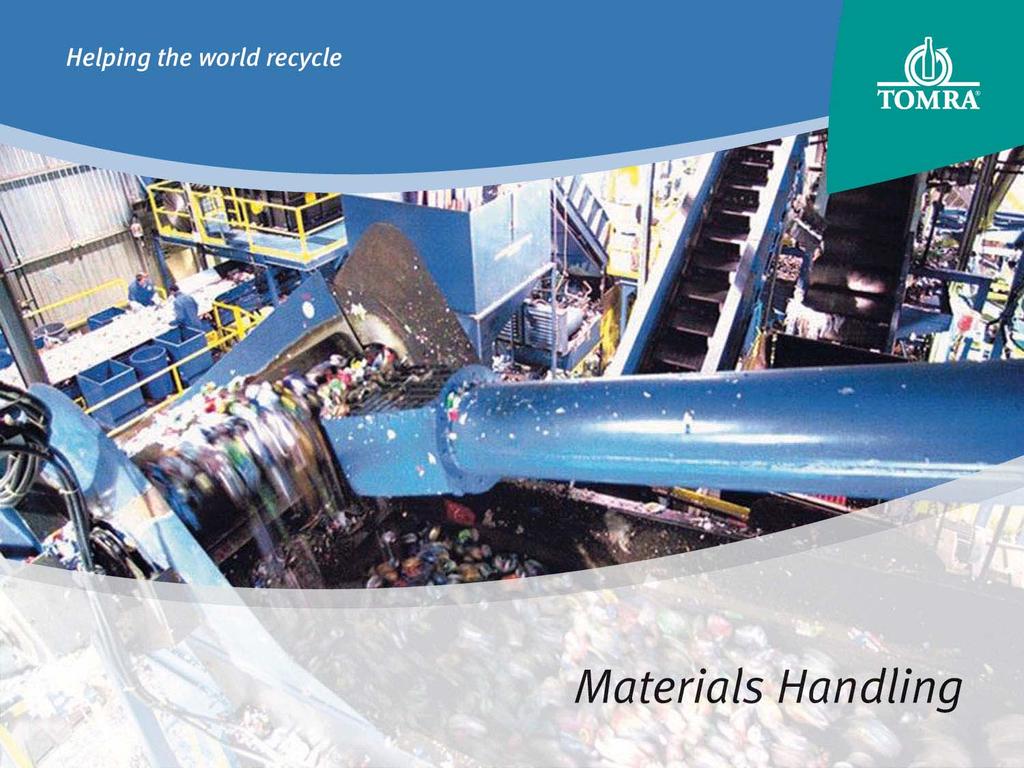
12 Materials Handling Financials Figures in NOK million 3Q Q 2005 YTD 2006 YTD 2005 Revenues US East/Canada US West (California) Gross contribution in % 72 24% 65 26% % % Operating expenses Operating profit in % 42 14% 32 13% 75 10% 60 9% 11


13 Materials Handling Highlights US East/ Canada Revenues of 22.6 MUSD, up 2% versus last year; YTD revenues up 4% measured in USD, 5% in NOK Revenues are up despite a 6% decline in container volumes due to improved material marketing and PET processing activities in Canada US West/ California Revenues of 24.0 MUSD, up 47% versus last year; YTD revenues up 31% measured in USD, 32% in NOK Growth in third quarter driven by 14% container volume growth, third party processing volume growth and attractive commodity prices 12
14 Change in deposit legislation in California Development in recycling rates in California Percent of sold containers Aluminum All* Glass PET Value of deposit increased from 2.5 and 5 cents to 4 and 8 cents California has an ambition to recycle 70% of all beverage containers sold To get to 70% recycling rates, the state of California has decided to increase the redemption value from 4/8 cents to 5/10 cents from 1 January 2007 Increased volumes will have a positive impact on TOMRA s operations * Includes aluminum, glass, PET and other metals and plastic materials Source: State of California Resources Agency 13
15 14
16 Industrial Processing Technology Financials Figures in NOK million 3Q Q 2005* YTD 2006 YTD 2005* Revenues Nordic Central Europe & UK Rest of Europe 27 US/Canada Rest of World Gross contribution in % 63 50% 45 47% % % Operating expenses Operating profit in % 20 16% 15 16% 55 16% 18 7% Excluding 2005 restructuring charges Gross contribution Gross contribution margin Operating expenses Operating profit Operating profit margin 63 50% % 45 47% % % % % % * Not including CommoDaS, which was included as of 1 July


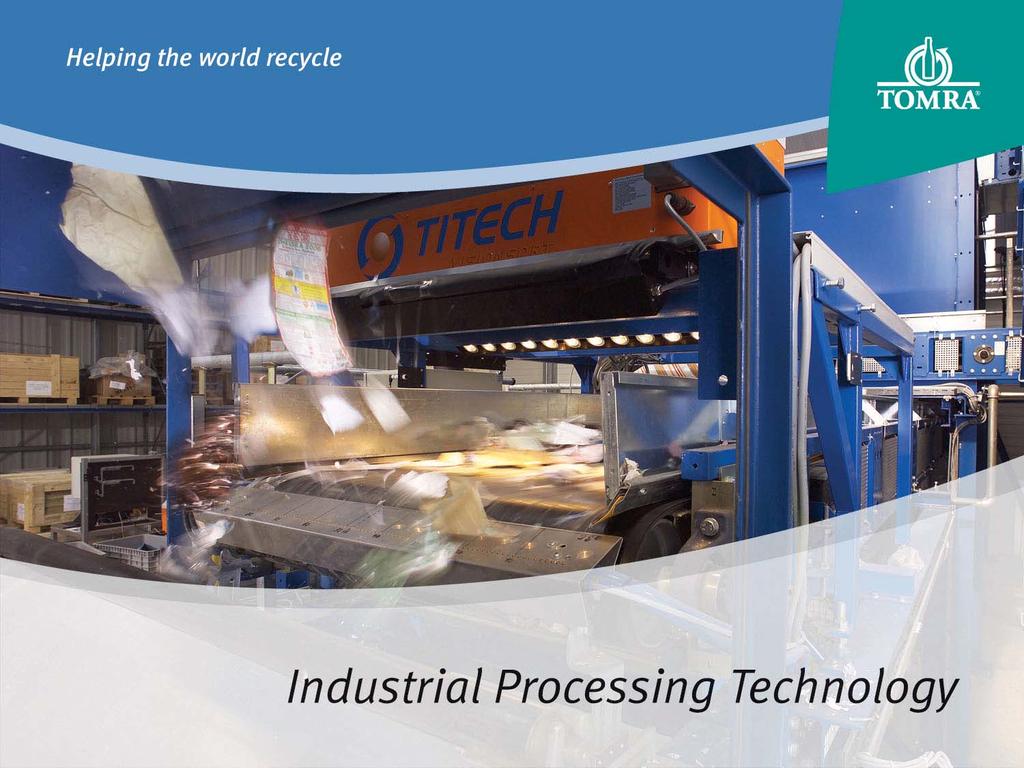
17 Industrial Processing Technology Highlights Recognition & sorting Volume reduction Continued profitable growth in TiTech Year-to-date revenues up 54% versus last year Record order backlog CommoDaS with positive contribution Positive sales development and sound order backlog Healthy profit margin Highest order backlog in 3 years Year-to-date revenues up 7% versus last year Positive contribution to operating profits 16
18 Industrial Processing Technology - Order book Order book value* NOK million ** Q03 2Q03 3Q03 4Q03 1Q04 2Q04 3Q04 4Q04 1Q05 2Q05 3Q05 4Q05 1Q06 2Q06 3Q06 * Based on currency rates as of 30 September 2006 ** Includes ~25 MNOK from CommoDaS 17

19 18


20 Development initiatives Status update UK Installation sites defined Production of centers initiated First center to be installed in October/ November Japan 27 RVMs in 6 wards in Tokyo now installed (~125 in total in Japan) Several machines to be installed in fourth quarter this year On average each machine in Tokyo collects close to 700 units per day Greece First recycling centers opened in Athens in August by TOMRA s partner Remaining centres will follow Q and in Q1/Q
21 Capital Markets Day in Oslo 9 November to provide more details on non-deposit opportunities NFF (The Norwegian Society of Financial Analysts) will host a capital markets day for TOMRA on 9 November 2006 Time: Thursday 9 November, 09:00-12:30 (breakfast served from 08:30) Location: Felix Konferansesenter, Aker Brygge, Oslo, Norway Subject: Presenters: Moderators: Registration: More information: Growth in non-deposit markets Amund Skarholt, CEO Trond K. Johannessen, SVP Business Development Terje Hanserud, SVP Rune Marthinussen, Managing Director TiTech Visionsort Håkon Volldal, VP Investor Relations & Business Development Ketil Skjåk, Enskilda Securities Merete Opedal, Portfolio manager, AFA, Storebrand Kapitalforvaltning By 8 November 2006 to NFF 20
22 21
23 Sales to Germany in the short term There are approximately 13,000 machines left to be awarded before end of 2008 The total market is estimated to be 30,000 machines 17,000 machines have been ordered so far The split of orders between 2007 and 2008 is difficult to predict Ongoing tests with new customers timing unknown Additional volumes from existing customers timing unknown Upgrades/replacement of refillable machines a key priority for 2007 Actual TOMRA sales will depend on market share and timing of orders, but it will be challenging to match 2006 volumes in
24 TOMRA has several big growth opportunities INITIAL TESCO ROLL OUT DRS COMPACTORS IN DENMARK INDICATIVE & ILLUSTRATIVE High probability INCREASING SERVICE REVENUES (CORE+GERMANY) EXPANDED DEPOSIT LEGISLATION IN FINLAND STRONG DEMAND FOR IPT SOLUTIONS BROADER APPLICATION OF IPT SOLUTIONS HIGH VOLUME AVAILABLE WITHIN CALIFORNIAN INFRASTRUCTURE EXPANDED TESCO ROLL OUT Medium probability JAPAN ROLL OUT NON-DEPOSIT/TRC LIKE SOLUTIONS NEW COUNTRIES (NORDIC RETAIL CONSOLIDATION) RVM REPLACEMENT Political decisions... DEPOSIT WATER NY/CT DEPOSIT INITIATIVES HOLLAND/AUSTRALIA/US/EASTERN EUROPE DEPOSIT IN NEW COUNTRIES/STATES
25 As a result of the many growth opportunities, the base business is expected to continue to develop very favorably YTD 06 vs. YTD 05 (ex. Germany) 2007 and onwards (ex. Germany) Revenues 14% growth >10% growth Gross margin Stable Stable Opex Reduced 4-8% increase EBIT ~40% increase 15-25% increase 24
26 TOMRA s growth aspiration Conceptual EBIT development for TOMRA not scaled MNOK Surplus EBIT from sale of RVMs to Germany Future development dependent on German volumes and timing of orders INDICATIVE & ILLUSTRATIVE With Germany TOMRA s profits declined from ~450 MNOK in 2000 to ~200 MNOK in 2005 Base business Significant growth expected: 15-25% annual EBIT growth
27 Summing up TOMRA s growth strategy TOMRA has a solid and diversified portfolio of growth opportunities within current strategic scope Growth is now less dependent on introduction of deposit and certain legislative frameworks than in the past TOMRA s focus will be on nurturing the base business in order to achieve strong organic growth and create operational leverage There will still be markets that decide to introduce deposit as the optimal recycling mechanism, and this will create surplus revenue and profit growth for TOMRA in certain periods 26
28
29 Addendum slide - Major shareholders* 1. Folketrygdfondet % 2. Orkla ASA % 3. State Street Bank & Client Omnibus D % 4. Danske Bank A/S % 5. Clearstream Banking CID Dept, Frankfurt % 6. Tomra Systems ASA % 7. Vital Forsikring ASA, DnB NOR Kapitalforvaltning % 8. JP Morgan Chase Bank Clients Treaty Account % 9. Skagen Vekst % 10. Morgan Stanley & Co. Client Equity Account % SUB-TOTAL % Other shareholders % TOTAL (13,960 shareholders) % Total foreign ownership % *Registered 30 September
30 Addendum slide - Shareholders by nationality 1. Norway 64.5% Great Britain 11.9% USA 6.3% Denmark 4.6% Luxembourg 3.9% Sweden 2.0% Switzerland 1.2% France 0.8% Holland 0.8% Germany 0.6% 92 TOTAL 96.7% *Registered 30 September
Financial highlights Profit and loss statement
 First Quarter 2007 Financial highlights Profit and loss statement Figures in NOK million Revenues Collection Technology, Deposit Solutions Materials Handling Industrial Processing Technology Collection
Financial highlights Profit and loss statement
 Second Quarter 2007 Financial highlights Profit and loss statement Figures in NOK million 2Q 2007 2Q 2006 YTD 2007 YTD 2006 Revenues 887 1020 1681 1843 Collection Technology, Deposit Solutions 430 656
Financial highlights Profit and loss statement
 Third Quarter 2007 Financial highlights Profit and loss statement Figures in NOK million 3Q 2007 3Q 2006 YTD 2007 YTD 2006 Revenues 861 1068 2542 2911 Collection Technology, Deposit Solutions 426 645 1228
Third Quarter
 Third Quarter 2005 0 Financial highlights NOK million 3Q 05 3Q 04 YTD 05 YTD 04 Revenues 701 665 1987 1849 RVM Technology 299 303 827 922 Collection & Materials Handling 247 237 647 632 Recycling Technology
Checklist 2005 Q404 Q105 Q205 Q305
 FY 20 0 Checklist 20 To-do list 20 Status Q404 Q1 Q2 Q3 Integrate TiTech and Orwak Group into TOMRA Successfully complete pilots in the UK and Japan Execute on German opportunity Revitalize and achieve
Second Quarter
 Second Quarter 2005 0 Financial highlights NOK million 2Q 05 2Q 04 YTD 05 YTD 04 Revenue 687 591 1,286 1,184 RVM Technology 278 301 528 619 Collection & Materials Handling 213 206 400 395 Recycling Technology
Third Quarter October 2008
 Third Quarter 2008 15 October 2008 Financial Highlights g Profit and loss statement Figures in NOK million 3Q 2008 3Q 2007 YTD 2008 YTD 2007 Revenues 881 861 2546 2542 Collection Technology, Deposit Solutions
FOURTH QUARTER Highlights from fourth quarter 2006 include: Strong cash flow from operations of 254 MNOK (131 MNOK in fourth quarter 2005)
") FOURTH QUARTER 2006 Highlights from fourth quarter 2006 include: Revenues of 1,054 MNOK (+56 percent relative to 675 MNOK in fourth quarter 2005) Operating profit of 135 MNOK (79 MNOK in fourth quarter
FOURTH QUARTER 2006 Highlights from fourth quarter 2006 include: Revenues of 1,054 MNOK (+56 percent relative to 675 MNOK in fourth quarter 2005) Operating profit of 135 MNOK (79 MNOK in fourth quarter
THIRD QUARTER Highlights from third quarter 2005 include: Operating profit of 79 MNOK before restructuring charges (83 MNOK last year)
") THIRD QUARTER 2005 Highlights from third quarter 2005 include: Revenues of 701 MNOK (+5% percent relative to third quarter 2004) Operating profit of 79 MNOK before restructuring charges (83 MNOK last year)
THIRD QUARTER 2005 Highlights from third quarter 2005 include: Revenues of 701 MNOK (+5% percent relative to third quarter 2004) Operating profit of 79 MNOK before restructuring charges (83 MNOK last year)
FOURTH QUARTER Highlights from fourth quarter 2008 include:
 FOURTH QUARTER 2008 Highlights from fourth quarter 2008 include: Revenues of 1076 MNOK (947 MNOK in fourth quarter 2007). Positive currency impact by 18% Operating profit of 136 MNOK (131 MNOK in fourth
THIRD QUARTER Strong performance in Collection Technology Deposit. Improved performance and outlook in Industrial Processing Technology
 THIRD QUARTER 2009 Highlights from third quarter 2009 include: Strong performance in Collection Technology Deposit Improved performance and outlook in Industrial Processing Technology California negatively
FOURTH QUARTER Solid performance in Collection Technology. Continued improved performance and order inflow in Industrial Processing Technology
 FOURTH QUARTER 2009 Highlights from fourth quarter 2009: Solid performance in Collection Continued improved performance and order inflow in Industrial Processing California adversely affected by reduced
Financial highlights - 2nd quarter 2002
 Second Quarter 2002 Financial highlights - 2nd quarter 2002 Revenues from continuing operations 670 MNOK, up 4%! Europe 258 MNOK, up 14%! North America 323 MNOK, down 3%! South America 89 MNOK, up 3% 14%
Fourth Quarter 2010 Results
 Fourth Quarter 2010 Results 18 February 2011 1 Highlights from the quarter include Improved Group performance: Revenues up 9% (local currencies) Gross margin 41%, up from 33% (or up from 35% adjusted for
2 ND QUARTER 2013 RESULTS ANNOUNCEMENT
 2 ND QUARTER 2013 RESULTS ANNOUNCEMENT TOMRA SYSTEMS ASA 18th of July 2013 HIGHLIGHTS FROM THE QUARTER INCLUDE Revenues Gross margin Revenues of 1,177 MNOK (948 MNOK in second quarter 2012). Organic, currency
SECOND QUARTER and FIRST HALF 2012
 SECOND QUARTER and FIRST HALF 2012 Highlights from second quarter 2012 include: Revenues of 948 MNOK (952 MNOK in second quarter 2011) Unchanged in local currencies +4% in Sorting Solutions - 2% in Collection
Third Quarter 2001 initials/subject/1
 Third Quarter 2001 Tomra Group 3rd Quarter 2001 NOKm Cont. Disc. Total Operating revenues 697 87 784 Cost of goods sold 408 99 507 Gross contribution 289 (12) 277 Operating expenses 176 4 180 Operating
Contents. Key Figures
 Annual Report 2007 Contents Key Figures INTRODUCTION 3 Key Figures 4 CEO Letter 6 Group Management 7 Group Structure BUSINESS BACKGROUND 8 Industry Perspective 10 Business Strategy & Goals 12 TOMRA in
4 TH QUARTER 2018 RESULTS ANNOUNCEMENT. TOMRA SYSTEMS ASA 4 th Quarter Results
 4 TH QUARTER 2018 RESULTS ANNOUNCEMENT TOMRA SYSTEMS ASA 4 th Quarter Results 21.02.2019 HIGHLIGHTS FROM 2018 Revenues Gross margin Operating expenses EBITA Cashflow Revenues of 8,596 MNOK (7,432 MNOK
Your Aquaculture Technology and Service Partner. Q Presentation Oslo - August 17 th, 2016 Trond Williksen, CEO Eirik Børve Monsen, CFO
 Q2 2016 Presentation Oslo - August 17 th, 2016 Trond Williksen, CEO Eirik Børve Monsen, CFO Agenda 1 Highlights 2 Financial performance 3 Outlook 4 Q&A Highlights Q2 2016 - by CEO Trond Williksen 3 Improved
Shareholder information
 SHAREHOLDER INFORMATION Index 107 07: Shareholder information Share price development in 2010 NOK 65 60 55 50 45 40 35 30 25 Jan. Feb. Mar. Apr. May Jun. Jul. Aug. Sept. Oct. Nov. Dec. Hydro Oslo Børs
Shareholder information
 SHAREHOLDER INFORMATION Index 89 06: Shareholder information Share price development in 2009 NOK NOK 60 50 40 30 20 10 0 Jan. Feb. Mar. Apr. May Jun. Jul. Aug. Sept. Oct. Nov. Dec. Introduction p.90 Dividend
2 ND QUARTER 2017 RESULTS ANNOUNCEMENT
 2 ND QUARTER 2017 RESULTS ANNOUNCEMENT TOMRA SYSTEMS ASA 2 nd Quarter Results 19.07.2017 HIGHLIGHTS FROM THE QUARTER Revenues Gross margin Operating expenses EBITA Cashflow TOMRA Collection TOMRA Sorting
Shareholder information
 SHAREHOLDER INFORMATION Index 115 05: Shareholder information Share price development in 2011 NOK 55 50 45 40 35 30 25 20 Jan. Feb. Mar. Apr. May Jun. Jul. Aug. Sept. Oct. Nov. Dec. Introduction p.116
4 TH QUARTER RESULTS Kenneth Ragnvaldsen, CEO February 1, 2013, Oslo
 Q4 4 TH QUARTER RESULTS 2012 Kenneth Ragnvaldsen, CEO February 1, 2013, Oslo AGENDA Financial status Business update Outlook Q&A HIGHLIGHTS Profitability continues to improve High activity. Strong order
Revenue growth of 15% compared to last year Q revenues up to NOK 251m from NOK 218m in Q3 2014
 Interim report Revenue growth of 15% compared to last year revenues up to NOK 251m from NOK 218m in Increased profitability Operating margin of 18% relative to 17% in EPS of NOK 0.08 compared to NOK 0.06
Oslo, February 27 th, 2012 Trond Williksen, CEO Eirik Børve Monsen, CFO
 Q4 2012 Presentation ti Oslo, February 27 th, 2012 Trond Williksen, CEO Eirik Børve Monsen, CFO 1 Agenda Highlights Q4 2012 Trond Williksen, CEO Financial performance Q4 20122 Eirik Børve Monsen, CFO Statement
SEB Enskilda Nordic Seminar 2010 Thursday, 7 January Long Term Performer High Performance Potential
 SEB Enskilda Nordic Seminar 2010 Thursday, 7 January 2010 Long Term Performer High Performance Potential Veidekke - A Scandinavian Contractor and Property Developer Contents About Veidekke Our Performance
Q presentation. 5 February 2015
 Q4 2014 presentation 5 February 2015 Agenda Highlights Financial overview Market outlook Q4 Highlights Strong finish to a record year Revenue of NOK 7 549 million, up 10.3% EBITDA* of NOK 396 million,
Your Aquaculture Technology and Service Partner. Q Presentation Oslo - February 19 th, 2016 Trond Williksen, CEO Eirik Børve Monsen, CFO
 Q4 2015 Presentation Oslo - February 19 th, 2016 Trond Williksen, CEO Eirik Børve Monsen, CFO Agenda 1 Highlights 2 Financial performance 3 Outlook 4 Q&A Highlights Q4 2015 - by CEO Trond Williksen 3 MNOK
Interim Report. 1st quarter 2009
 Interim Report 1st quarter 2009 Nordic Semiconductor ASA 1st quarter 2008 Revenue in the first quarter was 71.5, an increase of 12% over Q1 2008. EBITDA was 8.3 MNOK in the first quarter compared to 0.7
Six good reasons for choosing DNB in the new banking environment
 Six good reasons for choosing DNB in the new banking environment Bank of America Merrill Lynch, 18th Annual Banking & Insurance CEO Conference 2013 24 September, London Rune Bjerke, CEO of DNB 1 Reason
Your Aquaculture Technology and Service Partner. Q Presentation Oslo - May 11 th, 2016 Trond Williksen, CEO Eirik Børve Monsen, CFO
 Q1 2016 Presentation Oslo - May 11 th, 2016 Trond Williksen, CEO Eirik Børve Monsen, CFO Agenda 1 Highlights 2 Financial performance 3 Outlook 4 Q&A Highlights Q1 2016 - by CEO Trond Williksen 3 MNOK On
Contents. Key figures. Key Figures Directors Report Financial Statements Notes Directors Responsibility Statement...
 Annual Report 2009 Contents Key figures 2009 2008 2007 2006 2005 Key Figures... 3 Directors Report... 4 Financial Statements... 16 Notes... 25 Directors Responsibility Statement... 40 Auditor s Report...
HIGHLIGHTS INTERIM REPORT Q XXL ASA. YTD Growth. Q4 Growth
 INTERIM REPORT Q4 2017 XXL ASA HIGHLIGHTS Total revenues of NOK 2 525 million (NOK 2 151 million), up 17 per cent Like-for-like growth of 7 per cent EBITDA of NOK 332 million (NOK 286 million) Strong cash
Return on equity, ex. other items % Return on total assets, ex. other items %
 Annual Report 2008 Contents Key Figures INTRODUCTION 3 Key Figures 4 DIRECTORs REPORT 14 FINANCIAL STATEMENTS 23 NOTES 39 AUDITOR S REPORT (continued operations) (including discontinued operations) 2007
1 ST QUARTER RESULTS Kenneth Ragnvaldsen, CEO April 19, 2013, Oslo
 Q1 1 ST QUARTER RESULTS 2013 Kenneth Ragnvaldsen, CEO April 19, 2013, Oslo AGENDA Financial status Business update Outlook Q&A HIGHLIGHTS Profitability continues to improve. Positive development in Services.
TGS EARNINGS RELEASE 10 February 2011
 TGS EARNINGS RELEASE 10 February 2011 4 th QUARTER 2010 RESULTS 4 th QUARTER HIGHLIGHTS Consolidated net revenues were USD 177.6 million, an increase of 13% compared to Q4 2009. Net late sales totaled
DnB NOR Group 1st half and 2nd quarter 2010 results. Bjørn Erik Næss, chief financial officer
 DnB NOR Group 1st half and 2nd quarter 2010 results Rune Bjerke, group chief executive Rune Bjerke, group chief executive Bjørn Erik Næss, chief financial officer 1st half and 2nd quarter 2010 Rising credit
Interim report -10 % Q Norwegian Air Shuttle ASA third quarter Unit cost Incl depreciation excl fuel
 Interim report Norwegian Air Shuttle ASA third quarter 2018 Unit cost Incl depreciation excl fuel -10 % EBITDA excl other losses/(gains) of NOK 1,868 million (1,505) Unit cost incl depreciation excl fuel
Supplementary capital issue Investor presentation November 2013
 Supplementary capital issue Investor presentation November 2013 Disclaimer This Company Presentation has been produced by Bank Norwegian AS (the Company or BN ) exclusively for information purposes and
3Q 2018 Fornebu, October 24, 2018 Luis Araujo and Svein Stoknes
 3Q 2018 Fornebu, October 24, 2018 Luis Araujo and Svein Stoknes Agenda 3Q 2018 Answers Questions Introduction Luis Araujo Chief Executive Officer Financials Svein Stoknes Chief Financial Officer Q&A Session
Interim report 2nd quarter and first half year 2018
 Interim report 2nd quarter and first half year 2018 Solid growth and improved profitability Loan growth up 12% in the quarter to a net loan balance of NOK 3 212 million Net interest income of NOK 81.7million,
DnB NOR Norway and beyond
 DnB NOR 2008-2010 Norway and beyond Presentation by Rune Bjerke, group chief executive Capital Markets Day, 9 October 2007 DnB NOR has a strong track record Development in pre-tax operating profit before
Fourth quarter of 2010
 Fourth quarter of 2010 Main features of the fourth quarter of 2010 Operating revenue NOK 3,363 million, 2% organic growth EBITA before synergy costs NOK 171 million (NOK 283 million) Revenue growth and
Q Presentation. Oslo November 2 nd 2018 Hallvard Muri, CEO Simon Nyquist Martinsen, CFO
 Q3 218 Presentation Oslo November 2 nd 218 Hallvard Muri, CEO Simon Nyquist Martinsen, CFO Agenda Highlights Financial performance Outlook Q&A Highlights Q3 218 by CEO Hallvard Muri Order Intake development
Q PRESENTATION 7 FEBRUARY 2018
 Q4 2017 PRESENTATION 7 FEBRUARY 2018 Highlights Q4 2017 Record high revenue, operating profit, and cash flow from operations REVENUE of NOK 10.0 billion (up 10.1%) Change in currency rates positively impacts
Interim report 3rd quarter 2018
 Interim report 3rd quarter 2018 Continued growth and improved profitability Growth driven by geographical expansion o Net loan balance grew 7.4% to NOK 3 449 million, including transfer of loans in a forward
1st quarter
 1st quarter 01.01-31.03 Interim results for the Storebrand Group 1st quarter Main features Group result, which represents the shareholders share of operating profit, showed a loss of NOK 62 million in
Q Presentation Oslo, October 28, Trond Williksen, CEO
 Q3 2011 Presentation Oslo, October 28, 2011 Trond Williksen, CEO 1 Agenda Highlights Q3 2011 Financials Q3 2011 Outlooks Q & A 2 Highlights 3 Increased profitability Operating revenues in Q3 was 226.7
Norwegian Finans Holding ASA
 Norwegian Finans Holding ASA Fourth quarter 2017 results presentation Tine Wollebekk, CEO February 28, 2018 Pål Svenkerud, CFO Agenda 1. Performance and events 2. Fourth quarter 2017 results 3. Market
4Q 2018 Fornebu, February 8, 2019 Luis Araujo and Svein Stoknes
 4Q 2018 Fornebu, February 8, 2019 Luis Araujo and Svein Stoknes Agenda 4Q 2018 Answers Questions Introduction Luis Araujo Chief Executive Officer Financials Svein Stoknes Chief Financial Officer Q&A Session
Organic revenue growth 11.3%
 First quarter 2015 Operating revenues of NOK 414.8 million (NOK 363.4 million in Q1 2014), reflecting an increase of 14.1%, of which 11.3% was organic. EBITDA excluding special items was NOK 62.5 million
Summary published in connection to the admission to trading of shares in Telenor ASA on NASDAQ OMX Stockholm
 Summary published in connection to the admission to trading of shares in Telenor ASA on NASDAQ OMX Stockholm This report is entirely based on information available in Telenor ASA s (also referred to as
Third quarter report Quarterly report Nr
 Third quarter report 2011 Quarterly report Nr 3 2011 Highlights Operating revenues in Q3 was 226.7 MNOK compared to 212.3 in Q3 last year an increase of 6.8% EBITDA in Q3 was 22.0 MNOK compared to 10.2
Full year and Q4 results 2018
 Full year and Q4 results 2018 Cathrin Nylander, Acting CEO and CFO 14 February, 2019 Financial highlights Q4: Strong revenue growth Strong orders received MNOK 918 (940) EBIT margin 5.7% (6.5%) Excluding
Results for the Fourth Quarter ended 31 December 2017
 Results for the Fourth Quarter ended 31 December 2017 Athens, Greece, 25 April 2018 Frigoglass SAIC ( Frigoglass or we or the Group ) announces results for the quarter and full year ended 31 December 2017
Q Interim report
 Interim report Revenues of NOK 231m vs NOK 296m last year Challenging market conditions with few completed investment banking transactions, but pipeline building well EPS of NOK 0.06 compared to NOK 0.11
First quarter report 2012 Q 2012
 report 2012 Q 2012 page 2 FIRST QUARTER Contents Contents Financial review 3 Overview 3 Market developments and outlook 5 Additional factors impacting Hydro 7 Underlying EBIT 8 Items excluded from underlying
First quarter report 1
 report 1 2 FIRST QUARTER REPORT Contents Contents Financial review 3 Overview 3 Market developments and outlook 5 Additional factors impacting Hydro 7 Underlying EBIT 8 Finance 12 Tax 12 Items excluded
Results for the Third Quarter ended 30 September 2018
 Results for the Third Quarter ended 30 September 2018 Athens, Greece, 16 November 2018 Frigoglass SAIC ( Frigoglass or we or the Group ) announces results for the quarter and nine months ended 30 September
THIRD QUARTER RESULTS 2015
 AKASTOR ASA THIRD QUARTER RESULTS 2015 3Q Highlights EBITDA of NOK -169 million - EBITDA of NOK 177 million when adjusted for special items - Special items of NOK 346 million charged to EBITDA; mainly
contents Design & layout Cox Design
 2003 Annual Report Design & layout Cox Design Main photographer Damian Heinisch Others Annual Report Page 6-7: Terje Heiestad, Cox foto Page 8: Pow-Wow Studios, Christian Hatt & Rune Mæhre Page 9: Al Ferreira,
Norwegian Finans Holding ASA. Subordinated Bonds Issue September, 2016
 Norwegian Finans Holding ASA Subordinated Bonds Issue September, 2016 Disclaimer This Company Presentation has been produced by Bank Norwegian AS (the Company or BN ) exclusively for information purposes
PHOTOCURE ASA RESULTS FOR FIRST QUARTER MAY Kjetil Hestdal, MD, President & CEO Erik Dahl, CFO
 PHOTOCURE ASA RESULTS FOR FIRST QUARTER 2018 23 MAY 2018 Kjetil Hestdal, MD, President & CEO Erik Dahl, CFO DISCLAIMER The information included in this Presentation contains certain forward-looking statements
StrongPoint ASA Q Page 1
 StrongPoint ASA 2018 Page 1 StrongPoint ASA 2018 Page 2 Highlights first quarter Operating revenues o MNOK 250.1 (249.7) EBITDA o MNOK 11.5 (10.7) Cash flow from operational activities o MNOK - 6.3 (-
Can performance continue?
 Can performance continue? UBS 13 th Annual Nordic Financial Services Conference 2 September 21 CEO Rune Bjerke Strong pre-crisis position 35 3 25 2 15 1 5 3 25 2 15 1 5 2 4 Pre-crisis market capitalisation
Interim Report Q1 2014
 Interim Report 2014 revenues increased by 15% compared to last year Total revenues of NOK 256m vs. NOK 224m last year Operating costs of NOK 150m vs. NOK 141m last year Pre-bonus operating profit increased
PRESENTED BY CEO ØYVIND ISAKSEN AND CFO ROAR ØSTBØ (1)
") 68 PRESENTED BY CEO ØYVIND ISAKSEN AND CFO ROAR ØSTBØ (1) 21-10-10 AGENDA Q3-10 Highlights Key Figures Regional market update Financial review Outlook Q&A (2) 21-10-10 Q3-10 HIGHLIGHTS Changes in the Slovakia
68 PRESENTED BY CEO ØYVIND ISAKSEN AND CFO ROAR ØSTBØ (1) 21-10-10 AGENDA Q3-10 Highlights Key Figures Regional market update Financial review Outlook Q&A (2) 21-10-10 Q3-10 HIGHLIGHTS Changes in the Slovakia
HIGHLIGHTS INTERIM REPORT Q XXL ASA. Q1 Growth
 INTERIM REPORT Q1 2018 XXL ASA HIGHLIGHTS Total revenues of NOK 2 070 million (NOK 1 713 million), up 21 per cent E-commerce growth of 42 per cent EBITDA of NOK 51 million (NOK 34 million) Solid cash flow
Q Presentation Oslo, August 09, 2011
 Q2 2011 Presentation Oslo, August 09, 2011 Trond Williksen, CEO Morten Nærland, CFO 1 Agenda Highlights Q2 2011 Financials Q2 2011 Way forward Q & A 2 1 Highlights 3 Recovery continues Growth in operating
Q Interim presentation. 14 February 2018
 Interim presentation 14 February 2018 Highlights Revenues (NOKm) Operating margin % EPS basic (NOK) 391 231 350 242 420 312 297 271 403 26% 15% 24% 15% 27% 25% 23% 20% 28% 0.14 0.13 0.20 0.12 0.11 0.09
The Orkla Group. First quarter May 2003
 The Orkla Group First quarter 2003 8 May 2003 Agenda Highlights and key figures Currency translation effects Results by business area Cash flow statement and balance sheet 2 Highlights Q1-2003 Weak results
Cash flow from operations in the quarter of NOK 51.5 million
 Revenues of NOK 436.2 million, an increase of 5.1 %. EBITDA of NOK 46.1 million down from NOK 62.5 million. One-off costs for recruitment and severance of NOK 3.7 million taken in the quarter. EBITDA margin
Improved performance and growth continues
 Improved performance and growth continues Second quarter 2016 HIGHLIGHTS Overall good performance - 10.4% EBITDA margin Land based strengthen P&L and high order backlog becoming a significant part of AKVA
AKASTOR SECOND QUARTER AND HALF YEAR RESULTS Other Holdings
 Q2 AKASTOR SECOND QUARTER AND HALF YEAR RESULTS 2016 Other Holdings HIGHLIGHTS Weak market conditions continue across portfolio, but with more stable revenues in the quarter Net debt at NOK 5 427 million,
Refresco Gerber reports continued positive trend in results
 Press Release May 22, 2014 Refresco Gerber reports continued positive trend in results First quarter highlights We recorded a revenue of 459.0 million and volume of 1,352.8 million litres, an increase
Your Aquaculture Technology and Service Partner. Q Presentation Oslo - August 20 th, 2015 Trond Williksen, CEO Eirik Børve Monsen, CFO
 Q2 2015 Presentation Oslo - August 20 th, 2015 Trond Williksen, CEO Eirik Børve Monsen, CFO Agenda 1 Highlights 2 Financial performance 3 Outlook 4 Q&A Highlights Q2 2015 - by CEO Trond Williksen 3 Best
Your Aquaculture Technology and Service Partner. Q Presentation Oslo - May 8 th, 2015 Trond Williksen, CEO Eirik Børve Monsen, CFO
 Q1 2015 Presentation Oslo - May 8 th, 2015 Trond Williksen, CEO Eirik Børve Monsen, CFO Agenda 1 Highlights 2 Financial performance 3 Outlook 4 Q&A Highlights Q1 2015 - by CEO Trond Williksen 3 On track
INSR INSURANCE GROUP ASA INTERIM REPORT FIRST HALF AND SECOND QUARTER 2018
 INSR INSURANCE GROUP ASA INTERIM REPORT FIRST HALF AND SECOND QUARTER 2018 HIGHLIGHTS Insurance result impacted by long and hard winter Q2 Annualized volume growth 12.4% - low double digit growth target
Third quarter results 2018
 Third quarter results 2018 Kenneth Hamnes, Group CEO Sigmund Toth, CFO 16 November 2018 : Continued revenue growth for Wine and Distribution Amounts in NOK million 2017 2018 Operating Revenues EBITDA (adj.)
Strong quarter of NOK 403m in revenues brings full year revenues to NOK 1,283m vs NOK 1,243m last year (+3%)
") Interim report Strong quarter of NOK 403m in revenues brings full year revenues to NOK 1,283m vs NOK 1,243m last year (+3%) EPS of NOK 0.52 relative to NOK 0.45 in (NOK 0.18 for ) Proposed dividend of
Interim report Strong quarter of NOK 403m in revenues brings full year revenues to NOK 1,283m vs NOK 1,243m last year (+3%) EPS of NOK 0.52 relative to NOK 0.45 in (NOK 0.18 for ) Proposed dividend of
Interim Jan June/ 2005 results briefing
 Interim Jan June/ 2005 results briefing Helsinki, 4 August 2005 Market and business review Financial results Outlook Jan Lång, President and CEO Jyri Luomakoski, CFO and Deputy CEO Jan Lång Questions Interim
Q2 results July 2011 Jørgen Bredesen, CEO Björn Wigström, CFO
 Q2 results 2011 21 July 2011 Jørgen Bredesen, CEO Björn Wigström, CFO Positive profitability trend Financial highlights for Q2 Increase in activity level, revenue up by 1.2% vs Q2 2010. Strong recovery
OSLO BØRS TICKER: EVRY
 OSLO BØRS TICKER: EVRY Interim Report for Q4 2017 and preliminary full year 2017 Contents Financial Highlights 5 Key Figures and Financial Ratios 6 Group Performance 7 Business Area Performance 10 Condensed
DERIVATIVES, OSLO BØRS - OCTOBER 2012
 DERIVATIVES, OSLO BØRS - OCTOBER 2012 The OBX index fell slightly in October. The index decreased by 1.1% to 410.64 points. So far this year, the index is up 14.8%. The average number of contracts traded
Interim report -5% Q Norwegian Air Shuttle ASA first quarter Unit cost Incl depreciation excl fuel. UNIT COST incl depreciation excl f uel
 Interim report Norwegian Air Shuttle ASA first quarter 2018 Unit cost Incl depreciation excl fuel -5% EBITDA excl other losses/(gains) of NOK -1,850 million (-1,233) Unit cost incl depreciation excl fuel
Significant growth outside Norway
 Significant growth outside Norway Second quarter 2018 HIGHLIGHTS Continued good activity across all regions and segments Growth in revenue (17%), in particular by Americas and EME (Europe and Middle East)
Royal Unibrew A/S Danske Bank Markets Copenhagen Winter Seminar
 Royal Unibrew A/S Danske Bank Markets Copenhagen Winter Seminar by Henrik Brandt, President & CEO 5 December 2013 Royal Unibrew s goal is to be an efficient regional beverage player Focus on: Markets and
Norwegian Finans Holding ASA. First quarter 2016 results
 Norwegian Finans Holding ASA First quarter 2016 results First quarter 2016 earnings were 164.9 MNOK, compared with 229.7 MNOK in the fourth quarter Norwegian Finans Holding Group MNOK Q1 2016 Q4 2015 Change
Second quarter DNB Group Results. Rune Bjerke (CEO) Kjerstin Braathen (CFO) 12 July 2018
 Kjerstin Braathen (CFO) 12 July 2018") Q2 Second quarter 2018 DNB Group Results Rune Bjerke (CEO) Kjerstin Braathen (CFO) 12 July 2018 Approaching ROE >12 per cent Return on equity Per cent, 12-month trailing average 11.6 Return on equity 11.8
Q2 Second quarter 2018 DNB Group Results Rune Bjerke (CEO) Kjerstin Braathen (CFO) 12 July 2018 Approaching ROE >12 per cent Return on equity Per cent, 12-month trailing average 11.6 Return on equity 11.8
PRESENTED BY CEO ØYVIND ISAKSEN AND CFO ROAR ØSTBØ (1)
") 139 PRESENTED BY CEO ØYVIND ISAKSEN AND CFO ROAR ØSTBØ (1) 08-02-2011 AGENDA Q4-10 Highlights Key Figures Regional market update Financial review Outlook Q&A (2) 08-02-2011 Q4-10 HIGHLIGHTS 550 MNOK orders
139 PRESENTED BY CEO ØYVIND ISAKSEN AND CFO ROAR ØSTBØ (1) 08-02-2011 AGENDA Q4-10 Highlights Key Figures Regional market update Financial review Outlook Q&A (2) 08-02-2011 Q4-10 HIGHLIGHTS 550 MNOK orders
Refresco Gerber reports solid 2015 results and delivers on strategic goals
 Press release March 10, 2016 Refresco Gerber reports solid 2015 results and delivers on strategic goals Key indicators: Volume in full year 2015 increased 2.1% to 6,095.5 million liters (FY 2014: 5,968.9
Q4 results: Strong execution, resilient portfolio
 Q4 results: Strong execution, resilient portfolio Fast cost take-out keeps full-year EBIT margin well within target range 2-year savings program expanded to $3 billion Pace of base order decline year-on-year
Best Q1 ever all time high order backlog
 Best Q1 ever all time high order backlog First quarter 2014 HIGHLIGHTS Best Q1 ever Revenue of 310 MNOK (222 MNOK) EBITDA of 32 MNOK (10 MNOK) YoY increase in revenues of 40% and a YoY increase in EBITDA
Norwegian Finans Holding ASA. First quarter 2017 results
 Norwegian Finans Holding ASA First quarter 2017 results First quarter 2017 earnings were 328 MNOK, up 38 MNOK compared with the fourth quarter Norwegian Finans Holding Group MNOK Q1 2017 Q4 2016 Change
INTERIM REPORT Q XXL ASA HIGHLIGHTS. Q2 Growth
 INTERIM REPORT Q2 2014 XXL ASA HIGHLIGHTS Total revenues of NOK 1 246 million (NOK 945 million), up 32 per cent EBITDA increased by 47 per cent to NOK 184 million Successful opening in Finland One new
Quarterly Report Q2 2018
 Quarterly Report Q2 2018 Contents Message from the CEO... 3 Key figures Q2 2018... 4 Highlights Q2 2018... 5 Half-year review... 6 Wine: Revenue growth, but negative FX-effect... 8 Spirits: Flat revenue,
Viking Redningstjeneste Topco AS. Interim financial statements 4Q 2018
 Viking Redningstjeneste Topco AS Interim financial statements 4Q 2018 Quarterly report October December 2018 Viking Redningstjeneste Topco AS Fourth quarter 2018 Org no. 998 858 690 Quarterly report FOURTH
Q1 results Peter Nilsson, CEO Cathrin Nylander, CFO
 Q1 results 2018 Peter Nilsson, CEO Cathrin Nylander, CFO 20 April, 2018 Financial highlights Q1: Solid growth and improved profitability Strong revenue growth Underlying growth 8.9% EBIT margin 6.0% (5.3%)