DERIVATIVES, OSLO BØRS - OCTOBER 2012
|
|
|
- Egbert Mills
- 6 years ago
- Views:
Transcription
1 DERIVATIVES, OSLO BØRS - OCTOBER 2012 The OBX index fell slightly in October. The index decreased by 1.1% to points. So far this year, the index is up 14.8%. The average number of contracts traded in October was contracts/day, and the average YTD is Compared to last month, the October numbers were lower overall. The stock option premium decreased by 12% to 60 MNOK and the forward exposure fell by 46% to 436 MNOK. As for the OBX products, the option premium dropped by 27% to 32 MNOK, whereas the future turnover decreased by 17% to 15.5 BNOK. The October numbers were below the monthly average for the year for all product groups: Stock option premium average MNOK Stock forward exposure 564 MNOK OBX option premium 36 MNOK OBX futures turnover 17 BNOK The most traded stock option in October was Statoil with 14.3 MNOK or 24% of the stock option premium turnover. Yara and Storebrand followed. The top three stock derivatives accounted for 50% of the total stock option turnover for the month. Yara, Statoil and Norsk Hydro were the most traded stock forwards. Yara had a turnover of 95 MNOK, 22% of the total. This summary continues with a presentation of general statistics, followed by a productand volatility overview towards the end. We hope to see you back in the derivatives market next month. Disclaimer: All information in this presentation is obtained from documents already available to the public. Oslo Børs does not guarantee the accuracy of the information included in the presentation. This report will not be updated if any changes occur due to cancellations. The presentation does not in any way constitute a recommendation by Oslo Børs.
2 Contracts/ day Contract Distribution Index Futures Single Stock Fwd/Fut OBX Index Options Stock Options Oct 11 Nov 11 Dec 11 Jan 12 Feb 12 Mar 12 Apr 12 May 12 Jun 12 Jul 12 Aug 12 Sep 12 Oct 12
 Contracts/day last")


3 TURNOVER - CONTRACTS/DAY (average) Contracts/day last month OBX - FUTURES STOCK FWD/FUT OBX - OPTIONS STOCK OPTIONS OBX - FUTURES Contracts/day YTD 2012 STOCK FWD/FUT OBX - OPTIONS STOCK OPTIONS


4 LIQUIDITY - OPTION PREMIUM DISTRIBUTION 9.4 % Option Premium last month 8.1 % 7.7 % 4.5 % 3.6 % 2.9 % 2.7 % 2.6 % 2.4 % OBX Options Statoil Yara International Storebrand Telenor DNB Renewable Energy Corp Marine Harvest Group 2.2 % Royal Caribbean Cruises 15.6 % 1.6 % Norsk Hydro 0.7 % Subsea % 0.2 % 0.0 % 0.0 % 0.7 % 0.4 % 0.3 % Petroleum Geo-Services TGS Nopec Geophysical Co. Seadrill Orkla Aker Solutions Gjensidige Forsikring DNO International Tomra Norske Skog Option Premium YTD 2012 OBX Options Statoil 16.2 % 9.4 % 4.4 % 4.2 % 4.1 % 4.1 % 4.0 % 3.4 % 3.3 % 2.8 % Yara International Seadrill Renewable Energy Corp Subsea 7 Storebrand Telenor DNB 2.5 % Petroleum Geo-Services 1.6 % Royal Caribbean Cruises 1.0 % Norsk Hydro 1.0 % Marine Harvest Group 0.9 % Orkla 0.5 % 0.2 % 0.1 % Gjensidige Forsikring Aker Solutions TGS Nopec Geophysical Co % 0.1 % 0.1 % Statoil Fuel & Retail Norske Skog DNO International Tomra 4


5 SINGLE STOCK FORWARD/FUTURE - EXPOSURE DISTRIBUTION Stock Fwd/Fut Premium last month Yara International Statoil 9.9 % 8.2 % 8.1 % Norsk Hydro DNB Subsea % 6.9 % Telenor Seadrill Royal Caribbean Cruises 3.8 % Aker Solutions Petroleum Geo-Services 2.6 % 1.5 % 0.4 % 0.4 % 0.4 % 0.2 % 0.1 % TGS Nopec Geophysical Co. Gjensidige Forsikring Renewable Energy Corporation Marine Harvest Group Storebrand 21.9 % 21.9 % 0.0 % 0.0 % 0.0 % 0.0 % Tomra DNO International Norske Skog Orkla Stock Fwd/Fut Premium YTD 2012 Yara International Norsk Hydro 7.9 % Statoil 8.4 % 6.7 % 4.0 % DNB Royal Caribbean Cruises 16.9 % 4.0 % Seadrill 3.9 % Aker Solutions 18.7 % 19.9 % 3.4 % 2.2 % 1.4 % 1.1 % 0.5 % 0.5 % 0.3 % 0.1 % 0.1 % 0.0 % Petroleum Geo-Services Telenor Subsea 7 Renewable Energy Corp Gjensidige Forsikring Orkla Storebrand Norske Skog Marine Harvest Group TGS Nopec Geophysical Co. DNO International Tomra 5
6 Turnover Premium MNOK Open Interest (avg) - Contracts Turnover Premium MNOK Open Interest (avg) - Contracts PREMIUM - SINGLE STOCK DERIVATIVES Single Stock Options Oct 11 Nov 11 Dec 11 Jan 12 Feb 12 Mar 12 Apr 12 May 12 Jun 12 Jul 12 Aug 12 Sep 12 Oct 12 0 Turnover Premium Open Interest (avg) Single Stock Forwards & Futures Oct 11 Nov 11 Dec 11 Jan 12 Feb 12 Mar 12 Apr 12 May 12 Jun 12 Jul 12 Aug 12 Sep 12 Oct 12 0 Turnover Premium Open Interest (Avg) 6
7 Turnover exposure MNOK Open Interest (avg)- Contracts Turnover Premium MNOK Open Interest (avg)- Contracts PREMIUM - OBX DERIVATIVES OBX - Index Options Oct 11 Nov 11 Dec 11 Jan 12 Feb 12 Mar 12 Apr 12 May 12 Jun 12 Jul 12 Aug 12 Sep 12 Oct 12 Turnover premium / month Open interest (avg) 0 OBX - Index Futures Oct 11 Nov 11 Dec 11 Jan 12 Feb 12 Mar 12 Apr 12 May 12 Jun 12 Jul 12 Aug 12 Sep 12 Oct 12 0 Turnover exposure MNOK Open Interest (avg) 7


8 BROKER STATISTICS - OCTOBER % 8. Options % % Turquoise DNB Bank ASA First Securities ASA Handelsbanken Capital Markets Enskilda Securities Sparebank 1 Markets AS Nordnet Bank AB Pareto Securities AS Nordea Markets NetFonds AS Danske Bank AS Carnegie ASA ABG Sundal Collier Norge ASA Norne Securities AS Stock Forwards & Futures 87. DNB Bank ASA Sparebank 1 Markets AS First Securities ASA 5.10 % 4.90 % % 0.10 % 0.10 % Carnegie ASA Nordnet Bank AB Handelsbanken Capital Markets Enskilda Securities Nordea Markets 8


9 OBX Futures % 9. DNB Bank ASA Turquoise % % 0.10 % Handelsbanken Capital Markets Sparebank 1 Markets AS Nordea Markets Enskilda Securities First Securities ASA Nordnet Bank AB Carnegie ASA RS Platou Markets AS Danske Bank AS Fondsfinans ASA "Turquoise" is a composite entry and includes all derivatives members at Turquoise 9

10 OBX INDEX - CONSTITUENTS AND OTHER INFORMATION The OBX Index consists of the 25 most traded equities (currently 24 due to the delisting of Golar in August), and the constituents are selected on the basis of six months turnover rating. It is a semi-annually revised free float adjusted total return index (dividend adjusted) with composition changes and cappings implemented on the first Friday after the third Thursday in June and December. In the period between the composition review dates, the number of shares for each constituent is fixed with exception of cappings and continuous adjustments for corporate actions. The OBX Index is a tradable index with exchange traded futures and options available : All time high ( close):


11 The current OBX Index composition can be found below. The Derivatives department at Oslo Børs distributes a daily report with information on the OBX Index and its components. If you would like to receive this daily update, please contact mps@oslobors.no. 11
. It is a semi-annually revised, free float adjusted total return index (dividend adjusted). Home: www.oslobors.")
: 46 117 Bloomberg: OBX NO Open Int Fut (avg): 100 508 Weight of All Shares: 44.40% O/I Options avg. 2012: 39 564 Derivatives: Options & Futures O/I Fut avg.")
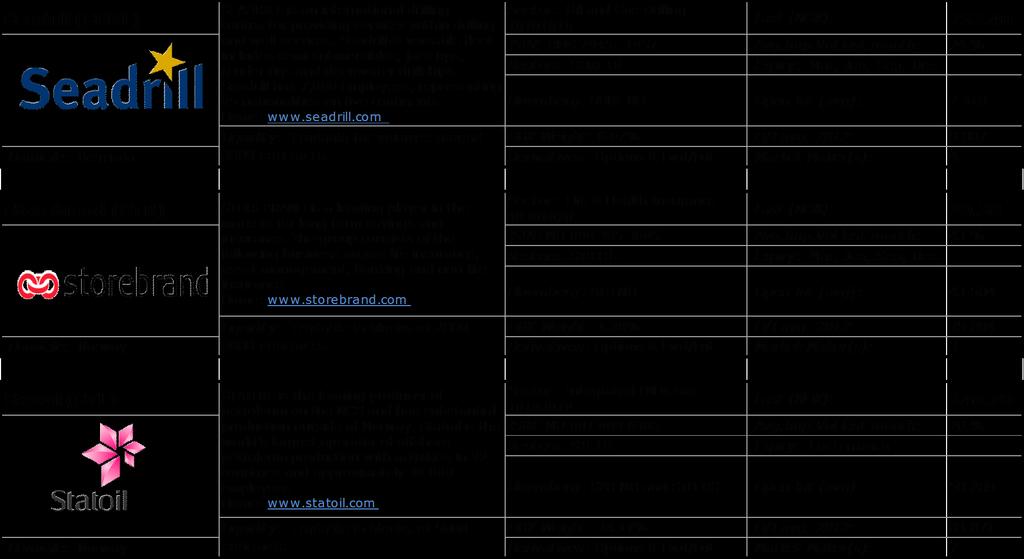
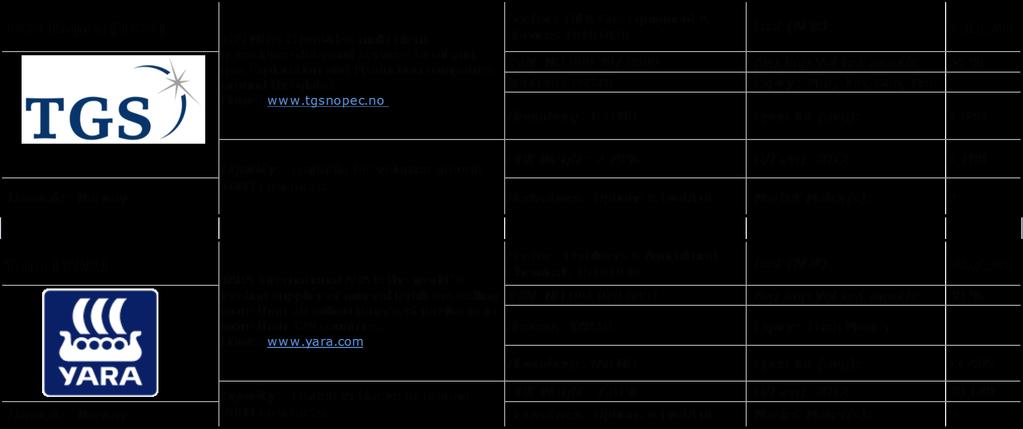
12 OSLO BØRS - LISTED DERIVATIVES OPEN INTEREST - OPTIONS AND OBX FUTURES ONLY OBX Index (OBX) Domicile: Norway The OBX INDEX consists of the 25 most traded securities on Oslo Børs. The constituents are selected on the basis of six months turnover rating (Jun & Dec). It is a semi-annually revised, free float adjusted total return index (dividend adjusted). Home: Liquidity: Tradable in blocks of around 5000 contracts. Sector: N/A Last (NOK): Avg.Imp.Vol last month: 18 % ISIN: NO Expiry: Each Month Reuters:.OBX Open Int Options (avg): Bloomberg: OBX NO Open Int Fut (avg): Weight of All Shares: 44.40% O/I Options avg. 2012: Derivatives: Options & Futures O/I Fut avg. 2012: Market Maker(s): 7 Aker Solutions (AKSO) AKER SOLUTIONS is a leading global oil services company that provides engineering services, technologies, product solutions and field-life solutions for the oil and gas industry. Home: Sector : Oil & Gas Equipment & Services Last (NOK): ISIN: NO Avg.Imp.Vol last month: 36 % Reuters : AKSO.OL Expiry: Mar, Jun, Sep, Dec Bloomberg : AKSO NO Open Int (avg): Liquidity: Tradable for volumes around OBX Weight : 2.58% O/I avg. 2012: Domicile: Norway 2000 contracts. Derivatives : Options & Fwd/Fut Market Maker(s): 2 DNB (DNB) Sector : Diversified Banks Last (NOK): DNB is Norway's largest financial services group and offers financial products and services related to the money and capital markets. Home: ISIN: NO Avg.Imp.Vol last month: 25 % Reuters : DNB.OL Expiry: Each Month Bloomberg : DNB NO Open Int (avg): Liquidity: Tradable in blocks of 3000 OBX Weight : 10.07% O/I avg. 2012: Domicile: Norway contracts. Derivatives : Options & Fwd/Fut Market Maker(s): 5 12
: 10.25 ISIN: NO 000 392 1009 Avg.Imp.Vol last month: 61 % Reuters : DNO.")
: 3 Gjensidige Forsikring (GJF) GJENSIDIGE FORSIKRING is one of the leading players in the Nordic insurance market.")
13 DNO International (DNO) DNO International is an international independent petroleum company engaged in the acquisition, exploration, development and operation of oil and natural gas properties. Home: Sector : Oil & Gas Exploration & Production Last (NOK): ISIN: NO Avg.Imp.Vol last month: 61 % Reuters : DNO.OL Expiry: Mar, Jun, Sep, Dec Bloomberg : DNO NO Open Int (avg): Liquidity: Tradable for volumes around OBX Weight : 0.99% O/I avg. 2012: Domicile: Norway 1000 contracts. Derivatives : Options & Fwd/Fut Market Maker(s): 3 Gjensidige Forsikring (GJF) GJENSIDIGE FORSIKRING is one of the leading players in the Nordic insurance market. The group offers general insurance products in Norway, Sweden, Denmark and the three Baltic countries. In addition the group offers online retail banking, and pension and savings products in Norway. Home: Sector : Multi-line Insurance Last (NOK): ISIN: NO Avg.Imp.Vol last month: 18 % Reuters : GJF.OL Expiry: Mar, Jun, Sep, Dec Bloomberg : GJF NO Open Int (avg): Liquidity: Tradable for volumes around OBX Weight : 2.33% O/I avg. 2012: Domicile: Norway 2000 contracts. Derivatives : Options & Fwd/Fut Market Maker(s): 3 Marine Harvest Group (MHG) MARINE HARVEST is the world s leading seafood company offering a wide range of seafood products and produce one fourth of the world's farmed salmon. The company is present in 18 countries and has 5000 employees worldwide. Home: Sector : Packaged Foods & Meats Last (NOK): 4.59 ISIN: NO Avg.Imp.Vol last month: 32 % Reuters : MHG.OL Expiry: Mar, Jun, Sep, Dec Bloomberg : MHG NO Open Int (avg): Liquidity: Tradable in blocks of OBX Weight: 1.82% O/I avg. 2012: Domicile: Norway contracts. Derivatives : Options & Fwd/Fut Market Maker(s): 4 13

14 Norsk Hydro (NHY) NORSK HYDRO is a global supplier of Sector : Aluminium Last (NOK): aluminium with activities throughout the value chain, from bauxite extraction to the production of rolled and extruded aluminium products and building systems. Based in Norway, the company employs 23,000 people in more than 40 countries. Home: ISIN: NO Avg.Imp.Vol last month: 33 % Reuters : NHY.OL Expiry: Each Month Bloomberg : NHY NO and NOHYF US Open Int (avg): Liquidity: Tradable in blocks of 3000 OBX Weight : 3.61% O/I avg. 2012: Domicile: Norway contracts. Derivatives : Options & Fwd/Fut Market Maker(s): 7 Norske Skog (NSG) NORSKE SKOG is one of the world's biggest producer of publication paper, with 12 paper mills in 10 countries and a production capacity of around 4 mill. tonnes per year. Home: Sector: Paper Products Last (NOK): 4.28 ISIN: NO Avg.Imp.Vol last month: 94 % Reuters: NSG.OL Expiry: Mar, Jun, Sep, Dec Bloomberg: NSG NO Open Int (avg): Liquidity: Tradable in blocks of OBX Weight: N/A O/I avg. 2012: Domicile: Norway 5000 contracts. Derivatives: Options & Fwd/Fut Market Maker(s): 3 Orkla (ORK) ORKLA operates in the branded consumer goods, aluminium solutions and financial investment sectors. The Group has a turnover of NOK 57 billion and 30,000 employees in more than 40 countries. Home: Sector : Industrial Conglomerates Last (NOK): ISIN: NO Avg.Imp.Vol last month: 18 % Reuters : ORK.OL Expiry: Each Month Bloomberg : ORK NO Open Int (avg): Liquidity: Tradable for volumes around OBX Weight : 5.16% O/I avg. 2012: Domicile: Norway 3000 contracts. Derivatives : Options & Fwd/Fut Market Maker(s): 7 14


15 15

16 16

17 Subsea 7 (SUBC) Subsea 7 S.A. is a seabed-to-surface engineering, construction and services contractor to the offshore energy industry worldwide. Provides integrated services, and plan, design and deliver complex projects in harsh and challenging environments. Home: Sector: Oil & Gas Equipment & Services Last (NOK): ISIN: LU Avg.Imp.Vol last month: Reuters: SUBC.OL Expiry: Mar, Jun, Sep, Dec Bloomberg: SUBC NO Open Int (avg): Liquidity: Tradable in blocks of 2000 OBX Weight: 5.20% O/I avg. 2012: Domicile: Luxembourg contracts. Derivatives: Options & Fwd/Fut Market Maker(s): 5 Telenor (TEL) TELENOR is one of the world s major mobile operators with mobile operations in 11 markets and in additionally 19 markets through the per cent ownership in VimpelCom Ltd. Home: Sector : Integrated Telecom. Services Last (NOK): ISIN: NO Avg.Imp.Vol last month: Reuters : TEL.NO Expiry: Each Month Bloomberg : TEL NO and TELN US Open Int (avg): Liquidity: Traded in volumes of 3000 OBX Weight : 12.99% O/I avg. 2012: Domicile: Norway contracts. Derivatives : Options & Fwd/Fut Market Maker(s): 7 Tomra (TOM) TOMRA creates sensor-based solutions for optimal resource productivity - transforming how we obtain, use, and reuse resources. Through TOMRAs solutions customers increase their financial results and reduce their environmental impact, while increasing TOMRAs relevance in society. Home: Sector : Environmental & Facilities Services Last (NOK): ISIN: NO Avg.Imp.Vol last month: 28 % Reuters : TOM.OL Expiry: Mar, Jun, Sep, Dec Bloomberg : TOM NO Open Int (avg): 339 OBX Weight: N/A O/I avg. 2012: 745 Liquidity: Slow activity. Domicile: Norway Derivatives : Options & Fwd/Fut Market Maker(s): 2 17

18 18
19 MARKET MAKERS DNB Markets: Enskilda Securities: First Securities ASA: Handelsbanken Capital Markets: Nordea Markets: Sparebank 1 Markets: Timber Hill Europe: OBX, AKSO, DNO, GJF, MHG, NHY, NSG, ORK, PGS, REC, RCL, SDRL, STB, STL, SUBC, TEL, TOM, YAR, TGS OBX, DNB, NHY, ORK, STL, TEL, YAR OBX, DNB, NHY, ORK, STL, TEL, YAR OBX, AKSO, DNO, GJF, DNB, MHG, NHY, NSG, ORK, PGS, REC, RCL, SDRL, STB, STL, SUBC, TEL, TOM, YAR, TGS OBX, DNO, NHY, NSG, ORK, PGS, REC, STL, SUBC, TEL OBX, DNB, GJF, MHG, NHY, ORK, SDRL, STL, SUBC, TEL OBX, DNB, MHG, NHY, ORK, PGS, REC, RCL, SDRL, STB, STL, SUBC, TEL, YAR 19
20 OPTIONS - ATM IMPLIED VOLATILITIES Daily Volatilities = average of Last Bid+Offer vol. for ATM CALLS and PUTS for the nearest two months. Lack of data may occur, thus volatilities should be seen as indicative. 90 % 10 % OBX ATM Implied Vol AKSO ATM Implied Vol DNB ATM Implied Vol % Disclaimer: All information in this presentation is obtained from documents already available to the public. Oslo Børs does not guarantee the accuracy of the information included in the presentation. This report will not be updated if any changes occur due to cancellations. The presentation does not in any way constitute a recommendation by Oslo Børs. 20
21 DNO ATM Implied Vol GJF ATM Implied Vol 25 % 15 % 10 % MHG ATM Implied Vol % Disclaimer: All information in this presentation is obtained from documents already available to the public. Oslo Børs does not guarantee the accuracy of the information included in the presentation. This report will not be updated if any changes occur due to cancellations. The presentation does not in any way constitute a recommendation by Oslo Børs. 21
22 100 % 90 % NHY ATM Implied Vol % 100 % 90 % NSG ATM Implied Vol 10 % ORK ATM Implied Vol Disclaimer: All information in this presentation is obtained from documents already available to the public. Oslo Børs does not guarantee the accuracy of the information included in the presentation. This report will not be updated if any changes occur due to cancellations. The presentation does not in any way constitute a recommendation by Oslo Børs. 22
23 PGS ATM Implied Vol RCL ATM Implied Vol % 100 % 90 % REC ATM Implied Vol Disclaimer: All information in this presentation is obtained from documents already available to the public. Oslo Børs does not guarantee the accuracy of the information included in the presentation. This report will not be updated if any changes occur due to cancellations. The presentation does not in any way constitute a recommendation by Oslo Børs. 23
24 1 110 % 100 % 90 % SDRL ATM Implied Vol 1 STB ATM Implied Vol % 90 % 10 % STL ATM Implied Vol Disclaimer: All information in this presentation is obtained from documents already available to the public. Oslo Børs does not guarantee the accuracy of the information included in the presentation. This report will not be updated if any changes occur due to cancellations. The presentation does not in any way constitute a recommendation by Oslo Børs. 24
25 SUBC ATM Implied Vol % 90 % 10 % TEL ATM Implied Vol 90 % TGS ATM Implied Vol Disclaimer: All information in this presentation is obtained from documents already available to the public. Oslo Børs does not guarantee the accuracy of the information included in the presentation. This report will not be updated if any changes occur due to cancellations. The presentation does not in any way constitute a recommendation by Oslo Børs. 25
26 90 % TOM ATM Implied Vol 100 % 90 % YAR ATM Implied Vol Disclaimer: All information in this presentation is obtained from documents already available to the public. Oslo Børs does not guarantee the accuracy of the information included in the presentation. This report will not be updated if any changes occur due to cancellations. The presentation does not in any way constitute a recommendation by Oslo Børs. 26
DERIVATIVES, OSLO BØRS FEBRUARY 2010
 DERIVATIVES, OSLO BØRS FEBRUARY 2010 The OBX index fell 3.7% to 317.57 points in February. The index is down 6.4% during the first two months of 2010. The turnover for single stock derivatives fell from
DERIVATIVES, OSLO BØRS - JANUARY 2014
 DERIVATIVES, OSLO BØRS - JANUARY 2014 The OBX index decreased 2.7% to 490.21 points in January, and the index reached yet another alltime high on January 21 st with 518.60 points. The average number of
DERIVATIVES, OSLO BØRS
 DERIVATIVES, OSLO BØRS - 2013 Some of the highlights in the derivatives market in 2013: March 18 Listing of futures on the OBOSX index (Oslo Børs OBX Oil Service Index) June 13 Year-high OBX options premium
Derivatives Rules Appendix B Fees and General Information
 2019 Derivatives Rules Appendix B Fees and General Information TABLE OF CONTENTS B.1 LIST OF TRADING AND CLEARING FEES FOR NORWEGIAN DERIVATIVE PRODUCTS... B1 B.2 QUOTATION LIST FOR OSLO BØRS... B2 B.3
NORW Global X MSCI Norway ETF
 Global X MSCI Norway ETF ETF.com segment: Equity: Norway - Total Market Competing ETFs: ENOR Related ETF Channels: Norway, ESG, Single Country, Total Market, Vanilla, Europe, Equity, Size and Style, Broad-based
Oslo Børs your Gateway to International investors
 Oslo Børs your Gateway to International investors September 2008 Agenda About Oslo Børs Listing opportunities in Oslo Listing requirements Summary Marketplaces and products Equities Equities ETFs Derivatives
Carbon report SEB Norway Focus Fund
 Carbon report SEB Norway Focus Fund Report created on: February 27, 218 The carbon footprint provides a historic snapshot of the emissions from the equity holdings of the fund. The calculations are not
Shareholder information
 SHAREHOLDER INFORMATION Index 107 07: Shareholder information Share price development in 2010 NOK 65 60 55 50 45 40 35 30 25 Jan. Feb. Mar. Apr. May Jun. Jul. Aug. Sept. Oct. Nov. Dec. Hydro Oslo Børs
VINX 30 Index. More information about the Index can be found at
 VINX 30 Index The VINX 30 Index is the leading share index of the Nordic Exchanges and the Oslo exchange. The index consists of the 30 largest and most actively traded shares listed on NASDAQ OMX Nordic
Prospectus for the fund. DnB NOR OBX. Exchange Traded Fund (ETF)
") Prospectus for the fund DnB NOR OBX Exchange Traded Fund (ETF) March 2005 This prospectus has been prepared in accordance with the Regulations on mutual fund prospectuses promulgated by the Royal Norwegian
Prospectus for the fund DnB NOR OBX Exchange Traded Fund (ETF) March 2005 This prospectus has been prepared in accordance with the Regulations on mutual fund prospectuses promulgated by the Royal Norwegian
Nordic Institutions Domestic Equity Trade 2004
 Facts about the Survey & Definitions Large Small Private Target Groups Interviewed Large & Small institutions as well as Private investors, number % of total turnover past 12 months, approximately Large
Your Aquaculture Technology and Service Partner. Q Presentation Oslo - May 11 th, 2016 Trond Williksen, CEO Eirik Børve Monsen, CFO
 Q1 2016 Presentation Oslo - May 11 th, 2016 Trond Williksen, CEO Eirik Børve Monsen, CFO Agenda 1 Highlights 2 Financial performance 3 Outlook 4 Q&A Highlights Q1 2016 - by CEO Trond Williksen 3 MNOK On
Your Aquaculture Technology and Service Partner. Q Presentation Oslo - August 17 th, 2016 Trond Williksen, CEO Eirik Børve Monsen, CFO
 Q2 2016 Presentation Oslo - August 17 th, 2016 Trond Williksen, CEO Eirik Børve Monsen, CFO Agenda 1 Highlights 2 Financial performance 3 Outlook 4 Q&A Highlights Q2 2016 - by CEO Trond Williksen 3 Improved
Executive Board meeting. 14 December 2011
 Executive Board meeting December EU measures ECB Key policy rate has been reduced to. percent Measures: Liquidity operation with a maturity of months Reserve requirements reduced from to per cent Reduced
Six good reasons for choosing DNB in the new banking environment
 Six good reasons for choosing DNB in the new banking environment Bank of America Merrill Lynch, 18th Annual Banking & Insurance CEO Conference 2013 24 September, London Rune Bjerke, CEO of DNB 1 Reason
Your Aquaculture Technology and Service Partner. Q Presentation Oslo - February 19 th, 2016 Trond Williksen, CEO Eirik Børve Monsen, CFO
 Q4 2015 Presentation Oslo - February 19 th, 2016 Trond Williksen, CEO Eirik Børve Monsen, CFO Agenda 1 Highlights 2 Financial performance 3 Outlook 4 Q&A Highlights Q4 2015 - by CEO Trond Williksen 3 MNOK
Third Quarter
 Third Quarter 2005 0 Financial highlights NOK million 3Q 05 3Q 04 YTD 05 YTD 04 Revenues 701 665 1987 1849 RVM Technology 299 303 827 922 Collection & Materials Handling 247 237 647 632 Recycling Technology
Hafslund ASA 10 July 2014 Finn Bjørn Ruyter, CEO
 Hafslund ASA 1 July 214 Finn Bjørn Ruyter, CEO Second-quarter highlights 214 EBITDA of NOK 624 million up 1 percent on the previous year due to improvements in results within network and power sales. Customer
Shareholder information
 SHAREHOLDER INFORMATION Index 115 05: Shareholder information Share price development in 2011 NOK 55 50 45 40 35 30 25 20 Jan. Feb. Mar. Apr. May Jun. Jul. Aug. Sept. Oct. Nov. Dec. Introduction p.116
Shareholder information
 SHAREHOLDER INFORMATION Index 89 06: Shareholder information Share price development in 2009 NOK NOK 60 50 40 30 20 10 0 Jan. Feb. Mar. Apr. May Jun. Jul. Aug. Sept. Oct. Nov. Dec. Introduction p.90 Dividend
1 st Quarter 2002 DNO ASA 23 May 2002
 1 st Quarter 2002 DNO ASA 23 May 2002 1 Highlights 1st Quarter 2002 Operations Achieved record production > 20.000 BOPD Yemen production up 100 % due to Sharyoof Maintaining good operating margins Reduced
EY s 2016 Executive and Board Remuneration Report. Norway
 EY s 2016 Executive and Board Remuneration Report Norway About this report Did you know In 2015, EY reorganized and introduced the new sub-service line People Advisory Services (PAS). PAS is broader than
Q Presentation. Oslo November 2 nd 2018 Hallvard Muri, CEO Simon Nyquist Martinsen, CFO
 Q3 218 Presentation Oslo November 2 nd 218 Hallvard Muri, CEO Simon Nyquist Martinsen, CFO Agenda Highlights Financial performance Outlook Q&A Highlights Q3 218 by CEO Hallvard Muri Order Intake development
London Stock Exchange Derivatives Market Equity Derivatives Contract Specifications
 London Stock Exchange Derivatives Market Equity Derivatives Contract Specifications This document is for information only and is subject to change. London Stock Exchange Group has made reasonable efforts
EFAS Global X MSCI SuperDividend EAFE ETF
 Global X MSCI SuperDividend EAFE ETF ETF.com segment: Equity: Developed Markets Ex-U.S. - High Dividend Competing ETFs: IDV, DTH, HDEF, FIDI Related ETF Channels: Developed Markets Ex-U.S., Smart-Beta
TRANSPARENCY IN CORPORATE REPORTING ASSESSING LARGE COMPANIES ON OSLO STOCK EXCHANGE (2013)
") TRANSPARENCY IN CORPORATE REPORTING ASSESSING LARGE COMPANIES ON OSLO STOCK EXCHANGE (201) Transparency International is the global civil society organisation leading the fight against corruption. Through
TRANSPARENCY IN CORPORATE REPORTING ASSESSING LARGE COMPANIES ON OSLO STOCK EXCHANGE (201) Transparency International is the global civil society organisation leading the fight against corruption. Through
ABGSC affected by complicated market conditions in the quarter Revenues fall 35% and Pre-tax Profits decrease 44%
 Press Release ABG Sundal Collier First Quarter 2008 - Report to Shareholders ABGSC affected by complicated market conditions in the quarter Revenues fall 35% and Pre-tax Profits decrease 44% Oslo, 24 April
Fourth quarter 2016 Presentation to analysts and preliminary results 2016
 Fourth quarter 2016 Presentation to analysts and preliminary results 2016 Finn Bjørn Ruyter Oslo, 9 February 2017 Agenda 1 Summary of the year 2016 2 Fourth quarter 2016 results 3 Theme: Strategy 4 Appendix
Checklist 2005 Q404 Q105 Q205 Q305
 FY 20 0 Checklist 20 To-do list 20 Status Q404 Q1 Q2 Q3 Integrate TiTech and Orwak Group into TOMRA Successfully complete pilots in the UK and Japan Execute on German opportunity Revitalize and achieve
STRATEGY & MACRO TEAM. Equities update. 6 November 2017
 STRATEGY & MACRO TEAM Equities update 6 November 2017 Strategy & Macro Team: Paul Harper (Equity Strategist): +47 24 16 91 82; paul.harper@dnb.no Morten Jensen (Head of Equity Research): +47 24 16 91 84:
Dynamic Management. The SpareBank 1 group s road to a new corporate governance based on the principles of Beyond Budgeting
 Dynamic Management The SpareBank 1 group s road to a new corporate governance based on the principles of Beyond Budgeting LESS 2010, Helsinki 18 October 2010 Sigurd Aune, CFO SpareBank 1 Gruppen AS Agenda
Nordic Real Estate Construction Conference
 DNB Nordic Real Estate Construction Conference 20th september 2018 Number of employees Results IFRS Value adjusted equity Earnings before tax MNOK 2 625 1 643 37 828 Homes sold Number of members/owners
SEB Enskilda Nordic Seminar 2010 Thursday, 7 January Long Term Performer High Performance Potential
 SEB Enskilda Nordic Seminar 2010 Thursday, 7 January 2010 Long Term Performer High Performance Potential Veidekke - A Scandinavian Contractor and Property Developer Contents About Veidekke Our Performance
DNB SICAV High Yield. Monthly report - March 2018
 Monthly report - March 2018 140 120 100 80 60 40 20 0 (Net) BCGAXJPXC9 (Gross) Nov-15 May-16 Nov-16 May-17 Nov-17 Key figures Fund Index YTM 5.8 1.8 Effective duration 0.9 6.7 Credit duration 3.2 1.5 Volatility
Q U A R T E R L Y R E P O R T 2018 FIRST QUARTER
 Q U A R T E R L Y R E P O R T 2018 FIRST QUARTER Contents Highlights 3 Group summary 5 Business areas 6 Other matters 7 Outlook 7 Financial statements 8 Notes to the financial statements 13 Definitions
Financial stability 2/11. Charts
 Financial stability /11 Charts External sources of risk to banking sector Vulnerability in banking sector Chart 1.1 Vulnerabilities in the Norwegian banking sector and external sources of risk to the banking
Annika Falkengren. President and CEO. Result presentation. January September 2010
 Annika Falkengren President and CEO Result presentation January September 2010 Highlights Income Seasonally slow quarter supported by diversified earnings Further improved asset quality Baltics back in
MIND THE GAP. CEO Remuneration and the Scandinavian Corporate Governance Landscape. September, 2017
 MIND THE GAP CEO Remuneration and the Scandinavian Corporate Governance Landscape September, 2017 September 2017 1 INTRODUCTION The corporate governance landscape has been changing and executive remuneration
Spheria Australian Smaller Companies Fund
 29-Jun-18 $ 2.7686 $ 2.7603 $ 2.7520 28-Jun-18 $ 2.7764 $ 2.7681 $ 2.7598 27-Jun-18 $ 2.7804 $ 2.7721 $ 2.7638 26-Jun-18 $ 2.7857 $ 2.7774 $ 2.7690 25-Jun-18 $ 2.7931 $ 2.7848 $ 2.7764 22-Jun-18 $ 2.7771
The Fixed-Income Markets at the Oslo Børs and the ABM
 The Fixed-Income Markets at the Oslo Børs and the ABM ABM Alternative Bond Market The Oslo Børs The Oslo Børs marketplace offers trading in shares, primary capital certificates, warrants, fixed income
Quarterly report 4 I 2015
 GOVERNMENT DEBT MANAGEMENT Quarterly report I 21 JANUARY 216 Government Debt Management Debtmanagement@Norges-Bank.no www.debtnorway.no Tel.: +7 22 31 71 Quarterly report I 21 JANUARY 216 Government Debt
Oslo Børs Holding ASA
 Oslo Børs Holding ASA 2nd Quarter 2007 14 August 2007 Overview Second quarter highlights Continuing high level of market activity Operating revenues: NOK 147.3 million (134.4) Operating profit: NOK 89.1
VPS Holding ASA (The Norwegian Central Securities Depository) Report for the Second Quarter 2003
 Report for the Second Quarter 2003") VPS Holding ASA (The Norwegian Central Securities Depository) Report for the Second Quarter Profit and Loss Account 2002 2002 2002 Main figures in NOK 000 2nd. Qtr 2nd. Qtr 01.01.- 30.06. 01.01. 30.06.
VPS Holding ASA (The Norwegian Central Securities Depository) Report for the Second Quarter Profit and Loss Account 2002 2002 2002 Main figures in NOK 000 2nd. Qtr 2nd. Qtr 01.01.- 30.06. 01.01. 30.06.
Share information. More information on the ADR programme may be found on Orkla s website under Investor Relations.
 215 Through efficient business operations, Orkla aims to achieve long-term value growth for its shareholders which exceeds that of relevant, competitive investment alternatives. For shareholders, this
ISCF ishares Edge MSCI Multifactor Intl Small-Cap ETF
 ishares Edge MSCI Multifactor Intl Small-Cap ETF ETF.com segment: Equity: Developed Markets Ex-U.S. - Small Cap Competing ETFs: FDTS, SCZ, SCHC, GWX, FNDC Related ETF Channels: Developed Markets Ex-U.S.,
AB SICAV I. Report of income for UK tax purposes. Dear Investor,
 AB SICAV I Report of income for UK tax purposes Dear Investor, This website comprises a report of income to investors who held investments in AB SICAV I as at 31 May 2017. The classes of shares listed
Results Q Investor presentation
 Results Q3 2016 Investor presentation Preparing for another gold medal Trondheim Oct. 28th Oct. 30th Sverre Bjerkeli (57) - CEO: Head of consumer/commercial division at Storebrand (If..) CEO Storebrand
Presentatio. on Q3 2010
 Presentatio on Q3 2010 CEO Regin Jacobsen CFO Teitur Samuelsen Oslo November 9 th 2010 Disclaimer This presentation includes statements regarding future results, which are subject to risks and uncertainties.
VINX Benchmark EUR_GI
 VINX Benchmark EUR_GI The VINX Benchmark index (VINXB) consists of a selection of the largest and most traded stocks, with representation from a majority of the Industries. The weight of each constituent
Oslo Børs VPS Holding ASA 4th Quarter 2008
 Oslo Børs VPS Holding ASA 4th Quarter 2008 27 January 2008 Overview Fourth quarter highlights Letter of intent for strategic co-operation with the London Stock Exchange Considers Central counterparty (CCP)
Financial Stability 1/11. Charts
 Financial Stability 1/11 Charts Chapter 1 Chart 1.1 Banks 1) pre-tax profits as a percentage of average total assets. Per cent. Annual figures. 1. 1 Q1 and 11 Q1 3 1-1 - 3 1-1 - -3 3 5 6 7 8 9 1 1 Q1 11
Division of Bond Finance Interest Rate Calculations. Revenue Estimating Conference Interest Rates Used for Appropriations, including PECO Bond Rates
 Division of Bond Finance Interest Rate Calculations Revenue Estimating Conference Interest Rates Used for Appropriations, including PECO Bond Rates November 16, 2018 Division of Bond Finance Calculation
Q Presentation. Oslo May 16 th 2018 Hallvard Muri, CEO Simon Nyquist Martinsen, CFO
 Q1 218 Presentation Oslo May 16 th 218 Hallvard Muri, CEO Simon Nyquist Martinsen, CFO Agenda Highlights Financial performance Outlook Q&A Highlights Q1 218 by CEO Hallvard Muri Continued growth in order
NORTH ATLANTIC DRILLING LTD. Pareto Oil & Offshore Service Conference, Oslo CFO Esa Ikaheimonen August 31, 2011
 NORTH ATLANTIC DRILLING LTD Pareto Oil & Offshore Service Conference, Oslo CFO Esa Ikaheimonen August 31, 2011 Forward-looking statements The statements described in this presentation that are not historical
U.S. OIL & GAS SNAPSHOT
 U.S. THOMSON REUTERS LPC FEBRUARY 2016 Colm (C.J.) Doherty Director of Analysis colm.doherty@thomsonreuters.com 646-223-6821 U.S. Key Points Slides 3-4 Oil & Gas Institutional Loan Defaults Slide 5 Oil
Hafslund. A pure-play utility. Investor presentation October 2016
 Hafslund A pure-play utility Investor presentation October 2016 Disclaimer Certain statements included within this presentation contain (and oral communications made by or on behalf of Hafslund may contain)
Executive Board meeting
 Executive Board meeting August 7 Growth forecasts Consensus Forecasts GDP. Percentage change on previous year 9 8 7 7 8 9 Forecasts June Forecasts June 8 Forecasts July World North Western Japan America
Executive Summary. July 17, 2015
 Executive Summary July 17, 2015 The Revenue Estimating Conference adopted interest rates for use in the state budgeting process. The adopted interest rates take into consideration current benchmark rates
DNO ASA Corporate Presentation
 DNO ASA Corporate Presentation 20.08.02 2 nd Quarter / 1 st Half Year 2002 Highlights 2 nd Quarter / 1 st Half Year 2002 Operations Achieved record production of 23.486 BOPD in 2 Quarter Further increase
PHOENIX ENERGY MARKETING CONSULTANTS INC. HISTORICAL NATURAL GAS & CRUDE OIL PRICES UPDATED TO July, 2018
 Jan-01 $12.9112 $10.4754 $9.7870 $1.5032 $29.2595 $275.39 $43.78 $159.32 $25.33 Feb-01 $10.4670 $7.8378 $6.9397 $1.5218 $29.6447 $279.78 $44.48 $165.68 $26.34 Mar-01 $7.6303 $7.3271 $5.0903 $1.5585 $27.2714
DNB Fund - TMT Absolute Return
 Share Class NOK ABOUT THE FUND The Sub-Fund aims to achieve a positive absolute return over the long-term, by taking long and short positions primarily in equities or equity related derivative contracts
Fishpool Christmas Seminar 2017 Bearish signals going into 2018
 Photo: SB1 Markets SEAFOOD SALMON FARMING Fishpool Christmas Seminar 2017 Bearish signals going into 2018 Tore A. Tønseth Phone : (+47) 24 14 74 18 Mobile : (+47) 95 80 62 77 E-mail : tore.tonseth@sb1markets.no
Rogaland på Børs, Stavanger. CFO Esa Ikaheimonen September 7 th, 2011
 Rogaland på Børs, Stavanger CFO Esa Ikaheimonen September 7 th, 2011 Contents Seadrill Company update Market outlook Value creation North Atlantic Drilling Company update Market outlook Value creation
ABG Sundal Collier. Preliminary 2008 results. Press Release
 Press Release ABG Sundal Collier Preliminary 2008 results Oslo, 17 February 2008 The loss of confidence and subsequent turmoil in global financial markets following the collapse of some high profile international
Your Aquaculture Technology and Service Partner. Company presentation August 2016
 Company presentation August 2016 Important Information About this Company Presentation This Company Presentation has been prepared by AKVA group ASA ("AKVA group" or the "Company") for information purposes
EU Capital Markets Union The Norwegian Angle
 EU Capital Markets Union The Norwegian Angle November 22 nd 2017 By Per Erik Stokstad, Finance Norway Agenda 1. Finance Norway Who we are How we work on EU files 2. CMU The Norwegian perspective Regulatory
The Orkla Group. First quarter May 2003
 The Orkla Group First quarter 2003 8 May 2003 Agenda Highlights and key figures Currency translation effects Results by business area Cash flow statement and balance sheet 2 Highlights Q1-2003 Weak results
Quiet quarter, attractive valuation
 Result Preview 15-Apr-13 Aker Sector: Industrial Conglomerates Recommendation: BUY (unchanged) Target price (NOK): 260 (unchanged) Analyst: Terje Mauer Tel: +47 22 01 63 24 E-mail: terje.mauer@platou.com
December Company Presentation
 December Company Presentation Agenda About TGS Review of 16 Market outlook The TGS approach Appendix TGS-NOPEC Geophysical Company ASA. All rights reserved. 2 This is TGS Main offices: Oslo and Houston
Company Overview. Financial Performance
 Apr/15 May/15 Jun/15 Jul/15 Aug/15 Sep/15 Oct/15 Nov/15 Dec/15 Jan/16 Feb/16 Mar/16 Monarch Networth Capital Limited CMP: 26.00 March 23, 2016 Stock Details BSE code 511551 BSE ID MONARCH Face value (
Citi 2016 Global Energy & Utilities Conference, Boston
 Citi 2016 Global Energy & Utilities Conference, Boston Will Ashby VP HR & Communication May 11 th, 2016 Forward-Looking Statements All statements in this presentation other than statements of historical
Increase in operating revenues, EBITA and operating margin Strong influx of new orders Several major contracts
 General summary Q1 Operating revenues up 1.1 per cent Operating profit (EBITA) up 66.7 per cent Operating margin up from 5.5 per cent to 8.4 per cent New orders climbed by 87.7 per cent Foundation laid
XML Publisher Balance Sheet Vision Operations (USA) Feb-02
 Feb-02") Page:1 Apr-01 May-01 Jun-01 Jul-01 ASSETS Current Assets Cash and Short Term Investments 15,862,304 51,998,607 9,198,226 Accounts Receivable - Net of Allowance 2,560,786
Page:1 Apr-01 May-01 Jun-01 Jul-01 ASSETS Current Assets Cash and Short Term Investments 15,862,304 51,998,607 9,198,226 Accounts Receivable - Net of Allowance 2,560,786
Quarterly report 2 I 2016
 GOVERNMENT DEBT MANAGEMENT Quarterly report I 6 JULY 6 Government Debt Management Debtmanagement@Norges-Bank.no www.debtnorway.no Tel.: +7 7 Quarterly report I 6 JULY 6 Government Debt Management Debtmanagement@Norges-Bank.no
Second-quarter 2011 Analytikerpresentasjon presentation to analysts 2. kvartal 2010
 Second-quarter 211 Analytikerpresentasjon presentation to analysts 2. kvartal 21 Hafslund ASA Hafslund 8 July 211 ASA Christian 15. juli Berg, 21CEO Christian Berg, CEO Highlights second-quarter 211 High
 EDM Ahorro Corporate Bonds Return Date: 31/12/2017 Snapshot Global Category Custodian / Administrator Auditor Domicile UCITS Morningstar Rating 3 Yr Morningstar Rating 5 Yr Fund s Data Inception Date Month
Another strong quarter for TOMRA
 Another strong quarter for TOMRA Strong overall performance Revenues of 1,068 MNOK (+67 percent vs. 641 MNOK in third quarter 2005) Operating profit of 194 MNOK (71 MNOK in third quarter 2005) Cash flow
XLE Energy Select Sector SPDR Fund
 Energy Select Sector SPDR Fund ETF.com segment: Equity: U.S. Energy Competing ETFs: VDE, IYE, FENY, PSCE, FXN Related ETF Channels: North America, U.S., Energy, Broad-based, S&P Energy Select Sector Index,
TD Securities 2011 Calgary Unconventional Energy Conference July 7, Dawn Farrell Chief Operating Officer
 TD Securities 2011 Calgary Unconventional Energy Conference July 7, 2011 Dawn Farrell Chief Operating Officer 1 Forward looking statements This presentation may contain forward looking statements, including
Annika Falkengren CEO. UBS conference. May 14, 2007
 Annika Falkengren CEO UBS conference May 14, 2007 What we are How we differ Growth opportunities 2 SEB history Longstanding customer relationships Entrepreneurship International outlook Same major owners
Asset Manager Performance Comparison
 Cape Peninsula University of Technology Retirement Fund August 2017 DISCLAIMER AND WARNINGS: Towers Watson (Pty) Ltd, a Willis Towers Watson company, is an authorised financial services provider. Although
RFFC RiverFront Dynamic U.S. Flex-Cap ETF
 RiverFront Dynamic U.S. Flex-Cap ETF ETF.com segment: Equity: U.S. - Total Market Competing ETFs: AIEQ, RFDA, HUSE, TTFS, TTAC Related ETF Channels: North America, No Underlying Index, U.S., Broad-based,
Asset Manager Performance Comparison
 Cape Peninsula University of Technology Retirement Fund September 2017 DISCLAIMER AND WARNINGS: Towers Watson (Pty) Ltd, a Willis Towers Watson company, is an authorised financial services provider. Although
Industry Trends Watch
 Costing Trends - Alberta Asphalt Cement (Edmonton Rack $C/t) According to local industry sources, the Edmonton rack price for asphalt cement remained unchanged mo/mo in February at $565 per tonne. Expect
FTSE Nareit All Equity REITs equity market capitalization = $986.8 billion
 Nareit REIT Industry Fact Sheet Data as of, except where noted. Unless otherwise noted, all data are derived from, and apply only to, publicly traded US REITs. Industry Size FTSE Nareit All REITs equity
Dividend Report. December 2018
 Warning: Aberdeen Global has the discretion to determine the and rate of dividend to be distributed. The dividends are not guaranteed and may be investment income, gains or at the discretion of the Board
Q JAN ERIK KJERPESETH MANAGING DIRECTOR SPAREBANKEN VEST
 Q1 2017 JAN ERIK KJERPESETH MANAGING DIRECTOR SPAREBANKEN VEST THREE-TIER DIGITAL STRATEGY In-house development: Opportunities for a differentiated customer experience What we perceive to be our core services
VEGI ishares MSCI Global Agriculture Producers ETF
 VEGI ishares MSCI Global Agriculture Producers ETF ETF.com segment: Equity: Global Agriculture Competing ETFs: SOIL, PAGG, CROP, MOO, FTAG Related ETF Channels: Global, Vanilla, Theme Investing, Equity,
Operating revenues and operating costs 12 months 12 months 2006 Actual 2007 Proforma
 Consolidated Income Statement 12 month period ending 31 December 2007 and All amounts in NOK thousands Operating revenues and operating costs 12 months 12 months Revenues 7 675 - Cost of goods sold 1 225
QUESTION 2. QUESTION 3 Which one of the following is most indicative of a flexible short-term financial policy?
 QUESTION 1 Compute the cash cycle based on the following information: Average Collection Period = 47 Accounts Payable Period = 40 Average Age of Inventory = 55 QUESTION 2 Jan 41,700 July 39,182 Feb 18,921
Economic Activity Index ( GDB-EAI ) For the month of May 2013 G O V E R N M E N T D E V E L O P M E N T B A N K F O R P U E R T O R I C O
 For the month of May 2013 G O V E R N M E N T D E V E L O P M E N T B A N K F O R P U E R T O R I C O") Economic Activity Index ( GDB-EAI ) For the month of May 2013 General Commentary May 2013 GDB-EAI for the month of May registered a 3.4% year-over-year ( YOY ) reduction May 2013 EAI was 126.7, a 3.4%
Economic Activity Index ( GDB-EAI ) For the month of May 2013 General Commentary May 2013 GDB-EAI for the month of May registered a 3.4% year-over-year ( YOY ) reduction May 2013 EAI was 126.7, a 3.4%
PRESENTATION Q Oslo, 19 February 2013 John Binde, CEO Ola Loe, CFO
 PRESENTATION Q4 2012 Oslo, 19 February 2013 John Binde, CEO Ola Loe, CFO AGENDA: Highlights for the period Segment information Group financials Outlook 2 Highlights in Q4 2012: Significant improvement
DTH WisdomTree International High Dividend Fund
 WisdomTree International High Dividend Fund ETF.com segment: Equity: Developed Markets Ex-U.S. - High Dividend Competing ETFs: IDV, HDEF, EFAS, FIDI Related ETF Channels: Developed Markets Ex-U.S., Smart-Beta
NORDIC NON-LIFE Weather and financial market chills
 EQUITY RESEARCH Research report prepared by DNB Markets, a division of DNB Bank ASA This report was completed and disseminated at 7:01 CET on 0 NORDIC NON-LIFE Weather and financial market chills We expect
Insr Transformed September, 2018
 Insr Transformed September, 2018 Insr in brief Norwegian company, listed Oslo Stock Exchange 2014 Non-life insurance; property & casualty; retail & SME Portfolio Q2 18 NOK 1.40 bn Currently operating in
SCIJ Global X Scientific Beta Japan ETF
 Global X Scientific Beta Japan ETF ETF.com segment: Equity: Japan - Total Market Competing ETFs: FJP, GSJY, QJPN, JHDG, EWJ Related ETF Channels: Multi-factor, Smart-Beta ETFs, Single Country, Total Market,
Disclaimer and legal disclosures
 Disclaimer and legal disclosures Origin of the publication or report This publication or report originates from Pareto Securities AS ( Pareto Securities ), reg. no. 956 632 374 (Norway), Pareto Securities
PRESS RELEASE. Securities issued by Hungarian residents and breakdown by holding sectors. January 2019
 7 March 2019 PRESS RELEASE Securities issued by Hungarian residents and breakdown by holding sectors January 2019 According to securities statistics, the amount outstanding of equity securities and debt
Oil market outlook. Tight despite a risky demand side. 9 November 2011
 9 November 2011 Oil market outlook Tight despite a risky demand side Sigurd-Erik Nissen-Meyer Direct: +47 2413 2134 Mobile: +47 9186 6247 Email: senm@pareto.no Please refer to important disclosures at
Economic outlook. Address by Central Bank Governor Svein Gjedrem to invited foreign embassy representatives. Norges Bank 18 March 2004
 Economic outlook Address by Central Bank Governor Svein Gjedrem to invited foreign embassy representatives Norges Bank 1 March SG Diplomat 1.. Long-term interest rates Per cent 15 1 9 Norway US Germany