HANDELSBANKEN MID/SMALL CAP SEMINAR
|
|
|
- Beverly Green
- 5 years ago
- Views:
Transcription


1 HANDELSBANKEN MID/SMALL CAP SEMINAR President and CEO, Stefan Ranstrand 24th of May 2018 Stockholm, Sweden

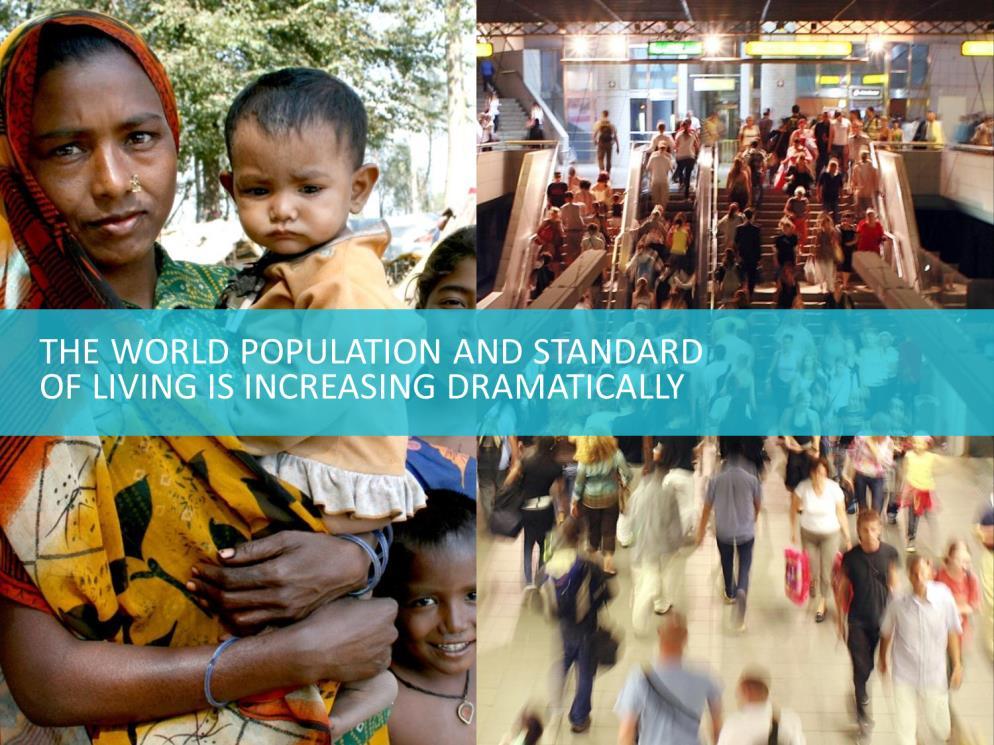
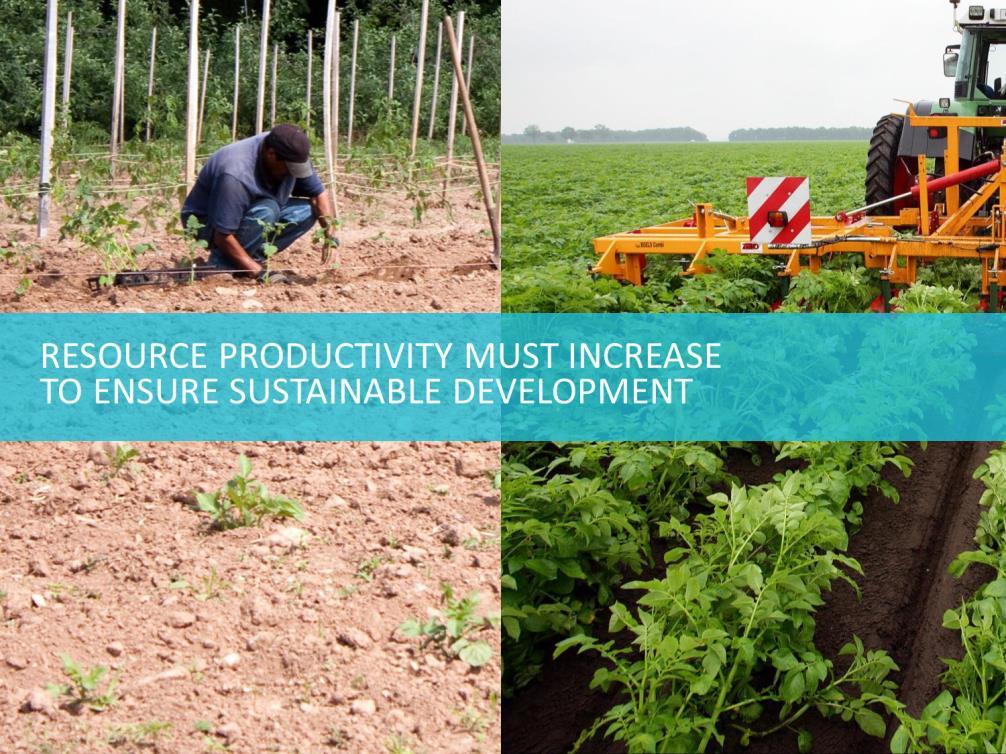
2 THE DAWN OF THE RESOURCE REVOLUTION THE CHALLENGE: THE OPPORTUNITY: 3 billion more middle-class consumers expected to be in the global economy by 2030 $2.9 trillion of savings in 2030 from capturing the resource productivity potential Up to $1.1 trillion spent annually on resource subsidies At least $1 trillion more investment in the resource system needed each year to meet future resource demands SOURCE: McKinsey 2

3


4

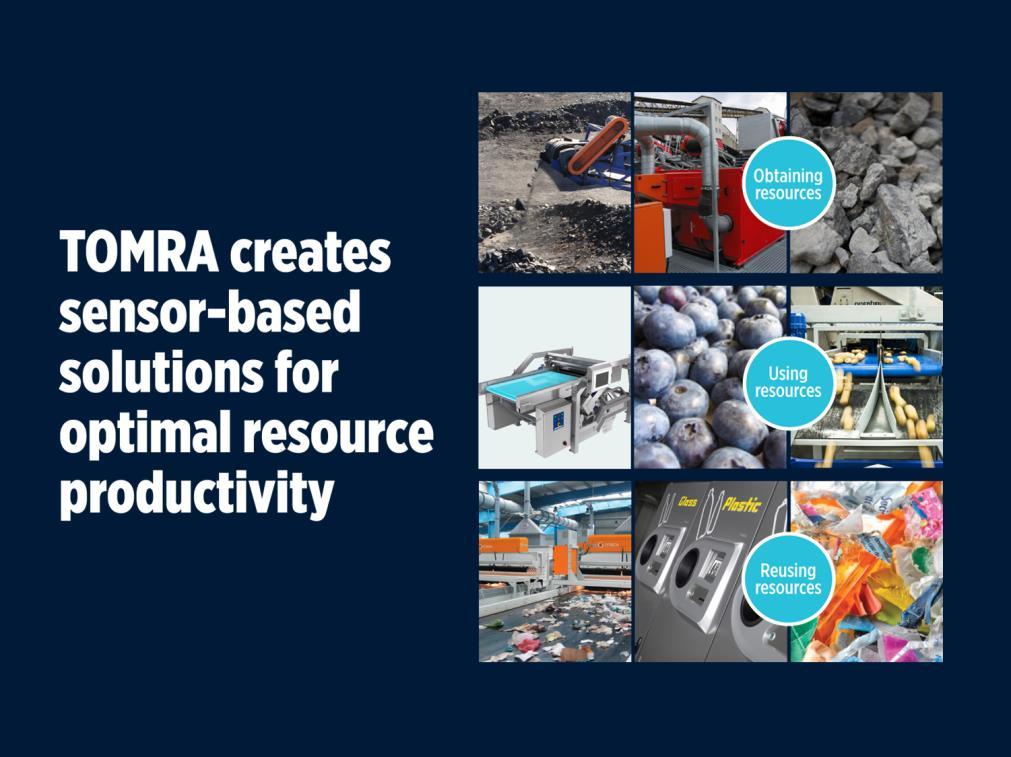
5 Our solutions, in use around the globe, helped keep ~25 millions of tons of CO₂ from being released into the atmosphere in 2017 ~35 bn used beverage containers are captured every year through our reverse vending machines Our steam peelers process ~15 million tons of potatoes per year with a 1% yield improvement over other alternatives ~715,000 tons of metal are recovered every year by our metalrecycling machines 5
6 CREATING VALUE THROUGH TWO STRONG BUSINESS AREAS* 100 % 2017 Revenue 2017 EBITA 100 % 80 % 48% High growth High margins Medium cyclicality 80 % 38% 60 % 60 % 40 % 20 % 52% Stable High margins Low cyclicality 40 % 20 % 62% 0 % 0 % Collection Sorting High technology - sustainable business Collection Sorting * Compac consolidated from 1 February 2017, BBC not included 6
7 TOMRA Collection Solutions 7
 Prince Edwardian Island (2008) Nova Scotia (1996) Norway (1999) Iceland (1989) Denmark (2002) Netherlands (2005) Germany (2006) Sweden (1984) Finland (1996) Estonia (2005)")
8 CURRENT DEPOSIT MARKETS* Northwest Territories (2005) Yukon (1992) British Columbia (1970) Alberta (1972) Saskatchewan (1988) Ontario (2007) Manitoba (2008) Quebec (1984) New Brunswick (1992) Newfoundland (1997) Prince Edwardian Island (2008) Nova Scotia (1996) Norway (1999) Iceland (1989) Denmark (2002) Netherlands (2005) Germany (2006) Sweden (1984) Finland (1996) Estonia (2005) Lithuania (2016) Croatia (2006/2015) Oregon (1972) Iowa (1979) Michigan (1978) New York (1983/2010) Vermont (1973) Maine (1978) Massachusetts (1983) Northern Territory (2013) Connecticut (1980/2010) California (1987) South Australia (1977) New South Wales (Dec 2017) Hawaii (2005) * In addition, TOMRA has some activity in markets with refillable deposit systems like: Austria, Belgium, Chile, Czech Republic, France, Hungary, Poland and South Korea 8

9 ONLY 2% OF THE ANNUAL PLASTIC PRODUCTION IS REUSED FOR SAME/SIMILAR PURPOSE APPLICATION 9

10 POTENTIAL NEW DEPOSIT MARKETS North America: Possible expansion of deposit system in Quebec Scotland: Commitment to a Container Deposit Scheme announced in party program UK: Announced plans for a deposit scheme to reduce plastic pollution. Consultation period to follow Recently approved In progress Spain: Regional initiatives ongoing Australia: NSW introduced deposit from December 2017 QLD announced that they introduce deposit in 2018 Western Australia might introduce in


11 Number of machines installed T-9: THE FIRST OF A NEW GENERATION OF MACHINES In fourth quarter 2013, TOMRA presented the first machine of the new generation of machines to come T-9 features the first 360 degree recognition system applied in an RVM and a completely new industrial design The machine is faster, cleaner and takes all types of beverage containers The launch was successful Large number of machines installed in core markets Key product for replacement sale in e.g. Germany ~4 000 ~4 600 ~ ~
12 # of installed RVM COMPETITIVE LANDSCAPE >80,000 10,000-70,000 5,000-10, ,000 <500 KANSMACKER MA COMPACTION INCOM RVM TECH DIGI >40 Annual revenue from RVM sales Number of RVM markets Source: TOMRA estimates and analysis 12

13 TOMRA Sorting Solutions 13
14 HOW DOES SENSOR BASED SEPARATION WORK? High-tech sensors to identify objects High speed processing of information (material, shape, size, color, defect, damage and location of objects) Precise sorting by air jets or mechanical fingers Product specific equipment design often including multiple technologies to maximize sorting efficiency Feeding of unsorted material High-tech sensors to identify objects High-speed processing of information (material, shape, size, color, defect, damage and location of objects) 14
 Specific and unique spectral properties of reflected light in the")
15 A COMMON SENSOR BASED TECHNOLOGY PORTFOLIO ELECTROMAGNETIC SENSOR (EM) Electro-magnetic properties like conductivity and permeability RECYCLING MINING FOOD LED SPECTOMETRY (LED) Color and spectral properties based on multiple LED light sources in very high optical resolution EM LED NIR NEAR-INFRARED SPECTROSCOPY (NIR) Specific and unique spectral properties of reflected light in the near-infrared spectrum VISIBLE LIGHT SPECTROMETRY (VIS) Specific and unique spectral propertiesof reflected light in the visible spectrum VIS -RAY TRANSMISSION (RT) Atomic density irrespective of surface properties and thickness RT LASER INDUCED BREAKDOWN SPECTROSCOPY (LIBS) Elemental composition LIBS -RAY FLUORESCENCE (RF) Elemental composition LASER COLOR IRT RF INFRARED TRANSMISSION (IRT) Density and shape properties by light absorption IR CAMERA (IR) Heat conductivity and heat dissipation COLOR CAMERA (COLOR) Color properties measured in very high optical resolution LASER REFLECTION/FLUORESCENCE (LASER) Structural, elemental and biological properties by reflection, absorption and fluorescence of laser light 15
16 MARKET SIZE AND POTENTIAL Total annual market size EUR million ~ ~1 320 Market growth Food Mining Market expected to grow at rate of around 7-9% per year A large part of growth from unlocking of dormant potential only possible by developing new applications and technologies Some growth in old world, but faster growth in new world Recycling Source: TOMRA estimates and analysis * Market size for food includes peeling, meat/process analytics, virgin materials and tobacco. 16


17 17


18 OUR BROAD COVERAGE AND TECHNOLOGY BASE IS SETTING US APART IN BULK SORTING POTATOES VEGETABLES NUTS DRIED FRUIT SEEDS & GRAINS Chips, French fries, peeled, specialty products, sweet potatoes, unpeeled, washed LASER, CAMERA, BSI, PULSED LED Beans, beets, broccoli, carrots, corn, cucumbers, industrial spinach, IQF vegetables, jalapenos/peppers, onions, peas, pickles LASER, CAMERA, BSI, PULSED LED Almonds, cashews, hazelnuts, macadamias, peanuts, pecans, pistachios, walnuts LASER, CAMERA, -RAY Apricots, cranberries, dates, figs, prunes, raisins LASER, CAMERA, BSI, -RAY Barley, coffee, corn, dry beans, lentils, oat, pulses, pumpkin, sunflower and watermelon seeds, wheat LASER, CAMERA, BSI, -RAY FRUIT FRESH CUT SEAFOOD MEAT GUMMIES LASER, CAMERA Apples, blackberries, blueberries, cherries, cranberries, peaches & pears, raspberries, strawberries, tomatoes LASER, CAMERA, BSI, PULSED LED Baby leaves, iceberg lettuce, spinach, spring mix LASER, CAMERA Mussels, scallops, seaweed, shrimps, tuna, pet food LASER, CAMERA, BSI, -RAY, INTERACTANCE SPECTROSCOPY Bacon bits, beef, chicken breasts, hot dogs, IQF meat, pork, pork rind, sausages, pet food LASER, CAMERA, BSI, INTERACTANCE SPECTROSCOPY TOBACCO LASER, CAMERA 18


19 TOMRA HAS ESTABLISHED THE BROADEST FOOTPRINT WITHIN FOOD SORTING A B C Free fall Belt Lane SK Rice, Seeds & Kernels NDF Nuts & Dried Fruit PFV Processed Fruits & Veg Fresh Fruit, Vegetables and Potatoes Circa 40%* of annual global sorter sales revenue Circa 30%* of annual global sorter sales revenue Circa 25%* of annual global sorter sales revenue IN HOUSE DEVELOPED CURRENT FOCUS M&A CHANNEL BELT CHUTE LANE/MULTI-DROP BULK SORTING SINGULATED SORTING *Approximately 5% of annual global sorter sales revenue comes from other segments, like confectionary 19
 Market share in targeted segments Bulk Sorting market share*: 25% Lane Sorting market share*: 25% 0-1,000 10-25 markets 25-50 markets >50 markets C Revenue from sensorbased sorting")
20 # of installed machines FOOD COMPETITIVE LANDSCAPE A >3,000 B 1,000-3,000 TOMRA competitive positioning Size (revenues) Widest range of applications (150+) Broadest technology base Geographic reach (~80 countries) Market share in targeted segments Bulk Sorting market share*: 25% Lane Sorting market share*: 25% 0-1, markets markets >50 markets C Revenue from sensorbased sorting and related peripherals Geographic presence Source: TOMRA estimates and analysis *Optical Sorting 20


21 21


22 ONLY A FRACTION OF THE WASTE VOLUME IS HANDLED BY SENSOR BASED SORTING Sensor based sorting is competing with different technologies Landfill Incineration Separate Collection Scavengers Hand Sorting 22


23 RECYCLING: APPLICATIONS AND SENSOR TECHNOLOGY MUNICIPAL SOLID WASTE PACKAGING UPGRADING PLASTICS Hard plastics, plastic film, mixed paper, RDF, metals, organics/biomass NIR, VIS, RT, LASER Plastics, plastic film, cardboard, mixed paper, deinking paper, metal NIR, VIS, EM PET, PE, PP, flakes NIR, VIS, EM POST-SHREDDER ELECTRONIC SCRAP PAPER NF metal, stainless steel, copper cables, copper, brass, aluminum NIR, VIS, RT, RF, EM, COLOR Printed circuit boards, non-ferrous metal concentrates, cables, copper, brass, stainless steel RT, RF, EM, NIR, COLOR Deinking, cardboard, carton NIR, VIS, EM 23
24 # of installed machines RECYCLING COMPETITIVE LANDSCAPE >3,000 1,000-3, ,000 TOMRA competitive positioning Largest installed base Highest revenues Broadest technology platform Highest number of applications and markets served Leading brand Market share: 55-65% markets markets >50 markets Revenue from sensorbased sorting Geographic presence Source: TOMRA estimates and analysis 24

25 Q&A

26 GERMANY REPLACEMENT UPDATE 26


27 BACKLOG DEVELOPMENT AND MOMENTUM ORDER INTAKE ORDER BACKLOG REVENUES Tomra Sorting Solutions (TSS): Delivered all time high order intake of 1,188 MNOK in the quarter, compared to 826 MNOK same quarter last year Revenues came in at 820 MNOK (up from 687 MNOK in 1Q17) With an all time high order intake, and somewhat limited number of orders taken to P/L, the quarter ends with an all time high order backlog of 1,515 MNOK Estimated backlog conversion ratio in 2Q18: 70%* * Based upon current production and delivery plans, the revenues in 2Q18 are estimated to be approximately 70% of order backlog at the end of 1Q18 27


28 OUR FOOD CUSTOMERS 28
29 MNOK NOK per share MNOK MNOK KEY FINANCIALS DEVELOPMENT Revenues Gross Contribution and margin % % 40% 35% 30% 25% 20% 15% 10% 5% % EBITA and margin Earnings per share % 5, % 16% 4,50 4, % 12% 3,50 3, % 2, % 6% 2,00 1, % 2% 1,00 0, % 0, EPS from continued operations, excluding other items 29

30 FINANCIAL HIGHLIGHTS BALANCE SHEET, CASH FLOW AND CAPITAL STRUCTURE Amounts in NOK million 31 March March Dec 2017 ASSETS 8,808 7,927 8,437 Intangible non-current assets 3,673 3,177 3,412 Tangible non-current assets Financial non-current assets Inventory 1,276 1,211 1,197 Receivables 1,917 1,808 1,887 Cash and cash equivalents LIABILITIES AND EQUITY 8,808 7,927 8,437 Equity 4,493 4,301 4,594 Minority interest Interest bearing liabilities 1,668 1,174 1,280 Non-interest bearing liabilities 2,504 2,268 2,420 Cashflow From operations: 120 MNOK (122 MNOK in 1Q 2017) From investments: -502 MNOK (-490 MNOK in 1Q2017) Solidity 53% equity NIBD/EBITDA = 0.8x (Rolling 12 months) Dividend of NOK 2.35 (NOK 2.10 last year) due 8 May
31 CURRENCY +7.2%* TCS: Positive impact from stronger EUR, partly offset by a weaker USD. -7.1%* TSS: Negatively impacted by weak USD vs EUR and NZD. 1Q17 2Q17 3Q17 4Q17 1Q18 *Average rate 1Q18 vs 1Q17 Revenues and expenses per currency; NOTE: Rounded figures EUR* USD NOK NZD OTHER TOTAL Revenues 45 % 45 % 0 % 0 % 10 % 100 % Expenses 40 % 30 % 5 % 5 % 20 % 100 % EBITA 50 % 100 % - 20 % - 20 % -10 % 100 % * EUR includes DKK 31

32 CURRENCY EPOSURE Revenues and expenses per currency; NOTE: Rounded figures * EUR includes DKK 10% change in NOK towards other currencies will impact; Revenues Expenses EBITA EUR* 4.5% 4.0% 5.0% USD 4.5% 3.0% 10.0% NZD 0.0% 0.5% -2.0% OTHER 1.0% 2.0% -1.0% ALL 10.0% 9.5% 12.0% HEDGING POLICY TOMRA hedges B/S items that will have P/L impact on currency fluctuations TOMRA can hedge up to one year of future predicted cash flows. Gains and losses on these hedges are recorded in the finance line, not influencing EBITA * EUR includes DKK 32
33 COLLECTION SOLUTIONS SEGMENT FINANCIALS Revenue development NOK million Gross and EBITA margin development Percent Q 2Q 3Q 4Q Full year GM EBITA 33
34 SORTING SOLUTIONS SEGMENT FINANCIALS Revenue development NOK million Gross and EBITA margin development Percent Q 2Q 3Q 4Q Full year GM EBITA 34

35 DISCLAIMER Copyright The material in this Document (which may be a presentation, video, brochure or other material), hereafter called Document, including copy, photographs, drawings and other images, remains the property of TOMRA Systems ASA or third party contributors where appropriate. No part of this Document may be reproduced or used in any form without express written prior permission from TOMRA Systems ASA and applicable acknowledgements. No trademark, copyright or other notice shall be altered or removed from any reproduction Disclaimer This Document (which may be a presentation, video, brochure or other material), hereafter called Document, may include and be based on, inter alia, forward-looking information and statements that are subject to risks and uncertainties that could cause actual results to differ. The content of this Document may be based on current expectations, estimates and projections about global economic conditions, including the economic conditions of the regions and industries that are major markets for TOMRA Systems ASA and its subsidiaries and affiliates. These expectations, estimates and projections are generally identifiable by statements containing words such as expects, believes, estimates or similar expressions, if not part of what could be clearly characterized as a demonstration case. Important factors that could cause actual results to differ materially from those expectations include, among others, changes in economic and market conditions in the geographic areas and industries that are or will be major markets for TOMRA Systems ASA. Although TOMRA Systems ASA believes that its expectations and the Document are based upon reasonable assumptions, it can give no assurance that those expectations will be achieved or that the actual results will be as set out in the Document. TOMRA Systems ASA does not guarantee the accuracy, reliability or completeness of the Document, and TOMRA Systems ASA (including its directors, officers and employees) accepts no liability whatsoever for any direct or consequential loss arising from the use of this Document or its contents. TOMRA Systems ASA consists of many legally independent entities, constituting their own separate identities. TOMRA is used as the common brand or trade mark for most of these entities. In this Document we may sometimes use TOMRA, TOMRA Systems, we or us when we refer to TOMRA Systems ASA companies in general or where no useful purpose is served by identifying any particular TOMRA Company 35
4 TH QUARTER 2018 RESULTS ANNOUNCEMENT. TOMRA SYSTEMS ASA 4 th Quarter Results
 4 TH QUARTER 2018 RESULTS ANNOUNCEMENT TOMRA SYSTEMS ASA 4 th Quarter Results 21.02.2019 HIGHLIGHTS FROM 2018 Revenues Gross margin Operating expenses EBITA Cashflow Revenues of 8,596 MNOK (7,432 MNOK
2 ND QUARTER 2017 RESULTS ANNOUNCEMENT
 2 ND QUARTER 2017 RESULTS ANNOUNCEMENT TOMRA SYSTEMS ASA 2 nd Quarter Results 19.07.2017 HIGHLIGHTS FROM THE QUARTER Revenues Gross margin Operating expenses EBITA Cashflow TOMRA Collection TOMRA Sorting
Fourth Quarter 2010 Results
 Fourth Quarter 2010 Results 18 February 2011 1 Highlights from the quarter include Improved Group performance: Revenues up 9% (local currencies) Gross margin 41%, up from 33% (or up from 35% adjusted for
2 ND QUARTER 2013 RESULTS ANNOUNCEMENT
 2 ND QUARTER 2013 RESULTS ANNOUNCEMENT TOMRA SYSTEMS ASA 18th of July 2013 HIGHLIGHTS FROM THE QUARTER INCLUDE Revenues Gross margin Revenues of 1,177 MNOK (948 MNOK in second quarter 2012). Organic, currency
SECOND QUARTER and FIRST HALF 2012
 SECOND QUARTER and FIRST HALF 2012 Highlights from second quarter 2012 include: Revenues of 948 MNOK (952 MNOK in second quarter 2011) Unchanged in local currencies +4% in Sorting Solutions - 2% in Collection
Fact Sheet: Deposit Return System: System Performance
 Fact Sheet: Deposit Return System: System Performance In an effort to reduce litter and increase recycling, more and more jurisdictions are turning to deposit return systems (DRSs) for the recovery of
Financial highlights Profit and loss statement
 Third Quarter 2007 Financial highlights Profit and loss statement Figures in NOK million 3Q 2007 3Q 2006 YTD 2007 YTD 2006 Revenues 861 1068 2542 2911 Collection Technology, Deposit Solutions 426 645 1228
YOUR GUIDE TO EASY PROVISIONING
 YOUR GUIDE TO EASY PROVISIONING We believe that you deserve the best vacation; therefore we are happy to provide custom provisioning and beverages exclusively for you. This has been done to save precious
FOURTH QUARTER Highlights from fourth quarter 2008 include:
 FOURTH QUARTER 2008 Highlights from fourth quarter 2008 include: Revenues of 1076 MNOK (947 MNOK in fourth quarter 2007). Positive currency impact by 18% Operating profit of 136 MNOK (131 MNOK in fourth
FOURTH QUARTER Highlights from fourth quarter 2006 include: Strong cash flow from operations of 254 MNOK (131 MNOK in fourth quarter 2005)
") FOURTH QUARTER 2006 Highlights from fourth quarter 2006 include: Revenues of 1,054 MNOK (+56 percent relative to 675 MNOK in fourth quarter 2005) Operating profit of 135 MNOK (79 MNOK in fourth quarter
FOURTH QUARTER 2006 Highlights from fourth quarter 2006 include: Revenues of 1,054 MNOK (+56 percent relative to 675 MNOK in fourth quarter 2005) Operating profit of 135 MNOK (79 MNOK in fourth quarter
CN Tower 301 Front St W. Toronto, ON Environics Analytics FoodSpend. Page 1
 Page 1 Page -1 Table of Contents... 1 Summary... 2 Meat... 3 Fish and Seafood... 4 Dairy Products and Eggs... 5 Bakery Products... 6 Cereal Grains and Cereal Products... 7 Fruit, Fruit Preparations and
FOURTH QUARTER Solid performance in Collection Technology. Continued improved performance and order inflow in Industrial Processing Technology
 FOURTH QUARTER 2009 Highlights from fourth quarter 2009: Solid performance in Collection Continued improved performance and order inflow in Industrial Processing California adversely affected by reduced
Federal Crop Insurance: Specialty Crops
 Federal Crop Insurance: Specialty Crops Updated January 14, 2019 Congressional Research Service https://crsreports.congress.gov R45459 SUMMARY Federal Crop Insurance: Specialty Crops The federal crop insurance
THIRD QUARTER Strong performance in Collection Technology Deposit. Improved performance and outlook in Industrial Processing Technology
 THIRD QUARTER 2009 Highlights from third quarter 2009 include: Strong performance in Collection Technology Deposit Improved performance and outlook in Industrial Processing Technology California negatively
Checklist 2005 Q404 Q105 Q205 Q305
 FY 20 0 Checklist 20 To-do list 20 Status Q404 Q1 Q2 Q3 Integrate TiTech and Orwak Group into TOMRA Successfully complete pilots in the UK and Japan Execute on German opportunity Revitalize and achieve
Income, pensions, spending and wealth
 CHAPTER 18 Income, pensions, spending and wealth After four years of growth, the median after-tax income for Canadian families of two or more people remained virtually stable in 2008 at $63,900. The level
THIRD QUARTER Highlights from third quarter 2005 include: Operating profit of 79 MNOK before restructuring charges (83 MNOK last year)
") THIRD QUARTER 2005 Highlights from third quarter 2005 include: Revenues of 701 MNOK (+5% percent relative to third quarter 2004) Operating profit of 79 MNOK before restructuring charges (83 MNOK last year)
THIRD QUARTER 2005 Highlights from third quarter 2005 include: Revenues of 701 MNOK (+5% percent relative to third quarter 2004) Operating profit of 79 MNOK before restructuring charges (83 MNOK last year)
Financial highlights Profit and loss statement
 Second Quarter 2007 Financial highlights Profit and loss statement Figures in NOK million 2Q 2007 2Q 2006 YTD 2007 YTD 2006 Revenues 887 1020 1681 1843 Collection Technology, Deposit Solutions 430 656
Third Quarter October 2008
 Third Quarter 2008 15 October 2008 Financial Highlights g Profit and loss statement Figures in NOK million 3Q 2008 3Q 2007 YTD 2008 YTD 2007 Revenues 881 861 2546 2542 Collection Technology, Deposit Solutions
STATISTICS CANADA RELEASES 2015 NET FARM INCOME AND FARM CASH RECEIPTS DATA
 STATISTICS CANADA RELEASES 2015 NET FARM INCOME AND FARM CASH RECEIPTS DATA 2015 NET FARM INCOME On May 25, 2016 Statistics Canada released estimates of Net Farm Income for Canada and the provinces for
Gross Domestic Expenditures on Research and Development in Canada (GERD), and the Provinces
, and the Provinces") Catalogue no. 88-221-X Gross Domestic Expenditures on Research and Development in Canada (GERD), and the Provinces National estimates 2002 to 2012 / estimates 2006 to 2010 How to obtain more information
Catalogue no. 88-221-X Gross Domestic Expenditures on Research and Development in Canada (GERD), and the Provinces National estimates 2002 to 2012 / estimates 2006 to 2010 How to obtain more information
Farm Vendor Application
 Janesville Farmers Market Saturdays, 8:00 AM to 1:00 PM, May through October Located on North Main Street Centerway Avenue and Milwaukee Street in Downtown Janesville Updated January 9-2017 Farm Vendor
Financial highlights - 2nd quarter 2002
 Second Quarter 2002 Financial highlights - 2nd quarter 2002 Revenues from continuing operations 670 MNOK, up 4%! Europe 258 MNOK, up 14%! North America 323 MNOK, down 3%! South America 89 MNOK, up 3% 14%
Economic and Social Council
 United Nations ECE/TRADE/C/WP.7/ 2010/16 Economic and Social Council Distr. General 24 November 2010 Original: English Economic Commission for Europe Committee on Trade Working Party on Agricultural Quality
USDA Risk Management
 USDA Risk Management Risk Management Cranberry February 2016 The purpose of the following material is to promote awareness of risk management concepts and to highlight USDA s risk management products,
Investment for Growth. AGM May 2013
 Investment for Growth AGM 2013 22 May 2013 Forward-Looking Statement Any forward-looking statements made in this presentation have been made in good faith based on the information available as of the date
Another strong quarter for TOMRA
 Another strong quarter for TOMRA Strong overall performance Revenues of 1,068 MNOK (+67 percent vs. 641 MNOK in third quarter 2005) Operating profit of 194 MNOK (71 MNOK in third quarter 2005) Cash flow
The Consumer Price Index
 Catalogue no. 62-001-X The Consumer Price Index How to obtain more information For information about this product or the wide range of services and data available from Statistics Canada, visit our website
Map data 2017 Google `
 Map data 2017 Google ` PCensus for MapInfo Page -1 Table of Contents... 1 2017 FoodEx - s Summary... 2 2017 FoodEx - s Stores and Restaurants... 3 2017 FoodEx - s Meat... 4 2017 FoodEx - s Fish and Seafood...
The Consumer Price Index
 Catalogue no. 62-001-X The Consumer Price Index How to obtain more information For information about this product or the wide range of services and data available from Statistics Canada, visit our website
National Crop Insurance Services
 National Crop Insurance Services FEBRUARY 15, 2016 BRANDON WILLIS, ADMINISTRATOR USDA RISK MANAGEMENT AGENCY Market Penetration Crop Category Item 1990 2000 2011 2014 Principle Crops*** NASS Acres* 246,527,700
PROFITS INTO PROGRESS
 PROFITS INTO PROGRESS ANNUAL REPORT 2016 2 TOMRA ANNUAL REPORT 2016 CONTENTS Key Figures 3 Chief Executive Officer s Review 4 Business Overview 6 Group Management 8 Corporate Responsibility Report 10 Environmental
Q4 & PRELIMINARY ANNUAL RESULTS 2015
 Q4 & PRELIMINARY ANNUAL RESULTS 2015 Kristian Røkke and Leif Borge Oslo February 17, 2016 Agenda FOURTH QUARTER HIGHLIGHTS Kristian Røkke CEO FINANCIALS Leif Borge CFO Q & A Kristian Røkke and Leif Borge
The Consumer Price Index
 Catalogue no. 62-001-X The Consumer Price Index How to obtain more information For information about this product or the wide range of services and data available from Statistics Canada, visit our website
Impact of Subsidy and Income Limits on Farm Size Measured at the State, County, and Farm Level
 Impact of Subsidy and Income Limits on Farm Size Measured at the State, County, and Farm Level Mykel Taylor (mtaylor@ksu.edu) and Art Barnaby (barnaby@ksu.edu) Kansas State University Department of Agricultural
Factsheet: Trade in Goods
 Factsheet: Trade in Goods The Korea-Australia Free Trade Agreement (KAFTA) is a comprehensive agreement that, since its entry into force in December 2014, is substantially liberalising trade with Korea
Insolvency Statistics in Canada. September 2015
 Insolvency Statistics in Canada September 2015 List of Tables Table 1: Total Insolvencies... 1 Table 2: Insolvencies Filed by Consumers... 2 Table 3: Insolvencies Filed by Businesses... 3 Table 4: Insolvencies
STATISTICS CANADA RELEASES 2016 GDP DATA
 STATISTICS CANADA RELEASES 2016 GDP DATA On November 8, 2017 Statistics Canada released Provincial Gross Domestic Product (GDP) data for 2016 as well as revisions for 2011 to 2015. The PEI GDP at market
2019 The City of Seven Hills Farmers Market Vendor Application Application Fee $20.00
 2019 The City of Seven Hills Farmers Market Vendor Application Application Fee $20.00 Farm/Business Name: Owner/Main Contact Name(s): Mailing Address: City: State: Zip Code: Primary Phone: Alternate Phone:
Your Aquaculture Technology and Service Partner. Q Presentation Oslo - May 8 th, 2015 Trond Williksen, CEO Eirik Børve Monsen, CFO
 Q1 2015 Presentation Oslo - May 8 th, 2015 Trond Williksen, CEO Eirik Børve Monsen, CFO Agenda 1 Highlights 2 Financial performance 3 Outlook 4 Q&A Highlights Q1 2015 - by CEO Trond Williksen 3 On track
Net interest income on average assets and liabilities Table 75
 Supplementary information Net interest income on average assets and liabilities Table 75 balances Interest rate (Millions of dollars, except for percentage amounts) 2014 2013 2012 (1) 2014 2013 2012 (1)
Report on Finnish Technology Industry Exports
 Report on Finnish Technology Industry Exports Last observation October 2018, 2.1.2019 Goods Export of Technology Industry from Finland Goods Export of Technology Industry from Finland by Branches Source:
1Q 2018 Fornebu, April 27, 2018 Luis Araujo and Svein Stoknes
 1Q 2018 Fornebu, April 27, 2018 Luis Araujo and Svein Stoknes Agenda 1Q 2018 Answers Questions Introduction Luis Araujo Chief Executive Officer Financials Svein Stoknes Chief Financial Officer Q&A Session
The Consumer Price Index
 Catalogue no. 62-001-X The Consumer Price Index How to obtain more information Specific inquiries about this product and related statistics or services should be directed to: Client Services Unit, Consumer
4Q 2018 Fornebu, February 8, 2019 Luis Araujo and Svein Stoknes
 4Q 2018 Fornebu, February 8, 2019 Luis Araujo and Svein Stoknes Agenda 4Q 2018 Answers Questions Introduction Luis Araujo Chief Executive Officer Financials Svein Stoknes Chief Financial Officer Q&A Session
Payroll Taxes in Canada from 1997 to 2007
 Payroll Taxes in Canada from 1997 to 2007 This paper describes the changes in the structure of payroll taxes in Canada and the provinces during the period 1997-2007. We report the average payroll tax per
2018 The City of Seven Hills Farmers' Market Vendor Application
 2018 The City of Seven Hills Farmers' Market Vendor Application Farm/Business Name: Owner/Main Contact Name(s): Mailing Address: City: State: Zip Code: Primary Phone: Alternate Phone: Email: FAX: Farm/Business
Recommendation of the Council on Establishing and Implementing Pollutant Release and Transfer Registers (PRTRs)
") Recommendation of the Council on Establishing and Implementing Pollutant Release and Transfer Registers (PRTRs) OECD Legal Instruments This document is published under the responsibility of the Secretary-General
Recommendation of the Council on Establishing and Implementing Pollutant Release and Transfer Registers (PRTRs) OECD Legal Instruments This document is published under the responsibility of the Secretary-General
Declaration on Environmental Policy
 Declaration on Environmental Policy OECD Legal Instruments This document is published under the responsibility of the Secretary-General of the OECD. It reproduces an OECD Legal Instrument and may contain
2 CEO's operational report. Arni Oddur Thordarson, CEO
 1 2 CEO's operational report Arni Oddur Thordarson, CEO 2.1 Year of strategic moves and solid performance CEO's operational report Strategic acquisitions and strong organic growth On the Icelandic Stock
Insolvency Statistics in Canada. April 2013
 Insolvency Statistics in Canada April 2013 List of Tables Table 1: Total Insolvencies... 1 Table 2: Insolvencies Filed by Consumers... 2 Table 3: Insolvencies Filed by Businesses... 3 Table 4: Insolvencies
Approach to Employment Injury (EI) compensation benefits in the EU and OECD
 compensation benefits in the EU and OECD") Approach to (EI) compensation benefits in the EU and OECD The benefits of protection can be divided in three main groups. The cash benefits include disability pensions, survivor's pensions and other short-
Approach to (EI) compensation benefits in the EU and OECD The benefits of protection can be divided in three main groups. The cash benefits include disability pensions, survivor's pensions and other short-
3Q 2018 Fornebu, October 24, 2018 Luis Araujo and Svein Stoknes
 3Q 2018 Fornebu, October 24, 2018 Luis Araujo and Svein Stoknes Agenda 3Q 2018 Answers Questions Introduction Luis Araujo Chief Executive Officer Financials Svein Stoknes Chief Financial Officer Q&A Session
Crop Insurance Options for Organic Producers
 Crop Insurance Options for Organic Producers Harriet Behar Michael Stein This guidebook and webinar are funded in partnership with USDA, Risk Management Agency, under Award #RMI7RMEPPS22CO14 1 Why Crop
2016 Crop Insurance Update
 Risk Management Agency 2016 Crop Insurance Update Maryland Annual Crop Insurance Conference RMA Associate Administrator Michael A. Alston September 13, 2016 General Overview Program Snapshot 1 Maryland
Q2 & 1H Results 2016 Kristian Røkke and Leif H. Borge Oslo July 14, 2016
 First Quarter Results 2017 Kristian Røkke and Leif Borge Oslo May 3, 2017 Webside endring Q2 & 1H Results 2016 Kristian Røkke and Leif H. Borge Oslo July 14, 2016 2016 Akastor First Quarter Results 2017
The European economy since the start of the millennium
 The European economy since the start of the millennium A STATISTICAL PORTRAIT 2018 edition 1 Since the start of the millennium, the European economy has evolved and statistics can help to better perceive
May Marketing Generalities. U-pick (n=13) Range (price per pound) Average (price per pound) Average. Range (price per pound)
 Range (price per pound) Average (price per pound) Average. Range (price per pound)") Alberta Direct Market Berry & Vegetable Prices 2012 / 2013 A number of farms contributed their pricing information, with a wide range in size, diversity and operational focus. As well, prices reported
Alberta Direct Market Berry & Vegetable Prices 2012 / 2013 A number of farms contributed their pricing information, with a wide range in size, diversity and operational focus. As well, prices reported
7 CFR Parts 900, 1150, 1160, 1205, 1206, 1207, 1208, 1209, 1210, 1212, 1214, 1215, 1216, 1217, 1218, 1219, 1220, 1221, 1222,
 This document is scheduled to be published in the Federal Register on 12/16/2014 and available online at http://federalregister.gov/a/2014-29280, and on FDsys.gov DEPARTMENT OF AGRICULTURE Agricultural
Green Climate Fund Trust Fund Financial Report as of 31 December 2015
 Meeting of the Board 8 10 March 2016 Songdo, Incheon, Republic of Korea Provisional agenda item 25 GCF/B.12/Inf.09 4 March 2016 Green Climate Fund Financial Report as of 31 December 2015 Summary The financial
The Consumer Price Index
 Catalogue no. 62-001-X The Consumer Price Index How to obtain more information Specific inquiries about this product and related statistics or services should be directed to: Client Services Unit, Prices
Canada s Pension Landscape Percentage of assets by province/territory
 Methodology Part 1: The research is based on the top 1,000 pension plans in Canada, which have a total asset value of $1.12 trillion, as collected by Rogers Canadian Institutional Investment Network (CIIN).
How CETA Will Benefit
 Opening New Markets in Europe Creating Jobs and Opportunities for Canadians How CETA Will Benefit Saskatchewan Creating jobs and opportunities for Saskatchewanians The Canada-European Union Comprehensive
Consumer Price Index, December 2013 Released at 8:30 a.m. Eastern time in The Daily, Friday, January 24, 2014
 Consumer Price Index, Released at 8:30 a.m. Eastern time in The Daily, Friday, January 24, 2014 The Consumer Price Index (CPI) rose 1.2% in the 12 months to, following a 0.9% increase in November. Chart
Norsk Gjenvinning Group 3rd Quarter 2018 Erik Osmundsen, CEO and Dean Zuzic, CFO
 Norsk Gjenvinning Group 3rd Quarter 2018 Erik Osmundsen, CEO and Dean Zuzic, CFO Disclaimer VV Holding AS is providing the following interim financial statements for Q3 2018 to holders of its NOK 2,126,000,000
SKAGEN Tellus Status Report February 2017
 SKAGEN Tellus Status Report February 2017 Key numbers as of 28 February 2017 EUR, net of fees February QTD 2016 1 years 3 years 5 years Since inception* SKAGEN Tellus 1,6% 0,7% 5,7% 5,5% 5,9% 4,7% 5,4%
Financial highlights Profit and loss statement
 First Quarter 2007 Financial highlights Profit and loss statement Figures in NOK million Revenues Collection Technology, Deposit Solutions Materials Handling Industrial Processing Technology Collection
The Fiscal 2015 Economic Impact of Finance PEI and Island Investment Development Inc. Supported Firms. November 2017
 The Fiscal 2015 Economic Impact of Finance PEI and Island Investment Development Inc. Supported Firms November 2017 The Fiscal 2015 Economic Impact of Finance PEI and Island Investment Development Inc.
Year end report. January-December st of January 2018 Mikael Ericson, President and CEO Erik Forsberg, CFO
 Year end report January-December 2017 31 st of January 2018 Mikael Ericson, President and CEO Erik Forsberg, CFO Agenda 1. Highlights for the fourth quarter and FY 2017 2. Key messages from Capital Markets
Net interest income on average assets and liabilities Table 66
 Supplemental information Net interest income on average assets and liabilities Table 66 Average balances Interest (1) Average rate (C$ millions, except percentage amounts) 2009 2008 2007 2009 2008 2007
4Q16. Fornebu, February 9, 2017 Luis Araujo and Svein Stoknes Aker Solutions
 4Q16 Fornebu, February 9, 2017 Luis Araujo and Svein Stoknes Agenda Introduction Luis Araujo Chief Executive Officer Q&A Session Luis Araujo Svein Stoknes Financials Svein Stoknes Chief Financial Officer
Economic Stimulus Packages and Steel: A Summary
 Economic Stimulus Packages and Steel: A Summary Steel Committee Meeting 8-9 June 2009 Sources of information on stimulus packages Questionnaire to Steel Committee members, full participants and observers
Turkey: Recent Developments and Future Prospects. ISBANK Economic Research Division October 2018
 Turkey: Recent Developments and Future Prospects ISBANK Economic Research Division October 2018 Macroeconomic Outlook Strong Economic Growth Cycle GDP of 851 bn USD (2017), 10.6k USD (2017) per capita
Second quarter Vestas Wind Systems A/S. Copenhagen, 18 August Classification: Public
 Second quarter Vestas Wind Systems A/S Copenhagen, 18 August Disclaimer and cautionary statement This presentation contains forward-looking statements concerning Vestas' financial condition, results of
Second-Quarter Results 2014
 2Q Second-Quarter Results 214 Fornebu, July 17, 214 Øyvind Eriksen and Leif Borge 214 Aker Solutions Slide 1 July 17, 214 Second-quarter results 214 Agenda 2Q 214 Introduction Øyvind Eriksen Chairman Financials
Trends in Labour Productivity in Alberta
 Trends in Labour Productivity in Alberta July 2012 -2- Introduction Labour productivity is the single most important determinant in maintaining and enhancing sustained prosperity 1. Higher productivity
Norsk Gjenvinning Group 3rd Quarter 2017 Erik Osmundsen, CEO and Dean Zuzic, CFO
 Norsk Gjenvinning Group 3rd Quarter 2017 Erik Osmundsen, CEO and Dean Zuzic, CFO Disclaimer VV Holding AS is providing the following interim financial statements for Q3 2017 to holders of its NOK 2,235,000,000
ALLEN FARMERS MARKET
 ALLEN FARMERS MARKET 2016/2017 INDOOR SEASON Farmer Application Your Name: _ Business Name: Farm Location: Reimbursement checks should be made out to: Mailing Address: City: Zip: E-Mail: Cell Phone: Home
Important Notes About This Guide:
 Important Notes About This Guide: 1. Ingredients and menu items are subject to change or substitution without notice. 2. The review of allergens is limited to the 8 most common food allergens: Soy, Wheat,
Recommendation of the Council on Tax Avoidance and Evasion
 Recommendation of the Council on Tax Avoidance and Evasion OECD Legal Instruments This document is published under the responsibility of the Secretary-General of the OECD. It reproduces an OECD Legal Instrument
Q results. April 27, 2018
 Q1 2018 results April 27, 2018 Consolidated financial statements as of March 31, 2018 were authorized for issue by the Board of Directors held on April 26, 2018. Q118 KEY HIGHLIGHTS Q1 2018 in line with
WELCOME TO RITEWAY PROVISIONING. Dining Made Easy!
 WELCOME TO RITEWAY PROVISIONING Dining Made Easy! We at RITEWAY FOOD MARKETS believe that you deserve the best; therefore we have taken an extra step to provide custom provisioning and beverages exclusively
Second Quarter
 Second Quarter 2005 0 Financial highlights NOK million 2Q 05 2Q 04 YTD 05 YTD 04 Revenue 687 591 1,286 1,184 RVM Technology 278 301 528 619 Collection & Materials Handling 213 206 400 395 Recycling Technology
Trends in Labour Productivity in Alberta
 Trends in Labour Productivity in Alberta June 2016 -2- Introduction Labour productivity is the single most important determinant in maintaining and enhancing sustained prosperity for Albertans. Higher
Harmonised Transparency Template
 Harmonised Transparency Template SWEDEN Swedbank Mortgage AB Reporting Date: [30/06/17] Cut-off Date: [30/06/17] Index Worksheet A: HTT General Worksheet B1: HTT Mortgage Assets Worksheet B2: HTT Public
Harmonised Transparency Template
 Harmonised Transparency Template SWEDEN Swedbank Mortgage AB Reporting Date: [30/09/18] Cut-off Date: [30/09/18] Index Worksheet A: HTT General Worksheet B1: HTT Mortgage Assets Worksheet B2: HTT Public
PIMCO Global Advantage Government Bond Index. Index Specification
 PIMCO Global Advantage Government Bond Index January 2011 Contents 1 Index Overview... 3 2 Country Classification and Eligibility Rules... 5 2.1 Regional Classification... 5 2.2 Instrument Categories...
TRANSFORMS ANNUAL REPORT 2011
 ANNUAL REPORT 2011 TRANSFORMS contents Key Figures 3 Chief Executive Officer s Review 4 Business Overview 8 Corporate Responsibility Report 10 Environmental Review 12 Social and Ethical Review 14 Corporate
Norsk Gjenvinning Group 3rd Quarter 2017 Erik Osmundsen, CEO and Dean Zuzic, CFO
 Norsk Gjenvinning Group 3rd Quarter 2017 Erik Osmundsen, CEO and Dean Zuzic, CFO Disclaimer VV Holding AS is providing the following interim financial statements for Q3 2017 to holders of its NOK 2,235,000,000
BC JOBS PLAN ECONOMY BACKGROUNDER. Current statistics show that the BC Jobs Plan is working: The economy is growing and creating jobs.
 We know that uncertainty continues to remain in the global economy and we expect to see some monthly fluctuations in jobs numbers. That is why we will continue to create an environment that is welcoming
Expanding our presence in Central Europe. Jorge da Motta Regional President, Central Europe
 Expanding our presence in Central Europe Jorge da Motta Regional President, Central Europe Caution on Forward-Looking Statements Today s presentations contain forward-looking statements. These statements
Tax Refund Policies of Different Countries
 Remark: The following information is for reference only. Information is updated as of 16 May 2016 and provided by Transforex Currency Exchange Co., Ltd. ( TransForex ). Since the tax refund policy of different
Canada Indonesia. Michaël Lambert-Racine. Publication No E 12 June 2014
 Canada Indonesia Publication No. 2014-59-E 12 June 2014 Michaël Lambert-Racine Economics, Resources and International Affairs Division Parliamentary Information and Research Service The Library of Parliament
The First Case of FTA Compensation for Income Loss on Food Crops in Korea
 The First Case of FTA Compensation for Income Loss on Food Crops in Korea Sung-Jae Chun Public-Service Advocate of Korea FTA compensation for income loss will be given to sorghum, potato, sweet potato,
Q2 & 1H Results 2016 Kristian Røkke and Leif H. Borge Oslo July 14, 2016
 First Quarter Results 2018 Karl Erik Kjelstad (CEO) and Leif Borge (CFO) Fornebu May 3, 2018 Webside endring Q2 & 1H Results 2016 Kristian Røkke and Leif H. Borge Oslo July 14, 2016 2018 Akastor First
Move to T+2 settlement cycle: Singapore market
 Move to T+2 settlement cycle: Singapore market Lum Yong Teng 20 May 2015 Singapore Exchange Contents 1 Overview of Singapore market 2 Drivers for SGX to move to T+2 settlement cycle 3 Benefits for the
Q2 & 1H Results 2016 Kristian Røkke and Leif H. Borge Oslo July 14, 2016
 Third Quarter Results 2017 Kristian Røkke and Leif Borge Fornebu October 25, 2017 Webside endring Q2 & 1H Results 2016 Kristian Røkke and Leif H. Borge Oslo July 14, 2016 2017 Akastor First Quarter Results
Spain France. England Netherlands. Wales Ukraine. Republic of Ireland Czech Republic. Romania Albania. Serbia Israel. FYR Macedonia Latvia
 Germany Belgium Portugal Spain France Switzerland Italy England Netherlands Iceland Poland Croatia Slovakia Russia Austria Wales Ukraine Sweden Bosnia-Herzegovina Republic of Ireland Czech Republic Turkey
Third Quarter
 Third Quarter 2005 0 Financial highlights NOK million 3Q 05 3Q 04 YTD 05 YTD 04 Revenues 701 665 1987 1849 RVM Technology 299 303 827 922 Collection & Materials Handling 247 237 647 632 Recycling Technology
InnovFin SME Guarantee
 InnovFin SME Guarantee Implementation Update Reporting date: 30/09/2017 Disclaimer This presentation contains general information about the implementation results of InnovFin SME Guarantee, a facility