FOR LEASE SUGARCREEK VILLAGE SW Freeway, Sugar Land, Texas 77478
|
|
|
- Tracy Williams
- 5 years ago
- Views:
Transcription


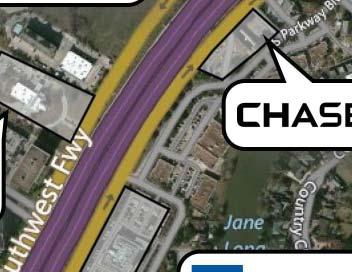
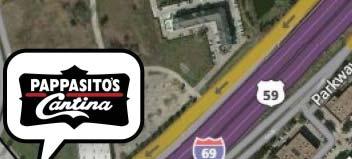
1 FOR LEASE SUGARCREEK VILLAGE SW Freeway, Sugar Land, Texas Property Features: 4,150 Sq. Ft. End Cap on Sugar Creek Boulevard available 1,480 Sq. Ft. available 12/1/18 Anchored by Fishing Tackle Unlimited & Ferguson Bath, Kitchen & Lighting Gallery Great access to Southwest Freeway Tenants Include: Demographics: 1-mile 3-miles 5-miles Est. Population 4,110 97, ,220 Avg. HH Income $194,418 $116,024 $108,522 Year: 2018 Source: Applied Geographic Solutions Traffic Counts: Southwest Freeway Year: 2015 Source: TxDOT 193,000 CPD FOR MORE INFORMATION CONTACT: KRISTEN CAVANAUGH (713) BISSONNET, STE 100 BELLAIRE, TEXAS The information contained herein, while based upon data supplied by sources deemed reliable, is subject to errors or omissions and is not, in any way, warranted by United Equities, Inc. or by any agent, independent associate, subsidiary or employee of United Equities, Inc. This information is subject to change without notice.
2 SITE PLAN: SUGARCREEK VILLAGE SHOPPING CENTER SOUTHWEST FREEWAY SUGAR LAND, TEXAS SUITE TENANT SQ. FT BERRYHILL TAMALES & TACOS 6, TEXAS FOOT SPECIALISTS 2, STATE FARM INSURANCE 1, PLATO S CLOSET 3, B/C AWAKENED YOGA 4, PRESTIGE PORTRAITS 3, RIVER OAKS CLEANERS 3, AVAILABLE 4, A.M. LASH STUDIO 1, FIRE IT UP POTTERY 2, PRINCESS SALON & SPA 1, MARIA YARI BEAUTY SALON 1, MARS DISCOUNT VACUUMS 1, SPEC S LIQUORS 4, CVS PHARMACY 8, FISHING TACKLE UNLIMITED 27, FERGUSON BATH, KITCHEN & LIGHTING GALLERY 13, KUMON MATH/READING CENTER 1, MYSTIC DESSERT BAR 3, A DEEP ROOTS FLORAL STUDIO (AVAIL 12/1/18) 1, ROBERT MARKOFF, DDS 1, RED WING SHOES 1, NUTRITION DEPOT 2, COLACHI BBQ & GRILL 2, LONE STAR CRYOTHERAPY 1, SUGAR LAND DIALYSIS 8, SUBWAY 1, AMBASSADOR SHOE REPAIR TEXAS STATE OPTICAL T.J. CINNAMONS 1, JACK S CARPET 4, SERENITEA TEA ROOM 1, ELEGANT NAILS 1, RELAX PLAZA FINISH LINE SPORTS EDUARD JORJ SALON 1,860 TOTAL SQ. FT. 131,648


3
4 FULL PROFILE Census, 2018 Estimates with 2023 Projections Calculated using Weighted Block Centroid from Block Groups Lat/Lon: / SugarCreek Village Shopping Center 1 mi radius 3 mi radius 5 mi radius RF1 POPULATION HOUSEHOLDS AGE MARITAL STATUS & GENDER INCOME 2018 Estimated Population 4,110 97, , Projected Population 4, , , Census Population 3,872 90, , Census Population 4,016 80, ,220 Projected Annual Growth 2018 to % 3.5% 2.9% Historical Annual Growth 2000 to % 1.2% 1.9% 2018 Estimated Households 1,623 34, , Projected Households 1,880 40, , Census Households 1,544 32,444 95, Census Households 1,467 27,297 77,953 Projected Annual Growth 2018 to % 3.2% 2.8% Historical Annual Growth 2000 to % 1.6% 2.0% 2018 Est. Population Under 10 Years 7.3% 11.7% 13.2% 2018 Est. Population 10 to 19 Years 9.6% 13.5% 14.7% 2018 Est. Population 20 to 29 Years 8.9% 14.2% 13.7% 2018 Est. Population 30 to 44 Years 11.8% 18.9% 20.0% 2018 Est. Population 45 to 59 Years 22.4% 21.3% 21.1% 2018 Est. Population 60 to 74 Years 28.3% 15.1% 13.1% 2018 Est. Population 75 Years or Over 11.7% 5.3% 4.2% 2018 Est. Median Age Est. Male Population 48.6% 48.7% 49.0% 2018 Est. Female Population 51.4% 51.3% 51.0% 2018 Est. Never Married 23.1% 29.8% 33.0% 2018 Est. Now Married 59.8% 50.8% 48.3% 2018 Est. Separated or Divorced 9.4% 13.9% 14.0% 2018 Est. Widowed 7.7% 5.6% 4.7% 2018 Est. HH Income $200,000 or More 36.6% 12.7% 12.0% 2018 Est. HH Income $150,000 to $199, % 9.5% 8.1% 2018 Est. HH Income $100,000 to $149, % 18.3% 15.4% 2018 Est. HH Income $75,000 to $99, % 13.3% 11.8% 2018 Est. HH Income $50,000 to $74, % 17.0% 16.9% 2018 Est. HH Income $35,000 to $49, % 10.7% 11.5% 2018 Est. HH Income $25,000 to $34, % 6.7% 8.2% 2018 Est. HH Income $15,000 to $24, % 5.4% 7.8% 2018 Est. HH Income Under $15, % 6.4% 8.2% 2018 Est. Average Household Income $194,418 $116,024 $108, Est. Median Household Income $155,154 $89,552 $85, Est. Per Capita Income $77,006 $41,463 $35,870 This report was produced using data from private and government sources deemed to be reliable. The information herein is provided without representation or warranty Est. Total Businesses 1,171 7,015 13, Est. Total Employees 17,002 83, , , Sites USA, Chandler, Arizona, page 1 of 3 Demographic Source: Applied Geographic Solutions 04/2018, TIGER Geography
5 FULL PROFILE Census, 2018 Estimates with 2023 Projections Calculated using Weighted Block Centroid from Block Groups Lat/Lon: / SugarCreek Village Shopping Center 1 mi radius 3 mi radius 5 mi radius RF1 RACE HISPANIC EDUCATION (Adults 25 or Older) HOUSING HOMES BUILT BY YEAR HOME VALUES 2018 Est. White 58.1% 38.8% 34.0% 2018 Est. Black 8.7% 15.1% 22.4% 2018 Est. Asian or Pacific Islander 28.0% 36.7% 30.9% 2018 Est. American Indian or Alaska Native 0.2% 0.4% 0.4% 2018 Est. Other Races 5.0% 9.1% 12.2% 2018 Est. Hispanic Population ,599 83, Est. Hispanic Population 14.4% 20.0% 26.2% 2023 Proj. Hispanic Population 15.0% 20.3% 26.1% 2010 Hispanic Population 8.2% 18.5% 26.1% 2018 Est. Adult Population (25 Years or Over) 3,211 66, , Est. Elementary (Grade Level 0 to 8) 3.9% 5.3% 8.1% 2018 Est. Some High School (Grade Level 9 to 11) 2.8% 5.3% 7.0% 2018 Est. High School Graduate 11.7% 16.7% 20.0% 2018 Est. Some College 17.0% 20.0% 19.0% 2018 Est. Associate Degree Only 5.1% 7.1% 6.7% 2018 Est. Bachelor Degree Only 39.3% 29.4% 24.8% 2018 Est. Graduate Degree 20.3% 16.0% 14.4% 2018 Est. Total Housing Units 1,652 35, , Est. Owner-Occupied 89.8% 63.2% 63.2% 2018 Est. Renter-Occupied 8.4% 34.6% 33.8% 2018 Est. Vacant Housing 1.8% 2.2% 3.0% 2010 Homes Built 2005 or later 1.1% 3.0% 2.7% 2010 Homes Built 2000 to % 18.4% 22.0% 2010 Homes Built 1990 to % 24.7% 22.4% 2010 Homes Built 1980 to % 30.7% 26.8% 2010 Homes Built 1970 to % 21.4% 25.7% 2010 Homes Built 1960 to % 2.4% 3.6% 2010 Homes Built 1950 to % 1.6% 2.1% 2010 Homes Built Before % 1.9% 1.7% 2010 Home Value $1,000,000 or More - 0.6% 1.0% 2010 Home Value $500,000 to $999, % 7.0% 10.1% 2010 Home Value $400,000 to $499, % 5.9% 8.6% 2010 Home Value $300,000 to $399, % 18.3% 16.0% 2010 Home Value $200,000 to $299, % 34.6% 26.2% 2010 Home Value $150,000 to $199, % 17.6% 16.0% 2010 Home Value $100,000 to $149, % 15.3% 18.8% 2010 Home Value $50,000 to $99, % 5.2% 10.8% 2010 Home Value $25,000 to $49, % 0.9% 1.5% 2010 Home Value Under $25, % 1.2% 1.6% 2010 Median Home Value $331,353 $241,292 $228, Median Rent $1,585 $1,118 $968 This report was produced using data from private and government sources deemed to be reliable. The information herein is provided without representation or warranty. 2018, Sites USA, Chandler, Arizona, page 2 of 3 Demographic Source: Applied Geographic Solutions 04/2018, TIGER Geography
6 FULL PROFILE Census, 2018 Estimates with 2023 Projections Calculated using Weighted Block Centroid from Block Groups Lat/Lon: / SugarCreek Village Shopping Center 1 mi radius 3 mi radius 5 mi radius RF1 LABOR FORCE OCCUPATION TRANSPORTATION TO WORK TRAVEL TIME CONSUMER EXPENDITURE 2018 Est. Labor Population Age 16 Years or Over 3,575 78, , Est. Civilian Employed 59.9% 62.9% 63.8% 2018 Est. Civilian Unemployed 1.1% 2.6% 3.4% 2018 Est. in Armed Forces Est. not in Labor Force 39.1% 34.5% 32.8% 2018 Labor Force Males 48.1% 47.8% 48.3% 2018 Labor Force Females 51.9% 52.2% 51.7% 2010 Occupation: Population Age 16 Years or Over 2,136 49, , Mgmt, Business, & Financial Operations 33.6% 20.6% 17.0% 2010 Professional, Related 27.5% 28.4% 25.0% 2010 Service 5.1% 13.0% 16.9% 2010 Sales, Office 27.6% 25.4% 24.2% 2010 Farming, Fishing, Forestry % 2010 Construction, Extraction, Maintenance 3.3% 5.8% 7.9% 2010 Production, Transport, Material Moving 3.0% 6.7% 8.9% 2010 White Collar Workers 88.7% 74.4% 66.1% 2010 Blue Collar Workers 11.3% 25.6% 33.9% 2010 Drive to Work Alone 85.3% 82.6% 80.6% 2010 Drive to Work in Carpool 5.6% 8.4% 10.6% 2010 Travel to Work by Public Transportation 1.2% 2.7% 2.7% 2010 Drive to Work on Motorcycle Walk or Bicycle to Work 0.7% 0.9% 0.9% 2010 Other Means - 0.4% 0.6% 2010 Work at Home 7.1% 5.0% 4.7% 2010 Travel to Work in 14 Minutes or Less 25.2% 22.6% 17.5% 2010 Travel to Work in 15 to 29 Minutes 31.2% 32.0% 32.0% 2010 Travel to Work in 30 to 59 Minutes 47.0% 42.1% 43.6% 2010 Travel to Work in 60 Minutes or More 4.4% 6.8% 8.8% 2010 Average Travel Time to Work Est. Total Household Expenditure $189 M $2.73 B $7.82 B 2018 Est. Apparel $6.75 M $96.5 M $277 M 2018 Est. Contributions, Gifts $17.3 M $209 M $594 M 2018 Est. Education, Reading $9.56 M $120 M $341 M 2018 Est. Entertainment $10.9 M $155 M $444 M 2018 Est. Food, Beverages, Tobacco $26.5 M $404 M $1.16 B 2018 Est. Furnishings, Equipment $6.95 M $97.2 M $276 M 2018 Est. Health Care, Insurance $15.3 M $228 M $655 M 2018 Est. Household Operations, Shelter, Utilities $58.6 M $844 M $2.42 B 2018 Est. Miscellaneous Expenses $2.57 M $38.9 M $111 M 2018 Est. Personal Care $2.40 M $35.2 M $101 M 2018 Est. Transportation $32.7 M $504 M $1.44 B This report was produced using data from private and government sources deemed to be reliable. The information herein is provided without representation or warranty. 2018, Sites USA, Chandler, Arizona, page 3 of 3 Demographic Source: Applied Geographic Solutions 04/2018, TIGER Geography

7 Information About Brokerage Services Texas law requires all real estate license holders to give the following informa on about brokerage services to prospec ve buyers, tenants, sellers and landlords TYPES OF REAL ESTATE LICENSE HOLDERS:. A BROKER is responsible for all brokerage ac vi es, including acts performed by sales agents sponsored by the broker. A SALES AGENT must be sponsored by a broker and works with clients on behalf of the broker. A BROKER S MINIMUM DUTIES REQUIRED BY LAW (A client is the person or party that the broker represents): Put the interests of the client above all others, including the broker s own interests; Inform the client of any material informa on about the property or transac on received by the broker; Answer the client s ques ons and present any offer to or counter-offer from the client; and Treat all par es to a real estate transac on honestly and fairly. A LICENSE HOLDER CAN REPRESENT A PARTY IN A REAL ESTATE TRANSACTION: AS AGENT FOR OWNER (SELLER/LANDLORD): The broker becomes the property owner's agent through an agreement with the owner, usually in a wri en lis ng to sell or property management agreement. An owner's agent must perform the broker s minimum du es above and must inform the owner of any material informa on about the property or transac on known by the agent, including informa on disclosed to the agent or subagent by the buyer or buyer s agent. AS AGENT FOR BUYER/TENANT: The broker becomes the buyer/tenant's agent by agreeing to represent the buyer, usually through a wri en representa on agreement. A buyer's agent must perform the broker s minimum du es above and must inform the buyer of any material informa on about the property or transac on known by the agent, including informa on disclosed to the agent by the seller or seller s agent. AS AGENT FOR BOTH - INTERMEDIARY: To act as an intermediary between the par es the broker must first obtain the wri en agreement of each party to the transac on. The wri en agreement must state who will pay the broker and, in conspicuous bold or underlined print, set forth the broker's obliga ons as an intermediary. A broker who acts as an intermediary: Must treat all par es to the transac on impar ally and fairly; May, with the par es' wri en consent, appoint a different license holder associated with the broker to each party (owner and buyer) to communicate with, provide opinions and advice to, and carry out the instruc ons of each party to the transac on. Must not, unless specifically authorized in wri ng to do so by the party, disclose: ᴑ that the owner will accept a price less than the wri en asking price; ᴑ ᴑ that the buyer/tenant will pay a price greater than the price submi ed in a wri en offer; and any confiden al informa on or any other informa on that a party specifically instructs the broker in wri ng not to disclose, unless required to do so by law. AS SUBAGENT: A license holder acts as a subagent when aiding a buyer in a transac on without an agreement to represent the buyer. A subagent can assist the buyer but does not represent the buyer and must place the interests of the owner first. TO AVOID DISPUTES, ALL AGREEMENTS BETWEEN YOU AND A BROKER SHOULD BE IN WRITING AND CLEARLY ESTABLISH: The broker s du es and responsibili es to you, and your obliga ons under the representa on agreement. Who will pay the broker for services provided to you, when payment will be made and how the payment will be calculated. LICENSE HOLDER CONTACT INFORMATION: This no ce is being provided for informa on purposes. It does not create an obliga on for you to use the broker s services. Please acknowledge receipt of this no ce below and retain a copy for your records. United Equities, Inc (713) Licensed Broker /Broker Firm Name or Primary Assumed Business Name License No. Phone Edwin Freedman bfreedman@unitedequities.com (713) Designated Broker of Firm License No. Phone Licensed Supervisor of Sales Agent/ Associate License No. Phone Kristen Cavanaugh kcavanaugh@unitedequities.com (713) Sales Agent/Associate s Name License No. Phone Buyer/Tenant/Seller/Landlord Initials Regulated by the Texas Real Estate Commission Date Informa on available at IABS 1-0
PROPOSED SHOPPING CENTER
 PROPOSED SHOPPING CENTER Southeast Corner I-95 & Highway 192 Melbourne, Florida In a 5 Mile Radius 80,862 Population 32,408 Households $61K Avg HH Income SOONER INVESTMENT Commercial & Investment Real
The Trails. 1,500 sf Space Available. In a 3 Mile Radius 69,985 Population 25,450 Households $78,216 Avg HH Inc. 1,500 sf Corner Space
 1,500 sf Space Available The Trails Edmond Rd (2nd St) & Santa Fe Ave ~ Edmond, Oklahoma Current Tenancy: Edmond YMCA Spinal Wellness Clinic Lemongrass Thai Cuisine Kumon Learning Center Katie s Family
Spring Creek. Edmond, Oklahoma COLLETT& ASSOCIATES. 130,000+/- Square Feet Open-Air Shopping Center Development. The Bridges At
 The Bridges At Spring Creek E 15th Street & Bryant Avenue Edmond, Oklahoma 130,000+/- Square Feet Open-Air Shopping Center Development COLLETT& ASSOCIATES SOONER INVESTMENT Commercial & Investment Real
For Lease. Free-standing Retail / Office Building 1304 Saratoga Avenue San Jose, CA
 For Lease Free-standing Retail / Office Building 1304 Saratoga Avenue San Jose, CA 95117 Description Approximately 4,500 sf plus mezzanine Outstanding identity and visibility In neighborhood shopping center
Elevator Access Stairway Access
 M I X E D U S E F I L I T Y - V I L L E F O R L E S E Located on the major thoroughfare of Sublett Road just west of Hwy 287 in rlington R E T I L ± 3, 4 3 5 S F - F a c i n g S u b l e t t R d ( 1 0 0
Roseville Towne Center Gratiot Avenue Roseville, MI 48066
 Retail Space Available 65,000 SF Second Level Space and Outparcel Florence Street Massachusetts Street Gratiot Avenue E. 12 Mile Road Property Highlights is shadow-anchored by Walmart and includes national
Point Nasa Shopping Center
 $12-36 PSF NNNs - $5.00 PSF * Pad Site - Call for Pricing 5 9 0 9 W E S T L O O P S O U T H S T E. 6 8 0 B E L L A I R E, T E X A S 7 7 4 0 1 7 1 3. 5 6 8. 5 5 0 0 Point Nasa Shopping Center Located at
University Town Center
 University Town Center Norman, Oklahoma 2,000,000 +/- SF Regional Lifestyle Center Phase I Anchored by Target ~ Phase II Anchored by Kohls Home to the John Q. Hammons Embassy Suites Hotel & Convention
99TH AVENUE AND GLENDALE AVENUE
 N ATHAN & A SSOCIATES, I NC. 7600 East Doubletree Ranch Road Suite #150 Scottsdale Arizona 85258 Phone: 480.367.0700 Fax: 480.367.8341 www.nathanandassociatesinc.com 99TH AVENUE AND GLENDALE AVENUE S URROUNDING
Retail Space Available
 Retail Space Available SRS Real Estate Partners 1871 The Alameda, Suite 250 San Jose, CA 95126 408.553.6135 www.srsre.com Exclusive Leasing Agents Randol Mackley Bruce Frazer Senior Vice President Senior
RIDGECREST TOWNE CENTER
 700-840 N. CHINA LAKE BLVD. RIDGECREST, CALIFORNIA 1,400SF, 1,750SF, 2,205SF, 2,633SF AND 6,620SF AVAILABLE CENTER OF TOWN LOCATION AND COMING SOON: N. China Lake Blvd. Anchored by Stater Brothers, Big
STANFORD PLAZA EAST FLORIDA AVE HEMET, CA. NICK EARLE License #
 Simon s Fish & Chips Helen Nails Chinese Food Coin Laundry Welch s Shoe & Repair Stanford Street Donut Shop Fast Auto and Payday Loans E. Florida Ave AVAILABILITY Unit # Size 41821 41855 4,064 SF Water
Linden Market. 132nd & W. Dodge Rd., Omaha, NE W. Dodge Rd., Ste 270 Omaha, NE (p)
") Linden Market 132nd & W. Dodge Rd., Omaha, NE 68154 Agent: Dennis Thaemert Phone: 402-502-4706 Email: dthaemert@lernerco.com Agent: Boh Kurylo Phone: 402-502-4707 Email: bkurylo@lernerco.com 10855 W. Dodge
Linden Market 132nd & W. Dodge Rd., Omaha, NE 68154 Agent: Dennis Thaemert Phone: 402-502-4706 Email: dthaemert@lernerco.com Agent: Boh Kurylo Phone: 402-502-4707 Email: bkurylo@lernerco.com 10855 W. Dodge
PRIME COMMERCIAL LAND FOR SALE
 PRIME COMMERCIAL LAND AVENUE P-4 & 5 TH STREET WEST OUTSTANDING HWY. 14 EXPOSURE COMING SOON TRADE & COMMERCE CENTER HEART OF S RETAIL & BUSINESS CORRIDOR The depiction in the included photograph of any
SDs from Regional Peer Group Mean. SDs from Size Peer Group Mean
 Family: Population Demographics Population Entire MSA 602894 Central Cities (CC) 227,818 Outside Central Cities 375,076 Percent of Entire MSA 37.79% Population in CC Percent Change in Population from 1999
SDs from Regional Peer Group Mean. SDs from Size Peer Group Mean
 Family: Population Demographics Population Entire MSA 1187941 Central Cities (CC) 511,843 Outside Central Cities 676,098 Percent of Entire MSA 43.09% Population in CC Percent Change in Population from
SDs from Regional Peer Group Mean. SDs from Size Peer Group Mean
 Family: Population Demographics Population Entire MSA 661645 Central Cities (CC) 247,057 Outside Central Cities 414,588 Percent of Entire MSA 37.34% Population in CC Percent Change in Population from 1999
SDs from Regional Peer Group Mean. SDs from Size Peer Group Mean
 Family: Population Demographics Population Entire MSA 583845 Central Cities (CC) 316,649 Outside Central Cities 267,196 Percent of Entire MSA 54.24% Population in CC Percent Change in Population from 1999
SDs from Regional Peer Group Mean. SDs from Size Peer Group Mean
 Family: Population Demographics Population Entire MSA 1251509 Central Cities (CC) 540,423 Outside Central Cities 711,086 Percent of Entire MSA 43.18% Population in CC Percent Change in Population from
SDs from Regional Peer Group Mean. SDs from Size Peer Group Mean
 Family: Population Demographics Population Entire MSA 1135614 Central Cities (CC) 677,766 Outside Central Cities 457,848 Percent of Entire MSA 59.68% Population in CC Percent Change in Population from
SDs from Regional Peer Group Mean. SDs from Size Peer Group Mean
 Family: Population Demographics Population Entire MSA 591932 Central Cities (CC) 260,970 Outside Central Cities 330,962 Percent of Entire MSA 44.09% Population in CC Percent Change in Population from 1999
SDs from Regional Peer Group Mean. SDs from Size Peer Group Mean
 Family: Population Demographics Population Entire MSA 1100491 Central Cities (CC) 735,617 Outside Central Cities 364,874 Percent of Entire MSA 66.84% Population in CC Percent Change in Population from
SDs from Regional Peer Group Mean. SDs from Size Peer Group Mean
 Family: Population Demographics Population Entire MSA 540258 Central Cities (CC) 198,915 Outside Central Cities 341,343 Percent of Entire MSA 36.82% Population in CC Percent Change in Population from 1999
SDs from Regional Peer Group Mean. SDs from Size Peer Group Mean
 Family: Population Demographics Population Entire MSA 1249763 Central Cities (CC) 691,295 Outside Central Cities 558,468 Percent of Entire MSA 55.31% Population in CC Percent Change in Population from
SDs from Regional Peer Group Mean. SDs from Size Peer Group Mean
 Family: Population Demographics Population Entire MSA 1088514 Central Cities (CC) 272,953 Outside Central Cities 815,561 Percent of Entire MSA 25.08% Population in CC Percent Change in Population from
SDs from Regional Peer Group Mean. SDs from Size Peer Group Mean
 Family: Population Demographics Population Entire MSA 922516 Central Cities (CC) 470,859 Outside Central Cities 451,657 Percent of Entire MSA 51.04% Population in CC Percent Change in Population from 1999
SDs from Regional Peer Group Mean. SDs from Size Peer Group Mean
 Family: Population Demographics Population Entire MSA 687249 Central Cities (CC) 198,500 Outside Central Cities 488,749 Percent of Entire MSA 28.88% Population in CC Percent Change in Population from 1999
SDs from Regional Peer Group Mean. SDs from Size Peer Group Mean
 Family: Population Demographics Population Entire MSA 542149 Central Cities (CC) 181870 Outside Central Cities 360279 Percent of Entire MSA 33.55% Population in CC Percent Change in Population from 1999
SDs from Regional Peer Group Mean. SDs from Size Peer Group Mean
 Family: Population Demographics Population Entire MSA 1025598 Central Cities (CC) 293,834 Outside Central Cities 731,764 Percent of Entire MSA 28.65% Population in CC Percent Change in Population from
SDs from Regional Peer Group Mean. SDs from Size Peer Group Mean
 Family: Population Demographics Population Entire MSA 875583 Central Cities (CC) 232,835 Outside Central Cities 642,748 Percent of Entire MSA 26.59% Population in CC Percent Change in Population from 1999
SDs from Regional Peer Group Mean. SDs from Size Peer Group Mean
 Family: Population Demographics Population Entire MSA 716998 Central Cities (CC) 448,275 Outside Central Cities 268,723 Percent of Entire MSA 62.52% Population in CC Percent Change in Population from 1999
SDs from Regional Peer Group Mean. SDs from Size Peer Group Mean
 Family: Population Demographics Population Entire MSA 1333914 Central Cities (CC) 284,943 Outside Central Cities 1,048,971 Percent of Entire MSA 21.36% Population in CC Percent Change in Population from
SDs from Regional Peer Group Mean. SDs from Size Peer Group Mean
 Family: Population Demographics Population Entire MSA 712738 Central Cities (CC) 448,607 Outside Central Cities 264,131 Percent of Entire MSA 62.94% Population in CC Percent Change in Population from 1999
SDs from Regional Peer Group Mean. SDs from Size Peer Group Mean. Population Entire MSA
 Family: Population Demographics Population Entire MSA 1169641 Central Cities (CC) 0 Outside Central Cities 1,169,641 Percent of Entire MSA 0% Population in CC Percent Change in Population from 1999 to
SDs from Regional Peer Group Mean. SDs from Size Peer Group Mean
 Family: Population Demographics Population Entire MSA 3251876 Central Cities (CC) 2,078,750 Outside Central Cities 1,173,126 Percent of Entire MSA 63.92% Population in CC Percent Change in Population from
SDs from Regional Peer Group Mean. SDs from Size Peer Group Mean
 Family: Population Demographics Population Entire MSA 1592383 Central Cities (CC) 1,181,140 Outside Central Cities 411,243 Percent of Entire MSA 74.17% Population in CC Percent Change in Population from
SDs from Regional Peer Group Mean. SDs from Size Peer Group Mean
 Family: Population Demographics Population Entire MSA 1776062 Central Cities (CC) 716,793 Outside Central Cities 1,059,269 Percent of Entire MSA 40.36% Population in CC Percent Change in Population from
SDs from Regional Peer Group Mean. SDs from Size Peer Group Mean
 Family: Population Demographics Population Entire MSA 4112198 Central Cities (CC) 416,474 Outside Central Cities 3,695,724 Percent of Entire MSA 10.13% Population in CC Percent Change in Population from
SDs from Regional Peer Group Mean. SDs from Size Peer Group Mean
 Family: Population Demographics Population Entire MSA 9519338 Central Cities (CC) 4408996 Outside Central Cities 5110342 Percent of Entire MSA 46.32% Population in CC Percent Change in Population from
SDs from Regional Peer Group Mean. SDs from Size Peer Group Mean
 Family: Population Demographics Population Entire MSA 1623018 Central Cities (CC) 152397 Outside Central Cities 1470621 Percent of Entire MSA 9.39% Population in CC Percent Change in Population from 1999
SDs from Regional Peer Group Mean. SDs from Size Peer Group Mean
 Family: Population Demographics Population Entire MSA 1731183 Central Cities (CC) 776733 Outside Central Cities 954450 Percent of Entire MSA 44.87% Population in CC Percent Change in Population from 1999
SDs from Regional Peer Group Mean. SDs from Size Peer Group Mean
 Family: Population Demographics Population Entire MSA 2968806 Central Cities (CC) 669,769 Outside Central Cities 2,299,037 Percent of Entire MSA 22.56% Population in CC Percent Change in Population from
SDs from Regional Peer Group Mean. SDs from Size Peer Group Mean
 Family: Population Demographics Population Entire MSA 2846289 Central Cities (CC) 809063 Outside Central Cities 2037226 Percent of Entire MSA 28.43% Population in CC Percent Change in Population from 1999
SDs from Regional Peer Group Mean. SDs from Size Peer Group Mean
 Family: Population Demographics Population Entire MSA 4441551 Central Cities (CC) 1147720 Outside Central Cities 3293831 Percent of Entire MSA 25.84% Population in CC Percent Change in Population from
SDs from Regional Peer Group Mean. SDs from Size Peer Group Mean
 Family: Population Demographics Population Entire MSA 1500741 Central Cities (CC) 661799 Outside Central Cities 838942 Percent of Entire MSA 44.1% Population in CC Percent Change in Population from 1999
SDs from Regional Peer Group Mean. SDs from Size Peer Group Mean
 Family: Population Demographics Population Entire MSA 2552994 Central Cities (CC) 686992 Outside Central Cities 1866002 Percent of Entire MSA 26.91% Population in CC Percent Change in Population from 1999
SDs from Regional Peer Group Mean. SDs from Size Peer Group Mean
 Family: Population Demographics Population Entire MSA 2414616 Central Cities (CC) 764431 Outside Central Cities 1650185 Percent of Entire MSA 31.66% Population in CC Percent Change in Population from 1999
Commission District 4 Census Data Aggregation
 Commission District 4 Census Data Aggregation 2011-2015 American Community Survey Data, U.S. Census Bureau Table 1 (page 2) Table 2 (page 2) Table 3 (page 3) Table 4 (page 4) Table 5 (page 4) Table 6 (page
Northwest Census Data Aggregation
 Northwest Census Data Aggregation 2011-2015 American Community Survey Data, U.S. Census Bureau Table 1 (page 2) Table 2 (page 2) Table 3 (page 3) Table 4 (page 4) Table 5 (page 4) Table 6 (page 5) Table
Riverview Census Data Aggregation
 Riverview Census Data Aggregation 2011-2015 American Community Survey Data, U.S. Census Bureau Table 1 (page 2) Table 2 (page 2) Table 3 (page 3) Table 4 (page 4) Table 5 (page 4) Table 6 (page 5) Table
Zipe Code Census Data Aggregation
 Zipe Code 66101 Census Data Aggregation 2011-2015 American Community Survey Data, U.S. Census Bureau Table 1 (page 2) Table 2 (page 2) Table 3 (page 3) Table 4 (page 4) Table 5 (page 4) Table 6 (page 5)
Zipe Code Census Data Aggregation
 Zipe Code 66103 Census Data Aggregation 2011-2015 American Community Survey Data, U.S. Census Bureau Table 1 (page 2) Table 2 (page 2) Table 3 (page 3) Table 4 (page 4) Table 5 (page 4) Table 6 (page 5)
EVEREST. Retail Investment Opportunity. Ivy Hills Retail Center 7397 Main Street Newtown, OH CONTACT: Chris Nachtrab.
 Retail Investment Opportunity CONTACT: Chris Nachtrab chris.nachtrab@everestrealestate.com 513/769-2509 John Thompson john.thompson@everestrealestate.com 513/769-2514 Ivy Hills Retail Center 7397 Main
LAND FOR SALE Blair Road, Mint Hill, NC PROPERTY OVERVIEW. Large parcel with I-485 access via Blair Road exit in the path of. growth.
 LAND FOR SALE 10395 Blair Road, Mint Hill, NC 28227 OFFERING SUMMARY SALE PRICE: $1,000,000 PROPERTY OVERVIEW Large parcel with I485 access via Blair Road exit in the path of growth. LOT SIZE: 9.28 Acres
Former Sports Authority
 Former Sports Authority Agent: Boh Kurylo Phone: 402-502-4707 Email: bkurylo@lernerco.com Agent: Ben Meier Phone: 402-502-4715 Email: bmeier@lernerco.com 10855 W. Dodge Rd., Ste 270 Omaha, NE 68154 402-330-5480
Tyler Area Economic Overview
 Tyler Area Economic Overview Demographic Profile. 2 Unemployment Rate. 4 Wage Trends. 4 Cost of Living Index...... 5 Industry Clusters. 5 Occupation Snapshot. 6 Education Levels 7 Gross Domestic Product
TABLE 1. PROFILE OF GENERAL DEMOGRAPHIC CHARACTERISTICS
 Waterloo city, Iowa TABLE 1. PROFILE OF GENERAL DEMOGRAPHIC CHARACTERISTICS Estimate Lower Bound Upper Bound Total population 66,659 64,093 69,225 SEX AND AGE Male 32,096 30,415 33,777 Female 34,563 33,025
MEDICAL OFFICE SPACE AVAILABLE FOR LEASE AT DUGAS PROFESSIONAL BUILDING 9410 DUGAS DRIVE, SAN ANTONIO, TX 78245
 PROPERTY HIGHLIGHTS Dugas Professional Building is home to an established family practice and family dental practice located within easy reach of Loop 1604, Loop 410 and Highway 151 in fast-growing Westover
Savannah Agee Direct:
 Demographics for 7071 S Bilbo Rd, Orange, Texas 77632, United States Savannah Agee Direct: 409-833-5055 Population Population Total Population (US Census 2010) 358 4,419 8,486 Total Population (Current
Demographics for 2020 S Main St, South Jacksonville, Illinois, United States
 Demographics for 2020 S Main St, South Jacksonville, Illinois, United States Population Population Total Population (US Census 2010) 3,200 19,103 24,773 Total Population (Current Year) 3,168 18,852 24,419
Town Profiles: Demographic, Economic, and Housing Statistics for De Smet City and Wall Town, SOuth Dakota
 South Dakota State University Open PRAIRIE: Open Public Research Access Institutional Repository and Information Exchange Census Data Center News Releases SDSU Census Data Center 12-7-2017 Town Profiles:
WESTOVER MEDICAL PARK NEQ MILITARY DR WEST & HWY 151 IN SAN ANTONIO, TX 78251
 PROJECT HIGHLIGHTS Class A Medical Office space available for lease at Westover Medical Park. Located in far west San Antonio, these are new buildings in an upscale development within easy reach of Christus
University of Minnesota
 neighborhood profile October 2011 About this area The University neighborhood is bordered by 11th Avenue Southeast, University Avenue, 15th Avenue Southeast, the railroad tracks, Oak Street, and the Mississippi
INVESTMENT OFFERING MEMORANDUM 5325 S FORT APACHE RD, LAS VEGAS, NV SPANISH HILLS PLAZA
 702.787.0123 1333 N Buffalo Dr, Ste 120 Las Vegas, NV 89128 www.virtusco.com INVESTMENT OFFERING MEMORANDUM 5325 S FORT APACHE RD, LAS VEGAS, NV 89148 SPANISH HILLS PLAZA Exclusive AdvisorS ROB HATRAK
CORVALLIS, OREGON 19,300 ADT (11) SITE SW 3rd Street in Corvallis, Oregon
 SITE SW 3rd Street in Corvallis, Oregon") DEVELOPMENT OPPORTUNITY Corvallis Commercial Site CORVALLIS, OREGON 19,300 ADT (11) SITE LOCATION Size Economics Comments Traffic Count 2415 SW 3rd Street in Corvallis, Oregon 15 acres Please call for
DEVELOPMENT OPPORTUNITY Corvallis Commercial Site CORVALLIS, OREGON 19,300 ADT (11) SITE LOCATION Size Economics Comments Traffic Count 2415 SW 3rd Street in Corvallis, Oregon 15 acres Please call for
Mid - City Industrial
 Minneapolis neighborhood profile October 2011 Mid - City Industrial About this area The Mid-City Industrial neighborhood is bordered by I- 35W, Highway 280, East Hennepin Avenue, and Winter Street Northeast.
Camden Industrial. Minneapolis neighborhood profile. About this area. Trends in the area. Neighborhood in Minneapolis.
 Minneapolis neighborhood profile October 2011 Camden Industrial About this area The Camden Industrial neighborhood is bordered by 48th Avenue North, the Mississippi River, Dowling Avenue North, Washington
Shingle Creek. Minneapolis neighborhood profile. About this area. Trends in the area. Neighborhood in Minneapolis. October 2011
 neighborhood profile October 2011 About this area The neighborhood is bordered by 53rd Avenue North, Humboldt Avenue North, 49th Avenue North, and Xerxes Avenue North. It is home to Olson Middle School.
2016 Labor Market Profile
 2016 Labor Market Profile Prepared by The Tyler Economic Development Council Tyler Area Sponsor June 2016 The ability to demonstrate a regions availability of talented workers has become a vital tool
ECONOMIC OVERVIEW DuPage County, Illinois
 ECONOMIC OVERVIEW DuPage County, Illinois DEMOGRAPHIC PROFILE... 3 EMPLOYMENT TRENDS... 5 UNEMPLOYMENT RATE... 5 WAGE TRENDS... 6 COST OF LIVING INDEX... 7 INDUSTRY SNAPSHOT... 8 OCCUPATION SNAPSHOT...
Economic Overview City of Tyler, TX. January 8, 2018
 Economic Overview City of Tyler, TX January 8, 2018 DEMOGRAPHIC PROFILE...3 EMPLOYMENT TRENDS...5 WAGE TRENDS...5 COST OF LIVING INDEX...6 INDUSTRY SNAPSHOT...7 OCCUPATION SNAPSHOT...9 INDUSTRY CLUSTERS...
Commercial Land for Sale. Messina Highlands Acres / W. Market St. & Richland Ave West Market Street; York, PA SITE
 3 2018 Messina Highlands 2.21 Acres / W. Market St. & Richland Ave. ; SITE York Fuel Stop / Tobacco Outlet T & D Car Wash 2.21 Acres Commercial Land Available for Sale 12,000 CPD on West Market Street
ACS DEMOGRAPHIC AND HOUSING ESTIMATES American Community Survey 1-Year Estimates
 DP05 ACS DEMOGRAPHIC AND HOUSING ESTIMATES 2010 American Community Survey 1-Year s Supporting documentation on code lists, subject definitions, data accuracy, and statistical testing can be found on the
Economic Overview. Lawrence, KS MSA
 Economic Overview Lawrence, KS MSA March 5, 2019 DEMOGRAPHIC PROFILE... 3 EMPLOYMENT TRENDS... 5 UNEMPLOYMENT RATE... 5 WAGE TRENDS... 6 COST OF LIVING INDEX... 7 INDUSTRY SNAPSHOT... 8 OCCUPATION SNAPSHOT...
ACS DEMOGRAPHIC AND HOUSING ESTIMATES American Community Survey 1-Year Estimates
 DP05 ACS DEMOGRAPHIC AND HOUSING ESTIMATES 2012 American Community Survey 1-Year Estimates Supporting documentation on code lists, subject definitions, data accuracy, and statistical testing can be found
Economic Overview York County, South Carolina. February 14, 2018
 Economic Overview York County, February 14, 2018 DEMOGRAPHIC PROFILE... 3 EMPLOYMENT TRENDS... 5 UNEMPLOYMENT RATE... 5 WAGE TRENDS... 6 COST OF LIVING INDEX... 6 INDUSTRY SNAPSHOT... 7 OCCUPATION SNAPSHOT...
TEMPE CROSSING II - RETAIL PAD
 Excellent infill pad opportunity in dynamic retail corridor, 1 mi. East of I-10 Fully finished pad. Over $250,000 worth of site work already completed. Buildable up to 8,500 square feet. Excellent parking!
IAG Commercial. Albertville Retail - Land. For Sale. Prepared By:
 Albertville Retail - Land For Sale Albertville Retail - Land 6600 Laketowne Place Albertville, MN 55301 Prepared By: IAG Commercial 222 South Ninth Street, Suite 1600 Minneapolis, MN 55402 Jeff LaFavre,
APPENDIX 6: CENSUS DATA BURLINGTON, VERMONT
 APPENDIX 6: CENSUS DATA BURLINGTON, VERMONT 2000 CENSUS DATA 2005-2007 AMERICAN COMMUNITY SURVEY Burlington city, Vermont - Fact Sheet - American FactFinder Page 1 of 2 FACT SHEET Burlington
4520 Madison Avenue, Suite 300 Kansas City, MO rhjohnson.com
 FOR LEASE OLATHE STATION SOUTH 119th Street & I-35 Olathe, Kansas Redevelopment Underway SITE SUMMARY Phenomenal Restaurant & Retail Opportunities Available Positioned in Super Regional Trade Area Anchored
American Community Survey 5-Year Estimates
 DP02 SELECTED SOCIAL CHARACTERISTICS IN THE UNITED STATES 2007-2011 American Community Survey 5-Year Estimates Supporting documentation on code lists, subject definitions, data accuracy, and statistical
American Community Survey 5-Year Estimates
 DP05 ACS DEMOGRAPHIC AND HOUSING ESTIMATES 2011-2015 American Community Survey 5-Year Estimates Supporting documentation on code lists, subject definitions, data accuracy, and statistical testing can be
Economic Overview Long Island
 Report created on August 29, 2017 Economic Overview Long Island Contact: Lisa.Montiel@suny.edu DEMOGRAPHIC PROFILE... 3 EMPLOYMENT TRENDS... 5 UNEMPLOYMENT RATE... 5 WAGE TRENDS... 6 COST OF LIVING INDEX...
American Community Survey 5-Year Estimates
 DP05 ACS DEMOGRAPHIC AND HOUSING ESTIMATES 2011-2015 American Community Survey 5-Year Estimates Supporting documentation on code lists, subject definitions, data accuracy, and statistical testing can be
EBRI Databook on Employee Benefits Chapter 6: Employment-Based Retirement Plan Participation
 EBRI Databook on Employee Benefits Chapter 6: Employment-Based Retirement Plan Participation UPDATED July 2014 This chapter looks at the percentage of American workers who work for an employer who sponsors
Tell us what you think. Provide feedback to help make American Community Survey data more useful for you.
 DP05 ACS DEMOGRAPHIC AND HOUSING ESTIMATES 2016 American Community Survey 1-Year Estimates Supporting documentation on code lists, subject definitions, data accuracy, and statistical testing can be found
Economic Overview Western New York
 Report created on August 29, 2017 Economic Overview Western New Contact: Lisa.Montiel@suny.edu DEMOGRAPHIC PROFILE... 3 EMPLOYMENT TRENDS... 5 UNEMPLOYMENT RATE... 5 WAGE TRENDS... 6 COST OF LIVING INDEX...
Economic Overview Long Island
 Report created on October 20, 2015 Economic Overview Long Island Created using: Contact: Lisa.Montiel@suny.edu DEMOGRAPHIC PROFILE...3 EMPLOYMENT TRENDS...5 UNEMPLOYMENT RATE...5 WAGE TRENDS...6 COST OF
Economic Overview Fairfax / Falls Church. October 23, 2017
 Economic Overview Fairfax / Falls Church October 23, 2017 DEMOGRAPHIC PROFILE... 3 EMPLOYMENT TRENDS... 5 UNEMPLOYMENT RATE... 5 WAGE TRENDS... 6 COST OF LIVING INDEX... 6 INDUSTRY SNAPSHOT... 7 OCCUPATION
Economic Overview Monterey County, California. July 22, 2016
 Economic Overview Monterey July 22, 2016 DEMOGRAPHIC PROFILE... 3 EMPLOYMENT TRENDS... 5 UNEMPLOYMENT RATE... 5 WAGE TRENDS... 6 COST OF LIVING INDEX... 6 INDUSTRY SNAPSHOT... 7 OCCUPATION SNAPSHOT...
Economic Overview Capital District
 August 29, 2017 Economic Overview Capital District Contact: Lisa.Montiel@suny.edu DEMOGRAPHIC PROFILE... 3 EMPLOYMENT TRENDS... 5 UNEMPLOYMENT RATE... 5 WAGE TRENDS... 6 COST OF LIVING INDEX... 6 INDUSTRY
SOLANO AVE. Premier Location in Bustling Retail District
 +/- 1,172 SF Retail Space Premier Location in Bustling Retail District TE SI Located in the busiest stretch of the Solano Avenue retail district, neighboring an eclectic mix of local, regional, and national
Economic Overview Mohawk Valley
 Report created on August 29, 2017 Economic Overview Mohawk Valley Contact: Lisa.Montiel@suny.edu DEMOGRAPHIC PROFILE... 3 EMPLOYMENT TRENDS... 5 UNEMPLOYMENT RATE... 5 WAGE TRENDS... 6 COST OF LIVING INDEX...
DEMOGRAPHIC PROFILE...3 EMPLOYMENT TRENDS...5 UNEMPLOYMENT RATE...5 WAGE TRENDS...6 COST OF LIVING INDEX...6 INDUSTRY SNAPSHOT...7
 March 14, 2017 DEMOGRAPHIC PROFILE...3 EMPLOYMENT TRENDS...5 UNEMPLOYMENT RATE...5 WAGE TRENDS...6 COST OF LIVING INDEX...6 INDUSTRY SNAPSHOT...7 OCCUPATION SNAPSHOT...9 INDUSTRY CLUSTERS... 12 EDUCATION
Economic Overview Loudoun County, Virginia. October 23, 2017
 Economic Overview October 23, 2017 DEMOGRAPHIC PROFILE... 3 EMPLOYMENT TRENDS... 5 UNEMPLOYMENT RATE... 5 WAGE TRENDS... 6 COST OF LIVING INDEX... 6 INDUSTRY SNAPSHOT... 7 OCCUPATION SNAPSHOT... 9 INDUSTRY
AVAILABLE FOR LEASE Mayfield Road. Mayfield Heights, Ohio
 1,700 SF Retail Space For Lease Property Highlights Below market lease rates Refurbished in 2016 Furniture, fixtures and equipment available for purchase Fully built out restaurant space with hood Excellent
October 28, Economic Overview Yellowstone County, Montana
 October 28, 2016 Economic Overview Yellowstone DEMOGRAPHIC PROFILE...3 EMPLOYMENT TRENDS...5 UNEMPLOYMENT RATE...5 WAGE TRENDS...6 COST OF LIVING INDEX...6 INDUSTRY SNAPSHOT...7 OCCUPATION SNAPSHOT...9
Economic Overview New York
 Report created on October 20, 2015 Economic Overview Created using: Contact: Lisa.Montiel@suny.edu DEMOGRAPHIC PROFILE...3 EMPLOYMENT TRENDS...5 UNEMPLOYMENT RATE...5 WAGE TRENDS...6 COST OF LIVING INDEX...6
SUPPLEMENTAL INFORMATION
 SUPPLEMENTAL INFORMATION Statement of Net Position (as of June 30, 2013) Component Business Total Unit Total Governmental Type Primary Manassas City Reporting Activities Activities Government Public Schools
Economic Overview 45-Minute Commute From Airport Park. June 6, 2017
 Economic Overview 45-Minute Commute From Airport Park June 6, 2017 DEMOGRAPHIC PROFILE... 3 EMPLOYMENT TRENDS... 5 WAGE TRENDS... 5 COST OF LIVING INDEX... 6 INDUSTRY SNAPSHOT... 7 OCCUPATION SNAPSHOT...