APPENDIX 6: CENSUS DATA BURLINGTON, VERMONT
|
|
|
- John Morton
- 5 years ago
- Views:
Transcription
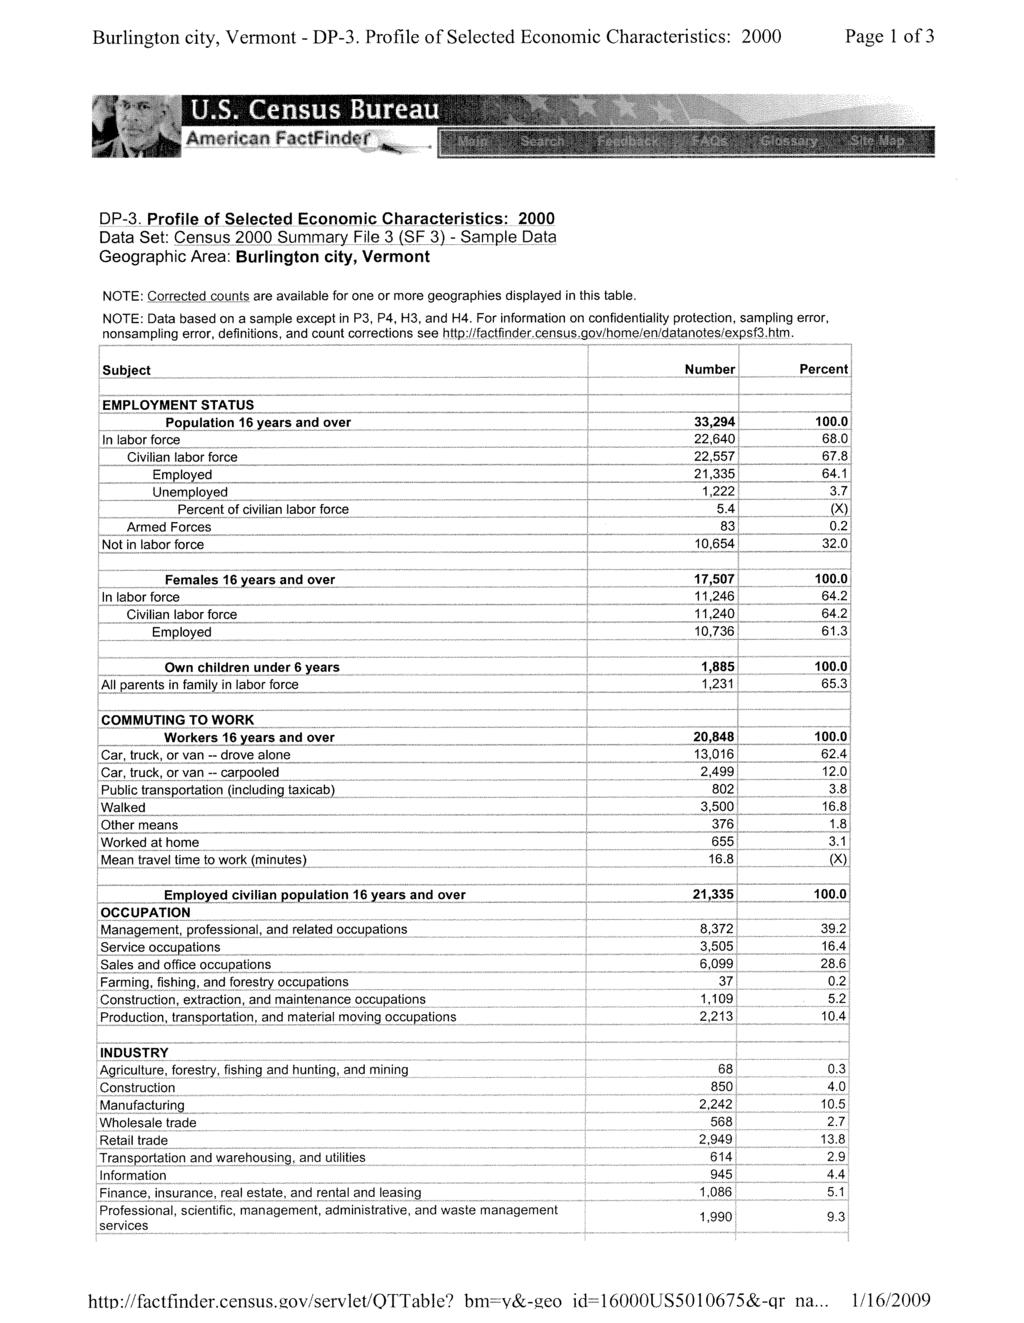
1 APPENDIX 6: CENSUS DATA BURLINGTON, VERMONT
2 2000 CENSUS DATA
3
4
5
6
7
8
9
10
11
12
13
14
15
16
17 AMERICAN COMMUNITY SURVEY
18 Burlington city, Vermont - Fact Sheet - American FactFinder Page 1 of 2 FACT SHEET Burlington city, Vermont American Community Survey 3-Year Estimates - what's this? Data Profile Highlights: NOTE. Although the American Community Survey (ACS) produces population, demographic and housing unit estimates, it is the Census Bureau's Population Estimates Program that produces and disseminates the official estimates of the population for the nation, states, counties, cities and towns and estimates of housing units for states and counties. Social Characteristics - show more >> Estimate Percent U.S. Error Average household size 2.20 (X) /-0.07 Average family size 2.87 (X) /-0.11 Population 25 years and over 22,314 +/-788 High school graduate or higher (X) % (X) Bachelor's degree or higher (X) % (X) Civilian veterans (civilian population 18 years and over) N N 10.4% N Disability status (population 5 years and over) 5, % +/-636 Foreign born 2, % +/-567 Male, Now married, except separated (population 15 years and over) 4, % +/-459 Female, Now married, except separated (population 15 years and over) 5, % +/-450 Speak a language other than English at home (population 5 years and over) 3, % +/-707 Household population 33,289 +/-1,062 Group quarters population (X) (X) (X) (X) Economic Characteristics - show more >> Estimate Percent U.S. Error In labor force (population 16 years and over) 22, % +/-1,067 Mean travel time to work in minutes (workers 16 years and over) 16.3 (X) /-1.0 Median household income (in 2007 inflationadjusted dollars) 38,288 (X) 50,007 +/-2,241 Median family income (in 2007 inflation-adjusted dollars) 54,246 (X) 60,374 +/-5,893 Per capita income (in 2007 inflation-adjusted dollars) 23,082 (X) 26,178 +/-1,451 Families below poverty level (X) % (X) Individuals below poverty level (X) % (X) Housing Characteristics - show more >> Estimate Percent U.S. Error Total housing units 16,131 +/-286 Occupied housing units 15, % +/-401 Owner-occupied housing units 6, % +/-447 Renter-occupied housing units 8, % +/-477 Vacant housing units % +/-328 Owner-occupied homes 6,623 +/-447 Median value (dollars) 243,700 (X) 181,800 +/-8,505 Median of selected monthly owner costs With a mortgage (dollars) 1,544 (X) 1,427 +/-76 Not mortgaged (dollars) 628 (X) 402 +/-46 ACS Demographic Estimates - show more >> Estimate Percent U.S. Error Total population 38,600 +/-1,078 Male 18, % +/-813
19 Burlington city, Vermont - Fact Sheet - American FactFinder Page 2 of 2 Female 20, % +/-815 Median age (years) 30.4 (X) /-1.2 Under 5 years 1, % +/ years and over 32, % +/ years and over 4, % +/-299 One race 37, % +/-1,099 White 35, % +/-1,088 Black or African American 1, % +/-257 American Indian and Alaska Native % +/-88 Asian % +/-289 Native Hawaiian and Other Pacific Islander % +/-119 Some other race % +/-179 Two or more races % +/-233 Hispanic or Latino (of any race) % +/-285 Source: U.S. Census Bureau, American Community Survey Explanation of Symbols: '***' - The median falls in the lowest interval or upper interval of an open-ended distribution. A statistical test is not appropriate. '*****' - The estimate is controlled. A statistical test for sampling variability is not appropriate. 'N' - Data for this geographic area cannot be displayed because the number of sample cases is too small. '(X)' - The value is not applicable or not available. The letters PDF or symbol indicate a document is in the Portable Document Format (PDF). To view the file you will need the Adobe Acrobat Reader, which is available for free from the Adobe web site.
20 Burlington city, Vermont - ACS Demographic and Housing Estimates: Page 1 of 3 Burlington city, Vermont ACS Demographic and Housing Estimates: Data Set: American Community Survey 3-Year Estimates Survey: American Community Survey NOTE. Although the American Community Survey (ACS) produces population, demographic and housing unit estimates, it is the Census Bureau's Population Estimates Program that produces and disseminates the official estimates of the population for the nation, states, counties, cities and towns and estimates of housing units for states and counties. For more information on confidentiality protection, sampling error, nonsampling error, and definitions, see Survey Methodology. ACS Demographic and Housing Estimates Estimate Error Percent Error SEX AND AGE Total population 38,600 +/-1, % (X) Male 18,264 +/ % +/-1.6 Female 20,336 +/ % +/-1.6 Under 5 years 1,840 +/ % +/ to 9 years 1,554 +/ % +/ to 14 years 1,453 +/ % +/ to 19 years 4,757 +/ % +/ to 24 years 6,682 +/ % +/ to 34 years 5,465 +/ % +/ to 44 years 4,816 +/ % +/ to 54 years 5,023 +/ % +/ to 59 years 1,674 +/ % +/ to 64 years 1,052 +/ % +/ to 74 years 2,044 +/ % +/ to 84 years 1,404 +/ % +/ years and over 836 +/ % +/-0.6 Median age (years) /-1.2 (X) (X) 18 years and over 32,586 +/ % +/ years and over 26,811 +/ % +/ years and over 4,889 +/ % +/ years and over 4,284 +/ % +/ years and over 32,586 +/ % (X) Male 14,949 +/ % +/-1.7 Female 17,637 +/ % +/ years and over 4,284 +/ % (X) Male 1,424 +/ % +/-0.6 Female 2,860 +/ % +/-0.7 RACE Total population 38,600 +/-1, % (X) One race 37,940 +/-1, % (X) Two or more races 660 +/ % (X)
21 Burlington city, Vermont - ACS Demographic and Housing Estimates: Page 2 of 3 ACS Demographic and Housing Estimates Estimate Error Percent Error One race 37,940 +/-1, % +/-0.6 White 35,795 +/-1, % +/-1.0 Black or African American 1,068 +/ % +/-0.7 American Indian and Alaska Native 106 +/ % +/-0.2 Cherokee tribal grouping N N N N Chippewa tribal grouping N N N N Navajo tribal grouping N N N N Sioux tribal grouping N N N N Asian 743 +/ % +/-0.8 Asian Indian N N N N Chinese N N N N Filipino N N N N Japanese N N N N Korean N N N N Vietnamese N N N N Other Asian N N N N Native Hawaiian and Other Pacific Islander 0 +/ % +/-0.1 Native Hawaiian N N N N Guamanian or Chamorro N N N N Samoan N N N N Other Pacific Islander N N N N Some other race 228 +/ % +/-0.5 Two or more races 660 +/ % +/-0.6 White and Black or African American 256 +/ % +/-18.5 White and American Indian and Alaska Native 186 +/ % +/-16.2 White and Asian 39 +/ % +/-7.3 Black or African American and American Indian and Alaska Native 0 +/ % +/-4.8 Race alone or in combination with one or more other races Total population 38,600 +/-1, % (X) White 36,455 +/-1, % +/-1.0 Black or African American 1,357 +/ % +/-0.8 American Indian and Alaska Native 325 +/ % +/-0.4 Asian 782 +/ % +/-0.7 Native Hawaiian and Other Pacific Islander N N N N Some other race 374 +/ % +/-0.7 HISPANIC OR LATINO AND RACE Total population 38,600 +/-1, % (X) Hispanic or Latino (of any race) 934 +/ % +/-0.7 Mexican 94 +/ % +/-0.2 Puerto Rican 277 +/ % +/-0.4 Cuban 30 +/ % +/-0.1 Other Hispanic or Latino 533 +/ % +/-0.7 Not Hispanic or Latino 37,666 +/-1, % +/-0.7 White alone 35,174 +/-1, % +/-1.3 Black or African American alone 1,068 +/ % +/-0.6 American Indian and Alaska Native alone 81 +/ % +/-0.2 Asian alone 743 +/ % +/-0.7 Native Hawaiian and Other Pacific Islander alone 0 +/ % +/-0.1 Some other race alone 70 +/ % +/-0.2 Two or more races 530 +/ % +/-0.5 Two races including Some other race 16 +/ % +/-0.1 Two races excluding Some other race, and Three or more races 514 +/ % +/-0.5 Total housing units 16,131 +/ % (X) Source: U.S. Census Bureau, American Community Survey Data are based on a sample and are subject to sampling variability. The degree of uncertainty for an estimate arising from sampling variability is represented through the use of a margin of error. The value shown here is the 90 percent margin of error. The margin of error can be interpreted roughly as providing a 90 percent probability that the interval defined by the estimate minus the margin of error and the estimate plus the margin of error (the lower and upper confidence bounds) contains the true value. In addition to sampling variability, the ACS estimates are subject to nonsampling error (for a discussion of nonsampling variability, see Accuracy of the Data). The effect of nonsampling error is not represented in these tables.
22 Burlington city, Vermont - ACS Demographic and Housing Estimates: Page 3 of 3 Notes: For more information on understanding race and Hispanic origin data, please see the Census 2000 Brief entitled, Overview of Race and Hispanic Origin, issued March (pdf format) While the 2007 American Community Survey (ACS) data generally reflect the December 2006 Office of Management and Budget (OMB) definitions of metropolitan and micropolitan statistical areas; in certain instances the names, codes, and boundaries of the principal cities shown in ACS tables may differ from the OMB definitions due to differences in the effective dates of the geographic entities. The 2007 Puerto Rico Community Survey (PRCS) data generally reflect the December 2005 Office of Management and Budget (OMB) definitions of metropolitan and micropolitan statistical areas; in certain instances the names, codes, and boundaries of the principal cities shown in PRCS tables may differ from the OMB definitions due to differences in the effective dates of the geographic entities. Estimates of urban and rural population, housing units, and characteristics reflect boundaries of urban areas defined based on Census 2000 data. Boundaries for urban areas have not been updated since Census As a result, data for urban and rural areas from the ACS do not necessarily reflect the results of ongoing urbanization. Explanation of Symbols: 1. An '**' entry in the margin of error column indicates that either no sample observations or too few sample observations were available to compute a standard error and thus the margin of error. A statistical test is not appropriate. 2. An '-' entry in the estimate column indicates that either no sample observations or too few sample observations were available to compute an estimate, or a ratio of medians cannot be calculated because one or both of the median estimates falls in the lowest interval or upper interval of an open-ended distribution. 3. An '-' following a median estimate means the median falls in the lowest interval of an open-ended distribution. 4. An '+' following a median estimate means the median falls in the upper interval of an open-ended distribution. 5. An '***' entry in the margin of error column indicates that the median falls in the lowest interval or upper interval of an open-ended distribution. A statistical test is not appropriate. 6. An '*****' entry in the margin of error column indicates that the estimate is controlled. A statistical test for sampling variability is not appropriate. 7. An 'N' entry in the estimate and margin of error columns indicates that data for this geographic area cannot be displayed because the number of sample cases is too small. 8. An '(X)' means that the estimate is not applicable or not available. The letters PDF or symbol indicate a document is in the Portable Document Format (PDF). To view the file you will need the Adobe Acrobat Reader, which is available for free from the Adobe web site.
23 Burlington city, Vermont - Selected Social Characteristics in the United States: Page 1 of 5 Burlington city, Vermont Selected Social Characteristics in the United States: Data Set: American Community Survey 3-Year Estimates Survey: American Community Survey NOTE. Although the American Community Survey (ACS) produces population, demographic and housing unit estimates, it is the Census Bureau's Population Estimates Program that produces and disseminates the official estimates of the population for the nation, states, counties, cities and towns and estimates of housing units for states and counties. For more information on confidentiality protection, sampling error, nonsampling error, and definitions, see Survey Methodology. Error Percent Error Selected Social Characteristics in the United States Estimate HOUSEHOLDS BY TYPE Total households 15,142 +/ % (X) Family households (families) 6,786 +/ % +/-3.0 With own children under 18 years 3,218 +/ % +/-2.3 Married-couple family 4,503 +/ % +/-2.7 With own children under 18 years 1,752 +/ % +/-1.8 Male householder, no wife present, family 539 +/ % +/-1.6 With own children under 18 years 270 +/ % +/-1.1 Female householder, no husband present, family 1,744 +/ % +/-2.1 With own children under 18 years 1,196 +/ % +/-1.7 Nonfamily households 8,356 +/ % +/-3.0 Householder living alone 5,945 +/ % +/ years and over 1,569 +/ % +/-1.7 Households with one or more people under 18 years 3,492 +/ % +/-2.6 Households with one or more people 65 years and over 2,724 +/ % +/-1.6 Average household size /-0.07 (X) (X) Average family size /-0.11 (X) (X) RELATIONSHIP Population in households 33,289 +/-1, % (X) Householder 15,142 +/ % +/-1.5 Spouse 4,497 +/ % +/-1.1 Child 7,168 +/ % +/-1.5 Other relatives 1,043 +/ % +/-1.1 Nonrelatives 5,439 +/ % +/-2.0 Unmarried partner 1,138 +/ % +/-0.9 MARITAL STATUS Males 15 years and over 15,568 +/ % (X) Never married 8,929 +/ % +/-3.1 Now married, except separated 4,824 +/ % +/-3.1 Separated 139 +/ % +/-0.8 Widowed 362 +/ % +/-0.9 Divorced 1,314 +/ % +/-1.7 Females 15 years and over 18,185 +/ % (X)
24 Burlington city, Vermont - Selected Social Characteristics in the United States: Page 2 of 5 Selected Social Characteristics in the United States Estimate Error Percent Error Never married 9,305 +/ % +/-3.0 Now married, except separated 5,110 +/ % +/-2.4 Separated 402 +/ % +/-1.0 Widowed 1,603 +/ % +/-1.8 Divorced 1,765 +/ % +/-1.8 FERTILITY Number of women 15 to 50 years old who had a birth in the past 12 months 407 +/ % (X) Unmarried women (widowed, divorced, and never married) 85 +/ % +/-12.2 Per 1,000 unmarried women 9 +/-7 (X) (X) Per 1,000 women 15 to 50 years old 31 +/-14 (X) (X) Per 1,000 women 15 to 19 years old 0 +/-14 (X) (X) Per 1,000 women 20 to 34 years old 46 +/-23 (X) (X) Per 1,000 women 35 to 50 years old 27 +/-24 (X) (X) GRANDPARENTS Number of grandparents living with own grandchildren under 18 years N N N (X) Responsible for grandchildren N N N N Years responsible for grandchildren Less than 1 year N N N N 1 or 2 years N N N N 3 or 4 years N N N N 5 or more years N N N N Characteristics of grandparents responsible for own grandchildren under 18 years Who are female N N N (X) Who are married N N N (X) SCHOOL ENROLLMENT Population 3 years and over enrolled in school 14,867 +/ % (X) Nursery school, preschool 813 +/ % +/-2.4 Kindergarten 406 +/ % +/-1.0 Elementary school (grades 1-8) 2,162 +/ % +/-2.1 High school (grades 9-12) 1,288 +/ % +/-1.9 College or graduate school 10,198 +/ % +/-3.1 EDUCATIONAL ATTAINMENT Population 25 years and over 22,314 +/ % (X) Less than 9th grade 718 +/ % +/-1.0 9th to 12th grade, no diploma 1,388 +/ % +/-1.5 High school graduate (includes equivalency) 5,358 +/ % +/-3.1 Some college, no degree 3,528 +/ % +/-2.5 Associate's degree 1,627 +/ % +/-1.7 Bachelor's degree 5,704 +/ % +/-2.7 Graduate or professional degree 3,991 +/ % +/-2.1 Percent high school graduate or higher 90.6% +/-1.9 (X) (X) Percent bachelor's degree or higher 43.4% +/-2.8 (X) (X) VETERAN STATUS Civilian population 18 years and over 32,547 +/ % (X) Civilian veterans N N N (X) DISABILITY STATUS OF THE CIVILIAN NONINSTITUTIONALIZED POPULATION Population 5 years and over 35,838 +/-1, % (X) With a disability 5,439 +/ % +/-1.8 Population 5 to 15 years 3,370 +/ % (X) With a disability 373 +/ % +/-5.7 Population 16 to 64 years 29,067 +/ % (X)
25 Burlington city, Vermont - Selected Social Characteristics in the United States: Page 3 of 5 Selected Social Characteristics in the United States Estimate Error Percent Error With a disability 3,915 +/ % +/-1.8 Population 65 years and over 3,401 +/ % (X) With a disability 1,151 +/ % +/-6.4 RESIDENCE 1 YEAR AGO Population 1 year and over 38,233 +/-1, % (X) Same house 26,749 +/-1, % +/-2.5 Different house in the U.S. 11,233 +/-1, % +/-2.4 Same county 6,587 +/ % +/-2.4 Different county 4,646 +/ % +/-2.0 Same state 1,352 +/ % +/-1.1 Different state 3,294 +/ % +/-1.8 Abroad 251 +/ % +/-0.4 PLACE OF BIRTH Total population 38,600 +/-1, % (X) Native 35,890 +/-1, % +/-1.5 Born in United States 35,403 +/-1, % +/-1.6 State of residence 16,286 +/-1, % +/-3.0 Different state 19,117 +/-1, % +/-2.8 Born in Puerto Rico, U.S. Island areas, or born abroad to American parent(s) 487 +/ % +/-0.5 Foreign born 2,710 +/ % +/-1.5 U.S. CITIZENSHIP STATUS Foreign-born population 2,710 +/ % (X) Naturalized U.S. citizen 1,367 +/ % +/-9.0 Not a U.S. citizen 1,343 +/ % +/-9.0 YEAR OF ENTRY Population born outside the United States 3,197 +/ % (X) Native 487 +/ % (X) Entered 2000 or later 164 +/ % +/-19.9 Entered before / % +/-19.9 Foreign born 2,710 +/ % (X) Entered 2000 or later 651 +/ % +/-8.5 Entered before ,059 +/ % +/-8.5 WORLD REGION OF BIRTH OF FOREIGN BORN Foreign-born population, excluding population born at sea N N N (X) Europe N N N N Asia N N N N Africa N N N N Oceania N N N N Latin America N N N N Northern America N N N N LANGUAGE SPOKEN AT HOME Population 5 years and over 36,760 +/-1, % (X) English only 33,058 +/-1, % +/-1.9 Language other than English 3,702 +/ % +/-1.9 Speak English less than "very well" 1,196 +/ % +/-1.1 Spanish 649 +/ % +/-0.7 Speak English less than "very well" 141 +/ % +/-0.3 Other Indo-European languages 2,385 +/ % +/-1.6 Speak English less than "very well" 724 +/ % +/-0.9 Asian and Pacific Islander languages 587 +/ % +/-0.8 Speak English less than "very well" 331 +/ % +/-0.5 Other languages 81 +/ % +/-0.2 Speak English less than "very well" 0 +/ % +/-0.1
26 Burlington city, Vermont - Selected Social Characteristics in the United States: Page 4 of 5 Selected Social Characteristics in the United States Estimate Error Percent Error ANCESTRY Total population 38,600 +/-1, % (X) American 2,641 +/ % +/-1.6 Arab 110 +/ % +/-0.2 Czech 204 +/ % +/-0.3 Danish 106 +/ % +/-0.3 Dutch 723 +/ % +/-0.8 English 5,390 +/ % +/-1.9 French (except Basque) 4,973 +/ % +/-2.2 French Canadian 2,439 +/ % +/-1.2 German 3,860 +/ % +/-1.3 Greek 174 +/ % +/-0.3 Hungarian 309 +/ % +/-0.3 Irish 7,711 +/ % +/-2.1 Italian 3,248 +/ % +/-1.4 Lithuanian 356 +/ % +/-0.5 Norwegian 318 +/ % +/-0.4 Polish 1,625 +/ % +/-1.0 Portuguese 137 +/ % +/-0.3 Russian 871 +/ % +/-0.8 Scotch-Irish 786 +/ % +/-0.6 Scottish 1,791 +/ % +/-1.0 Slovak 148 +/ % +/-0.3 Subsaharan African 312 +/ % +/-0.8 Swedish 767 +/ % +/-0.8 Swiss 184 +/ % +/-0.4 Ukrainian 131 +/ % +/-0.2 Welsh 332 +/ % +/-0.3 West Indian (excluding Hispanic origin groups) 250 +/ % +/-0.6 Source: U.S. Census Bureau, American Community Survey Data are based on a sample and are subject to sampling variability. The degree of uncertainty for an estimate arising from sampling variability is represented through the use of a margin of error. The value shown here is the 90 percent margin of error. The margin of error can be interpreted roughly as providing a 90 percent probability that the interval defined by the estimate minus the margin of error and the estimate plus the margin of error (the lower and upper confidence bounds) contains the true value. In addition to sampling variability, the ACS estimates are subject to nonsampling error (for a discussion of nonsampling variability, see Accuracy of the Data). The effect of nonsampling error is not represented in these tables. Notes: Ancestry listed in this table refers to the total number of people who responded with a particular ancestry; for example, the estimate given for Russian represents the number of people who listed Russian as either their first or second ancestry. This table lists only the largest ancestry groups; see the Detailed Tables for more categories. Race and Hispanic origin groups are not included in this table because official data for those groups come from the Race and Hispanic origin questions rather than the ancestry question (see Demographic Table). The Census Bureau introduced a new skip pattern for the disability questions in the 2003 ACS questionnaire. This change mainly affected two individual items -- go-outside-home disability and employment disability -- and the recode for disability status, which includes the two items. Accordingly, comparisons of data from 2003 or later with data from prior years are not recommended for the relevant questions. For more information, see the ACS Subject Definitions for Disability. Data for year of entry of the native population reflect the year of entry into the U.S. by people who were born in Puerto Rico, U.S. Island Areas or born outside the U.S. to a U.S. citizen parent and who subsequently moved to the U.S. While the 2007 American Community Survey (ACS) data generally reflect the December 2006 Office of Management and Budget (OMB) definitions of metropolitan and micropolitan statistical areas; in certain instances the names, codes, and boundaries of the principal cities shown in ACS tables may differ from the OMB definitions due to differences in the effective dates of the geographic entities. The 2007 Puerto Rico Community Survey (PRCS) data generally reflect the December 2005 Office of Management and Budget (OMB) definitions of metropolitan and micropolitan statistical areas; in certain instances the names, codes, and boundaries of the principal cities shown in PRCS tables may differ from the OMB definitions due to differences in the effective dates of the geographic entities. Estimates of urban and rural population, housing units, and characteristics reflect boundaries of urban areas defined based on Census 2000 data. Boundaries for urban areas have not been updated since Census As a result, data for urban and rural areas from the ACS do not necessarily reflect the results of ongoing urbanization. Explanation of Symbols: 1. An '**' entry in the margin of error column indicates that either no sample observations or too few sample observations were available to compute a standard error and thus the margin of error. A statistical test is not appropriate. 2. An '-' entry in the estimate column indicates that either no sample observations or too few sample observations were available to compute an estimate, or a ratio of medians cannot be calculated because one or both of the median estimates falls in the lowest interval or upper interval of an open-ended distribution.
27 Burlington city, Vermont - Selected Social Characteristics in the United States: Page 5 of 5 3. An '-' following a median estimate means the median falls in the lowest interval of an open-ended distribution. 4. An '+' following a median estimate means the median falls in the upper interval of an open-ended distribution. 5. An '***' entry in the margin of error column indicates that the median falls in the lowest interval or upper interval of an open-ended distribution. A statistical test is not appropriate. 6. An '*****' entry in the margin of error column indicates that the estimate is controlled. A statistical test for sampling variability is not appropriate. 7. An 'N' entry in the estimate and margin of error columns indicates that data for this geographic area cannot be displayed because the number of sample cases is too small. 8. An '(X)' means that the estimate is not applicable or not available. The letters PDF or symbol indicate a document is in the Portable Document Format (PDF). To view the file you will need the Adobe Acrobat Reader, which is available for free from the Adobe web site.
28 Burlington city, Vermont - Selected Economic Characteristics: Page 1 of 4 Burlington city, Vermont Selected Economic Characteristics: Data Set: American Community Survey 3-Year Estimates Survey: American Community Survey NOTE. Although the American Community Survey (ACS) produces population, demographic and housing unit estimates, it is the Census Bureau's Population Estimates Program that produces and disseminates the official estimates of the population for the nation, states, counties, cities and towns and estimates of housing units for states and counties. For more information on confidentiality protection, sampling error, nonsampling error, and definitions, see Survey Methodology. Error Percent Error Selected Economic Characteristics Estimate EMPLOYMENT STATUS Population 16 years and over 33,390 +/ % (X) In labor force 22,402 +/-1, % +/-2.5 Civilian labor force 22,363 +/-1, % +/-2.5 Employed 20,680 +/-1, % +/-2.6 Unemployed 1,683 +/ % +/-1.2 Armed Forces 39 +/ % +/-0.1 Not in labor force 10,988 +/ % +/-2.5 Civilian labor force 22,363 +/-1, % (X) Unemployed 7.5% +/-1.7 (X) (X) Females 16 years and over 18,045 +/ % (X) In labor force 11,787 +/ % +/-2.9 Civilian labor force 11,787 +/ % +/-2.9 Employed 11,172 +/ % +/-3.1 Own children under 6 years 2,231 +/ % (X) All parents in family in labor force 1,304 +/ % +/-13.9 Own children 6 to 17 years 3,357 +/ % (X) All parents in family in labor force 2,655 +/ % +/-7.9 COMMUTING TO WORK Workers 16 years and over 19,900 +/ % (X) Car, truck, or van -- drove alone 11,123 +/ % +/-3.2 Car, truck, or van -- carpooled 2,132 +/ % +/-2.9 Public transportation (excluding taxicab) 874 +/ % +/-1.3 Walked 4,131 +/ % +/-2.7 Other means 793 +/ % +/-1.3 Worked at home 847 +/ % +/-1.1 Mean travel time to work (minutes) /-1.0 (X) (X) OCCUPATION Civilian employed population 16 years and over 20,680 +/-1, % (X) Management, professional, and related occupations 7,888 +/ % +/-3.1 Service occupations 4,409 +/ % +/-2.8
29 Burlington city, Vermont - Selected Economic Characteristics: Page 2 of 4 Selected Economic Characteristics Estimate Error Percent Error Sales and office occupations 5,564 +/ % +/-2.9 Farming, fishing, and forestry occupations 149 +/ % +/-0.5 Construction, extraction, maintenance and repair occupations 933 +/ % +/-1.5 Production, transportation, and material moving occupations 1,737 +/ % +/-1.9 INDUSTRY Civilian employed population 16 years and over 20,680 +/-1, % (X) Agriculture, forestry, fishing and hunting, and mining 256 +/ % +/-0.7 Construction 482 +/ % +/-0.9 Manufacturing 1,954 +/ % +/-1.8 Wholesale trade 811 +/ % +/-1.4 Retail trade 2,859 +/ % +/-2.2 Transportation and warehousing, and utilities 395 +/ % +/-0.8 Information 400 +/ % +/-0.9 Finance and insurance, and real estate and rental and leasing 897 +/ % +/-1.3 Professional, scientific, and management, and administrative and waste management services 1,634 +/ % +/-1.4 Educational services, and health care and social assistance 6,538 +/ % +/-2.6 Arts, entertainment, and recreation, and accommodation, and food services 2,543 +/ % +/-2.3 Other services, except public administration 1,263 +/ % +/-1.8 Public administration 648 +/ % +/-1.1 CLASS OF WORKER Civilian employed population 16 years and over 20,680 +/-1, % (X) Private wage and salary workers 16,115 +/-1, % +/-2.9 Government workers 3,178 +/ % +/-2.4 Self-employed workers in own not incorporated business 1,387 +/ % +/-1.6 Unpaid family workers 0 +/ % +/-0.2 INCOME AND BENEFITS (IN 2007 INFLATION-ADJUSTED DOLLARS) Total households 15,142 +/ % (X) Less than $10,000 1,350 +/ % +/-1.8 $10,000 to $14,999 1,270 +/ % +/-1.7 $15,000 to $24,999 2,226 +/ % +/-2.4 $25,000 to $34,999 2,073 +/ % +/-2.3 $35,000 to $49,999 2,301 +/ % +/-2.9 $50,000 to $74,999 2,634 +/ % +/-2.7 $75,000 to $99,999 1,425 +/ % +/-1.7 $100,000 to $149,999 1,216 +/ % +/-1.6 $150,000 to $199, / % +/-0.9 $200,000 or more 318 +/ % +/-0.9 Median household income (dollars) 38,288 +/-2,241 (X) (X) Mean household income (dollars) 54,527 +/-3,788 (X) (X) With earnings 12,632 +/ % +/-2.0 Mean earnings (dollars) 50,150 +/-2,992 (X) (X) With Social Security 3,307 +/ % +/-2.1 Mean Social Security income (dollars) 13,409 +/-1,100 (X) (X) With retirement income 1,678 +/ % +/-1.7 Mean retirement income (dollars) 18,764 +/-2,876 (X) (X) With Supplemental Security Income 800 +/ % +/-1.5 Mean Supplemental Security Income (dollars) 6,771 +/-837 (X) (X) With cash public assistance income 746 +/ % +/-1.4 Mean cash public assistance income (dollars) 4,621 +/-1,452 (X) (X) With Food Stamp benefits in the past 12 months 1,779 +/ % +/-2.4 Families 6,786 +/ % (X) Less than $10, / % +/-2.3 $10,000 to $14, / % +/-2.6 $15,000 to $24, / % +/-3.4 $25,000 to $34, / % +/-3.0
30 Burlington city, Vermont - Selected Economic Characteristics: Page 3 of 4 Selected Economic Characteristics Estimate Error Percent Error $35,000 to $49, / % +/-3.9 $50,000 to $74,999 1,339 +/ % +/-3.7 $75,000 to $99, / % +/-2.9 $100,000 to $149, / % +/-3.3 $150,000 to $199, / % +/-1.8 $200,000 or more 225 +/ % +/-1.7 Median family income (dollars) 54,246 +/-5,893 (X) (X) Mean family income (dollars) 68,085 +/-4,649 (X) (X) Per capita income (dollars) 23,082 +/-1,451 (X) (X) Nonfamily households 8,356 +/ % (X) Median nonfamily income (dollars) 30,948 +/-2,702 (X) (X) Mean nonfamily income (dollars) 42,262 +/-6,443 (X) (X) Median earnings for workers (dollars) 17,336 +/-1,811 (X) (X) Median earnings for male full-time, year-round workers (dollars) 39,510 +/-4,560 (X) (X) Median earnings for female full-time, year-round workers (dollars) 30,582 +/-1,820 (X) (X) PERCENTAGE OF FAMILIES AND PEOPLE WHOSE INCOME IN THE PAST 12 MONTHS IS BELOW THE POVERTY LEVEL All families 13.5% +/-3.1 (X) (X) With related children under 18 years 21.6% +/-6.0 (X) (X) With related children under 5 years only 20.1% +/-13.2 (X) (X) Married couple families 5.1% +/-2.4 (X) (X) With related children under 18 years 6.9% +/-4.4 (X) (X) With related children under 5 years only 2.3% +/-4.0 (X) (X) Families with female householder, no husband present 35.3% +/-9.9 (X) (X) With related children under 18 years 43.6% +/-12.5 (X) (X) With related children under 5 years only 65.9% +/-29.9 (X) (X) All people 21.0% +/-2.8 (X) (X) Under 18 years 24.3% +/-6.4 (X) (X) Related children under 18 years 23.5% +/-6.4 (X) (X) Related children under 5 years 31.0% +/-12.2 (X) (X) Related children 5 to 17 years 20.2% +/-7.0 (X) (X) 18 years and over 20.2% +/-2.8 (X) (X) 18 to 64 years 21.6% +/-3.1 (X) (X) 65 years and over 10.5% +/-3.9 (X) (X) People in families 14.3% +/-3.2 (X) (X) Unrelated individuals 15 years and over 30.4% +/-4.2 (X) (X) Source: U.S. Census Bureau, American Community Survey Data are based on a sample and are subject to sampling variability. The degree of uncertainty for an estimate arising from sampling variability is represented through the use of a margin of error. The value shown here is the 90 percent margin of error. The margin of error can be interpreted roughly as providing a 90 percent probability that the interval defined by the estimate minus the margin of error and the estimate plus the margin of error (the lower and upper confidence bounds) contains the true value. In addition to sampling variability, the ACS estimates are subject to nonsampling error (for a discussion of nonsampling variability, see Accuracy of the Data). The effect of nonsampling error is not represented in these tables. Notes: Employment and unemployment estimates may vary from the official labor force data released by the Bureau of Labor Statistics because of differences in survey design and data collection. For guidance on differences in employment and unemployment estimates from different sources go to Labor Force Guidance. Workers include members of the Armed Forces and civilians who were at work last week. Occupation codes are 4-digit codes and are based on Standard Occupational Classification Industry codes are 4-digit codes and are based on the North American Industry Classification System However, the Industry categories adhere to the guidelines issued in Clarification Memorandum No. 2, "NAICS Alternate Aggregation Structure for Use By U.S. Statistical Agencies," issued by the Office of Management and Budget. While the 2007 American Community Survey (ACS) data generally reflect the December 2006 Office of Management and Budget (OMB) definitions of metropolitan and micropolitan statistical areas; in certain instances the names, codes, and boundaries of the principal cities shown in ACS tables may differ from the OMB definitions due to differences in the effective dates of the geographic entities. The 2007 Puerto Rico Community Survey (PRCS) data generally reflect the December 2005 Office of Management and Budget (OMB) definitions of metropolitan and micropolitan statistical areas; in certain instances the names, codes, and boundaries of the principal cities shown in PRCS tables may differ from the OMB definitions due to differences in the effective dates of the geographic entities. Estimates of urban and rural population, housing units, and characteristics reflect boundaries of urban areas defined based on Census 2000 data. Boundaries for urban areas have not been updated since Census As a result, data for urban and rural areas from the
31 Burlington city, Vermont - Selected Economic Characteristics: Page 4 of 4 ACS do not necessarily reflect the results of ongoing urbanization. Explanation of Symbols: 1. An '**' entry in the margin of error column indicates that either no sample observations or too few sample observations were available to compute a standard error and thus the margin of error. A statistical test is not appropriate. 2. An '-' entry in the estimate column indicates that either no sample observations or too few sample observations were available to compute an estimate, or a ratio of medians cannot be calculated because one or both of the median estimates falls in the lowest interval or upper interval of an open-ended distribution. 3. An '-' following a median estimate means the median falls in the lowest interval of an open-ended distribution. 4. An '+' following a median estimate means the median falls in the upper interval of an open-ended distribution. 5. An '***' entry in the margin of error column indicates that the median falls in the lowest interval or upper interval of an open-ended distribution. A statistical test is not appropriate. 6. An '*****' entry in the margin of error column indicates that the estimate is controlled. A statistical test for sampling variability is not appropriate. 7. An 'N' entry in the estimate and margin of error columns indicates that data for this geographic area cannot be displayed because the number of sample cases is too small. 8. An '(X)' means that the estimate is not applicable or not available. The letters PDF or symbol indicate a document is in the Portable Document Format (PDF). To view the file you will need the Adobe Acrobat Reader, which is available for free from the Adobe web site.
32 Burlington city, Vermont - Selected Housing Characteristics: Page 1 of 4 Burlington city, Vermont Selected Housing Characteristics: Data Set: American Community Survey 3-Year Estimates Survey: American Community Survey NOTE. Although the American Community Survey (ACS) produces population, demographic and housing unit estimates, it is the Census Bureau's Population Estimates Program that produces and disseminates the official estimates of the population for the nation, states, counties, cities and towns and estimates of housing units for states and counties. For more information on confidentiality protection, sampling error, nonsampling error, and definitions, see Survey Methodology. Selected Housing Characteristics Estimate Error Percent Error HOUSING OCCUPANCY Total housing units 16,131 +/ % (X) Occupied housing units 15,142 +/ % +/-2.0 Vacant housing units 989 +/ % +/-2.0 Homeowner vacancy rate 2.1 +/-1.9 (X) (X) Rental vacancy rate 1.7 +/-1.6 (X) (X) UNITS IN STRUCTURE Total housing units 16,131 +/ % (X) 1-unit, detached 5,866 +/ % +/ unit, attached 909 +/ % +/ units 2,024 +/ % +/ or 4 units 2,708 +/ % +/ to 9 units 2,089 +/ % +/ to 19 units 995 +/ % +/ or more units 1,387 +/ % +/-1.6 Mobile home 153 +/ % +/-0.7 Boat, RV, van, etc. 0 +/ % +/-0.2 YEAR STRUCTURE BUILT Total housing units 16,131 +/ % (X) Built 2005 or later 198 +/ % +/-0.8 Built 2000 to / % +/-1.4 Built 1990 to ,022 +/ % +/-1.5 Built 1980 to ,460 +/ % +/-1.7 Built 1970 to ,827 +/ % +/-2.1 Built 1960 to ,568 +/ % +/-1.7 Built 1950 to ,126 +/ % +/-2.4 Built 1940 to ,533 +/ % +/-2.2 Built 1939 or earlier 5,732 +/ % +/-3.2 ROOMS Total housing units 16,131 +/ % (X) 1 room 244 +/ % +/ rooms 1,165 +/ % +/ rooms 2,758 +/ % +/ rooms 3,406 +/ % +/ rooms 2,823 +/ % +/-2.3
33 Burlington city, Vermont - Selected Housing Characteristics: Page 2 of 4 Selected Housing Characteristics Estimate Error Percent Error 6 rooms 2,311 +/ % +/ rooms 1,369 +/ % +/ rooms 878 +/ % +/ rooms or more 1,177 +/ % +/-1.7 Median (rooms) 4.7 +/-0.2 (X) (X) BEDROOMS Total housing units 16,131 +/ % (X) No bedroom 371 +/ % +/ bedroom 3,953 +/ % +/ bedrooms 5,215 +/ % +/ bedrooms 4,184 +/ % +/ bedrooms 1,853 +/ % +/ or more bedrooms 555 +/ % +/-1.1 HOUSING TENURE Occupied housing units 15,142 +/ % (X) Owner-occupied 6,623 +/ % +/-2.7 Renter-occupied 8,519 +/ % +/-2.7 Average household size of owner-occupied unit /-0.11 (X) (X) Average household size of renter-occupied unit /-0.10 (X) (X) YEAR HOUSEHOLDER MOVED INTO UNIT Occupied housing units 15,142 +/ % (X) Moved in 2005 or later 4,086 +/ % +/-3.0 Moved in 2000 to ,398 +/ % +/-3.5 Moved in 1990 to ,959 +/ % +/-2.4 Moved in 1980 to ,055 +/ % +/-1.6 Moved in 1970 to / % +/-1.3 Moved in 1969 or earlier 936 +/ % +/-1.4 VEHICLES AVAILABLE Occupied housing units 15,142 +/ % (X) No vehicles available 1,884 +/ % +/ vehicle available 6,987 +/ % +/ vehicles available 4,533 +/ % +/ or more vehicles available 1,738 +/ % +/-1.7 HOUSE HEATING FUEL Occupied housing units 15,142 +/ % (X) Utility gas 10,818 +/ % +/-2.7 Bottled, tank, or LP gas 805 +/ % +/-1.3 Electricity 1,211 +/ % +/-1.5 Fuel oil, kerosene, etc. 2,167 +/ % +/-2.1 Coal or coke 0 +/ % +/-0.2 Wood 80 +/ % +/-0.4 Solar energy 17 +/ % +/-0.2 Other fuel 20 +/ % +/-0.2 No fuel used 24 +/ % +/-0.3 SELECTED CHARACTERISTICS Occupied housing units 15,142 +/ % (X) Lacking complete plumbing facilities 62 +/ % +/-0.4 Lacking complete kitchen facilities 22 +/ % +/-0.2 No telephone service available 762 +/ % +/-1.5 OCCUPANTS PER ROOM Occupied housing units 15,142 +/ % (X) 1.00 or less 15,052 +/ % +/ to / % +/ or more 33 +/ % +/-0.4
34 Burlington city, Vermont - Selected Housing Characteristics: Page 3 of 4 Selected Housing Characteristics Estimate Error Percent Error VALUE Owner-occupied units 6,623 +/ % (X) Less than $50, / % +/-1.4 $50,000 to $99, / % +/-1.0 $100,000 to $149, / % +/-2.0 $150,000 to $199,999 1,151 +/ % +/-3.8 $200,000 to $299,999 2,533 +/ % +/-4.5 $300,000 to $499,999 1,727 +/ % +/-3.8 $500,000 to $999, / % +/-2.8 $1,000,000 or more 43 +/ % +/-0.8 Median (dollars) 243,700 +/-8,505 (X) (X) MORTGAGE STATUS AND SELECTED MONTHLY OWNER COSTS Owner-occupied units 6,623 +/ % (X) Housing units with a mortgage 4,663 +/ % (X) Less than $ / % +/-0.5 $300 to $ / % +/-1.0 $500 to $ / % +/-0.6 $700 to $ / % +/-1.9 $1,000 to $1,499 1,694 +/ % +/-4.1 $1,500 to $1,999 1,432 +/ % +/-3.8 $2,000 or more 1,040 +/ % +/-3.5 Median (dollars) 1,544 +/-76 (X) (X) Housing units without a mortgage 1,960 +/ % (X) Less than $ / % +/-0.3 $100 to $ / % +/-0.5 $200 to $ / % +/-0.4 $300 to $ / % +/-1.1 $400 or more 1,809 +/ % +/-3.7 Median (dollars) 628 +/-46 (X) (X) SELECTED MONTHLY OWNER COSTS AS A PERCENTAGE OF HOUSEHOLD INCOME Owner-occupied units 6,623 +/ % (X) Housing unit with a mortgage 4,663 +/ % (X) Less than 20.0 percent 1,346 +/ % +/ to 24.9 percent 783 +/ % +/ to 29.9 percent 602 +/ % +/ to 34.9 percent 470 +/ % +/ percent or more 1,442 +/ % +/-4.1 Not computed 20 +/ % (X) Housing unit without a mortgage 1,960 +/ % (X) Less than 10.0 percent 538 +/ % +/ to 14.9 percent 322 +/ % +/ to 19.9 percent 221 +/ % +/ to 24.9 percent 262 +/ % +/ to 29.9 percent 117 +/ % +/ to 34.9 percent 158 +/ % +/ percent or more 342 +/ % +/-1.7 Not computed 0 +/ % (X) GROSS RENT Renter-occupied units 8,519 +/ % (X) Less than $ / % +/-1.4 $200 to $ / % +/-1.1 $300 to $ / % +/-2.3 $500 to $749 2,312 +/ % +/-4.4 $750 to $999 2,339 +/ % +/-4.4 $1,000 to $1,499 1,581 +/ % +/-4.1 $1,500 or more 833 +/ % +/-3.1 No cash rent 391 +/ % (X) Median (dollars) 817 +/-46 (X) (X) GROSS RENT AS A PERCENTAGE OF HOUSEHOLD INCOME
35 Burlington city, Vermont - Selected Housing Characteristics: Page 4 of 4 Selected Housing Characteristics Estimate Error Percent Error Renter-occupied units 8,519 +/ % (X) Less than 15.0 percent 460 +/ % +/ to 19.9 percent 1,180 +/ % +/ to 24.9 percent 794 +/ % +/ to 29.9 percent 943 +/ % +/ to 34.9 percent 730 +/ % +/ percent or more 3,944 +/ % +/-4.8 Not computed 468 +/ % (X) Source: U.S. Census Bureau, American Community Survey Data are based on a sample and are subject to sampling variability. The degree of uncertainty for an estimate arising from sampling variability is represented through the use of a margin of error. The value shown here is the 90 percent margin of error. The margin of error can be interpreted roughly as providing a 90 percent probability that the interval defined by the estimate minus the margin of error and the estimate plus the margin of error (the lower and upper confidence bounds) contains the true value. In addition to sampling variability, the ACS estimates are subject to nonsampling error (for a discussion of nonsampling variability, see Accuracy of the Data). The effect of nonsampling error is not represented in these tables. Notes: The median gross rent excludes no cash renters. The estimate for median value, mortgage status and selected monthly owner costs, median mortgage status and selected monthly owner costs, gross rent, and median gross rent for previous years is adjusted for inflation to the current year. While the 2007 American Community Survey (ACS) data generally reflect the December 2006 Office of Management and Budget (OMB) definitions of metropolitan and micropolitan statistical areas; in certain instances the names, codes, and boundaries of the principal cities shown in ACS tables may differ from the OMB definitions due to differences in the effective dates of the geographic entities. The 2007 Puerto Rico Community Survey (PRCS) data generally reflect the December 2005 Office of Management and Budget (OMB) definitions of metropolitan and micropolitan statistical areas; in certain instances the names, codes, and boundaries of the principal cities shown in PRCS tables may differ from the OMB definitions due to differences in the effective dates of the geographic entities. Estimates of urban and rural population, housing units, and characteristics reflect boundaries of urban areas defined based on Census 2000 data. Boundaries for urban areas have not been updated since Census As a result, data for urban and rural areas from the ACS do not necessarily reflect the results of ongoing urbanization. Explanation of Symbols: 1. An '**' entry in the margin of error column indicates that either no sample observations or too few sample observations were available to compute a standard error and thus the margin of error. A statistical test is not appropriate. 2. An '-' entry in the estimate column indicates that either no sample observations or too few sample observations were available to compute an estimate, or a ratio of medians cannot be calculated because one or both of the median estimates falls in the lowest interval or upper interval of an open-ended distribution. 3. An '-' following a median estimate means the median falls in the lowest interval of an open-ended distribution. 4. An '+' following a median estimate means the median falls in the upper interval of an open-ended distribution. 5. An '***' entry in the margin of error column indicates that the median falls in the lowest interval or upper interval of an open-ended distribution. A statistical test is not appropriate. 6. An '*****' entry in the margin of error column indicates that the estimate is controlled. A statistical test for sampling variability is not appropriate. 7. An 'N' entry in the estimate and margin of error columns indicates that data for this geographic area cannot be displayed because the number of sample cases is too small. 8. An '(X)' means that the estimate is not applicable or not available. The letters PDF or symbol indicate a document is in the Portable Document Format (PDF). To view the file you will need the Adobe Acrobat Reader, which is available for free from the Adobe web site.
TABLE 1. PROFILE OF GENERAL DEMOGRAPHIC CHARACTERISTICS
 Waterloo city, Iowa TABLE 1. PROFILE OF GENERAL DEMOGRAPHIC CHARACTERISTICS Estimate Lower Bound Upper Bound Total population 66,659 64,093 69,225 SEX AND AGE Male 32,096 30,415 33,777 Female 34,563 33,025
ACS DEMOGRAPHIC AND HOUSING ESTIMATES American Community Survey 1-Year Estimates
 DP05 ACS DEMOGRAPHIC AND HOUSING ESTIMATES 2012 American Community Survey 1-Year Estimates Supporting documentation on code lists, subject definitions, data accuracy, and statistical testing can be found
ACS DEMOGRAPHIC AND HOUSING ESTIMATES American Community Survey 1-Year Estimates
 DP05 ACS DEMOGRAPHIC AND HOUSING ESTIMATES 2010 American Community Survey 1-Year s Supporting documentation on code lists, subject definitions, data accuracy, and statistical testing can be found on the
American Community Survey 5-Year Estimates
 DP02 SELECTED SOCIAL CHARACTERISTICS IN THE UNITED STATES 2007-2011 American Community Survey 5-Year Estimates Supporting documentation on code lists, subject definitions, data accuracy, and statistical
American Community Survey 5-Year Estimates
 DP05 ACS DEMOGRAPHIC AND HOUSING ESTIMATES 2011-2015 American Community Survey 5-Year Estimates Supporting documentation on code lists, subject definitions, data accuracy, and statistical testing can be
American Community Survey 5-Year Estimates
 DP05 ACS DEMOGRAPHIC AND HOUSING ESTIMATES 2011-2015 American Community Survey 5-Year Estimates Supporting documentation on code lists, subject definitions, data accuracy, and statistical testing can be
Tell us what you think. Provide feedback to help make American Community Survey data more useful for you.
 DP05 ACS DEMOGRAPHIC AND HOUSING ESTIMATES 2016 American Community Survey 1-Year Estimates Supporting documentation on code lists, subject definitions, data accuracy, and statistical testing can be found
SELECTED ECONOMIC CHARACTERISTICS American Community Survey 5-Year Estimates
 DP03 SELECTED ECONOMIC CHARACTERISTICS 2008-2012 American Community Survey 5-Year Estimates Supporting documentation on code lists, subject definitions, data accuracy, and statistical testing can be found
American Community Survey 5-Year Estimates
 DP03 SELECTED ECONOMIC CHARACTERISTICS 2013-2017 American Community Survey 5-Year Estimates Supporting documentation on code lists, subject definitions, data accuracy, and statistical testing can be found
Tell us what you think. Provide feedback to help make American Community Survey data more useful for you.
 DP03 SELECTED ECONOMIC CHARACTERISTICS 2016 American Community Survey 1-Year Estimates Supporting documentation on code lists, subject definitions, data accuracy, and statistical testing can be found on
American Community Survey 5-Year Estimates
 DP03 SELECTED ECONOMIC CHARACTERISTICS 2012-2016 American Community Survey 5-Year Estimates Supporting documentation on code lists, subject definitions, data accuracy, and statistical testing can be found
American Community Survey 5-Year Estimates
 DP03 SELECTED ECONOMIC CHARACTERISTICS 2012-2016 American Community Survey 5-Year Estimates Supporting documentation on code lists, subject definitions, data accuracy, and statistical testing can be found
American Community Survey 5-Year Estimates
 DP03 SELECTED ECONOMIC CHARACTERISTICS 2012-2016 American Community Survey 5-Year Estimates Supporting documentation on code lists, subject definitions, data accuracy, and statistical testing can be found
American Community Survey 5-Year Estimates
 DP03 SELECTED ECONOMIC CHARACTERISTICS 2012-2016 American Community Survey 5-Year Estimates Supporting documentation on code lists, subject definitions, data accuracy, and statistical testing can be found
American Community Survey 5-Year Estimates
 DP03 SELECTED ECONOMIC CHARACTERISTICS 2012-2016 American Community Survey 5-Year Estimates Supporting documentation on code lists, subject definitions, data accuracy, and statistical testing can be found
American Community Survey 5-Year Estimates
 DP03 SELECTED ECONOMIC CHARACTERISTICS 2012-2016 American Community Survey 5-Year Estimates Supporting documentation on code lists, subject definitions, data accuracy, and statistical testing can be found
American Community Survey 5-Year Estimates
 DP03 SELECTED ECONOMIC CHARACTERISTICS 2012-2016 American Community Survey 5-Year Estimates Supporting documentation on code lists, subject definitions, data accuracy, and statistical testing can be found
American Community Survey 5-Year Estimates
 DP03 SELECTED ECONOMIC CHARACTERISTICS 2012-2016 American Community Survey 5-Year Estimates Supporting documentation on code lists, subject definitions, data accuracy, and statistical testing can be found
American Community Survey 5-Year Estimates
 DP03 SELECTED ECONOMIC CHARACTERISTICS 2012-2016 American Community Survey 5-Year Estimates Supporting documentation on code lists, subject definitions, data accuracy, and statistical testing can be found
American Community Survey 5-Year Estimates
 DP03 SELECTED ECONOMIC CHARACTERISTICS 2012-2016 American Community Survey 5-Year Estimates Supporting documentation on code lists, subject definitions, data accuracy, and statistical testing can be found
American Community Survey 5-Year Estimates
 DP03 SELECTED ECONOMIC CHARACTERISTICS 2012-2016 American Community Survey 5-Year Estimates Supporting documentation on code lists, subject definitions, data accuracy, and statistical testing can be found
American Community Survey 5-Year Estimates
 DP03 SELECTED ECONOMIC CHARACTERISTICS 2012-2016 American Community Survey 5-Year Estimates Supporting documentation on code lists, subject definitions, data accuracy, and statistical testing can be found
American Community Survey 5-Year Estimates
 DP03 SELECTED ECONOMIC CHARACTERISTICS 2012-2016 American Community Survey 5-Year Estimates Supporting documentation on code lists, subject definitions, data accuracy, and statistical testing can be found
American Community Survey 5-Year Estimates
 DP03 SELECTED ECONOMIC CHARACTERISTICS 2012-2016 American Community Survey 5-Year Estimates Supporting documentation on code lists, subject definitions, data accuracy, and statistical testing can be found
American Community Survey 5-Year Estimates
 DP03 SELECTED ECONOMIC CHARACTERISTICS 2012-2016 American Community Survey 5-Year Estimates Supporting documentation on code lists, subject definitions, data accuracy, and statistical testing can be found
American Community Survey 5-Year Estimates
 DP03 SELECTED ECONOMIC CHARACTERISTICS 2012-2016 American Community Survey 5-Year Estimates Supporting documentation on code lists, subject definitions, data accuracy, and statistical testing can be found
American Community Survey 5-Year Estimates
 DP03 SELECTED ECONOMIC CHARACTERISTICS 2012-2016 American Community Survey 5-Year Estimates Supporting documentation on code lists, subject definitions, data accuracy, and statistical testing can be found
American Community Survey 5-Year Estimates
 DP03 SELECTED ECONOMIC CHARACTERISTICS 2012-2016 American Community Survey 5-Year Estimates Supporting documentation on code lists, subject definitions, data accuracy, and statistical testing can be found
American Community Survey 5-Year Estimates
 DP03 SELECTED ECONOMIC CHARACTERISTICS 2012-2016 American Community Survey 5-Year Estimates Supporting documentation on code lists, subject definitions, data accuracy, and statistical testing can be found
American Community Survey 5-Year Estimates
 DP03 SELECTED ECONOMIC CHARACTERISTICS 2012-2016 American Community Survey 5-Year Estimates Supporting documentation on code lists, subject definitions, data accuracy, and statistical testing can be found
American Community Survey 5-Year Estimates
 DP03 SELECTED ECONOMIC CHARACTERISTICS 2012-2016 American Community Survey 5-Year Estimates Supporting documentation on code lists, subject definitions, data accuracy, and statistical testing can be found
American Community Survey 5-Year Estimates
 DP03 SELECTED ECONOMIC CHARACTERISTICS 2012-2016 American Community Survey 5-Year Estimates Supporting documentation on code lists, subject definitions, data accuracy, and statistical testing can be found
American Community Survey 5-Year Estimates
 DP03 SELECTED ECONOMIC CHARACTERISTICS 2012-2016 American Community Survey 5-Year Estimates Supporting documentation on code lists, subject definitions, data accuracy, and statistical testing can be found
American Community Survey 5-Year Estimates
 DP03 SELECTED ECONOMIC CHARACTERISTICS 2012-2016 American Community Survey 5-Year Estimates Supporting documentation on code lists, subject definitions, data accuracy, and statistical testing can be found
American Community Survey 5-Year Estimates
 DP03 SELECTED ECONOMIC CHARACTERISTICS 2012-2016 American Community Survey 5-Year Estimates Supporting documentation on code lists, subject definitions, data accuracy, and statistical testing can be found
American Community Survey 5-Year Estimates
 DP03 SELECTED ECONOMIC CHARACTERISTICS 2012-2016 American Community Survey 5-Year Estimates Supporting documentation on code lists, subject definitions, data accuracy, and statistical testing can be found
Town Profiles: Demographic, Economic, and Housing Statistics for De Smet City and Wall Town, SOuth Dakota
 South Dakota State University Open PRAIRIE: Open Public Research Access Institutional Repository and Information Exchange Census Data Center News Releases SDSU Census Data Center 12-7-2017 Town Profiles:
2017 West Virginia County Data Profile. Wyoming County. Bureau of Business and Economic Research
 2017 West Virginia County Data Profile College of Business and Economics, Post Office Box 6025, Morgantown, WV 26506 304.293. 7831; bebureau@mail.wvu.edu https://business.wvu.edu/centers/bureau of business
Economic Overview City of Tyler, TX. January 8, 2018
 Economic Overview City of Tyler, TX January 8, 2018 DEMOGRAPHIC PROFILE...3 EMPLOYMENT TRENDS...5 WAGE TRENDS...5 COST OF LIVING INDEX...6 INDUSTRY SNAPSHOT...7 OCCUPATION SNAPSHOT...9 INDUSTRY CLUSTERS...
Economic Overview York County, South Carolina. February 14, 2018
 Economic Overview York County, February 14, 2018 DEMOGRAPHIC PROFILE... 3 EMPLOYMENT TRENDS... 5 UNEMPLOYMENT RATE... 5 WAGE TRENDS... 6 COST OF LIVING INDEX... 6 INDUSTRY SNAPSHOT... 7 OCCUPATION SNAPSHOT...
2016 West Virginia County Data Profile. Randolph County. Profile Compiled by: Scott Pitzer and Christiadi
 2016 West Virginia County Data Profile Profile Compiled by: Scott Pitzer and Christiadi College of Business and Economics, Post Office Box 6025, Morgantown, WV 26506 304.293. 7831; bebureau@mail.wvu.edu
2016 West Virginia County Data Profile. Boone County. Profile Compiled by: Scott Pitzer and Christiadi
 2016 West Virginia County Data Profile Profile Compiled by: Scott Pitzer and Christiadi College of Business and Economics, Post Office Box 6025, Morgantown, WV 26506 304.293. 7831; bebureau@mail.wvu.edu
ECONOMIC OVERVIEW DuPage County, Illinois
 ECONOMIC OVERVIEW DuPage County, Illinois DEMOGRAPHIC PROFILE... 3 EMPLOYMENT TRENDS... 5 UNEMPLOYMENT RATE... 5 WAGE TRENDS... 6 COST OF LIVING INDEX... 7 INDUSTRY SNAPSHOT... 8 OCCUPATION SNAPSHOT...
Economic Overview. Lawrence, KS MSA
 Economic Overview Lawrence, KS MSA March 5, 2019 DEMOGRAPHIC PROFILE... 3 EMPLOYMENT TRENDS... 5 UNEMPLOYMENT RATE... 5 WAGE TRENDS... 6 COST OF LIVING INDEX... 7 INDUSTRY SNAPSHOT... 8 OCCUPATION SNAPSHOT...
Economic Overview Monterey County, California. July 22, 2016
 Economic Overview Monterey July 22, 2016 DEMOGRAPHIC PROFILE... 3 EMPLOYMENT TRENDS... 5 UNEMPLOYMENT RATE... 5 WAGE TRENDS... 6 COST OF LIVING INDEX... 6 INDUSTRY SNAPSHOT... 7 OCCUPATION SNAPSHOT...
Economic Overview Long Island
 Report created on August 29, 2017 Economic Overview Long Island Contact: Lisa.Montiel@suny.edu DEMOGRAPHIC PROFILE... 3 EMPLOYMENT TRENDS... 5 UNEMPLOYMENT RATE... 5 WAGE TRENDS... 6 COST OF LIVING INDEX...
Economic Overview Loudoun County, Virginia. October 23, 2017
 Economic Overview October 23, 2017 DEMOGRAPHIC PROFILE... 3 EMPLOYMENT TRENDS... 5 UNEMPLOYMENT RATE... 5 WAGE TRENDS... 6 COST OF LIVING INDEX... 6 INDUSTRY SNAPSHOT... 7 OCCUPATION SNAPSHOT... 9 INDUSTRY
DEMOGRAPHIC PROFILE...3 EMPLOYMENT TRENDS...5 UNEMPLOYMENT RATE...5 WAGE TRENDS...6 COST OF LIVING INDEX...6 INDUSTRY SNAPSHOT...7
 March 14, 2017 DEMOGRAPHIC PROFILE...3 EMPLOYMENT TRENDS...5 UNEMPLOYMENT RATE...5 WAGE TRENDS...6 COST OF LIVING INDEX...6 INDUSTRY SNAPSHOT...7 OCCUPATION SNAPSHOT...9 INDUSTRY CLUSTERS... 12 EDUCATION
Economic Overview New York
 Report created on October 20, 2015 Economic Overview Created using: Contact: Lisa.Montiel@suny.edu DEMOGRAPHIC PROFILE...3 EMPLOYMENT TRENDS...5 UNEMPLOYMENT RATE...5 WAGE TRENDS...6 COST OF LIVING INDEX...6
Economic Overview Western New York
 Report created on August 29, 2017 Economic Overview Western New Contact: Lisa.Montiel@suny.edu DEMOGRAPHIC PROFILE... 3 EMPLOYMENT TRENDS... 5 UNEMPLOYMENT RATE... 5 WAGE TRENDS... 6 COST OF LIVING INDEX...
October 28, Economic Overview Yellowstone County, Montana
 October 28, 2016 Economic Overview Yellowstone DEMOGRAPHIC PROFILE...3 EMPLOYMENT TRENDS...5 UNEMPLOYMENT RATE...5 WAGE TRENDS...6 COST OF LIVING INDEX...6 INDUSTRY SNAPSHOT...7 OCCUPATION SNAPSHOT...9
Mid - City Industrial
 Minneapolis neighborhood profile October 2011 Mid - City Industrial About this area The Mid-City Industrial neighborhood is bordered by I- 35W, Highway 280, East Hennepin Avenue, and Winter Street Northeast.
Economic Overview Fairfax / Falls Church. October 23, 2017
 Economic Overview Fairfax / Falls Church October 23, 2017 DEMOGRAPHIC PROFILE... 3 EMPLOYMENT TRENDS... 5 UNEMPLOYMENT RATE... 5 WAGE TRENDS... 6 COST OF LIVING INDEX... 6 INDUSTRY SNAPSHOT... 7 OCCUPATION
Economic Overview Long Island
 Report created on October 20, 2015 Economic Overview Long Island Created using: Contact: Lisa.Montiel@suny.edu DEMOGRAPHIC PROFILE...3 EMPLOYMENT TRENDS...5 UNEMPLOYMENT RATE...5 WAGE TRENDS...6 COST OF
University of Minnesota
 neighborhood profile October 2011 About this area The University neighborhood is bordered by 11th Avenue Southeast, University Avenue, 15th Avenue Southeast, the railroad tracks, Oak Street, and the Mississippi
Economic Overview Capital District
 August 29, 2017 Economic Overview Capital District Contact: Lisa.Montiel@suny.edu DEMOGRAPHIC PROFILE... 3 EMPLOYMENT TRENDS... 5 UNEMPLOYMENT RATE... 5 WAGE TRENDS... 6 COST OF LIVING INDEX... 6 INDUSTRY
Economic Overview Mohawk Valley
 Report created on August 29, 2017 Economic Overview Mohawk Valley Contact: Lisa.Montiel@suny.edu DEMOGRAPHIC PROFILE... 3 EMPLOYMENT TRENDS... 5 UNEMPLOYMENT RATE... 5 WAGE TRENDS... 6 COST OF LIVING INDEX...
Camden Industrial. Minneapolis neighborhood profile. About this area. Trends in the area. Neighborhood in Minneapolis.
 Minneapolis neighborhood profile October 2011 Camden Industrial About this area The Camden Industrial neighborhood is bordered by 48th Avenue North, the Mississippi River, Dowling Avenue North, Washington
Shingle Creek. Minneapolis neighborhood profile. About this area. Trends in the area. Neighborhood in Minneapolis. October 2011
 neighborhood profile October 2011 About this area The neighborhood is bordered by 53rd Avenue North, Humboldt Avenue North, 49th Avenue North, and Xerxes Avenue North. It is home to Olson Middle School.
American Community Survey 5-Year Estimates
 S2401 OCCUPATION BY SEX AND MEDIAN EARNINGS IN THE PAST 12 MONTHS (IN 2012 INFLATION- ADJUSTED DOLLARS) FOR THE CIVILIAN EMPLOYED POPULATION 16 YEARS AND OVER 2008-2012 American Community Survey 5-Year
Economic Overview 45-Minute Commute From Airport Park. June 6, 2017
 Economic Overview 45-Minute Commute From Airport Park June 6, 2017 DEMOGRAPHIC PROFILE... 3 EMPLOYMENT TRENDS... 5 WAGE TRENDS... 5 COST OF LIVING INDEX... 6 INDUSTRY SNAPSHOT... 7 OCCUPATION SNAPSHOT...
June 9, Economic Overview Billings, MT MSA
 June 9, 2016 Economic Overview Billings, MT MSA DEMOGRAPHIC PROFILE... 3 EMPLOYMENT TRENDS... 5 UNEMPLOYMENT RATE... 5 WAGE TRENDS... 6 COST OF LIVING INDEX... 6 INDUSTRY SNAPSHOT... 7 OCCUPATION SNAPSHOT...
Economic Overview Prince William/Manassas. October 23, 2017
 Economic Overview Prince William/Manassas October 23, 2017 DEMOGRAPHIC PROFILE... 3 EMPLOYMENT TRENDS... 5 UNEMPLOYMENT RATE... 5 WAGE TRENDS... 6 COST OF LIVING INDEX... 6 INDUSTRY SNAPSHOT... 7 OCCUPATION
SDs from Regional Peer Group Mean. SDs from Size Peer Group Mean
 Family: Population Demographics Population Entire MSA 2414616 Central Cities (CC) 764431 Outside Central Cities 1650185 Percent of Entire MSA 31.66% Population in CC Percent Change in Population from 1999
Economic Overview Plant City Region. April 5, 2017
 Economic Overview Plant City Region April 5, 2017 DEMOGRAPHIC PROFILE... 3 EMPLOYMENT TRENDS... 5 WAGE TRENDS... 5 COST OF LIVING INDEX... 6 INDUSTRY SNAPSHOT... 7 OCCUPATION SNAPSHOT... 9 INDUSTRY CLUSTERS...
SDs from Regional Peer Group Mean. SDs from Size Peer Group Mean
 Family: Population Demographics Population Entire MSA 602894 Central Cities (CC) 227,818 Outside Central Cities 375,076 Percent of Entire MSA 37.79% Population in CC Percent Change in Population from 1999
SDs from Regional Peer Group Mean. SDs from Size Peer Group Mean
 Family: Population Demographics Population Entire MSA 1187941 Central Cities (CC) 511,843 Outside Central Cities 676,098 Percent of Entire MSA 43.09% Population in CC Percent Change in Population from
SDs from Regional Peer Group Mean. SDs from Size Peer Group Mean
 Family: Population Demographics Population Entire MSA 661645 Central Cities (CC) 247,057 Outside Central Cities 414,588 Percent of Entire MSA 37.34% Population in CC Percent Change in Population from 1999
SDs from Regional Peer Group Mean. SDs from Size Peer Group Mean
 Family: Population Demographics Population Entire MSA 583845 Central Cities (CC) 316,649 Outside Central Cities 267,196 Percent of Entire MSA 54.24% Population in CC Percent Change in Population from 1999
SDs from Regional Peer Group Mean. SDs from Size Peer Group Mean
 Family: Population Demographics Population Entire MSA 1251509 Central Cities (CC) 540,423 Outside Central Cities 711,086 Percent of Entire MSA 43.18% Population in CC Percent Change in Population from
SDs from Regional Peer Group Mean. SDs from Size Peer Group Mean
 Family: Population Demographics Population Entire MSA 1135614 Central Cities (CC) 677,766 Outside Central Cities 457,848 Percent of Entire MSA 59.68% Population in CC Percent Change in Population from
SDs from Regional Peer Group Mean. SDs from Size Peer Group Mean
 Family: Population Demographics Population Entire MSA 591932 Central Cities (CC) 260,970 Outside Central Cities 330,962 Percent of Entire MSA 44.09% Population in CC Percent Change in Population from 1999
SDs from Regional Peer Group Mean. SDs from Size Peer Group Mean
 Family: Population Demographics Population Entire MSA 1100491 Central Cities (CC) 735,617 Outside Central Cities 364,874 Percent of Entire MSA 66.84% Population in CC Percent Change in Population from
SDs from Regional Peer Group Mean. SDs from Size Peer Group Mean
 Family: Population Demographics Population Entire MSA 540258 Central Cities (CC) 198,915 Outside Central Cities 341,343 Percent of Entire MSA 36.82% Population in CC Percent Change in Population from 1999
SDs from Regional Peer Group Mean. SDs from Size Peer Group Mean
 Family: Population Demographics Population Entire MSA 1249763 Central Cities (CC) 691,295 Outside Central Cities 558,468 Percent of Entire MSA 55.31% Population in CC Percent Change in Population from
SDs from Regional Peer Group Mean. SDs from Size Peer Group Mean
 Family: Population Demographics Population Entire MSA 1088514 Central Cities (CC) 272,953 Outside Central Cities 815,561 Percent of Entire MSA 25.08% Population in CC Percent Change in Population from
SDs from Regional Peer Group Mean. SDs from Size Peer Group Mean
 Family: Population Demographics Population Entire MSA 922516 Central Cities (CC) 470,859 Outside Central Cities 451,657 Percent of Entire MSA 51.04% Population in CC Percent Change in Population from 1999
SDs from Regional Peer Group Mean. SDs from Size Peer Group Mean
 Family: Population Demographics Population Entire MSA 687249 Central Cities (CC) 198,500 Outside Central Cities 488,749 Percent of Entire MSA 28.88% Population in CC Percent Change in Population from 1999
SDs from Regional Peer Group Mean. SDs from Size Peer Group Mean
 Family: Population Demographics Population Entire MSA 542149 Central Cities (CC) 181870 Outside Central Cities 360279 Percent of Entire MSA 33.55% Population in CC Percent Change in Population from 1999
SDs from Regional Peer Group Mean. SDs from Size Peer Group Mean
 Family: Population Demographics Population Entire MSA 1025598 Central Cities (CC) 293,834 Outside Central Cities 731,764 Percent of Entire MSA 28.65% Population in CC Percent Change in Population from
SDs from Regional Peer Group Mean. SDs from Size Peer Group Mean
 Family: Population Demographics Population Entire MSA 875583 Central Cities (CC) 232,835 Outside Central Cities 642,748 Percent of Entire MSA 26.59% Population in CC Percent Change in Population from 1999
SDs from Regional Peer Group Mean. SDs from Size Peer Group Mean
 Family: Population Demographics Population Entire MSA 716998 Central Cities (CC) 448,275 Outside Central Cities 268,723 Percent of Entire MSA 62.52% Population in CC Percent Change in Population from 1999
SDs from Regional Peer Group Mean. SDs from Size Peer Group Mean
 Family: Population Demographics Population Entire MSA 1333914 Central Cities (CC) 284,943 Outside Central Cities 1,048,971 Percent of Entire MSA 21.36% Population in CC Percent Change in Population from
SDs from Regional Peer Group Mean. SDs from Size Peer Group Mean
 Family: Population Demographics Population Entire MSA 712738 Central Cities (CC) 448,607 Outside Central Cities 264,131 Percent of Entire MSA 62.94% Population in CC Percent Change in Population from 1999
SDs from Regional Peer Group Mean. SDs from Size Peer Group Mean. Population Entire MSA
 Family: Population Demographics Population Entire MSA 1169641 Central Cities (CC) 0 Outside Central Cities 1,169,641 Percent of Entire MSA 0% Population in CC Percent Change in Population from 1999 to
Tyler Area Economic Overview
 Tyler Area Economic Overview Demographic Profile. 2 Unemployment Rate. 4 Wage Trends. 4 Cost of Living Index...... 5 Industry Clusters. 5 Occupation Snapshot. 6 Education Levels 7 Gross Domestic Product
SDs from Regional Peer Group Mean. SDs from Size Peer Group Mean
 Family: Population Demographics Population Entire MSA 3251876 Central Cities (CC) 2,078,750 Outside Central Cities 1,173,126 Percent of Entire MSA 63.92% Population in CC Percent Change in Population from
SDs from Regional Peer Group Mean. SDs from Size Peer Group Mean
 Family: Population Demographics Population Entire MSA 1592383 Central Cities (CC) 1,181,140 Outside Central Cities 411,243 Percent of Entire MSA 74.17% Population in CC Percent Change in Population from
SDs from Regional Peer Group Mean. SDs from Size Peer Group Mean
 Family: Population Demographics Population Entire MSA 1776062 Central Cities (CC) 716,793 Outside Central Cities 1,059,269 Percent of Entire MSA 40.36% Population in CC Percent Change in Population from
SDs from Regional Peer Group Mean. SDs from Size Peer Group Mean
 Family: Population Demographics Population Entire MSA 4112198 Central Cities (CC) 416,474 Outside Central Cities 3,695,724 Percent of Entire MSA 10.13% Population in CC Percent Change in Population from
SDs from Regional Peer Group Mean. SDs from Size Peer Group Mean
 Family: Population Demographics Population Entire MSA 9519338 Central Cities (CC) 4408996 Outside Central Cities 5110342 Percent of Entire MSA 46.32% Population in CC Percent Change in Population from
SDs from Regional Peer Group Mean. SDs from Size Peer Group Mean
 Family: Population Demographics Population Entire MSA 1623018 Central Cities (CC) 152397 Outside Central Cities 1470621 Percent of Entire MSA 9.39% Population in CC Percent Change in Population from 1999
SDs from Regional Peer Group Mean. SDs from Size Peer Group Mean
 Family: Population Demographics Population Entire MSA 1731183 Central Cities (CC) 776733 Outside Central Cities 954450 Percent of Entire MSA 44.87% Population in CC Percent Change in Population from 1999
SDs from Regional Peer Group Mean. SDs from Size Peer Group Mean
 Family: Population Demographics Population Entire MSA 2968806 Central Cities (CC) 669,769 Outside Central Cities 2,299,037 Percent of Entire MSA 22.56% Population in CC Percent Change in Population from
SDs from Regional Peer Group Mean. SDs from Size Peer Group Mean
 Family: Population Demographics Population Entire MSA 2846289 Central Cities (CC) 809063 Outside Central Cities 2037226 Percent of Entire MSA 28.43% Population in CC Percent Change in Population from 1999
SDs from Regional Peer Group Mean. SDs from Size Peer Group Mean
 Family: Population Demographics Population Entire MSA 4441551 Central Cities (CC) 1147720 Outside Central Cities 3293831 Percent of Entire MSA 25.84% Population in CC Percent Change in Population from
SDs from Regional Peer Group Mean. SDs from Size Peer Group Mean
 Family: Population Demographics Population Entire MSA 1500741 Central Cities (CC) 661799 Outside Central Cities 838942 Percent of Entire MSA 44.1% Population in CC Percent Change in Population from 1999
SDs from Regional Peer Group Mean. SDs from Size Peer Group Mean
 Family: Population Demographics Population Entire MSA 2552994 Central Cities (CC) 686992 Outside Central Cities 1866002 Percent of Entire MSA 26.91% Population in CC Percent Change in Population from 1999
Economic Overview Marlboro County Labor Shed. June 29, 2016
 Economic Overview Marlboro County Labor June 29, 2016 DEMOGRAPHIC PROFILE...3 EMPLOYMENT TRENDS...5 UNEMPLOYMENT RATE...5 WAGE TRENDS...6 COST OF LIVING INDEX...6 INDUSTRY SNAPSHOT...7 OCCUPATION SNAPSHOT...9
Average persons in household. Top three industries Post-secondary education (25 64 years) 7.1% Unemployment rate
 7.1% Unemployment rate") Demographic snapshot The Town of Oakville City of Burl ington City of Mis sissauga Town of Milton Population 198,042 Median age Average persons in household 41 2.8 years old $149,945 Average household
Demographic snapshot The Town of Oakville City of Burl ington City of Mis sissauga Town of Milton Population 198,042 Median age Average persons in household 41 2.8 years old $149,945 Average household