AVAILABLE FOR LEASE Mayfield Road. Mayfield Heights, Ohio
|
|
|
- Camron Lee
- 5 years ago
- Views:
Transcription


1 1,700 SF Retail Space For Lease Property Highlights Below market lease rates Refurbished in 2016 Furniture, fixtures and equipment available for purchase Fully built out restaurant space with hood Excellent visbility on Mayfield Road Easy access to I-271
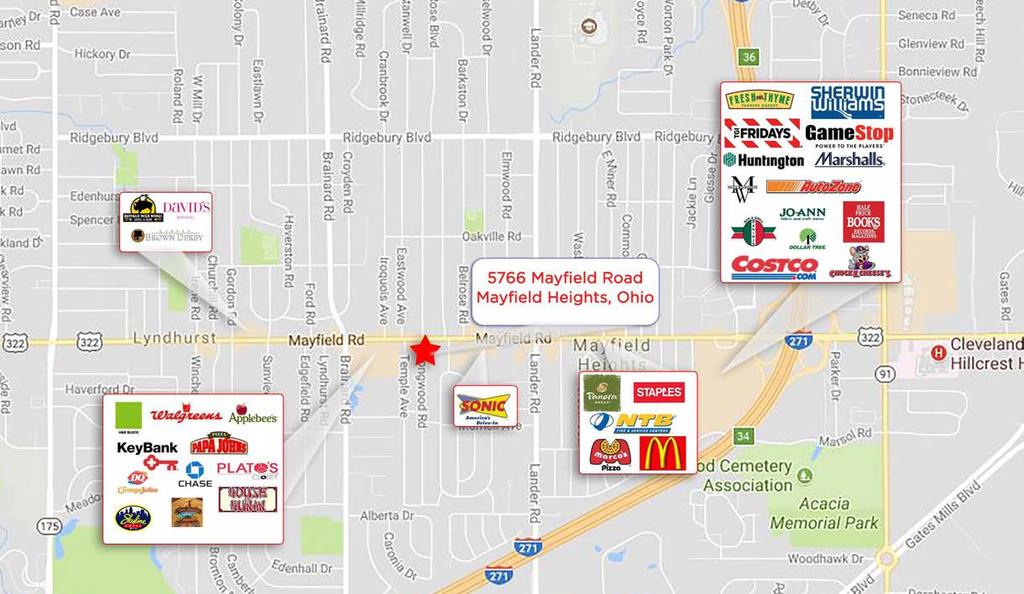
2 Area Map


3 BUILDING PHOTOS


4 BUILDING PHOTOS


5 BUILDING PHOTOS
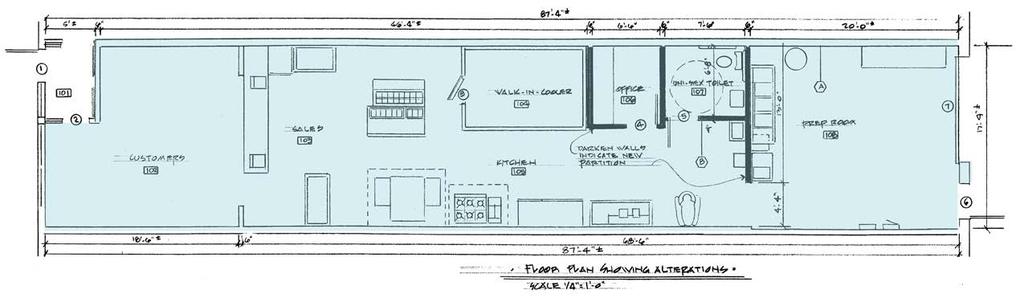


6 FLOORPLAN
 6,113 33,684 75,995 Total Employees 5,468 30,303 66,573 Total Consumer Expenditures $357,367 $2,004,551 $4,168,922 TRAFFIC COUNTS Mayfield")

7 DEMOGRAPHICS 1 Mile 3 Mile 5 Mile Estimated Population (2017) 13,544 72, ,357 Projected Population (2022) 14,006 75, ,985 Estimated Households (2017) 5,839 32,180 72,612 Projected Households (2022) 6,113 33,684 75,995 Total Employees 5,468 30,303 66,573 Total Consumer Expenditures $357,367 $2,004,551 $4,168,922 TRAFFIC COUNTS Mayfield Road & Brainard Road: Mayfield Road & Lander Road: 20,220 VPD 26,070 VPD 3 Summit Park Drive, Suite 200 Cleveland, Ohio Main Fax crescorealestate.com and same is submitted subject to errors, omissions, change of price, rental or other conditions, withdrawal without notice, and to any special listing conditions imposed
 : 46,491 167,879 548,119 Population (2000) : 46,950 167,972 523,788 Population (2010) : 47,177 160,140 466,233 Population (Current) : 46,310 157,686")
8 Drive-Time Map with Demographics Description 5 Minute 10 Minute 15 Minute Area & Density : Area (Square Miles) : Density(Population Per Square Mile) : 2, , ,349 Population By Year Population (1990) : 46, , ,119 Population (2000) : 46, , ,788 Population (2010) : 47, , ,233 Population (Current) : 46, , ,453 Population (5 Yr. Forecast) : 47, , ,628 Percent Growth (Current Yr./Previous Yr.) : Percent Forecast (5 Yr. Forecast/Current Yr.) : Households By Year Households (1990) : 20,540 68, ,365 Households (2000) : 21,237 71, ,443 Households (2010) : 22,088 69, ,312 Households (Current) : 21,574 68, ,337 Households (5 Yr. Forecast) : 22,581 71, ,456 Percent Growth (Current Yr./Previous Yr.) : Percent Forecast (5 Yr. Forecast/Current Yr.) : Summit Park Drive, Suite 200 Cleveland, Ohio Main Fax crescorealestate.com and same is submitted subject to errors, omissions, change of price, rental or other conditions, withdrawal without notice, and to any special listing conditions imposed
9 Drive-Time Map with Demographics Description 5 Minute 10 Minute 15 Minute General Population Characteristics Male : 21,017 72, ,321 Female : 25,293 85, ,132 Density : 2, , ,349 Urban : 45, , ,814 Rural : 703 3,366 8,639 General Household Characteristics Households (Current) : 21,574 68, ,337 Families : 11,584 39, ,806 Average Size of Household : Median Age of Householder : Median Value Owner Occupied ($) : 178, , , Median Rent ($) : Median Vehicles Per Household : General Housing Characteristics Housing Units : 23,338 75, ,749 Owner Occupied Units : 13,818 43, ,654 Renter Occupied Units : 7,756 24,140 84,683 Vacant Units : 1,764 7,065 32,412 Population By Race White Alone : 37, , ,640 Black Alone : 4,651 45, ,850 Asian Alone : 2,672 6,657 13,180 Native American and Alaska Native Alone : Other Race Alone : ,115 Two or More Races : 881 3,786 10,845 Population By Ethnicity Hispanic : 946 3,304 8,411 White Non-Hispanic : 37,241 98, ,751 General Income Characteristics Median Household Income ($) : 72, , , Total Household Income ($) : 2,001,071,098 6,694,193,278 15,703,763,555 Average Household Income ($) : 92,754 98,331 79,177 Per Capita Income ($) : 43,210 42,453 34,179 Consumer Expenditures Total Consumer Expenditures ($) : 1,299,147 3,955,511 10,012,513 Total Retail Sales ($) : 1,516,577 3,192,123 5,339, Arbusto Employment By Place Of Business Total Employees : 18,978 62, ,328 Total Establishments : 2,116 4,993 9,415 3 Summit Park Drive, Suite 200 Cleveland, Ohio Main Fax crescorealestate.com and same is submitted subject to errors, omissions, change of price, rental or other conditions, withdrawal without notice, and to any special listing conditions imposed
LEASE City Avenue Philadelphia, PA Agent Contact: LEASE FOR $20 S/F PLUS UTILITES. Lisa Trout
 LEASE 4920-50 City Avenue Philadelphia, PA 19131 C APITAL COMMERCIAL R EAL ESTATE G ROUP 3748 West Chester Pike Newtown Square, PA 19073 Phone: 610-359-9700 Fax: 610-359-9750 www.capitalcomre.com BEAUTIFUL
TEMPE CROSSING II - RETAIL PAD
 Excellent infill pad opportunity in dynamic retail corridor, 1 mi. East of I-10 Fully finished pad. Over $250,000 worth of site work already completed. Buildable up to 8,500 square feet. Excellent parking!
For Lease. Free-standing Retail / Office Building 1304 Saratoga Avenue San Jose, CA
 For Lease Free-standing Retail / Office Building 1304 Saratoga Avenue San Jose, CA 95117 Description Approximately 4,500 sf plus mezzanine Outstanding identity and visibility In neighborhood shopping center
PROPOSED SHOPPING CENTER
 PROPOSED SHOPPING CENTER Southeast Corner I-95 & Highway 192 Melbourne, Florida In a 5 Mile Radius 80,862 Population 32,408 Households $61K Avg HH Income SOONER INVESTMENT Commercial & Investment Real
EVEREST. Retail Investment Opportunity. Ivy Hills Retail Center 7397 Main Street Newtown, OH CONTACT: Chris Nachtrab.
 Retail Investment Opportunity CONTACT: Chris Nachtrab chris.nachtrab@everestrealestate.com 513/769-2509 John Thompson john.thompson@everestrealestate.com 513/769-2514 Ivy Hills Retail Center 7397 Main
Roseville Towne Center Gratiot Avenue Roseville, MI 48066
 Retail Space Available 65,000 SF Second Level Space and Outparcel Florence Street Massachusetts Street Gratiot Avenue E. 12 Mile Road Property Highlights is shadow-anchored by Walmart and includes national
The Blair Center US Highway 98 North, Lakeland, Fl Jack Strollo, CCIM, CPM
 , LARGE PYLON SIGN CLOSE TO I-4 MULTI TENANT FIVE UNITS EXCELLENT FOR OWNER/OCCUPANT 41,500 VPD Vice President, Broker jstrollo@resbroadway.com BK698301 100 S Kentucky Ave, Suite 290 Lakeland, FL 33801
The Trails. 1,500 sf Space Available. In a 3 Mile Radius 69,985 Population 25,450 Households $78,216 Avg HH Inc. 1,500 sf Corner Space
 1,500 sf Space Available The Trails Edmond Rd (2nd St) & Santa Fe Ave ~ Edmond, Oklahoma Current Tenancy: Edmond YMCA Spinal Wellness Clinic Lemongrass Thai Cuisine Kumon Learning Center Katie s Family
Commission District 4 Census Data Aggregation
 Commission District 4 Census Data Aggregation 2011-2015 American Community Survey Data, U.S. Census Bureau Table 1 (page 2) Table 2 (page 2) Table 3 (page 3) Table 4 (page 4) Table 5 (page 4) Table 6 (page
Northwest Census Data Aggregation
 Northwest Census Data Aggregation 2011-2015 American Community Survey Data, U.S. Census Bureau Table 1 (page 2) Table 2 (page 2) Table 3 (page 3) Table 4 (page 4) Table 5 (page 4) Table 6 (page 5) Table
Riverview Census Data Aggregation
 Riverview Census Data Aggregation 2011-2015 American Community Survey Data, U.S. Census Bureau Table 1 (page 2) Table 2 (page 2) Table 3 (page 3) Table 4 (page 4) Table 5 (page 4) Table 6 (page 5) Table
Zipe Code Census Data Aggregation
 Zipe Code 66101 Census Data Aggregation 2011-2015 American Community Survey Data, U.S. Census Bureau Table 1 (page 2) Table 2 (page 2) Table 3 (page 3) Table 4 (page 4) Table 5 (page 4) Table 6 (page 5)
Zipe Code Census Data Aggregation
 Zipe Code 66103 Census Data Aggregation 2011-2015 American Community Survey Data, U.S. Census Bureau Table 1 (page 2) Table 2 (page 2) Table 3 (page 3) Table 4 (page 4) Table 5 (page 4) Table 6 (page 5)
University of Minnesota
 neighborhood profile October 2011 About this area The University neighborhood is bordered by 11th Avenue Southeast, University Avenue, 15th Avenue Southeast, the railroad tracks, Oak Street, and the Mississippi
Mid - City Industrial
 Minneapolis neighborhood profile October 2011 Mid - City Industrial About this area The Mid-City Industrial neighborhood is bordered by I- 35W, Highway 280, East Hennepin Avenue, and Winter Street Northeast.
Camden Industrial. Minneapolis neighborhood profile. About this area. Trends in the area. Neighborhood in Minneapolis.
 Minneapolis neighborhood profile October 2011 Camden Industrial About this area The Camden Industrial neighborhood is bordered by 48th Avenue North, the Mississippi River, Dowling Avenue North, Washington
Shingle Creek. Minneapolis neighborhood profile. About this area. Trends in the area. Neighborhood in Minneapolis. October 2011
 neighborhood profile October 2011 About this area The neighborhood is bordered by 53rd Avenue North, Humboldt Avenue North, 49th Avenue North, and Xerxes Avenue North. It is home to Olson Middle School.
Commercial Land for Sale. Messina Highlands Acres / W. Market St. & Richland Ave West Market Street; York, PA SITE
 3 2018 Messina Highlands 2.21 Acres / W. Market St. & Richland Ave. ; SITE York Fuel Stop / Tobacco Outlet T & D Car Wash 2.21 Acres Commercial Land Available for Sale 12,000 CPD on West Market Street
Former Sports Authority
 Former Sports Authority Agent: Boh Kurylo Phone: 402-502-4707 Email: bkurylo@lernerco.com Agent: Ben Meier Phone: 402-502-4715 Email: bmeier@lernerco.com 10855 W. Dodge Rd., Ste 270 Omaha, NE 68154 402-330-5480
Retail Space Available
 Retail Space Available SRS Real Estate Partners 1871 The Alameda, Suite 250 San Jose, CA 95126 408.553.6135 www.srsre.com Exclusive Leasing Agents Randol Mackley Bruce Frazer Senior Vice President Senior
Brannon Crossing 4089 Lexington Road Lexington, KY 40356
 Brannon Crossing Retail Space Available 1.075 1.33 Acres 4,051 Cars Per Day 45,448 Cars Per Day Lexington/Nicolasville Road, U.S. 27 Brannon Road, KY 2080 Property Highlights Located in strong retail corridor
Premier Boulevard Outparcels Roanoke Rapids, NC 27870
 1.69 AC 1.46 AC 1.24 AC NCDOT Premier Boulevard Extension 3.01 AC 1.05 AC 1.10 AC 17,000 VPD Exit 173 1.76 AC 42,000 VPD PROPERTY HIGHLIGHTS Developed Outparcels Available in WalMart Supercenter anchored
OWNER USER / SBA FINANCING: Office Building For Sale. PROPERTY HIGHLIGHTS: Currently 90% Occupied, but in 2016 the whole top floor.
 OWNER USER / SBA FINANCING: Office Building For Sale Investment Lake Sahara Plaza at 8685 West Sahara Avenue is an 11,858 +/ SF Office building located in the prestigious Lakes subdivision on the edge
Urban Action Agenda Community Profiles COVER TO GO HERE. City of Beacon
 Urban Action Agenda Community Profiles COVER TO GO HERE City of Beacon COMMUNITY OVERVIEW MAP POPULATION & DEMOGRAPHICS Population Basics 2,212 Population (2015) Population Change 2. since 2000 0.5 Square
For Sale ± 1.25 Acres 2 Bay Chevron Service Station East John Ralston Road, Houston, TX 77029
 For Sale ± 1.25 Acres 2 Bay Chevron Service Station 11103 East Freeway @ John Ralston Road, Houston, TX 77029 DAC REALTY GROUP, INC CenterPointe Hotels SITE Description: Location: Land Size: Building Size:
LAND FOR SALE Blair Road, Mint Hill, NC PROPERTY OVERVIEW. Large parcel with I-485 access via Blair Road exit in the path of. growth.
 LAND FOR SALE 10395 Blair Road, Mint Hill, NC 28227 OFFERING SUMMARY SALE PRICE: $1,000,000 PROPERTY OVERVIEW Large parcel with I485 access via Blair Road exit in the path of growth. LOT SIZE: 9.28 Acres
Town Profiles: Demographic, Economic, and Housing Statistics for De Smet City and Wall Town, SOuth Dakota
 South Dakota State University Open PRAIRIE: Open Public Research Access Institutional Repository and Information Exchange Census Data Center News Releases SDSU Census Data Center 12-7-2017 Town Profiles:
Mattydale K-Mart Plaza Brewerton Road (Rt. 11) Syracuse, NY 13211
 Syracuse, NY 13211") Exclusive Offering FOR LEASE Mattydale K-Mart Plaza Brewerton Road (Rt. 11) Syracuse, NY 13211 Exterior Renovations Completed! SITE I-81 SITE Rt.11 I-81 SYRACUSE AIRPORT I-90 I-90 FEATURES: High Visibility
Exclusive Offering FOR LEASE Mattydale K-Mart Plaza Brewerton Road (Rt. 11) Syracuse, NY 13211 Exterior Renovations Completed! SITE I-81 SITE Rt.11 I-81 SYRACUSE AIRPORT I-90 I-90 FEATURES: High Visibility
INVESTMENT OFFERING MEMORANDUM 5325 S FORT APACHE RD, LAS VEGAS, NV SPANISH HILLS PLAZA
 702.787.0123 1333 N Buffalo Dr, Ste 120 Las Vegas, NV 89128 www.virtusco.com INVESTMENT OFFERING MEMORANDUM 5325 S FORT APACHE RD, LAS VEGAS, NV 89148 SPANISH HILLS PLAZA Exclusive AdvisorS ROB HATRAK
STANFORD PLAZA EAST FLORIDA AVE HEMET, CA. NICK EARLE License #
 Simon s Fish & Chips Helen Nails Chinese Food Coin Laundry Welch s Shoe & Repair Stanford Street Donut Shop Fast Auto and Payday Loans E. Florida Ave AVAILABILITY Unit # Size 41821 41855 4,064 SF Water
Linden Market. 132nd & W. Dodge Rd., Omaha, NE W. Dodge Rd., Ste 270 Omaha, NE (p)
") Linden Market 132nd & W. Dodge Rd., Omaha, NE 68154 Agent: Dennis Thaemert Phone: 402-502-4706 Email: dthaemert@lernerco.com Agent: Boh Kurylo Phone: 402-502-4707 Email: bkurylo@lernerco.com 10855 W. Dodge
Linden Market 132nd & W. Dodge Rd., Omaha, NE 68154 Agent: Dennis Thaemert Phone: 402-502-4706 Email: dthaemert@lernerco.com Agent: Boh Kurylo Phone: 402-502-4707 Email: bkurylo@lernerco.com 10855 W. Dodge
Demographics for 2020 S Main St, South Jacksonville, Illinois, United States
 Demographics for 2020 S Main St, South Jacksonville, Illinois, United States Population Population Total Population (US Census 2010) 3,200 19,103 24,773 Total Population (Current Year) 3,168 18,852 24,419
Property Information
 LOAN APPLICATION Page 1 of 7 Property Information Street Address City State Zip Purchase Price $ Estimated Property Value $ Requested Loan $ OR Requested LTV % What is the estimated property value based
Independence, MO Data Profile 2015
 , MO Data Profile 2015 5 year American Community Survey (ACS) Jackson County, Missouri Data sources: U.S. Census Bureau, American Community Survey (ACS), 2011 2015 (released December 8, 2016), compared
Tyler Area Economic Overview
 Tyler Area Economic Overview Demographic Profile. 2 Unemployment Rate. 4 Wage Trends. 4 Cost of Living Index...... 5 Industry Clusters. 5 Occupation Snapshot. 6 Education Levels 7 Gross Domestic Product
99TH AVENUE AND GLENDALE AVENUE
 N ATHAN & A SSOCIATES, I NC. 7600 East Doubletree Ranch Road Suite #150 Scottsdale Arizona 85258 Phone: 480.367.0700 Fax: 480.367.8341 www.nathanandassociatesinc.com 99TH AVENUE AND GLENDALE AVENUE S URROUNDING
Rifle city Demographic and Economic Profile
 Rifle city Demographic and Economic Profile Community Quick Facts Population (2014) 9,289 Population Change 2010 to 2014 156 Place Median HH Income (ACS 10-14) $52,539 State Median HH Income (ACS 10-14)
Savannah Agee Direct:
 Demographics for 7071 S Bilbo Rd, Orange, Texas 77632, United States Savannah Agee Direct: 409-833-5055 Population Population Total Population (US Census 2010) 358 4,419 8,486 Total Population (Current
SDs from Regional Peer Group Mean. SDs from Size Peer Group Mean
 Family: Population Demographics Population Entire MSA 602894 Central Cities (CC) 227,818 Outside Central Cities 375,076 Percent of Entire MSA 37.79% Population in CC Percent Change in Population from 1999
SDs from Regional Peer Group Mean. SDs from Size Peer Group Mean
 Family: Population Demographics Population Entire MSA 1187941 Central Cities (CC) 511,843 Outside Central Cities 676,098 Percent of Entire MSA 43.09% Population in CC Percent Change in Population from
SDs from Regional Peer Group Mean. SDs from Size Peer Group Mean
 Family: Population Demographics Population Entire MSA 661645 Central Cities (CC) 247,057 Outside Central Cities 414,588 Percent of Entire MSA 37.34% Population in CC Percent Change in Population from 1999
SDs from Regional Peer Group Mean. SDs from Size Peer Group Mean
 Family: Population Demographics Population Entire MSA 583845 Central Cities (CC) 316,649 Outside Central Cities 267,196 Percent of Entire MSA 54.24% Population in CC Percent Change in Population from 1999
SDs from Regional Peer Group Mean. SDs from Size Peer Group Mean
 Family: Population Demographics Population Entire MSA 1251509 Central Cities (CC) 540,423 Outside Central Cities 711,086 Percent of Entire MSA 43.18% Population in CC Percent Change in Population from
SDs from Regional Peer Group Mean. SDs from Size Peer Group Mean
 Family: Population Demographics Population Entire MSA 1135614 Central Cities (CC) 677,766 Outside Central Cities 457,848 Percent of Entire MSA 59.68% Population in CC Percent Change in Population from
SDs from Regional Peer Group Mean. SDs from Size Peer Group Mean
 Family: Population Demographics Population Entire MSA 591932 Central Cities (CC) 260,970 Outside Central Cities 330,962 Percent of Entire MSA 44.09% Population in CC Percent Change in Population from 1999
SDs from Regional Peer Group Mean. SDs from Size Peer Group Mean
 Family: Population Demographics Population Entire MSA 1100491 Central Cities (CC) 735,617 Outside Central Cities 364,874 Percent of Entire MSA 66.84% Population in CC Percent Change in Population from
SDs from Regional Peer Group Mean. SDs from Size Peer Group Mean
 Family: Population Demographics Population Entire MSA 540258 Central Cities (CC) 198,915 Outside Central Cities 341,343 Percent of Entire MSA 36.82% Population in CC Percent Change in Population from 1999
SDs from Regional Peer Group Mean. SDs from Size Peer Group Mean
 Family: Population Demographics Population Entire MSA 1249763 Central Cities (CC) 691,295 Outside Central Cities 558,468 Percent of Entire MSA 55.31% Population in CC Percent Change in Population from
SDs from Regional Peer Group Mean. SDs from Size Peer Group Mean
 Family: Population Demographics Population Entire MSA 1088514 Central Cities (CC) 272,953 Outside Central Cities 815,561 Percent of Entire MSA 25.08% Population in CC Percent Change in Population from
SDs from Regional Peer Group Mean. SDs from Size Peer Group Mean
 Family: Population Demographics Population Entire MSA 922516 Central Cities (CC) 470,859 Outside Central Cities 451,657 Percent of Entire MSA 51.04% Population in CC Percent Change in Population from 1999
SDs from Regional Peer Group Mean. SDs from Size Peer Group Mean
 Family: Population Demographics Population Entire MSA 687249 Central Cities (CC) 198,500 Outside Central Cities 488,749 Percent of Entire MSA 28.88% Population in CC Percent Change in Population from 1999
SDs from Regional Peer Group Mean. SDs from Size Peer Group Mean
 Family: Population Demographics Population Entire MSA 542149 Central Cities (CC) 181870 Outside Central Cities 360279 Percent of Entire MSA 33.55% Population in CC Percent Change in Population from 1999
SDs from Regional Peer Group Mean. SDs from Size Peer Group Mean
 Family: Population Demographics Population Entire MSA 1025598 Central Cities (CC) 293,834 Outside Central Cities 731,764 Percent of Entire MSA 28.65% Population in CC Percent Change in Population from
SDs from Regional Peer Group Mean. SDs from Size Peer Group Mean
 Family: Population Demographics Population Entire MSA 875583 Central Cities (CC) 232,835 Outside Central Cities 642,748 Percent of Entire MSA 26.59% Population in CC Percent Change in Population from 1999
SDs from Regional Peer Group Mean. SDs from Size Peer Group Mean
 Family: Population Demographics Population Entire MSA 716998 Central Cities (CC) 448,275 Outside Central Cities 268,723 Percent of Entire MSA 62.52% Population in CC Percent Change in Population from 1999
SDs from Regional Peer Group Mean. SDs from Size Peer Group Mean
 Family: Population Demographics Population Entire MSA 1333914 Central Cities (CC) 284,943 Outside Central Cities 1,048,971 Percent of Entire MSA 21.36% Population in CC Percent Change in Population from
SDs from Regional Peer Group Mean. SDs from Size Peer Group Mean
 Family: Population Demographics Population Entire MSA 712738 Central Cities (CC) 448,607 Outside Central Cities 264,131 Percent of Entire MSA 62.94% Population in CC Percent Change in Population from 1999
Local Business Profile All Sectors - Fairfield city, Ohio. Contents. What will I find in this report? My Customers
 Local Business Profile All Sectors -, Contents What will I find in this report? My Customers The My Customers section provides summarized demographic information for,. This information provides a snapshot
SDs from Regional Peer Group Mean. SDs from Size Peer Group Mean. Population Entire MSA
 Family: Population Demographics Population Entire MSA 1169641 Central Cities (CC) 0 Outside Central Cities 1,169,641 Percent of Entire MSA 0% Population in CC Percent Change in Population from 1999 to
SDs from Regional Peer Group Mean. SDs from Size Peer Group Mean
 Family: Population Demographics Population Entire MSA 3251876 Central Cities (CC) 2,078,750 Outside Central Cities 1,173,126 Percent of Entire MSA 63.92% Population in CC Percent Change in Population from
SDs from Regional Peer Group Mean. SDs from Size Peer Group Mean
 Family: Population Demographics Population Entire MSA 1592383 Central Cities (CC) 1,181,140 Outside Central Cities 411,243 Percent of Entire MSA 74.17% Population in CC Percent Change in Population from
SDs from Regional Peer Group Mean. SDs from Size Peer Group Mean
 Family: Population Demographics Population Entire MSA 1776062 Central Cities (CC) 716,793 Outside Central Cities 1,059,269 Percent of Entire MSA 40.36% Population in CC Percent Change in Population from
SDs from Regional Peer Group Mean. SDs from Size Peer Group Mean
 Family: Population Demographics Population Entire MSA 4112198 Central Cities (CC) 416,474 Outside Central Cities 3,695,724 Percent of Entire MSA 10.13% Population in CC Percent Change in Population from
SDs from Regional Peer Group Mean. SDs from Size Peer Group Mean
 Family: Population Demographics Population Entire MSA 9519338 Central Cities (CC) 4408996 Outside Central Cities 5110342 Percent of Entire MSA 46.32% Population in CC Percent Change in Population from
SDs from Regional Peer Group Mean. SDs from Size Peer Group Mean
 Family: Population Demographics Population Entire MSA 1623018 Central Cities (CC) 152397 Outside Central Cities 1470621 Percent of Entire MSA 9.39% Population in CC Percent Change in Population from 1999
SDs from Regional Peer Group Mean. SDs from Size Peer Group Mean
 Family: Population Demographics Population Entire MSA 1731183 Central Cities (CC) 776733 Outside Central Cities 954450 Percent of Entire MSA 44.87% Population in CC Percent Change in Population from 1999
SDs from Regional Peer Group Mean. SDs from Size Peer Group Mean
 Family: Population Demographics Population Entire MSA 2968806 Central Cities (CC) 669,769 Outside Central Cities 2,299,037 Percent of Entire MSA 22.56% Population in CC Percent Change in Population from
SDs from Regional Peer Group Mean. SDs from Size Peer Group Mean
 Family: Population Demographics Population Entire MSA 2846289 Central Cities (CC) 809063 Outside Central Cities 2037226 Percent of Entire MSA 28.43% Population in CC Percent Change in Population from 1999
SDs from Regional Peer Group Mean. SDs from Size Peer Group Mean
 Family: Population Demographics Population Entire MSA 4441551 Central Cities (CC) 1147720 Outside Central Cities 3293831 Percent of Entire MSA 25.84% Population in CC Percent Change in Population from
SDs from Regional Peer Group Mean. SDs from Size Peer Group Mean
 Family: Population Demographics Population Entire MSA 1500741 Central Cities (CC) 661799 Outside Central Cities 838942 Percent of Entire MSA 44.1% Population in CC Percent Change in Population from 1999
SDs from Regional Peer Group Mean. SDs from Size Peer Group Mean
 Family: Population Demographics Population Entire MSA 2552994 Central Cities (CC) 686992 Outside Central Cities 1866002 Percent of Entire MSA 26.91% Population in CC Percent Change in Population from 1999
SDs from Regional Peer Group Mean. SDs from Size Peer Group Mean
 Family: Population Demographics Population Entire MSA 2414616 Central Cities (CC) 764431 Outside Central Cities 1650185 Percent of Entire MSA 31.66% Population in CC Percent Change in Population from 1999
What America Is Thinking On Energy Issues January 2015
 What America Is Thinking On Energy Issues January 2015 South Carolina Offshore Drilling Presented by: Harris Poll Interviewing: January 13-15, 2015 Respondents: 604 Registered Voters Method: Telephone
Urban Action Agenda Community Profiles COVER TO GO HERE. City of Beacon
 Urban Action Agenda Community Profiles COVER TO GO HERE City of Beacon COMMUNITY OVERVIEW MAP POPULATION & DEMOGRAPHICS Population Basics 27,828 Population (2015) Population Change 9.6% since 2000 5.1
Spring Creek. Edmond, Oklahoma COLLETT& ASSOCIATES. 130,000+/- Square Feet Open-Air Shopping Center Development. The Bridges At
 The Bridges At Spring Creek E 15th Street & Bryant Avenue Edmond, Oklahoma 130,000+/- Square Feet Open-Air Shopping Center Development COLLETT& ASSOCIATES SOONER INVESTMENT Commercial & Investment Real
Contact: Larry Hausman (502) Outer Loop, Louisville, KY Knobview Shopping Center
 Outer Loop, Louisville, KY Knobview Shopping Center") 5603-5637 Outer Loop, Louisville, KY 40219 Knobview Shopping Center Jefferson Mall Academy Sports Center SUBJECT Knobview Shopping Center offers a diverse mix of local and national tenants. The center
5603-5637 Outer Loop, Louisville, KY 40219 Knobview Shopping Center Jefferson Mall Academy Sports Center SUBJECT Knobview Shopping Center offers a diverse mix of local and national tenants. The center
2016 Labor Market Profile
 2016 Labor Market Profile Prepared by The Tyler Economic Development Council Tyler Area Sponsor June 2016 The ability to demonstrate a regions availability of talented workers has become a vital tool
Property Information
 IMN DIRECT CAPITAL FUNDING Office: 404-228-5756 Email: cheryl@onesotpfunding.net LOAN APPLICATION Property Information Street Address City State Zip Purchase Price $ Estimated Property Value $ Requested
Lake County. Government Finance Study. Supplemental Material by Geography. Prepared by the Indiana Business Research Center
 County Government Finance Study Supplemental Material by Geography Prepared by the Indiana Business Research www.ibrc.indiana.edu for Sustainable Regional Vitality www.iun.edu/~csrv/index.shtml west Indiana
Home Improvement Loan Application
 Home Improvement Loan Application Submit your application and required documents by email, mail, or hand deliver. Email to: eotero@cityofboise.org Mail to: Boise City HCD Hand deliver: 150 N Capitol Blvd
Executive Summary Offered at $9.2M
 Executive Summary Offered at $9.2M ROYAL COMMERCIAL CORP 611 Market Street Suite 8 Kirkland WA 98033 425-952-4000 www.royalcommercialcorp.com Table of Contents 1. Executive Summary The Offering Investment
APPENDIX 6: CENSUS DATA BURLINGTON, VERMONT
 APPENDIX 6: CENSUS DATA BURLINGTON, VERMONT 2000 CENSUS DATA 2005-2007 AMERICAN COMMUNITY SURVEY Burlington city, Vermont - Fact Sheet - American FactFinder Page 1 of 2 FACT SHEET Burlington
ACS DEMOGRAPHIC AND HOUSING ESTIMATES American Community Survey 1-Year Estimates
 DP05 ACS DEMOGRAPHIC AND HOUSING ESTIMATES 2010 American Community Survey 1-Year s Supporting documentation on code lists, subject definitions, data accuracy, and statistical testing can be found on the
Monte Vista Population, ,744 4,651 4,564 4,467 4,458 4,432 4,451
 1 Monte Vista 4,8 4,7 4,6 4,5 4,4 4,3 4,2 4,1 4,61 4,612 4,61 4,676 Monte Vista, 2-213 4,744 4,651 4,564 4,467 4,458 4,432 4,451 4,418 4,412 4,355 2 21 22 23 24 25 26 27 28 29 21 211 212 213 Year Monte
4520 Madison Avenue, Suite 300 Kansas City, MO rhjohnson.com
 FOR LEASE OLATHE STATION SOUTH 119th Street & I-35 Olathe, Kansas Redevelopment Underway SITE SUMMARY Phenomenal Restaurant & Retail Opportunities Available Positioned in Super Regional Trade Area Anchored
White Pine County. Economic and Demographic Profile, 1999
 TECHNICAL REPORT UCED 99/2000-18 White Pine County Economic and Demographic Profile, 1999 UNIVERSITY OF NEVADA, RENO White Pine County Economic and Demographic Profile, 1999 Study Conducted by: Shawn W.
CHAPTER 3 POPULATION AND ECONOMIC CHARACTERISTICS
 CHAPTER 3 POPULATION AND ECONOMIC CHARACTERISTICS INTRODUCTION Population trends in La Vista and its respective planning jurisdiction serve as valuable indicators of future development needs and patterns
TitleMax INVESTMENT OFFERING. Todd Bunke South Western Avenue Blue Island, IL 60406
 INVESTMENT OFFERING TitleMax 12434 South Western Avenue Blue Island, IL 60406 Todd Bunke 404.964.9048 tbunke@atlantaregroup.com Confidentiality Agreement This is a confidential Memorandum intended solely
Cypress Village, Saint Ann - For Sale
 10835-10993 ST. CHARLES ROCK ROAD SAINT ANN, MO 63074 DETAILS Sale Price Subject To Offer NOI $186,000 Lot Size 18.97 Acres Building Size 239,128 SF Year Built 1985 Renovated 2002 Zoning B2 & C2 PROPERTY
Lake County. Government Finance Study. Supplemental Material by Geography. Prepared by the Indiana Business Research Center
 County Government Finance Study Supplemental Material by Geography Prepared by the Indiana Business Research www.ibrc.indiana.edu for Sustainable Regional Vitality www.iun.edu/~csrv/index.shtml west Indiana
Congressional District Report For the 115th Congress
 Congressional District Report For the 115th Congress Arizona District 6 Honorable David Schweikert (R) May 2017 Report National Association of REALTORS Congressional District Report For the 115th Congress
Congressional District Report For the 115th Congress
 Congressional District Report For the 115th Congress Washington District 5 Honorable Cathy McMorris Rodgers (R) February 2017 Report National Association of REALTORS Congressional District Report For the
TECHNICAL REPORT NO. 11 (5 TH EDITION) THE POPULATION OF SOUTHEASTERN WISCONSIN PRELIMINARY DRAFT SOUTHEASTERN WISCONSIN REGIONAL PLANNING COMMISSION
 THE POPULATION OF SOUTHEASTERN WISCONSIN PRELIMINARY DRAFT SOUTHEASTERN WISCONSIN REGIONAL PLANNING COMMISSION") TECHNICAL REPORT NO. 11 (5 TH EDITION) THE POPULATION OF SOUTHEASTERN WISCONSIN PRELIMINARY DRAFT 208903 SOUTHEASTERN WISCONSIN REGIONAL PLANNING COMMISSION KRY/WJS/lgh 12/17/12 203905 SEWRPC Technical
TECHNICAL REPORT NO. 11 (5 TH EDITION) THE POPULATION OF SOUTHEASTERN WISCONSIN PRELIMINARY DRAFT 208903 SOUTHEASTERN WISCONSIN REGIONAL PLANNING COMMISSION KRY/WJS/lgh 12/17/12 203905 SEWRPC Technical
Washington, DC. HFA Performance Data Reporting- Borrower Characteristics
 HFA Performance Data Reporting- Borrower Characteristics QTD Cumulative 1 Unique Borrower Count 2 Number of Unique Borrowers Receiving Assistance 19 767 3 Number of Unique Borrowers Denied Assistance 5
What America Is Thinking Access Virginia Fall 2013
 What America Is Thinking Access Virginia Fall 2013 Created for: American Petroleum Institute Presented by: Harris Interactive Interviewing: September 24 29, 2013 Respondents: 616 Virginia Registered Voters
TABLE 1. PROFILE OF GENERAL DEMOGRAPHIC CHARACTERISTICS
 Waterloo city, Iowa TABLE 1. PROFILE OF GENERAL DEMOGRAPHIC CHARACTERISTICS Estimate Lower Bound Upper Bound Total population 66,659 64,093 69,225 SEX AND AGE Male 32,096 30,415 33,777 Female 34,563 33,025
ACS DEMOGRAPHIC AND HOUSING ESTIMATES American Community Survey 1-Year Estimates
 DP05 ACS DEMOGRAPHIC AND HOUSING ESTIMATES 2012 American Community Survey 1-Year Estimates Supporting documentation on code lists, subject definitions, data accuracy, and statistical testing can be found
ECONOMIC OVERVIEW DuPage County, Illinois
 ECONOMIC OVERVIEW DuPage County, Illinois DEMOGRAPHIC PROFILE... 3 EMPLOYMENT TRENDS... 5 UNEMPLOYMENT RATE... 5 WAGE TRENDS... 6 COST OF LIVING INDEX... 7 INDUSTRY SNAPSHOT... 8 OCCUPATION SNAPSHOT...
PRIME COMMERCIAL LAND FOR SALE
 PRIME COMMERCIAL LAND AVENUE P-4 & 5 TH STREET WEST OUTSTANDING HWY. 14 EXPOSURE COMING SOON TRADE & COMMERCE CENTER HEART OF S RETAIL & BUSINESS CORRIDOR The depiction in the included photograph of any
Patrick Hammond. Dollar General Moselle, MS DISCLOSURE :
 2 1 1 0 H i g h w a y 1 1, M o s e l l e, M S O n l i n e M a p O F F E R I N G M E M O R A N D U M DISCLOSURE : All materials and information received or derived from Fortis Net Lease (hereinafter collectively